directions for wind industry in massachusetts - worcester
TRANSCRIPT

Directions for Wind Industry in Massachusetts
October 14, 2011
An Interactive Qualifying Project: submitted to the faculty of
WORCESTER POLYTECHNIC INSTITUTE
In the partial fulfillment of the
Degree of Bachelor of Science
Submitted by:
Erin Dolan
Alexander Segala
Elizabeth Veracka
Faculty Advisors:
Professor Holly Ault
Professor James Hanlan
This report represents the work of three WPI undergraduate students submitted to the faculty as
evidence of completion of a degree requirement. WPI routinely publishes these reports on its
web site without editorial or peer review. The opinions expressed herein are those of the student
authors and do not reflect the policies or views of the sponsoring agency or its staff.
41-HXA-B115

i
Abstract:
Over the last decade, the wind energy industry has experienced many changes. The goal
of this Interactive Qualifying Project was to conduct a technology roadmap analysis to assess the
past development and potential future trends of the wind industry. A technology roadmap
revealed the areas to focus improvements on and the gaps that existed within specific turbine
component fields. The project focused on the blades, drive train and tower of a utility scale
horizontal wind turbine. The improvements in these fields need to be focused on new materials,
design, and computational models. In conclusion, we recommend the promotion of collaboration
between the different sectors of the wind industry and to improve computational modeling of the
wind turbine components.

ii
Executive Summary
The burning of fossil fuels has many consequences in today‘s world. Pollution and global
climate change as well as using up these finite amounts of fuel are all issues which society needs
to face. Alternative energy sources may help ameliorate these problems. Many countries around
the world have begun to use renewable energy sources to help supply energy. In many cases,
wind power has become a feasible solution to the energy crisis. Although wind turbines have
begun to appear in the United States, wind generation only accounts for approximately 3% of the
country‘s total electrical generation (DOE, 2011).
There are many factors to consider when answering the general question of how to make
wind power a more viable electrical source in the US. Many different circumstances have
retarded the growth of wind power in America. An outdated grid, still relatively cheap fossil
fuels, and the lack of a domestic industry to support such projects are all factors of wind
generation‘s slow growth. One part of the country has seen especially slow growth in wind
power, and that is the northeast. One important piece to the supply chain responsible for the
wind power industry is the production of the wind harvesting turbines. Much of the equipment
supplied to domestic wind farms is manufactured by companies that are located outside of the
United States (Logan, 2008).
Massachusetts has been at the forefront in many high technology fields, and is in an
excellent position to play an important role in bringing wind power to more of the United States.
The Commonwealth, with its abundance of higher educational institutions as well as its cutting
edge laboratories, is an ideal location for the research and development of new wind power
iii
technologies that will build the wind farms of tomorrow. Companies within the Commonwealth
are already actively working towards this goal.
The goal of this project was to determine trends evident in the wind power industry in the
United States. From these trends, predictions were made as to what position in the growing wind
power industry the Commonwealth of Massachusetts could play. This has been done by
studying successful wind power industries around the world and identifying the parts of the
supply chain needed to facilitate new wind projects. The team has created a technology roadmap
for the wind industry in the United States. This roadmap was completed both for the wind
turbine as a whole as well as individually for key components within a wind turbine, such as the
drive train, rotor, and tower. The period of time examined spanned from 2000 through 2010.The
team was then able to compare the trends discovered from this analysis to the current technology
and make predictions to possible future areas of growth in the industry.
Several trends were witnessed during this research. Data showed a continuous growth in
rotor diameter and hub height of wind turbines for both onshore and offshore installations.
Trends also showed a potential constraint to the physical scale of onshore turbines as the
diameter and height of conventional designs have reached an upper bound due to transportation
limitations. The team also tracked a growth in average capacity per turbine installed over the
past several years. This trend correlates closely to that of the physical size of turbines.
The wind turbine was then broken down into five main components and examined on the
basis of cost for each part. It was clear that the most costly components were the gearbox, tower,
and rotor. Further research into each component revealed the technological changes over the
past decade. The gearbox and drive train have been plagued by poor reliability, a problem that is
iv
being solved through the emerging technology of gearless direct drive systems. As hub height
increases, towers have increased in both size and cost. This has led to additional obstacles in
transportation. Promising technology in new materials, and modular construction using smaller,
lighter parts could alleviate these problems. Rotor blades have continued to grow in order to
harvest more wind, but have now reached a point where current design technology is
approaching its limits. New computational models backed by experimental data drawn from new
self-monitoring blades and extensive testing could potentially help turbine blades continue to
grow in size and reduce the cost of manufacturing.
Following careful examination of the entire industry in the United States, the team has
defined the following recommendations to improve the Commonwealth of Massachusetts‘ role in
this growing market. The accuracy of current computational models must be improved through
the comparison to experimental data. This will allow improved efficiency of individual wind
turbine blades as well as entire wind farms. Improved models come from extensive testing of
current blades and technologies. Massachusetts is currently home to the newest and biggest
wind turbine blade testing facility in the world and thus is well positioned to be at the forefront in
new blade development. A common thread of communication must be established to help
reduce the amount of overlap in efforts being made by researchers in academia and industry.
This will help consolidate efforts and knowledge to propel the industry forward. This could be
done through organizing consortiums, forums, and other such events where the brightest minds
in the areas of research and development are given an opportunity to share ideas. Collectively
Massachusetts can be a key player in helping focus the intellectual power needed to continue the
development of the United States wind industry.

v
Acknowledgements
We would like to thank the people we consulted, who took time out of their day to talk to
us, and whose knowledge was essential to the completion of our project. We thank Holly Ault,
Bill Follet, James Hanlan and Jerome Schaufeld.
Our thanks also go to Patrick Drane who allowed for us to go to the Wind Energy
Workshop at the University Massachusetts at Lowell. Attendance at this conference was vital in
the completion of our project. We gained invaluable information and contacts. Similarly, we
would like to thank NSF for the grant that allowed for us to travel to and attend the workshop.
vi
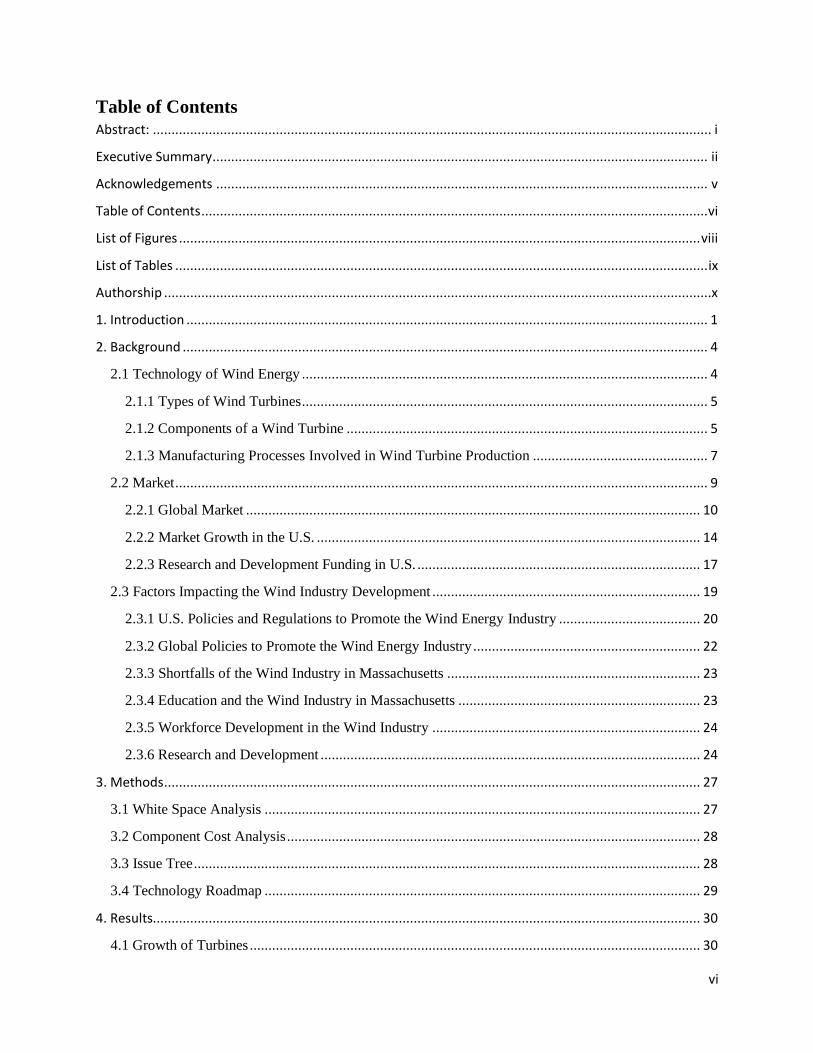
Table of Contents
Abstract: ...................................................................................................................................................... i
Executive Summary..................................................................................................................................... ii
Acknowledgements .................................................................................................................................... v
Table of Contents ........................................................................................................................................ vi
List of Figures ............................................................................................................................................ viii
List of Tables ............................................................................................................................................... ix
Authorship ...................................................................................................................................................x
1. Introduction ............................................................................................................................................ 1
2. Background ............................................................................................................................................. 4
2.1 Technology of Wind Energy ............................................................................................................. 4
2.1.1 Types of Wind Turbines ............................................................................................................. 5
2.1.2 Components of a Wind Turbine ................................................................................................. 5
2.1.3 Manufacturing Processes Involved in Wind Turbine Production ............................................... 7
2.2 Market ............................................................................................................................................... 9
2.2.1 Global Market .......................................................................................................................... 10
2.2.2 Market Growth in the U.S. ....................................................................................................... 14
2.2.3 Research and Development Funding in U.S. ............................................................................ 17
2.3 Factors Impacting the Wind Industry Development ........................................................................ 19
2.3.1 U.S. Policies and Regulations to Promote the Wind Energy Industry ...................................... 20
2.3.2 Global Policies to Promote the Wind Energy Industry ............................................................. 22
2.3.3 Shortfalls of the Wind Industry in Massachusetts .................................................................... 23
2.3.4 Education and the Wind Industry in Massachusetts ................................................................. 23
2.3.5 Workforce Development in the Wind Industry ........................................................................ 24
2.3.6 Research and Development ...................................................................................................... 24
3. Methods ................................................................................................................................................ 27
3.1 White Space Analysis ..................................................................................................................... 27
3.2 Component Cost Analysis ............................................................................................................... 28
3.3 Issue Tree ........................................................................................................................................ 28
3.4 Technology Roadmap ..................................................................................................................... 29
4. Results................................................................................................................................................... 30
4.1 Growth of Turbines ......................................................................................................................... 30
vii
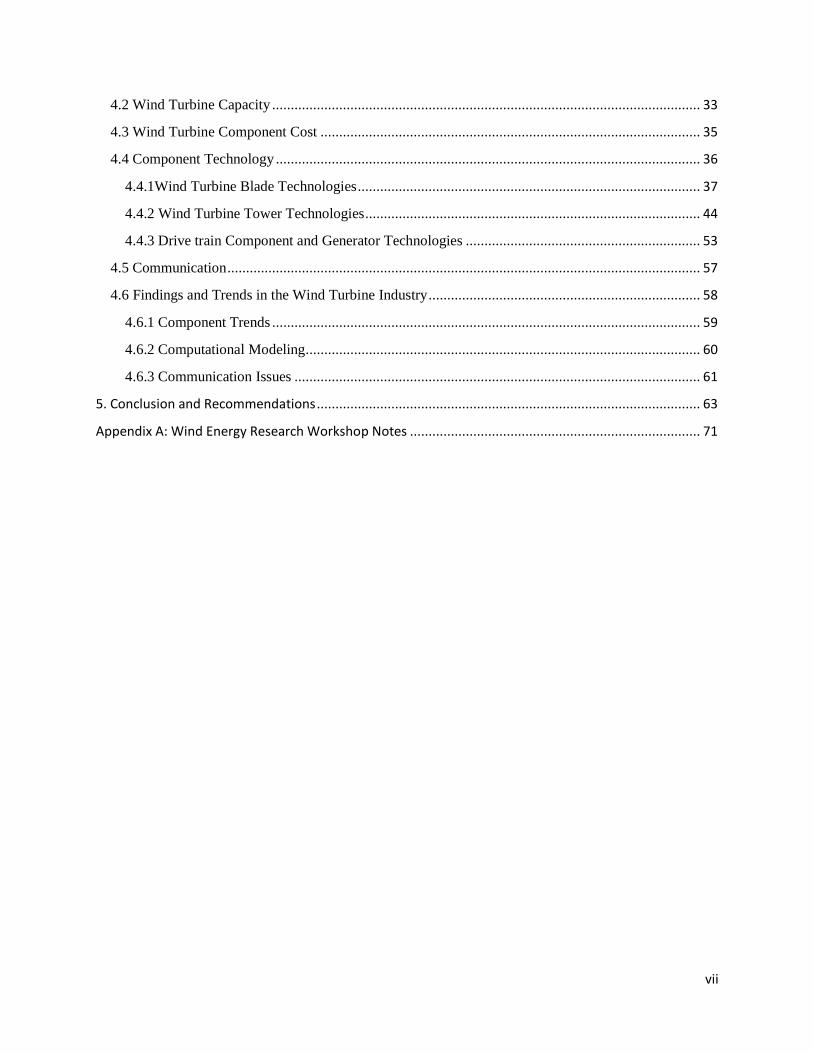
4.2 Wind Turbine Capacity ................................................................................................................... 33
4.3 Wind Turbine Component Cost ...................................................................................................... 35
4.4 Component Technology .................................................................................................................. 36
4.4.1Wind Turbine Blade Technologies ............................................................................................ 37
4.4.2 Wind Turbine Tower Technologies .......................................................................................... 44
4.4.3 Drive train Component and Generator Technologies ............................................................... 53
4.5 Communication ............................................................................................................................... 57
4.6 Findings and Trends in the Wind Turbine Industry ......................................................................... 58
4.6.1 Component Trends ................................................................................................................... 59
4.6.2 Computational Modeling.......................................................................................................... 60
4.6.3 Communication Issues ............................................................................................................. 61
5. Conclusion and Recommendations ....................................................................................................... 63
Appendix A: Wind Energy Research Workshop Notes .............................................................................. 71

viii
List of Figures FIG. 2. 1 BASIC HAWT COMPONENTS (HOWSTUFFWORKS.COM, 2006) .................................................................... 6
FIG. 2. 2 BASIC VAWT COMPONENTS (HOWSTUFFWORKS.COM, 2006) .................................................................... 7
FIG. 2. 3 TOP 15 WIND TURBINE ORIGINAL EQUIPMENT MANUFACTURERS' MAJOR MARKET PRESENCE, 2008
(KIRKEGAARD, 2009, P. 44) ............................................................................................................................. 11
TABLE 2. 1 GLOBAL TRADE IN WIND TURBINES 2008 (KIRKEGAARD, 2009, P. 40) .................................................... 12
FIG. 2. 4 GREENFIELD INVESTMENTS IN WIND TURBINE PRODUCTION 2003-2009 (KIRKEGAARD, 2009, P. 44) ....... 14
FIG. 2. 5 ANNUAL AND CUMULATIVE GROWTH IN U.S. WIND POWER CAPACITY (WISER, ET AL., 2010, P. 12) ........ 15
FIG. 2. 6 RELATIVE CONTRIBUTIONS OF GENERATION TYPES IN ANNUAL CAPACITY ADDITIONS (WISER, ET AL., 2010,
P. 14) ............................................................................................................................................................. 16
FIG. 2. 7 ENERGY R&D EXPENDITURE (HARBORNE & HENDRY, 2009, P. 3585) ........................................................ 18
FIG. 2. 8 APPROXIMATE EUROPEAN R&D INVESTMENT IN WIND ENERGY FROM INDUSTRY AND PUBLIC SECTORS
(SETIS, 2009) .................................................................................................................................................. 19
TABLE 2. 2 CLEAN ENERGY STATE LEADERSHIP SCOREBOARD (CLEAN EDGE, INC., 2010, PG. 3) .............................. 20
FIG. 4.1 AVERAGE ROTOR DIAMETER AND HUB HEIGHT ......................................................................................... 31
FIG. 4.2 AVERAGE CAPACITY FACTOR BY TURBINE SIZE ........................................................................................... 32
FIG. 4.2 AVERAGE TURBINE NAMEPLATE CAPACITY (EWEA, AWEA, DOE, BERKLEY LABS) ....................................... 34
FIG. 4.3 PERCENT COST OF WIND TURBINE ............................................................................................................. 35
FIG. 4.4 WIND TURBINE BLADE CROSS SECTION (WINDFLOW TECHNOLOGY, 2011) ................................................ 37
FIG. 4.5 WIND TURBINE BLADE LAY UP (NEWENERGYNEWS, 2011) ........................................................................ 40
FIG. 4.6 WIND TURBINE IN ROBOTIC FINISHING AND PAINT (WIND SYSTEMS, 2011) .............................................. 41
FIG. 4.7 EMBEDDED SENSOR INSTALLATION IN TURBINE BLADES (SANDIA, 2011) .................................................. 41
FIG. 4.8 TURBINE BLADE STATIC TESTING (EWEA, 2011) ......................................................................................... 43
FIGURE 4.9: TRANSPORTING A TOWER SEGMENT (LEE WIND ENERGY, 2011) ......................................................... 44
FIGURE 4.10: HYBRID TOWER (ADVANCED TOWER SYSTEMS, 2011) ....................................................................... 45
TABLE 4.1 TOWER FOUNDATION MATERIALS (CES EDUPAC, 2011) ......................................................................... 46
FIG. 4.11 SHELL TOWER (ANDERSEN TOWERS, 2011) .............................................................................................. 47
TABLE 4.2 TOWER MATERIAL COSTS (CES EDUPAC, 2011) ...................................................................................... 48
FIG. 4.12 FIBERGLASS TOWER ................................................................................................................................. 49
FIG. 4.13 CARBON FIBER TOWER ............................................................................................................................ 50
FIG. 4.14 HYBRID MULTI-ELEMENT TAPERED ROTATING TOWER (ZUTECK, 2009) ................................................... 51
FIG. 4.15 BALLOON TURBINE (MAGENN POWER, 2011) .......................................................................................... 52
FIG. 4.16 MAGLEV TURBINE (MAGLEV WIND TURBINE TECHNOLOGY, 2004) .......................................................... 53
FIG. 4.17 CONVENTIONAL GEARBOX DRIVE TRAIN CONFIGURATION (DEPARTMENT OF ENERGY, 2010)................. 54
FIG. 4.18 PERMANENT MAGNET DRIVE TRAIN CONFIGURATION (NORTHERN POWER SYSTEMS, 2009) .................. 56
FIG. 4.19 TIMELINE OF COMPONENT TECHNOLOGIES ............................................................................................. 59

ix
List of Tables TABLE 2. 1 GLOBAL TRADE IN WIND TURBINES 2008 (KIRKEGAARD, 2009, P. 40) .............................. 112
TABLE 2. 2 CLEAN ENERGY STATE LEADERSHIP SCOREBOARD (CLEAN EDGE, INC., 2010, PG. 3) 2020
TABLE 4.1 TOWER FOUNDATION MATERIALS (CES EDUPAC, 2011) .................................................... 4646
TABLE 4.2 TOWER MATERIALS (CES EDUPAC, 2011)............................................................................... 4848
x
Authorship
Section # Section Title Primary Author (s) Primary Editor (s)
Abstract Elizabeth Elizabeth
Acknowledges Erin Erin
Executive Summary Alexander Alexander
1 Introduction Alexander Alexander
2 Background All All
2.1 Technology of Wind
Energy
Alexander Alexander
2.2 Market Erin Erin
2.3 Factors Impacting the
Wind industry
Elizabeth Elizabeth
3 Methodology Elizabeth, Erin Erin
4 Results All All
4.1 Hub Height and Rotor
Diameter
Erin Erin
4.2 Capacity Elizabeth Elizabeth
4.3 Component Percent
Cost
Alexander Alexander
4.4.1 Blade Technology Alexander Alexander
4.4.2 Tower Technology Erin Erin
4.4.3 Drive Train
Technology
Elizabeth Elizabeth
4.4.4 Communications Elizabeth Alexander
4.4.5 Findings Elizabeth, Erin Elizabeth, Alexander
5 Conclusions and
Recommendations
Erin, Elizabeth Elizabeth
References Alexander Alexander
Appendix A Elizabeth, Alexander Erin

1
1. Introduction
The demand for sustainable alternative energy has grown dramatically in recent years. A
technology such as wind power, once reserved for cutting edge scientific communities, has been
brought to the main stage of our society and economy. The mountains of the Northeast as well
as the western plains have found themselves home to this new and exciting technology, and are
being used to harvest the wind in order to supply our country with much needed clean energy.
An important factor in making wind power a common reality in the U.S. is to manufacture and
install the wind turbines using domestically produced technology. This will help ease our energy
crisis as well as aid in the growth of domestic manufacturing. European successes have
demonstrated the viability of this model. In both Europe and Asia, many energy companies have
adjusted to meet the technological needs of harvesting wind power. European countries are
increasingly becoming the location of successful wind farms, largely due to the existence of a
domestic industry capable of producing the needed components.
Wind power can only be fully realized in the US after the industry is here to support its
development. In the Northeast, governmental policies and regulations have begun to create an
attraction, via tax credits and incentives, for wind power companies to move to the region. The
Massachusetts Clean Energy Center (Mass CEC) is working as a focal point to draw all of the
necessary industrial resources together to make Massachusetts a center for wind power
technology (Massachusetts Clean Energy Center, 2011). This vision of making Massachusetts a
leader in the wind power industry could benefit the Commonwealth greatly. Wind power could
become a cost effective source of clean energy. Massachusetts would gain economically and
technologically as well as increasing the number of jobs within the Commonwealth. Ideally the

2
Mass CEC would like to support a complete wind-power generation supply chain in
Massachusetts and additionally would like to promote Massachusetts as an exporter for the
technology involved in wind power generation. This vision has not yet become a reality.
Sixty-four percent of the cost of a wind farm comes from manufacturing the turbines and
installing them (Henderson, 2003). Without a domestic U.S. industry, a majority of the cost of
installing a wind farm benefits foreign companies. Foreign production increases both installation
time and cost due to the necessity of shipping the components long distances. Massachusetts
could potentially be a prime location for the development of a wind power industry. Many high
tech companies that could become part of the necessary supply chain are already located in
Massachusetts. These companies have experts in construction, power transmission, and energy
management. In Denmark, Vestas (a wind turbine producer), which was created to facilitate the
growth of wind power locally, now supplies the rest of the European and world market,
reportedly exporting 99% of the turbines they built in 2004 (Lewis, 2007). By developing a
wind power industry in Massachusetts, the Commonwealth could help facilitate its own wind
energy projects as well as develop the industry‘s capacity and technology for a broader, regional
or national marketplace.
The Massachusetts Clean Energy Center has set the goal of bringing the wind power
industry to the Commonwealth of Massachusetts, which means having key components of the
supply and value chain within the state. The wind energy industry has many separate and divided
factors. From this understanding it was determined where individual improvements would
benefit the entire industry the most. Additionally, Massachusetts has the potential to become a
competitive participant in the wind power industry but the specific reasons why the wind power

3
industry should be drawn to Massachusetts are not clear. Once the potential of Massachusetts as
a base for the wind power industry has been demonstrated, the process of establishing a full
supply and value chain could be achieved.
The goal of this project was to make recommendations as to the future steps needed to
further the U.S. wind industry. These recommendations were focused on and targeted towards
the Commonwealth of Massachusetts and its potential role in the wind industry. To reach this
goal, the project team identified the following objectives. The first is to identify the elements that
contribute to the supply and value chains of the wind power industry. The second is to examine
the past ten years of the technology behind the wind energy industry. From this examination, the
team discovered trends in the technology. After analyzing these trends, educated predictions
were made forecasting the focus of future growth in the wind energy industry. The team also
created a technology roadmap in order to closely examine the current and emerging technologies
of wind turbines. This project holds a great deal of potential for the Commonwealth of
Massachusetts. It could pave the way for a new industry in the regional economy. This industry
could bring more jobs to the area as well as make significant steps towards bringing an increase
in the use of wind power to Massachusetts and the United States.

4
2. Background
The wind power industry is a multifaceted and complex business. Drawing from many
sources in different industries, wind energy is in fact an amalgamation of different markets,
technologies and companies. To demonstrate the diversity of the wind industry, this section of
the report is divided into four sections explaining the technology of wind turbines, the wind
industry market, industrial development, and research and development in this field. These
sections cover the technology of the wind industry and the markets involved. Also covered are
the factors affecting development of a wind industry such as education and policies, as well as a
section taking a closer look into research and development in this market sector. These topics
were chosen to provide an understanding of the status of the global wind industry, as well as the
details and methods used to facilitate the industry‘s success.
2.1 Technology of Wind Energy
Harvesting the wind‘s energy for practical use is not a new idea (Dodge, 2006). The first
windmills appeared well over 700 years ago and were used to pump water and grind grain. Since
then the technology of wind mills has changed dramatically. Heavy brick and stone structures
have been replaced by steel towers. The blades, once commonly made of wood and canvas,
similar in construction to that of a ship‘s sail, are now made of advanced glass and polymer
composites. As the technology has improved, the manufacturing processes have improved along
with it, resulting in the evolution of newly designed components and new types of wind turbines.

5
2.1.1 Types of Wind Turbines
In the simplest terms, wind turbines can be broken down into two groups. Horizontal
axis wind turbines (HAWTs) and vertical axis wind turbines (VAWTs) (Riegler, 2003). As the
names suggest, the difference between the two designs is the orientation of the axis on which the
blades rotate. Both designs have advantages as well as disadvantages. VAWTs are not
dependent on wind direction and are easier to maintain, but are comparatively more expensive
than HAWTs. HAWTs require more maintenance than VAWTs but are less expensive to build
and are more universally applicable than VAWTs (Ancona & McVeigh, 2001). Although
HAWTs generating more than 1 megawatt of electricity now hold the majority of today‘s market
share, new technologies are emerging. Smaller turbines are becoming more available to the
general public due to the affordability that their smaller size brings. The market share for
smaller wind turbines is undergoing growth as the general public becomes more familiar with
these technologies.
2.1.2 Components of a Wind Turbine
Although details vary from turbine to turbine, all HAWTs have the same general
components (Ancona & McVeigh, 2001). A basic diagram is presented in Figure 2.1. The rotor,
made up of the blades and the hub, harvests the energy from the wind. The nacelle is the
common name for the case or body of the turbine. It is located directly behind the rotor and
houses the gearbox and generator. The hub turns the main drive shaft that is connected through a
transmission to the generator. All of these components are mounted high off the ground on top
of a tower. A small drive assembly within the top of the tower (not shown) allows the nacelle to
turn to face the hub into the wind to most effectively produce electricity.

6
Fig. 2. 1 Basic HAWT Components (HowStuffWorks.com, 2006)
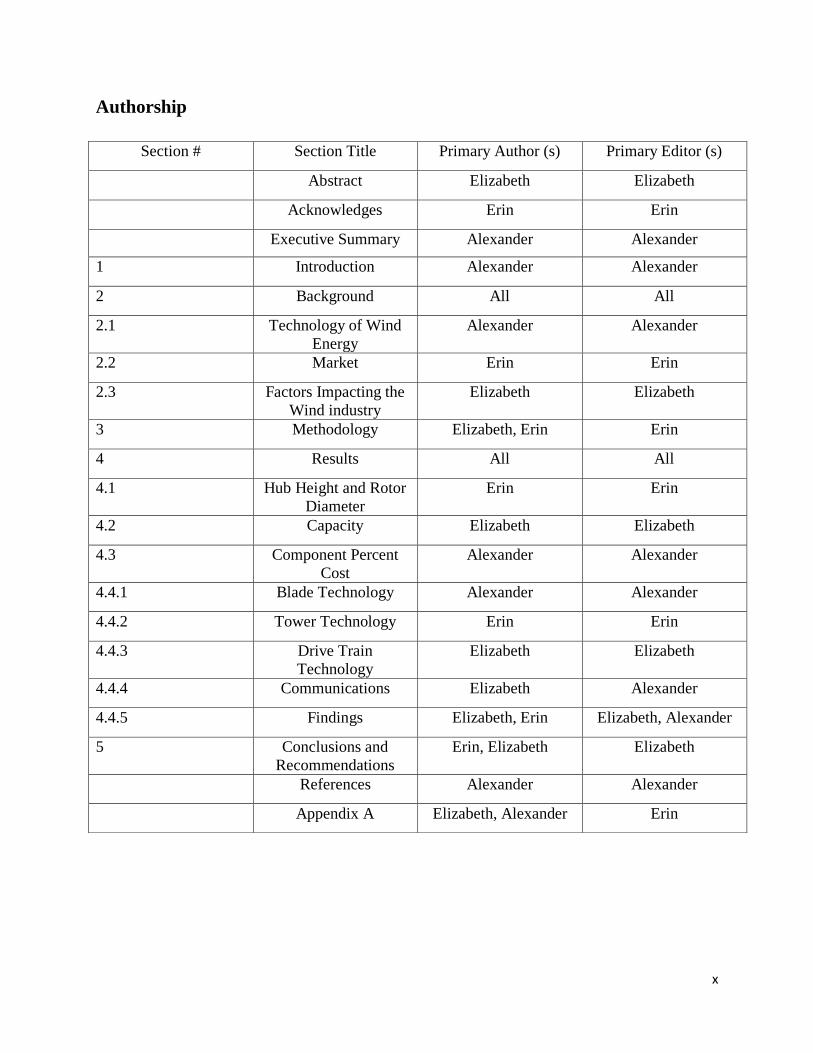
VAWTs also share a common design. As the name suggests, the axis of the turbine is
mounted vertically (Riegler, 2003). As figure 2.2 shows, a vertical axle supports upper and
lower hubs which connect to the blades. The lower hub is connected to a generator via a
gearbox, all of which is housed at ground level directly under the turbine. Depending on the size
of the turbine, there may be a guy wire system to help support the top of the axle and keep the
turbine perpendicular to the ground.
7
Fig. 2. 2 Basic VAWT Components (HowStuffWorks.com, 2006)
2.1.3 Manufacturing Processes Involved in Wind Turbine Production
Many evolving technologies play a role in the construction of a wind turbine. A key
example of this is in the construction of the blades. There are currently several materials in use
by different companies in the field (Veers, 2004). Often, the blades are made of fiberglass
composites with a small amount of steel used where the blades connect to the hub. Carbon fiber
composites are an attractive class of materials for blade construction but, due to the current high
costs, it isn‘t a realistic replacement for fiberglass. To get the best of both worlds, numerous
companies supplement their fiberglass blades with strategically placed carbon fibers to
strengthen them.

8
The processes by which the blades are manufactured also vary from one company to the
next. Some companies use a hand laying of fiberglass on an open wet mold to build blades.
This is performed by placing sheets of fiberglass on a preexisting mold made to fit the shape of
the desired blade. Once the sheets are located on the mold, resin is brushed onto the sheets and
allowed to harden. While this process is time consuming and labor intensive, it has relatively
low equipment costs.
Another process used is vacuum-assisted resin transfer molding (VARTM) (Acheson,
2004). This is performed by placing the fibers into the mold much like the hand laying method.
The entire mold is then encased in a vacuum bag and the proper amount of resin is added to the
process. A strong vacuum is then applied to the entire assembly forcing the resin into the fibers
both thoroughly and evenly. Compared to the hand laying method, VARTM is less labor
intensive, but requires a higher capital investment for equipment.
Other components of the wind turbine are far less specialized to fabricate. One important
component is the gearbox. The gearbox allows the relatively slow spinning blades to turn the
generator at a higher speed, making more electricity (Henderson, 2003). The first gear train is a
system of planetary gears, while the second and third steps are distinct trains of parallel helical
gears. All of these components can be manufactured using standard industrial procedures. The
casing is created through various forms of casting, while the components inside are made using
standard machining methods.
The generator and support structure technology used in wind turbines is advancing to
feed the growing industry (Muller, 2002). The biggest leap forward is in making the generators
able to handle variation in rotation speed while still producing a more constant energy output.

9
This advancement may lead to the obsolescence of the multistage gearboxes mentioned earlier.
New methods of controlling blade rotation speed in reference to wind speed are also being
pioneered through generator technology. As the product evolves, the manufacturing technology
currently in place is capable of adapting to small changes as needed. Collectively these two
advances are simplifying the machinery in the nacelle, making it less expensive to produce and
significantly lighter as well.
This leads to a discussion of the tower of the wind turbine, which does not exist in the
standard design of a VAWT, but is a significant consideration when looking at HAWTs (Ancona
&McVeigh, 2001). In years past the towers were commonly constructed of steel, but they are
now moving towards being constructed from new materials, such as pre-stressed concrete. This
offers a significant reduction in cost, as well as increasing the towers‘ resistance to the elements,
especially in corrosive environments such as those faced by offshore wind turbines. Once again,
this is simply a new application of previously developed manufacturing technologies. This ease
of production due to the reuse and reformatting of past abilities helps companies worldwide to
participate in the development of this field.
2.2 Market
The wind power industry is currently experiencing a time of growth within the United
States and the world as a whole (Wiser, et al., 2006, p. 3). In combination with advances in
technology, there has been an overall expansion in the industry over the past 10 years. This
growth has translated into global integration via cross-border trade and investment flows, which
in turn aids in advancing wind technologies (Kirkegaard, 2009, p.10).

10
2.2.1 Global Market
Global integration reduces the cost of wind technologies by increasing economies of
scale, encouraging competition, and fostering innovation (Kirkegaard, 2009, p.10). Standard
cross-border trade as the dominant means to globalization is gradually leading to total global
integration via multinational company investment flows called foreign direct investment (FDI).
The number of wind turbine producers is growing because more countries are participating in the
wind power market as global suppliers. Also, regional markets and production centers are
emerging.
The global wind power equipment industry is considerably concentrated. In 2008, the
top 15 largest wind turbine producers accounted for 95 percent of supplied capacity (Kirkegaard,
2009, p.11). This market presence is demonstrated in Figure 2.3. European firms dominate the
global wind turbine market with eight out of the 15 top firms. These eight firms make up almost
60 percent of the world market share. Interestingly, although the three dominant Chinese
companies only supply their domestic market, they are capitalizing on the strong and rapid
growth of installed wind power capacity in China. Similarly, the U.S. national producer, GE
Wind, relies almost exclusively (90%) on its domestic U.S. market; however, they have almost
surpassed the global market leader, Vestas, in total market share. Figure 2.3 also demonstrates
the importance of a large domestic market for wind turbine producers because 13 out of the top
15 companies are located in the five countries with the most installed cumulative capacity in
2008: United States, Germany, Spain, China, and India.

11
Fig. 2. 3 Top 15 Wind Turbine Original Equipment Manufacturers' Major Market Presence, 2008
(Kirkegaard, 2009, p. 44)
From the four top companies that are local to developing nations, such as India and
China, Kirkegaard concluded that, for domestic wind turbine suppliers to emerge, there must be
a sufficiently large domestic market (2009, p.11). This is evident because Chinese wind turbine
manufacturers have thus far exclusively relied on their domestic market for growth and India‘s
Suzlon has also dominated its domestic market. However, Suzlon has also expanded on a global
scale via investments in other countries.
With only 15 producers accounting for the majority of the supplied capacity, firms often
use cross-border investment (Kirkegaard, 2009, p.13). Table 1 shows the global imports and
exports in U.S. dollars. Germany, Denmark, India, and Japan account for 90 percent of the total
global exports. The U.S. was the largest importer in 2008 and imported 85 percent from

12
Denmark, Spain, Japan, and Germany. For China, its domestic focus is evident by its limited
amount of exports in 2008.
Table 2. 1 Global Trade in Wind Turbines 2008 (Kirkegaard, 2009, p. 40)

13
As an industry with about $50 billion in total sales and $51.8 billion in investment in
2008, the global trade magnitudes was relatively low (Kirkegaard, 2009, p.14). This is
understandable because of the high cost of transportation and the need for special transportation
equipment. Global annual installed wind capacity rose about 75 percent from about 15,000MW
in 2006 to 27,000MW in 2008 and global wind turbine exports rose by about 50 percent from
$3.19 billion in 2006 to $4.85 billion in 2008. This shows that, during this time, the global
cross-border trade industry trade intensity fell about a third. This decline in cross-border trade in
the wind industry means there was an increase in the share of local content produced by domestic
and foreign-owned firms. The cause of this increase can be attributed to new domestic-only
producers, such as China, and the rapidly increasing number of Foreign Direct Investments (FDI)
by the leading manufacturers in new and emerging wind power markets. The rapidly rising levels
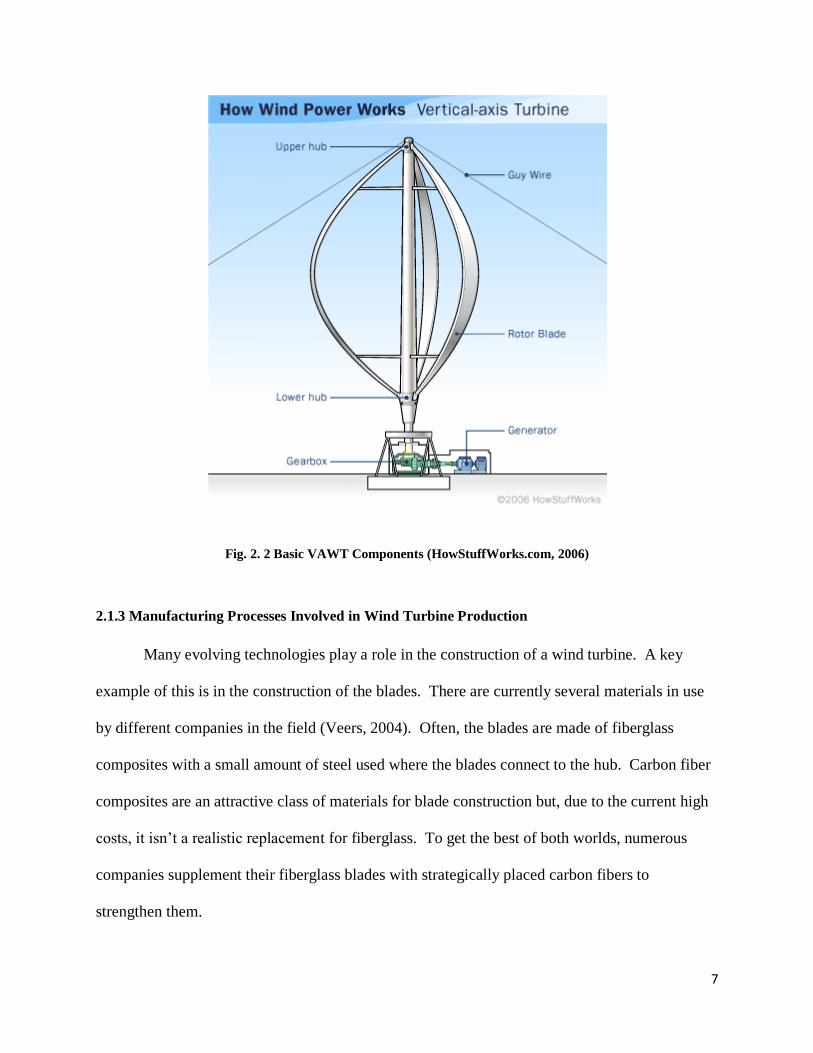
of FDIs are demonstrated in Figure 2.4. The figure shows the breakdown of Greenfield
investments1 that were related to wind turbine production. Included in this figure are investments
from nine of the top 15 companies. The figure includes domestic investments across state and
provincial lines, focused on wind turbine investment flows into or within the European Union.
These investments created approximately 20,000 jobs. Wind turbine investment flows into or
within the U.S. in 2007 and 2008 grew to about $1 billion annually (p.15).
1 Greenfield investments are a type of FDI in which a parent company starts a new operational facility in a foreign country, which will create new long-term jobs in that foreign country.
14
Fig. 2. 4 Greenfield Investments in Wind Turbine Production 2003-2009 (Kirkegaard, 2009, p. 44)
2.2.2 Market Growth in the U.S.
Investment and growth in the wind industry are influenced by many factors including tax
incentives. More specifically, as Wiser, et al. (2006) point out, during the years between1999 and
2004, the U.S. wind market had spurts of growth because the federal tax credit (PTC), intended
to provide a market push, was sporadically extended. This irregular growth became steadier in
2006 with two consecutive years of significant growth (p.4). This growth was spurred on by
several factors such as incentives, either federal tax or otherwise, diminishing fossil fuel
resources and their increasing cost, and increasing energy demand. Given this situation and the
fact that federal tax incentives for wind energy have been extended through 2012, it is reasonable
to assume market stability (Wiser & Bolinger, 2010, p.13). Despite the promotion of the wind
power industry via incentives, a depressed economy and decreased prices of wholesale electricity

15
and demand for clean energy will predictably contribute to a slowed development of the wind
power market (Wiser et al, 2008, p.13).
Although, there have been obstacles, the wind power industry is still growing and
advancing. The growing market is exemplified by the fact that the U.S. cumulative wind capacity
grew on average 30% per year between 1999 and 2009. (Wiser, et al., 2010, p.15). The U.S.
wind power market began in the 1980s; however, it did not significantly progress until the late
1990s, as shown in Figure 2.5. More specifically, from 2008 to 2009 there was a 40% increase in
capacity (p.12). Even more importantly, this significant growth occurred despite the obstacles of
the financial crisis, which weighed heavily on the wind industry, and the continuation of major
reductions in wholesale electricity prices (p.12).
Fig. 2. 5 Annual and Cumulative Growth in U.S. Wind Power Capacity (Wiser, et al., 2010, p. 12)

16
Rapid market growth made wind power the largest new source of electric capacity in the
U.S. in the years from 2007 through 2009 (Wiser et al, 2010, p.14). Figure 2.6 shows that new
wind power projects contributed approximately 39% of the addition of the new nameplate
capacity2 to the electrical grid in 2009.
Fig. 2. 6 Relative Contributions of Generation Types in Annual Capacity Additions (Wiser, et al., 2010, p. 14)
Wiser and Bolinger predict that, from 2010 to 2035, the energy demands in the U.S. will
require an additional 49TWh per year. Approximately 60% of this projected needed growth was
met in 2009 by the new wind power capacity (2010, p.14). If the wind power industry continues
to grow at a pace mirroring that set in 2009, through 2035 about 60% of the nation‘s projected
increase in electricity generation can be met with wind powered electricity. It is clear that wind
power is, and can be, a significant contributor to meeting our nation‘s energy needs.
2 The full-load continuous rating of a generator, prime mover or other electric power production equipment under specific conditions as designated by the manufacturer

17
Globally, the rapid growth of the U.S. market makes the nation a desirable destination for
FDI (Kirkegaard, 2009, p.15). All of the top 15 companies from Europe, Japan and India, except
for Enercon of Germany, have wind turbine facilities in the U.S. or planned to open facilities in
2010. Due to the expanding market in the U.S., the international original equipment
manufacturers (OEMs) find it economically viable to open facilities in the U.S. By attracting the
top companies, there will be a decrease in turbine cost because the cost of transportation can be
cut; also, as mentioned previously, many jobs will be created through these FDIs.
2.2.3 Research and Development Funding in U.S.
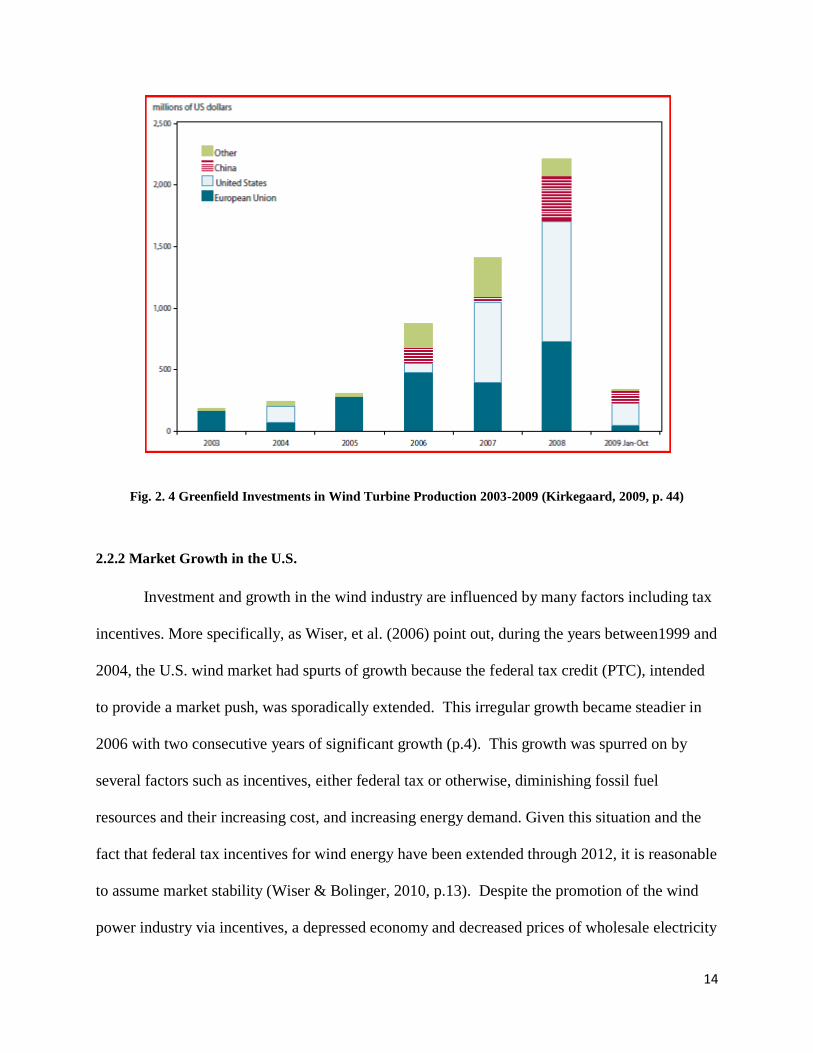
The U.S. energy research and development (R&D) budget was at its peak in 1979-1980.
The wind energy budget had its peak, however, in 1981 with $126 million (Harborne & Hendry,
2009, p. 3582). After the peak, energy R&D began to collapse; however, private R&D are a
substantial proportion of national R&D spending, as shown in Figure 2.7. The figure denotes the
changes in R&D funding over time and denotes historical events to exemplify the state of the
nation in that period of time. Although private R&D spending compensated for the diminishing
public R&D funds, it also dropped in 1990. Wind power R&D has come to rely on a tax credits
and incentives to stimulate private development.
18
Fig. 2. 7 Energy R&D Expenditure (Harborne & Hendry, 2009, p. 3585)
With the increase in demand for wind power and an expanding industry, research and
development is a vital component to the supply chain. The energy R&D funding has declined
progressively since the 1980s (Harborne & Hendry, 2009, p. 3583). Improvements, research,
invention, and development are necessary to ensure an energy infrastructure that promotes
economic and geopolitical security and aids in preventing global climate change (Nemet &
Kammen, 2006, p.1). The current investment in the energy research and development sector in
the U.S. is not enough to incent scientists and satisfy the needs of an expanding market. In
contrast, in Europe, there were high energy research investments in 2007, with wind energy
R&D investments accounting for three quarters of the total (SETIS, 2009). Also in Europe, the
R&D investments in wind energy are increasing rather than decreasing, as shown in Figure 2.8.
The corporate investment can mostly be accounted for by the European companies Vestas,
Gamesa, Enercon, and Nordex, all of which are in the global top 15 companies. There is an
evident correlation between the amount of R&D investments and the success of the European

19
wind industry, for Europe has both a large wind energy share and industry as well as high R&D
investments (SETIS, 2009).
Fig. 2. 8 Approximate European R&D Investment in Wind Energy From Industry and Public Sectors
(SETIS, 2009)
2.3 Factors Impacting the Wind Industry Development
Clean energy has many components in its supply chain within the United States. Many
states are in the process of developing the wind sector of the clean energy industry. Clean Edge,
Inc., the world‘s first clean-tech research and advisory firm, compared the states in 56 categories
that involved financial incentives, regulatory incentives, economic/workforce development and
knowledge capital (Clean Edge, Inc., 2010, pg. 3). Their report ranked Massachusetts second in
the nation, due to the state‘s support for clean energy policies and economic development, as
shown in Table 2.2.

20
Table 2. 2 Clean Energy State Leadership Scoreboard (Clean Edge, Inc., 2010, pg. 3)
Governmental policies and education both contribute to the success of the wind energy
industry. Massachusetts has many policies for the promotion of the clean energy industry. These
policies are aimed at regulating and encouraging commerce and manufacturing. Massachusetts
has also established state agencies, such as the Massachusetts Clean Energy Center, whose main
goals are to promote the clean energy industry and educate the workforce.
2.3.1 U.S. Policies and Regulations to Promote the Wind Energy Industry
There are many ways to promote the growth of the clean energy industry. Regulations
and policies imposed by the government on certain sectors of the energy economy are a viable
option (Barratt, 2002). Policies can help and hurt an industry that is being established. In July,
2008, Massachusetts government ―launched the most comprehensive and forward-thinking set of
clean-energy policies in the nation‖ (Bowles, 2010, pg. 24). The Green Communities Act of

21
2008 is the basis of support for the renewable energy industry and helped to double the annual
growth rate of Massachusetts‘ Renewable Portfolio Standard, which is a regulation that requires
the increase in production of clean energy (Danielson, 2008). The Act opens the door for clean
energy industries and helps to decrease greenhouse gas emissions, while fostering the rapid
growth of technology, capital and jobs. According to Massachusetts governor, Deval Patrick,
this policy ―reduce[s] electric bills, promote[s] the development of renewable energy, and
stimulate[s] the clean energy industry that is taking root here in the Commonwealth‖ (Danielson,
2008). Utility companies are required to invest in efficiency improvements, such as upgrading
equipment and making facilities more environmentally friendly. Incentives and rebates create an
opportunity for customers to buy from these more environmentally friendly utilities, and save
money as they conserve energy and use clean energy. These policies help to make purchasing
renewable energy a more feasible option for customers.
Promotion of alternative energy starts with encouraging utility companies to work with
clean energy manufacturers by financing renewable energy projects. This encourages the
development of clean energy technologies and accelerates the market penetration of efficient and
clean energy technologies. An important aspect of this policy is that it gives final legislative
approval to Massachusetts‘ part in the Northeast greenhouse gas regulatory effort. Most policies
and regulations that are being put in place by the Massachusetts government are aimed at making
fossil fuels more expensive and clean energy a more cost efficient option. ―The Commonwealth's
strong, stable, long-term policy support for renewable energy will serve as a model for the U.S.
federal government, which has until now significantly hampered the development of the
renewable-power industry by refusing to put in place the long-term, stable renewable-energy

22
policy support that will be required for the creation of a strong and growing domestic renewable
industry‖ (Danielson, 2008, pg. 34).
2.3.2 Global Policies to Promote the Wind Energy Industry
Wind industry development and success around the world directly depends on governmental
support. Australia and Denmark are two good examples of how tax incentives have helped to
encourage people to develop the wind industry. According to the Review of International
Experience with Policies to Promote Wind Power Industry Development Report (Lewis, 2005),
Danish companies obtain low interest loans to develop new wind technology and manufacture
parts and components for wind turbines. The Danish wind industry has a CO2 tax subsidy that
decreases the gap between the cost of fossil fuels and renewable energy, thus making wind a
desirable alternative to fossil fuels (Lewis, 2005). In Australia, the Research and Development
(R&D) Tax Concession enables Australian companies to deduct up to 125% of eligible
expenditures on R&D activities from assessable income when submitting their tax returns.
According to this report, ―for wind turbines to be manufactured in the US, whether by domestic
or foreign companies, federal policy support for wind will most certainly need to become more
stable‖ (Lewis, 2005, pg. 35).
Seeing the need for structure, the United States is making efforts for stability. In January,
2011, President Barak Obama proclaimed in his State of the Union address that his goal is to set
a clean energy standard that requires utility companies to produce a certain amount of their
energy from renewable, clean resources (Office of the Press Secretary, 2011). According to
President Obama, ―clean energy breakthroughs will only translate into clean energy jobs if
businesses know there will be a market for what they‘re selling.‖ President Obama went on to

23
set a new goal: 80 percent of America‘s electricity from clean energy sources by 2035 (Office of
the Press Secretary, 2011). This is a foundation and future for the United States and
Massachusetts.
2.3.3 Shortfalls of the Wind Industry in Massachusetts
However, there are problems, which create gaps and constraints that the clean energy
industries, and more importantly the wind sector, face in Massachusetts. The Clean Edge Report
states that Massachusetts‘ problems are high costs of living and energy (high overhead for
manufacturing), innovation to commercialization gaps, limited natural resources for clean
energy, local-rule traditions and ‗Not in My Backyard‘ mentality, risk-averse financial
community, lack of a national energy laboratory, and a limited clean energy manufacturing
infrastructure (Clean Edge, Inc., 2010, pg. 4). These problems facing the wind industry gaps and
constraints have created barriers for Massachusetts.
2.3.4 Education and the Wind Industry in Massachusetts
Massachusetts is the home to many of the top clean energy-promoting colleges and
universities in the United States. Collegiate courses and degrees in renewable energy
development are becoming top choices in education for students. The Princeton Review ranks
colleges as ―Green‖ based on courses that are offered, environmental practices, and policies of
the school. Harvard University is noted for their goal to reduce university emissions by 30%
below a 2006 baseline by 2016 and to bring their academics abreast with clean energy
curriculums throughout the United States. Northeastern University has received six federal grants
totaling more than $8 million to conduct research that will primarily focus on powering the next
generation of electric cars and consumer products (Northeastern University, 2010). Both

24
universities are among the top Green collegiate options that are located in Massachusetts
(Princeton Review, 2012). MIT encourages students to excel in clean energy projects with its
Clean Energy Prize. This prize provides $200,000 to the top student energy project in the nation
(MIT, 2011). Massachusetts‘ outstanding collegiate establishment also helps advocate and
advance the research and development of the wind industry. At the University of Massachusetts
in Lowell, students and faculty work together to advance wind energy through scientific
advancements and academic research.
2.3.5 Workforce Development in the Wind Industry
To develop the wind industry, clean energy education is needed at all levels. Workforce
development involves education within the industrial sector. Clean energy agencies were
established to conduct educational sessions, train the workforce and promote clean energy
improvements. Massachusetts agencies in clean energy include: Massachusetts Clean Energy
Center, New Generation Energy, EnerNOC and Sustainable Performance Institute
(Commonwealth Corporations, 2011). The Massachusetts Clean Energy Center collaborates with
workforce sectors of existing companies and helps to set up training in universities and higher
education.
2.3.6 Research and Development
Research and development (R&D) is a crucial component to the wind energy supply
chain. Massachusetts has the available technical resources, academic community and workforce
development support, to engage in the wind industry (Bowles, 2010). R&D within the wind
industry includes: reducing the cost between small and large wind turbine technologies,
increasing wind energy system reliability and operability by validating performance and design,

25
increasing the understanding of the true impact of the wind sector on the United States‘ energy
industry, and expanding the wind energy markets (National Renewable Energy Laboratory (US),
2010). In Charlestown, Massachusetts, the Wind Technology Testing Center (WTTC) tests the
latest turbine blade technology and prototypes development methodologies to keep moving
towards the next generation of wind turbines (Yarala, 2011). This is a step in the right direction
for Massachusetts in the quest for bringing R&D to the Commonwealth.
Companies in the wind industry play a crucial role in research and development. TPI
Composites Inc. (TPI) is a global wind blade producer with headquarters in Scottsdale, Arizona.
They plan to open a Wind Blade Innovation Center in Fall River, MA, that will ―serve as a center
for development of advanced blade manufacturing technology and a launching pad for new wind
blade products‖ (TPI Composites, Inc., 2011). TPI chose Fall River because the location offered
something the alternative park in Rhode Island couldn‘t: proximity to the company‘s existing
research and development facility (Bowles, 2010). According to Massachusetts Energy and
Environmental Affairs Secretary Ian Bowles, "Companies like TPI are making wind energy not
just a resource for Massachusetts but a vital new industry producing jobs and growth."
(Massachusetts Clean Energy Center, 2011) MassCEC's Executive Director Patrick Cloney
stated that, ―bringing a major wind blade manufacturer to the state to carry out development,
testing and training for the advanced manufacturing of wind blades will help build the wind
blade cluster in Massachusetts, and provide a local customer for our Wind Technology Testing
Center [a sector of the Massachusetts Clean Energy Center]‖. MassCEC has awarded TPI a
$250,000 grant, contingent upon creating and maintaining 30 jobs, thus encouraging the growth
of the clean wind sector and increasing the number of jobs in Massachusetts (TPI Composites,
Inc., 2011).

26
Research and development directly impacts manufacturing companies. R&D divisions
help to advance manufacturing projects and promote workforce development. TPI‘s new
innovation center in Fall River will work directly with the manufacturing plant in Rhode Island
(TPI Composites, Inc., 2011). Thus the innovations spawned by R&D will be directly
implemented in practice. TPI is an example of a stepping stone opportunity to encourage other
manufacturing companies, such as GE Energy and Mitsubishi, to become involved in the
Massachusetts clean energy industry. Research and development works in synergy with
manufacturers to advance the wind energy industry.

27
3. Methods
Several methods were utilized in order to gain information necessary to recommend areas
crucial to Massachusetts‘ wind energy future. This chapter will present these methods in detail,
focusing on the trends of the wind industry. The group first used a white space analysis to find
the gaps in the current wind energy industry. The last decade of wind industry was dissected
through the use of a technology roadmap. A technology roadmap is a form of technology
planning to face a competitive market (Garcia and Bray, 1997). It is a process to identify the
current state of a technology and the necessary directions for the technology. After analyzing the
entire industry, each component was individually examined through the use of a technology
roadmap. From there, the main challenges were discussed and a turbine component cost analysis
was conducted to determine the components that are major contributors to the cost of a wind
turbine. This helped to identify opportunities for development. Each of these components was
analyzed through issue trees to identify gaps in the industry. An issue tree is a process to identify
the problems of a technology and the future objectives for the technology, as well as the
strategies to reach those objectives (MDF, 2005). Overall, the goal of the research and analysis
was to assess the trends of the wind industry over the last decade and make suggestions for the
role that Massachusetts can play in the future of the wind industry.
3.1 White Space Analysis
A white space analysis is a process whereby an industry is analyzed to reveal where there
are gaps or problems. A gap is known as a white space within an industry. In our white space
analysis, the wind industry was value chain categorized into the six sectors: raw materials;
research and development; manufacturing; transportation; installation; and operations and

28
maintenance (O&M). In each of these sectors, gaps were identified within the industry‘s value
chain.
3.2 Component Cost Analysis
A component cost analysis was conducted to determine the most costly components of
the turbine. We used online articles from energy agencies such as the American Wind Energy
Association and the Department of Energy. This analysis breaks the turbine into its main
components and determines what percentage of the total cost each component represents. The
results revealed which components constitute the majority of a turbine‘s cost. These components
became the focus of our study because their individual improvement would have the greatest
impact on advancements in turbine technology as a whole.
3.3 Issue Tree
An issue tree looks at the reasons for each problem and identifies current and potential
solutions. This analysis is performed by starting from the current products and breaking them
down into the costs, processes, and technologies that comprise them. This method helps to
determine underlying factors that, if improved, may enhance the product in different ways. We
analyzed online articles from reputable sources within the wind industry such as the Department
of Energy and National Renewable Energy Laboratory to perform the component cost analysis.
From this component cost analysis, the most costly components‘ issues contributing to the high
cost were researched and current and potential solutions alleviated this cost emerged. Research
from that point forward focused on potential solutions to alleviate these issues of the most cost
intensive components.

29
3.4 Technology Roadmap
This method was the main part of the project and consisted of identifying and assessing
the trends in the U.S. wind energy industry over the last decade. By identifying changes in the
technology, the team was able to understand the trends that have occurred within the industry. A
key part of this method was the historical research of turbine technology. This is due to the fact
that wind turbine technology has experienced significant advancements and technological
developments over the past ten years. Assessing the developments as a whole revealed the trends
of the whole industry. Next, the focus moved to the most costly components. The team assessed
the trends in component technologies over the past decade, identified the challenges posed by
high costs and the possible opportunities for development. We determined the trends and areas
for improvement by analyzing online articles from sources such as Sandia National Laboratories
and GE Wind. Also, while attending the Wind Energy Research Workshop at the University of
Massachusetts at Lowell, we gained information and data from the lectures as well as
conversations with experts, such as Mark Higgins from the Department of Energy. The trends
that arose through all the research and findings were used to help make recommendations for
Massachusetts‘s clean energy future.

30
4. Results
The wind energy industry in the United States has experienced great changes in
the past decade. The technology behind wind turbines has been constantly improving. These
wind harvesting machines have grown to massive scales as a result of many design and
manufacturing advancements in individual components of the turbine. This chapter will examine
trends found in the past ten years of wind turbine technology. The chapter also presents the
current and emerging technologies involved with specific components found in wind turbines.
4.1 Growth of Turbines
Hub height and rotor diameter are site specific because of aspects such as desired
aesthetics, wind profile and local height regulations, but over the past ten years there has been
steady growth in average turbine size. The growths in hub height and rotor diameter have been
due to several factors, such as an increase in demand for larger turbines and improvements in
technology. Average offshore turbine size increased rapidly once there were specific designs for
offshore turbines (OCS Energy, 2011). Onshore turbine size has also increased but is restricted
by transportation regulations since large turbine blades are too lengthy for transportation on
existing surface roadways (DOE, 2010). Figure 4.1 exemplifies these trends based on data from
EWEA, AWEA, and DOE.
31
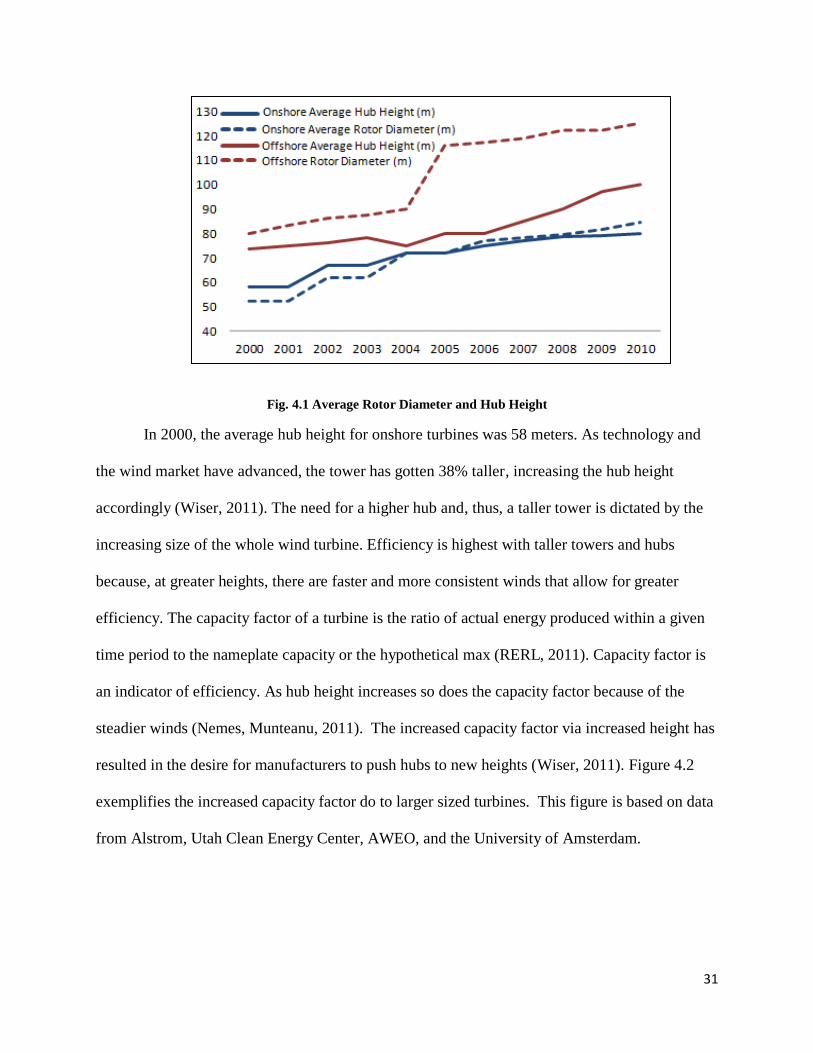
Fig. 4.1 Average Rotor Diameter and Hub Height
In 2000, the average hub height for onshore turbines was 58 meters. As technology and
the wind market have advanced, the tower has gotten 38% taller, increasing the hub height
accordingly (Wiser, 2011). The need for a higher hub and, thus, a taller tower is dictated by the
increasing size of the whole wind turbine. Efficiency is highest with taller towers and hubs
because, at greater heights, there are faster and more consistent winds that allow for greater
efficiency. The capacity factor of a turbine is the ratio of actual energy produced within a given
time period to the nameplate capacity or the hypothetical max (RERL, 2011). Capacity factor is
an indicator of efficiency. As hub height increases so does the capacity factor because of the
steadier winds (Nemes, Munteanu, 2011). The increased capacity factor via increased height has
resulted in the desire for manufacturers to push hubs to new heights (Wiser, 2011). Figure 4.2
exemplifies the increased capacity factor do to larger sized turbines. This figure is based on data
from Alstrom, Utah Clean Energy Center, AWEO, and the University of Amsterdam.

32
Fig. 4.2 Average Capacity Factor by Turbine Size
As the wind market becomes hypercompetitive, developers are being pushed to explore
sites with lower wind speeds. This results in higher hub heights to reach the best wind speeds for
the optimal output (Shreve, 2011). Average hub height will continue to increase as the wind
market moves offshore and continues to explore locations that need higher towers.
Manufacturers and engineers are working to reduce the weight of the blades while
increasing the rotor diameter to capture more wind. Locations with lower wind speeds require
larger rotor diameters to obtain the highest possible wind energy output. Blade design and
manufacturing significantly affect the increase of rotor diameter. In the last decade, onshore rotor
diameter has increased about 62 percent (Wiser, 2011). Between 2004 and 2005, offshore turbine
designs were implemented to be more optimally adapted for use in the sea (Junginger, 2005).
Overall the offshore designs evolved from onshore to a marinized design. This design
improvement caused the jump in the offshore rotor diameter. The increase in rotor diameter in
both onshore and offshore applications is a result of improved technology and research and
development (Wiser, 2011). Manufacturers are working to lower costs while building longer
blades. There are many ways of achieving this goal, among them by making improved materials

33
and through understanding the forces within blade structure in order to have a better
understanding of the optimal materials and design, and defect tolerance. Engineers are also
working on new innovative concepts to make blades more efficient: integrated blade design,
thicker airfoils, slender blades, and adaptive blades (Ashwill, 2008). The total capacity of a wind
turbine is crucially important and prompts the need for larger rotors that can effectively capture
more wind (Nolet, 2011).
4.2 Wind Turbine Capacity
Wind power capacity (nameplate capacity) is the amount of electricity that a wind turbine
supplies when running at full load. This is usually measured in kilowatts (kW). According to the
Betz Law, an important principle of renewable energy, ―you can only convert 59.3% of the
kinetic energy provided by the wind to mechanical energy created by the turbine‖ (Kaufman
Wind Energy, 2010). Thus the efficiency of a wind turbine is important because it will determine
how close the turbine design can get to Betz Law. Efficiency of a wind turbine depends on many
factors such as reliability of the components, energy generation capabilities, and amount of wind
capture. Through modifications and new technological developments, the efficiency has
increased so that nameplate capacity of wind turbines has also increased. As shown in Figure 4.2
below, nameplate capacity has increased over the past decade. The onshore wind capacity trend
line is blue and the offshore is red.

34
Fig. 4.2 Average Turbine Nameplate Capacity (EWEA, AWEA, DOE, Berkley Labs)
Wind turbine nameplate capacity for onshore wind has doubled in the past decade.
Although turbine size has increased, the effectiveness of turbines has improved as well.
Component developments have led to an increase in energy generation and ultimately higher
nameplate capacities. The growth in hub height and rotor diameter has helped capture more wind
energy.
Offshore has grown by 150% in nameplate capacity. Offshore wind turbines started as
marinized onshore turbines. The research and development sector of the wind industry worked
hard to design specialized turbines for offshore applications. Between 2004 and 2005, these new
offshore designs were implemented and offshore wind capacity jumped dramatically (Junginger,
2005). Since there are more constant winds offshore, these turbines also demonstrate an increase
in capacity factor, as shown in Figure 4.2. Improving the efficiency of a wind turbine, onshore
and offshore, will help to meet the nameplate capacity and aid in the increase of capacity growth.
0
1
2
3
4
5
6
2000 2001 2002 2003 2004 2005 2006 2007 2008 2009 2010
Meg
awat
ts
Average Turbine Capacity
Average Turbine Capacity (MW) Offshore Wind Turbine Cpacity(MW)

35
4.3 Wind Turbine Component Cost
A useful way to look at wind turbine costs is to study the percent cost of each component
when compared to total turbine cost. This is a good method to analyze technological trends
because it removes effects seen by inflation over time. Figure 4.3 has been compiled from
studies spanning from 2001 through 2010 (PERI 2001, WindPACT 2003, DOE 2005, Wind
Directions 2007, EWEA 2010).
Fig. 4.3 Percent Cost of Wind Turbine
28 28 25 24 24
25 22 25 22 24
13 17 13 16 14
15 7 12 12 12
19 26 25 26 26
Political Economy Research Institute
(2001)
Wind Partnership for Advanced
Componenet Technology (2003)
Department of Energy (2005)
Wind Directions Magazine (2007)
European Wind Energy Association (2010)
Rotor Nacelle and Machinery Gearbox and Drive Line Generator Systems Tower and Foundation
Percent Cost of Wind Turbine Components

36
The data are fairly consistent over this time, but there are still visible trends. An increase
in percent cost for tower is evident in the early part of the decade, and is explained by the
increasing hub height of wind turbines. As the towers become taller, the associated costs also
grow. The rotor, comprised of the blades and hub, is also a significant contributor to total turbine
cost. Its percentage cost has shrunk slightly overtime. This can be misleading; the cost of blade
manufacturing has not gone down, it has remained relatively constant as other component costs
have increased. The gearbox and generator, although separate systems, greatly affect each other.
Collectively, along with the drive shafts and main bearings, the generator and gearbox make up
the drive train of the wind turbine. The graph shows some fluctuation among these two
categories which can be accredited to changing technologies and the development of direct drive
systems. The cost of gearboxes has also risen due to the need for larger gearboxes to handle
increasing torque loads caused by the overall increase in turbine size. The nacelle and machinery
category comprises slightly less than one quarter of the overall turbine cost. This category is
composed of many smaller systems responsible for processes such as cooling, braking, turbine
pitch and yaw control, and weather monitoring, as well as the nacelle‘s protective shell itself.
This portion of the turbine cost, although important, is divided into many smaller components of
relatively low percent cost. Based on these cost distributions, the team chose to focus their
research on the rotor, gearbox and drive train, and the tower.
4.4 Component Technology
Wind turbines are complex machines utilizing many specific technologies. The
individual components vary greatly in material, design, and markets. Each component has its
own history of development as well as emerging technologies. In this section we describe the
current and emerging technologies of the blades, tower and drive train.

37
4.4.1Wind Turbine Blade Technologies
Wind turbine blades are one of the most visible components of a wind turbine. Together
with the hub, the blades make up the rotor. The primary function of the rotor is to capture and
convert wind energy to high torque, low speed rotational energy. Three-bladed rotors are the
most common design because they offer the most efficient design (EWEA, 2011).
Wind turbine blades are a fiberglass composite structure made through an intricate labor
intensive process. First a mold is built to form the outside surface of the blade. A layer of
fiberglass is then laid over this mold. A layer of end grain balsa is then added on top of this,
followed by another layer of fiberglass. This assembly is then encased in a vacuum bag and
resin is infused to combine the three layers together into one piece. Two of these skins are made
and then sandwiched together around a center spar of either fiberglass or carbon fiber composite,
depending on blade model. The leading and trailing edges are then finished by hand and the
entire blade is cured inside a large oven. At this point the blade is finished, trimmed and painted,
while the root of the blade is machined to accept the fasteners needed to attach the blade to the
hub (Nolet, 2011).
Fig. 4.4 Wind Turbine Blade Cross Section (WindFlow Technology, 2011)
Blade Skins
Leading Edge Trailing Edge
Center Spar

38
The main focus in current blade technology is on increasing the length of blades. Blade
length is governed by a rule known to the industry as the square/cube rule. This rule states that,
as blade length increases linearly, the swept area of the rotor increases at a square rate. This
increases the potential amount of wind passing through the rotor and increases the amount of
energy that the turbine can harvest from the wind. However, as the blade length increases, the
volume and weight increase at a rate proportional to the cube of the length. This means that, for
a given design, the material costs of wind turbine blades grow faster than the blade‘s capacity to
harvest wind energy. Design improvements such as changes in the blade structure and materials
must be implemented in order to overcome the limitations of the square/cube law (Stephenson,
2011).
There is a significant focus on material improvements in the realm of wind turbine
blades. For example, DOW Chemical and Owens Corning are currently working to produce
lighter yet stronger fabrics and reduce the weight of the epoxies used to bond the fiberglass
(Dvorak 2011). Gamesa, Vestas and TPI are all beginning to use carbon fiber in their blades,
especially in relatively smaller components such as the spar web. Recent advances at Case
Western Reserve University include the use of polyurethane infused with carbon nano-tubes for
blade construction (UPI 2011). Although this technology is early in its development, it may be
an option in the future to increase length of rotor blades while keeping costs down.
Before any manufacturing can begin, substantial amounts of time and effort are devoted
to the design of a turbine blade. Engineers use computational models to determine the best
aerodynamic shape of the blades. These models are based on theoretical equations and many
engineering assumptions (Dixon, 2011). After the external blade profiles have been determined,
the internal structure and design for the manufacturing process begins. This is done using a

39
variety of software programs. Commonly, a spreadsheet of data will travel along with the
geometric software. This spreadsheet holds information such as the calculations used to
determine the geometry of the blades, amounts of layup fabric needed to fit the design of the
blade, and similar data that is not stored within the changing software but need to be present in
the design and manufacturing process. In addition to complicating the information transfer
during the design process, this also creates an issue in that the values are rounded at almost every
transition between designers, analysts and manufacturing engineers. This round off error can at
times pose a real issue later in the process (Richardson 2010).
The design process has also seen marked improvement. New CAD programs, from
suppliers such as CATIA, are helping to analyze blade design by completing more rigorous finite
element analyses. These programs also streamline the flow of information from one professional
to another as the blade moves through the design and manufacturing process. This improved
software is better capable of performing a more accurate finite element analysis of the composite
structure inside a wind turbine blade. This is an extremely important aspect in the optimization
of blade design to reduce weight while maintaining strength (Richardson 2010).
Savings in blade cost can also be achieved through improvements in manufacturing
technologies. Current wind turbine blades are made of e-glass fiberglass, balsa core, rigid foam,
gel coat epoxies, and sometimes carbon fiber depending on blade size and company. The blades
are molded in two halves and then sandwiched around a center spar. The joints are then glued
together and the entire blade is put in an oven to cure. From this point, the blade is trimmed
sanded, and painted before completion. This is a costly, labor-intensive process.

40
Fig. 4.5 Wind Turbine Blade Lay Up (NewEnergyNews, 2011)
Automation is already being used in some specific applications while growing in others.
Currently, robotic equipment is used to cut fiberglass templates and transport bulk materials.
Robotic systems are also used to mill and drill the blade‘s root section for attachment to the hub
(Nolet, 2011).
Robotics and automation companies, including MAG Industrial and MTorres, are
developing machinery capable of completing full blade skin layup (Black, 2009). Other more
advanced systems from KMT Robotics are also using robotics to trim the blades once they are
removed from the molds, as well as to sand and paint the outer surface. Although, at this time,
preliminary findings indicate that that the bulk layup process of the blade is too complicated and
costly to automate due to its large size, smaller pieces of the blade, including the spar web and
root section, as well as other processes including finishing and painting, could especially benefit
from the implementation of automated processes (Nolet, 2011).

41
Fig. 4.6 Wind Turbine in Robotic Finishing and Paint (Wind Systems, 2011)
Another important aspect of progress in wind turbine blade technologies is quality control
and in-process testing. Researchers at Sandia National Laboratories are beginning to embed
sensors throughout the blade to provide better quality control during the manufacturing process
as well as improved system monitoring during the operation of the turbine (Science Daily 2010).
Fig. 4.7 Embedded Sensor Installation in Turbine Blades (Sandia, 2011)

42
Some other examples of blade health monitoring systems use stereo digital cameras or
laser sensing systems. These monitoring systems are beginning to be used in testing to help
validate the computational models that are used to design wind turbines (Ammerman, 2011).
Los Alamos National Lab is currently building a system to examine how two wind turbines
affect each other via the turbulence they cause (Ammerman, 2011). National Renewable Energy
Laboratory is also completing multiple tests on wind turbine blades with imbedded sensors to
understand better the results of static and fatigue, testing both the structure of the blade as well as
the effects of defects within this structure. A better understanding of manufacturing defects and
improved accuracy of computational models could greatly improve many aspects of wind turbine
blade technology.
Experimental Testing of current blade technology is of vital importance for the
advancement of blade design. Current computational models are based largely on theoretical
knowledge and engineering assumptions, and therefore lack accuracy. This causes overbuilding
of blades, which can result in increased costs. Blades are currently tested as a means of
certification. This testing exposes blades to fatigue loads and maximum static testing. This
testing is destructive; costs approximately $500,000 and can take anywhere from five to eight
months (Berry, 2011).

43
Fig. 4.8 Turbine Blade Static Testing (EWEA, 2011)
This testing, combined with embedded sensor technology, can be used to extract better
data sets which can be used to validate certain computational models. Properly validated
computational models have been used in other industries, such as the aerospace and nuclear
fields, as a means to certification. This fact may help reduce the need for such costly testing and
allow earlier implementation of wind turbine blade designs. The integral culmination of
improved quality control, design software, automated manufacturing and advances in light
weight strong materials is the center piece of the next generation of wind turbine blades.

44
4.4.2 Wind Turbine Tower Technologies
Towers are an essential part of a wind turbine and account for almost a quarter of the cost
(EWEA, 2010). The tower supports all of the machinery housed in the nacelle while also
withstanding the variable forces of the wind (Sterzinger and Svrcek, 2004). The primary design
considerations currently include budget, turbine size and weight, site, and desired aesthetics.
The current tower technology is a forged tubular steel tower with a concrete foundation.
The tower is designed to support the weight of the turbine components while resisting lateral
wind forces on the rotor and the body of the tower. Currently, the tower consists of forged steel
tubes that are connected with flanges and bolts, as well as welded together (Ancona and
McVeigh, 2001). Currently it costs about $160 per mile to transport one of five tower segments
(DOE, 2010). Figure 4.9 exemplifies the cumbersome quality of the tower sections for transport.
Also, due to routing constraints because of road limitations on weight and length, it is difficult to
transport the current tower segments.
Figure 4.9: Transporting a tower Segment (Lee Wind Energy, 2011)

45
In addition to these obstacles, installation of the current tower designs requires specialized and
expensive rigging machinery and is labor intensive. With a push for taller towers to reach more
consistent winds at higher speeds, these issues will need to be addressed (Zuteck, 2009).
A recently introduced technology within the industry has been a hybrid tower, which
improves the current design by increasing height and reducing costs. The hybrid tower is similar
to the current monopole with a concrete foundation but this design uses a new material for its
bottom segment: concrete. This design can be seen in figure 4.10. By having a concrete base, the
tower can reach greater heights and avoid the transportation issues because concrete is poured on
site (CES Edupac, 2011). Also, the hybrid tower reduces transportation and installation costs
because concrete can be transported in standard vehicles that will not encounter challenges with
road restrictions, unlike when transporting the large steel tower segments. The hybrid tower has
shown to be a competitive option because of its use of a different material.
Figure 4.10: Hybrid Tower (Advanced Tower Systems, 2011)

46
To improve the current design, the industry is adopting both new materials and new
designs. Table 4.1 examines the current and alternative material choices for the foundation.
There are two different choices: traditional concrete and fly ash concrete. Fly ash emerged in the
industry because it provides a greater specific strength and is less energy intensive to
manufacture than traditional concrete (Build It Green, 2005). . Fly ash is more expensive per
pound, but provides a more optimal specific strength. Although fly ash has the preferable
specific strength, it is not as readily available as conventional concrete because there are not as
many producers of fly ash. Improving the specific strength ratio for a foundation can lower
installation costs, which are a significant factor in the tower‘s overall high cost. This cost can be
reduced because less concrete would be needed if the material has a higher specific strength.
Often there is additional ground transportation needed for fly ash due to the limited number of
producers. Whether the improved specific strength can negate the higher material cost/lb is
relative to the distance to the site.
Table 4.1 Tower Foundation Materials (CES Edupac, 2011)
Raw Material Cost/lb
Specific Strength
(ksi/lb)
Concrete $0.024 0.030
Fly ash Concrete $0.047 0.059
One path toward which the market is headed is redesigning the tower. A new tower
design is the shell tower as seen in figure 4.11. This design uses a new manufacturing process.
The steel for the tower is thinner than the steel used in the current monopole and the tower itself
has a larger diameter than the current tower design. The large diameter allows for taller towers

47
and the material is cheaper steel coils instead of the currently used steel plates. Overall, the
tower reduces the total steel tonnage per tower. The shells can be manufactured with automatic
machinery to improve consistency. The shells are transported on standard trailers and bolted
together on site, which reduces transportation costs and makes remote areas more accessible.
This new design allows for a taller tower that will be easier to assemble and transport than the
current tower design, which will also make it more cost effective (Andersen Towers, 2011). This
design addresses the restriction on turbine tower size imposed by transport regulations.
Drawbacks of the design are a larger footprint, which leads to a higher foundation cost. More
than 2000 of these towers have been produced and supplied. Siemens has bought the design
concept and is pushing to introduce the design into the market (Andersen Towers, 2011).
Fig. 4.11 Shell Tower (Andersen Towers, 2011)
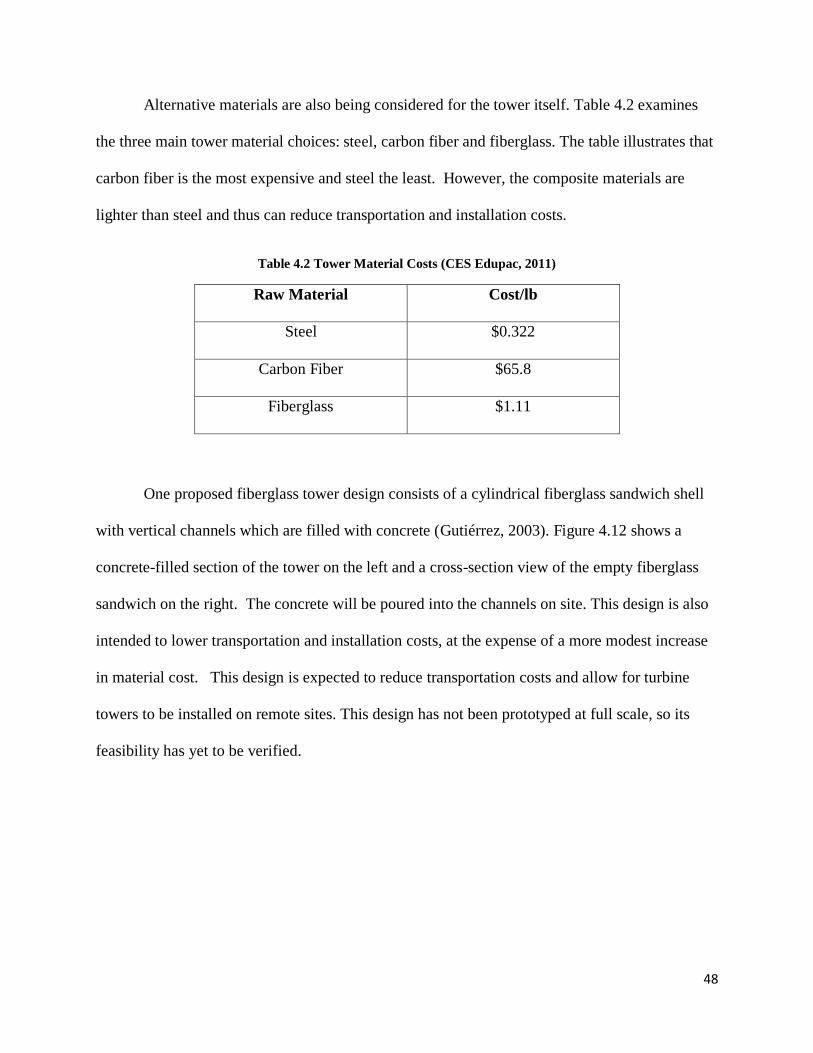
48
Alternative materials are also being considered for the tower itself. Table 4.2 examines
the three main tower material choices: steel, carbon fiber and fiberglass. The table illustrates that
carbon fiber is the most expensive and steel the least. However, the composite materials are
lighter than steel and thus can reduce transportation and installation costs.
Table 4.2 Tower Material Costs (CES Edupac, 2011)
Raw Material Cost/lb
Steel $0.322
Carbon Fiber $65.8
Fiberglass $1.11
One proposed fiberglass tower design consists of a cylindrical fiberglass sandwich shell
with vertical channels which are filled with concrete (Gutiérrez, 2003). Figure 4.12 shows a
concrete-filled section of the tower on the left and a cross-section view of the empty fiberglass
sandwich on the right. The concrete will be poured into the channels on site. This design is also
intended to lower transportation and installation costs, at the expense of a more modest increase
in material cost. This design is expected to reduce transportation costs and allow for turbine
towers to be installed on remote sites. This design has not been prototyped at full scale, so its
feasibility has yet to be verified.

49
Fig. 4.12 Fiberglass Tower
The carbon fiber tower is manufactured from round lattice matrices of carbon-fiber
strands that are assembled in geometric patterns, triangles and pyramids, for structural integrity,
as shown in Figure 4.13 (Kipp et al., 2009). A carbon fiber tower using this design is expected to
weigh less than 6% of the weight of the conventional steel monopole. Furthermore, the tower can
be easily transported and assembled on site without specialized equipment, resulting in
substantial savings in transportation and installation costs. However, carbon fiber composites are
about 200 times more expensive than steel, so material costs for these composite lattice designs
are projected to be about 10-12 times the cost of steel towers. Developers of this technology
need to demonstrate that the savings in transportation and installation costs can negate the
increased material cost. This design is still in the development stage and, if it proves feasible, it
has the potential to replace the current tower design.

50
Fig. 4.13 Carbon Fiber Tower
Another new design is a hybrid multi-element tapered rotating tower, as shown in Figure
4.14(Zuteck, 2009). The current tower design is stationary; however, wind direction is variable.
Therefore, the shape of the tower cannot be aerodynamically or structurally optimized. The
hybrid multi-element tapered rotating tower is constructed of several beam-like elements that
form a leading and trailing edge to improve aerodynamic performance while carrying the
necessary structural loads. Additional supports in the middle aid with structural integrity. The
rotational elements in the base allow for the tower‘s leading edge to always be facing the wind.
With this design, each element can be designed for a specific load, which allows for optimal
material choice. More specifically, the leading edge will experience both compression and
tension loads, but the trailing edge will primarily encounter only compression loads; these
elements could be composed of different materials that will cater to the needs of each separate
edge. This design allows for more specificity and optimization because the loads that will be
applied to the tower can be predicted more easily. This design also reduces transportation costs
because it can be broken down into smaller segments. However, the design is still in the
development stage

51
Fig. 4.14 Hybrid Multi-Element Tapered Rotating Tower (Zuteck, 2009)
Other new design concepts involve complete elimination of the tower. There are two
designs currently being proposed, the MagLev turbine and a balloon turbine. A concept that
proposes to eliminate the turbine tower is a balloon-type device called an air rotor, seen in Figure
4.15. This concept is in the prototype stage of development. This design is a lighter-than-air
tethered turbine that rotates on a horizontal axis in response to the wind. Height is achieved by
filling the balloon-like structure with helium. The developers claim that this design has no
placement limitations and provides more height which can capture more reliable winds than
current fixed tower designs (Maggen Power Inc., 2011). Also, it is stated that the air rotor will
have better operational performance because it will operate at lower wind speeds than do the
current wind turbines. The downfalls of this design, besides lack of test data and verification of

52
its performance, are the aesthetics and the need for tethering. The high cost of helium is not
addressed by the design‘s proponents (University of Florida, 2006).
Fig. 4.15 Balloon Turbine (Magenn Power, 2011)
The Maglev turbine design is seen in Figure 4.16. This design has not been prototyped or
tested. This turbine will float on a magnetic cushion, which will limit the friction with rotation,
optimizing the power produced (MagLev Wind, 2009). It is claimed to have significantly better
operating performance, producing 1GW versus conventional designs which produce at most
5MW of power. However, this claim is solely comparing maximum capacities and not
accounting for footprint and size. The design also claims to reduce maintenance costs because
friction is the root of the need for the majority of maintenance. The levitation magnets require
the use of costly and rare materials such as Neodymium, so the feasibility and cost-effectiveness
of this design are still under investigation (Geology, 2011).

53
Fig. 4.16 MagLev Turbine (MagLev Wind Turbine Technology, 2004)
4.4.3 Drive train Component and Generator Technologies
The drive train is the heart of the wind turbine. The drive train of a wind turbine converts
the rotation of the turbine‘s rotor into electrical energy. The drive train, including the generator,
represents some of the most expensive components in a wind turbine. It consists of a primary
low speed shaft, a gearbox, a secondary high speed shaft and a generator. The primary shaft
takes the low speed rotation from the rotor and brings it to the gearbox. The gearbox converts the
low speed rotation into high speed rotation. The high speed shaft then provides rotation to the
generator. The generator converts the high speed rotation into electricity. Drive trains were
initially designed with this combination of the gearbox and generator.
Originally, wind turbine drive train designs utilized off-the-shelf components from other
industries that were adopted for use in wind turbines. Over the years these components have

54
evolved to be more compatible for turbine use and to increase reliability. Geared drive trains,
shown below in Figure 4.17, are currently the most commonly found system in wind turbines
globally. Wind turbine gearboxes usually use a planetary gear system and ensure equal load-
sharing among the numerous mesh points. There are three planet gears that circle a sun gear.
They support each other and engage at the same time, which is one of the advantages of the
planetary gear system. This allows gearboxes to be made smaller and more compact. Thus the
main advantages of this system are the high power density and large reduction in a small volume.
Fig. 4.17 Conventional gearbox drive train configuration (Department of Energy, 2010)
In addition to the high capital cost of these components, reliability is a significant issue
for drive trains in wind turbines because of the varying winds and resultant wear that is
experienced by the drive train components. Varying wind speeds experienced by the rotor are
transferred to the drive train in the form of fluctuating torque loads. Varying loads cause wear
between the gears and hence subsequent failure. The maintenance and downtime when the drive

55
train fails are detrimental to the overall reliability of the wind turbine. According to the
Department of Energy, ―Conventional drive-trains are not meeting their expected 20 year
operating lifetimes primarily due to premature gearbox and bearings failures that necessitate
turbine downtime as well as expensive and time-consuming repairs or replacements, often via the
deployment of very large and expensive lifting cranes‖ (2010). Modifications of this system have
attempted to improve the reliability through better lubrication and friction force drives
(Department of Energy, 2010).
One of the newest technologies for drive trains is gearless systems. The gearbox is
completely eliminated, as shown below in Figure 4.18, and the generator is changed to be able to
handle low speed generation from the rotor and convert it directly into electricity. This form of
system is more commonly known as direct drives. Due to the lack of a gearbox, the drive train
requires a larger diameter generator and extensive power electronics to account for the varying
winds and energy input. The biggest advantage of this new direct drive design is the major
increase in reliability with the elimination of the gearbox. This makes this system ideal for
offshore wind turbines, where maintenance and repair considerations are expensive and complex.
Europe has implemented direct drive in both onshore and offshore applications, and there is a
push for the same in the United States (Technology Review, 2009).

56
Fig. 4.18 Permanent magnet drive train configuration (Northern Power Systems, 2009)
Direct drive generators require the use of permanent magnets. High strength permanent
magnets can be made from an alloy of the rare-earth material, Neodymium- iron (Nd-Fe)
(Department of Energy, 2010). The world‘s most accessible deposits of these rare earth materials
are located in China and are in limited supply to outside countries (Dvorak, 2011). As an
alternative to Nd-Fe magnets, direct drive generators are starting to move towards permanent
superconducting magnets that utilize niobium-tin and niobium-titanium alloys. Superconducting
magnets are used to generate energy in existing magnetic resonance imaging (MRI) equipment,
but the technology has not been commercialized for use in wind turbines (GE Energy, 2009).
According to an expert at the Advanced Wind Turbine Drive Train Concepts Workshop,
(these) materials (are) capable of conducting electricity with near-zero direct-current
electrical resistance…superconducting generators have less mass and require less volume
than comparable permanent magnet direct drive generators, particularly as wind turbine
capacity ratings continue to increase. Lower generator mass and size reduces the capital cost
of generator and reduces the loads on the tower, resulting in an overall reduction in turbine
capital costs (Department of Energy, 2011).

57
Although the actual generator is decreased in size, there are added components due to the
different magnetic technology. A major challenge of permanent superconducting magnets is that
an extensive cooling system is needed to reach the required near-zero temperatures for the
magnets. Overall, gearless systems are a developing technology and a potential future option for
both onshore and offshore wind turbines.
4.5 Communication
Due to the competiveness of the wind industry, the different sectors struggle to
collaborate with each other. Instead of working together to make forward progress, the main
Original Equipment Manufacturers (OEM) are competing against one another and consequently
design growth is minimal. There are many different models of designs and technical languages in
the wind manufacturing industry. This diversity of similar technology limits communal learning
from the failures or knowledge of others. Over the past decade, this challenge has affected the
forward progress of the wind industry. According to Bill Follett Jr., senior project engineer at
Cianbro, ―the lack of communication between (wind energy sectors) is unfortunately not new…I
believe working with industry/research consortiums can help the process so that in addition to
research some schedule and fiscal discipline is adhered to. I believe that the resources being
spent to date are somewhat fragmented and should be consolidated‖ (Follett, 2011). The different
wind energy sectors would benefit from improved communication and learning from themselves
and the past.
There needs to be a common ground between OEM‘s and the manufacturing sector of the
wind industry in order for the wind market advance. A goal of the UMass Lowell Wind Energy
Workshop was to promote communication and cooperation between many industrial companies,

58
such as TPI Composites Inc. and Shell Wind Energy Inc. and the researchers both in industry and
in academia (UMass Lowell Wind Energy Workshop, 2011). Richard Williams, the president of
Shell Wind Energy, Inc, was in attendance at the UMass Lowell Wind Energy Workshop.
During his presentation, he stressed the importance of common communication in the general
manufacturing sector and urged for collaboration within the entire wind industry, including
communication across sectors such as industry, academia and government (Williams, 2011).
Currently competitive tension between the key industry producers makes collaboration
impossible and has stalled many wind projects (Marcus, 2011).
It is evident that there is a crucial need for OEM‘s to ease the strain amongst themselves.
Academia and the government can play a role but manufacturing has the most challenges with
communication. Academia has a long and well established tradition of fostering scholarly
collaboration because academics understand the importance of learning from each other and
routinely publish advancements in journals, newsletters, and conferences. Industry is a hard
place for cooperation because of the free market and competitive atmosphere that exists in the
United States but ―in a new industry like clean tech, collaboration is essential to help players
succeed‖ (Marcus, 2011).
4.6 Findings and Trends in the Wind Turbine Industry
Overall, many trends have contributed to the current status of the turbine technology and
the direction the technology is moving. The findings summarize the current and emerging
technologies for our focused components. Figure 4.19, shown below, exemplifies these prevalent
component technologies in the current and future U.S. wind industry.

59
Fig. 4.19 Timeline of Component Technologies
4.6.1 Component Trends
In the last decade, advances have been made in blade, tower, and drive-train technology
in the U.S. wind industry. Out of the many studies we found, there have been many changes in
the size, capacity and reliability of industrial wind turbines (Wiser, 2011; Bird, 2005). The
average onshore hub height has increased by approximately 38% from 2000 to 2010, and the
average onshore rotor diameter increased by about 62% during the same period. Consequently,
the average nameplate capacity of turbines increased 103% over the decade. Many of these
significant improvements came about because of innovations and modifications within the
industry. Towers have seen changes in raw materials and designs to improve height to reach
stronger winds. Drive-trains have evolved from conventional off-the-shelf gearboxes and

60
generators to purpose- built designs for wind turbines, improving both reliability and efficiency.
Other companies have chosen to pursue other routes, such as direct drive systems using specially
designed generators. Blades have grown to longer lengths due to advances in modeling and
materials. The growth in blade length increases the amount of wind a turbine can capture. This
improves turbine reliability as well as total energy generation. To be a competitive market,
advances in technology must continue to improve effectiveness and efficiency.
Changes that have evolved through the past decade in the U.S. wind industry demonstrate
a prominent trend towards increased turbine size. Researchers and engineers developed new
designs to achieve these goals. There has been a steady increase in wind turbine size. This
increase in size increases both the individual turbine capacity and the reliability in harvesting
wind. Turbine components have followed suit, being able to handle the larger forces involved
with the increase in scale. Recently, offshore wind turbine installations have become a real
possibility as U.S. turbine technologies have advanced to mirror successful European offshore
projects. Offshore turbines take advantage of the stronger winds available over our oceans and
capacity has increased over the last decade. The wind industry market has seen growth through
the past years as the wind turbine size has increased.
4.6.2 Computational Modeling
Computational modeling in the current wind industry is based on theoretical calculations
and many estimates. The models need to be compared to experimental data to increase their
credibility. Verification and validation of computational models is crucial. These two terms can
be explained as the following: verification is proving the model is solving the equations
correctly, validation is proving that the model is solving the correct equations. There are many

61
advances in computational modeling that would benefit the wind industry greatly. With
improved computational modeling blade technology can become more effective by applying
nondestructive testing methods. Also, this can reduce the need to invest significant amounts of
money in a blade for purely testing purposes. Other than the savings in material and time in
producing better, more efficient turbines, data proven computational modeling could also save
significant amounts of time and money in the certification process. Computational modeling
certification is already used in the aerospace industry as well as with the on-going certification of
the United States nuclear weapon arsenal. If this process is applied to wind turbine components,
there could be large savings in both capital equipment cost and labor. A computational model
should also ideally run in one day instead of many days. An important aspect that this
progression of computational modeling could help with is collaboration. There are over 200
modeling codes used by different companies. Ideally these could be consolidated to a small suite
of programs nearing about 10 separate codes. This would help the communication problems of
the whole industry. Overall, wind industry computational modeling is a very important step that
must be advanced in order for the future to be successful.
4.6.3 Communication Issues
The current wind industry has a lack of communication that is holding back the wind
market (UMass Lowell Wind Energy Workshop, 2011). In general, manufacturers and
researchers alike are not willing to share information for confidentiality reasons. Some people in
the industry believe this is slowing the industry‘s growth (Follett, 2011). Manufacturers are
individually trying to reach a shared goal through concurrent, duplicative efforts. There is a
great deal of overlap in their efforts, meaning they are each producing their own base level work
to be built upon. Improved communication could help to stop unnecessary time consumption

62
and progress at a faster rate towards new wind technology and innovations. The Commonwealth
of Massachusetts could facilitate the creation of forums, seminars and conferences that bring
together the major OEMs, manufacturers and researchers to help them collaborate with each
other as well as national laboratories. It is understood that the manufacturers will never
completely communicate all of their technology and testing information, but hopefully in the
future a common ground can be reached so individual progress can be better used to support the
common goal. National and State agencies, such as the Massachusetts , National Renewable
Energy Laboratory and the Department of Energy, will need to lead the effort to connect key
stakeholders within the wind industry (UMass Lowell Wind Energy Workshop, 2011). Academia
and the government can play a role to help improve the innovation process and to help the
forward progression, but a mutual understanding must be reached within the industry to advance
the wind industry to establish better communication.

63
5. Conclusion and Recommendations
Overall the goal of this project was to assess the potential trends of the wind industry
through a technology roadmap analysis. The technology roadmap was conducted to find the gaps
within the wind industry. This led to in depth look into the source of these problems in the last
decade and what technological developments have led to the current designs. We identified past
and potential trends for the wind industry, proposed the part that Massachusetts could play in the
wind industry.
Based on our research, we have identified a need for collaboration between the different
sectors of the wind industry and improvement in computational modeling. Due to the availability
of intellectual, academic, industrial, and governmental resources in Massachusetts, these areas
create opportunities for growth in this field. We recommend that the Commonwealth start to
establish a common thread of communication that can tie together academia, industry and
government. Massachusetts Officials should organize workshops and conferences that promote
collaboration between the different sectors of the wind industry. We further recommend that the
appropriate agencies and officials of the Commonwealth work with Massachusetts universities,
academic community and national testing centers to improve the accuracy of current
computational models. Industrial companies should coordinate with Massachusetts universities
and academia to develop accurate validated baseline modeling programs to be used by private
companies as needed.

64
References
Acheson, J. A., Simacek, P., & Advani, S. G. (2004). The implications of fiber compaction and
saturation on fully coupled VARTM simulation. Composites Part A: Applied Science and
Manufacturing, 35(2), 159-169.
Advanced Tower Systems. (2011). Hybrid Tower. Retrieved on 10/10/2011, from:
http://www.advancedtowers.com/fileadmin/ats/images/product/tower_vision02.jpg
Ammerman, Curt.―Computational Modeling‖.Los Alamos National Laboratories.Lowell
Massachusetts. 22 Sept. 2011
Ancona, D. & McVeigh, J. (2001, Aug. 29). In Wind Turbine - Materials and Manufacturing
Fact Sheet. Retrieved Apr. 10, 2011, from http://www.perihq.com/documents/WindTurbine-
MaterialsandManufacturing_FactSheet.pdf
Andersen Towers. (2011). Next generation turbine towers. Retrieved Sept. 30, 2011
from http://andresen-towers.com/concept
Barbose, G., Darghouth, N., Hoen, B., Mills, A., Porter, K., Fink, S., & Tegen, S. (2010). 2009
wind technologies market report.
Barrett, J. P., Hoerner, J. A., Bernow, S., & Dougherty, B. (2002). Clean energy and jobs: A
comprehensive approach to climate change and energy policy. Energy Policy Institute.
Baskan, O., Edremitlioglu, H. H., & Toydemir, K. C. (2008). Economical, environmental
outcomes of wind energy production in Turkey.(Undergraduate Interactive Qualifying Project
No. E-project-011508-122701). Retrieved from Worcester Polytechnic Institute Electronic
Projects Collection: http://www.wpi.edu/Pubs/E-project/Available/E-project-011508-122701/
Black, S. (2009) Automating wind blade manufacture. Composites World. Retrieved Sept. 13,
2011 from http://www.compositesworld.com/articles/automating-wind-blade-manufacture
Berry, Derek.―Manufacturing‖. National Renewable Energy Laboratory. Lowell Massachusetts.
22 Sept. 2011
Boucher, K., Guerra, J., & Watkins, B. (2010). Auburn, Massachusetts wind feasibility study
(Undergraduate Interactive Qualifying Project No. E-project-050410-081256) Retrieved
from Worcester Polytechnic Institute Electronic Projects Collection:
http://www.wpi.edu/Pubs/E-project/Available/E-project-050410-081256/
Bowles, I. A. (December 29, 2010). Massachusetts clean energy and climate plan for 2020.,
April 6, 2011. Retrieved from http://www.mass.gov/Eoeea/docs/eea/energy/2020-clean-energy-
plan.pdf

65
Breton, S., & Moe, G. (2009). Status, plans and technologies for offshore wind turbines in
Europe and North America. Renewable Energy, 34(3), 646-654. doi:DOI:
10.1016/j.renene.2008.05.040
Brown, M. A. (2001). Market failures and barriers as a basis for clean energy policies. Energy
Policy, 29(14), 1197-1207.
Build it Green. (2005). Fly ash concrete. Retrieved Oct. 5, 2011
from http://www.builditgreen.org/attachments/wysiwyg/3/Fly-Ash-Concrete.pdf
Clean Edge, I. (2010). A future of innovation and growth.
Christiner, M.P.,Dobbins,R.J.,Ndegwa,A.M.,& Sivak,J.J. (2010), Feasibility of Rooftop Wind
Turbines in Boston(Undergraduate Interactive Qualifying Project No. E-project-050410-
163916). Retrieved from Worcester Polytechnic Institute Electronic Projects
Collection: http://www.wpi.edu/Pubs/E-project/Available/E-project-050410-163916/
Commonwealth Corporations. (2011). Clean energy workforce training capacity
building.http://www.commcorp.org/areas/program.cfm?ID=72&p=30
Danielson, D. (August 7, 2008). Finally, a good energy policy. Technology Review
Department of Energy. (2010). Advanced wind turbine drive train concepts: Workshop
report. Workshop Report, Retrieved Sept 26, 2011 from
http://www1.eere.energy.gov/windandhydro/pdfs/advanced_drivetrain_workshop_report.pdf
Dixon, Kristian.―Computational Modeling‖.Siemens.Lowell Massachusetts. 22 Sept. 2011
Dodge, D. (2006). In Illustrated History of Wind Power Development. Retrieved Apr. 10, 2011,
from http://telosnet.com/wind/index.html
DOE/Lawrence Livermore National Laboratory (2011, April 27). Wind turbines: In the wake of
the wind. ScienceDaily. Retrieved April 29, 2011, from http://www.sciencedaily.com-
/releases/2011/04/110426151040.htm
Dvorak, P.(2010). 2.3 MW direct-drive turbine manufactured in Saginaw. Windpower
engineering and development. Retrieved Sept. 20, 2011 from:
http://www.windpowerengineering.com/design/electrical/generators/2-3-mw-direct-drive-
turbine-manufactured-in-saginaw/
Dvorak, P.(2010).Building a better turbine. Windpower engineering and development. Retrieved
Sept. 12, 2011 from: http://www.windpowerengineering.com/design/mechanical/blades/building-
a-better-turbine-blade/
Fairley, P. (2008). Wind power that floats. Technology Review. Retrieved Oct. 4, 2011 from
http://www.technologyreview.com/Energy/20500/
Firestone, J., & Kempton, W. (2007). Public opinion about large offshore wind power:
Underlying factors. Energy Policy, 35(3), 1584-1598.
66
Follett Jr, B. (2011). In Erin Dolan (Ed.) . Portland, ME: Cianbro.
Garcia, M. L., Bray, O. H. (1997). Fundamentals of Technology Roadmapping. Retrived October
12, 2011, from: http://www.sandia.gov/PHMCOE/pdf/Sandia'sFundamentalsofTech.pdf
GE Energy. Patel, P. (2009). GE grabs gearless wind turbines. Technology Review. Retrieved
Sept. 20, 2011 http://www.technologyreview.com/energy/23517/
Geology. (2011). Rare earth elements and their uses. Geology Retrieved Oct. 4, 2011
from http://geology.com/articles/rare-earth-elements/
Granta [Software]. (2011). Mason, OH: CES edupack
Gore, A. (Producer), & Guggenheim, D. (Director). (2006). An inconvenient truth (al gore and
the environment). [Video/DVD] Paramount Classics.
Gutiérrez, E., Primi, S., Taucer, F., Caperan, P., Tirelli, D., Mieres, J., Rodriguez, C.J.,
Rodriguez, Vallano, F., Galiotis, C., Mouzakis,D. (2003). A wind turbine tower design based on
the use of fibre-reinforced composites. Retrieved Sept. 25, 2011 from
http://www.cres.gr/megawind/Project_Results.htm
Hameed, Z., & Vatn, J. (2011). Challenges in the reliability and maintainability data collection
for offshore wind turbine. Renewable Energy, 36(8), 2154-2165.
Hammons, T. (2006) Integrating renewable energy sources into European grids. Paper presented
at the Universities Power Engineering Conference, 2006. UPEC'06. Proceedings of the 41st
International, 142-151.
Harborne, P., & Hendry, C. (2009). Pathways to commercial wind power in the US, europe and
japan: The role of demonstration projects and field trials in the innovation process. Energy
Policy, 37(9), 3580-3595.
Henderson, A. R., Morgan, C., Smith, B., Sørensen, H. C., Barthelmie, R. J., & Boesmans, B.
(2003). Offshore wind energy in Europe—A review of the State‐of‐the‐Art. Wind Energy, 6(1),
35-52.
Junginger, M. F., Andre. (2005). Cost reduction prospects for offshore wind farms. Retrieved
Oct. 4, 2011 from http://www.we-at-sea.org/docs/10.pdf
Kaufman Wind Energy. (2010). Betz‘ Law. Retrieved Oct. 7, 2011 from
http://sites.google.com/site/kaufmanwindenergy/background-information-on-wind-turbines/betz-
law
Kempton, W., Firestone, J., Lilley, J., Rouleau, T., & Whitaker, P. (2005). The offshore wind
power debate: Views from Cape Cod. Coastal Management, 33(2), 119-149.

67
Kipp, M., Wilson, E.,Burke,P., Derrig, L. (2009). Stronger tower with 10% of the weight of
steel. Retrieved Sept. 25, 2011 from http://www.actr.com/geo_vs_steel.html
Kirkegaard, J. F., Hanemann, T., & Weischer, L. (2009). It should be a breeze: Harnessing the
potential of open trade and investment flows in the wind energy industry. Peterson Institute for
International Economics Working Paper, 09-14.
Layton, J. (2006). How Wind Power Works. Retrieved Apr.18, 2011, from
http://science.howstuffworks.com/environmental/green-science/wind-power.htm
Lee Wind Energy. (2011). Wind Turbine Services. Retrieved on 09/10/2011, from:
http://www.leecontracting.com/NewLeeWind/wind-energy-industry.php
Lewis, J., & Wiser, R. (2005 March 10). A review of international experience with policies to
promote wind power industry development. Retrieved April 10, 2011, from http://www.resource-
solutions.org/pub_pdfs/IntPolicy-Wind_Manufacturing.pdf
Lewis, J. I., & Wiser, R. H. (2007). Fostering a renewable energy technology industry: An
international comparison of wind industry policy support mechanisms. Energy Policy, 35(3),
1844-1857.
Logan, J. Kaplan,S., Congressional Research Service. CRS Report for Congress; Wind Power in
the United States: Technology, Economic, and Policy Issues. Location: Washington,
D.C..Congressional Research Service.
Mahony, M.(2010) New Material for longer, lighter wind turbine blades. Smartplanet. Retrieved
Sept. 27, 2011 from http://www.smartplanet.com/blog/intelligent-energy/new-material-for-
longer-lighter-wind-turbine-blades/3437
Magenn Power, I. (2011). Magenn power air rotor system. Retrieved Sept. 30, 2011
from http://www.magenn.com/
Maglev Wind Turbine Technologies. (2009). Maglev wind turbine. Retrieved Sept. 30, 2011
from http://www.maglevwind.com/maglev_wind_turbine.htm
Marcus, A. (2011). The clean tech industry faces several barriers before
implementation. University of Minnesota, Retrieved Oct. 5, 2011 from
http://tli.umn.edu/blog/management-of-technology/the-clean-tech-industry-faces-several-
barriers-before-implementation/
Marsh, G. (2007). What price O&M?: Operation and maintenance costs need to be factored into
the project costs of offshore wind farms at an early stage. Refocus, 8(3), 22, 24, 26-27.
Mass Megawatts. (2011). About mass megawatts wind program. Retrieved from
http://massmegawatts.com/

68
MDF. (2005) Problem Tree Analysis. Retrieved on October 12, 2011, from:
http://www.toolkitsportdevelopment.org/html/resources/91/910EE48E-350A-47FB-953B-
374221B375CE/03%20Problem%20tree%20analysis.pdf
Milligan, M. (2004). Wind energy economics. In Cutler J. Cleveland (Ed.), Encyclopedia of
Energy (pp. 409-418). New York: Elsevier. doi:10.1016/B0-12-176480-X/00338-7
MIT. (2011). Clean energy prize.http://cep.mit.edu/
Morgan, C., Snodin, H., Scott, N., & Raftery, P. (2003). OFFSHORE WIND economies of
scale, engineering resource and load factors. Garrad Hassan and Partners, Department of Trade
and Industry/Carbon Trust, Tech.Report,
Muller, S., Deicke, M., & De Doncker, R. W. (2002). Doubly fed induction generator systems
for wind turbines. Industry Applications Magazine, IEEE, 8(3), 26-33.
Munch, K. M., Mark. (2010). Gearbox reliability collaborative: Gearbox inspection metadata.
National Renewable Energy Laboratory. Retrieved Oct. 3, 2011from
http://www.nrel.gov/docs/fy10osti/49133.pdf
Musial, W. B., S. (2007). Improving wind turbine gearbox reliability., May 7-10, 2007.
Musial, W., & Butterfield, S. (2004). Future for offshore wind energy in the United States.
EnergyOcean Proceedings, June 2004, Palm Beach Florida, USA, , 500–36313.
National Renewable Energy Laboratory (US). (January, 2010). NREL's wind R&D success
stories. National Wind Technology Center.
Nemes, C., Munteanu, F. (2011). The wind energy system performance overview: Capacity
factor vs. technical efficiency. International Journal of Mathematical Models and Methods in
Applied Science, 5(1), 159.
Nemet, G. F., & Kammen, D. M. (2007). US energy research and development: Declining
investment, increasing need, and the feasibility of expansion. Energy Policy, 35(1), 746-755.
Nolet, Stephen.―Manufacturing‖.TPI Composites Inc..Lowell Massachusetts. 22 Sept. 2011
OCS Energy. (2011). Offshore wind energy. Retrieved Oct. 4, 2011
from http://ocsenergy.anl.gov/guide/wind/index.cfm
Office of the Press Secretary. (January 25, 2011). Remarks by the president in state of union
address.http://www.whitehouse.gov/the-press-office/2011/01/25/remarks-president-state-union-
address
Princeton Review. (2011). Green honor roll. Retrieved Sept. 3, 2011 from
http://www.princetonreview.com/green-honor-roll.aspx
69
Ragheb, A. R., Magdi. (2010). WIND TURBINE GEARBOX TECHNOLOGIES. University of
Illinois. Retrieved Sept. 20, 2011 from
https://netfiles.uiuc.edu/mragheb/www/Wind%20Power%20Gearbox%20Technologies.pdf
Richardson,R. (2010)New Design Tool improves Manufacture of Composite Wind Turbine
Blades. Power. Retrieved Sept. 12, 2011 from http://www.powermag.com/issues/features/New-
Design-Tool-Improves-Manufacture-of-Composite-Wind-Turbine-Blades_3231.html
Riegler, H. (2003). HAWT versus VAWT: Small VAWTs find a clear niche. Refocus, 4(4), 44-
46.
Romm, J. (2008, May 12, 2008). Speech part 1: Anti-wind McCain delivers climate remarks at
foreign wind company. Climate Progress, Retrieved
from http://climateprogress.org/2008/05/12/anti-wind-mccain-delivers-climate-remarks-at-
foreign-wind-company-part-i/
Romm, J. (2008, July 8). Who got us in this energy mess? Start with Ronald Reagan. Climate
Progress, Retrieved April10, 2011 from http://climateprogress.org/2008/07/08/who-got-us-in-
this-energy-mess-start-with-ronald-reagan/
Science Daily(2010) Smart embedded sensor systems for offshore wind turbines. Science Daily.
Retrieved Sept. 14, 2011 from
http://www.sciencedaily.com/releases/2010/01/100114092404.htm
SETIS (2009). In Strategic Energy Technologies Plan. Retrieved April 30 2011 from
http://setis.ec.europa.eu/about-setis/analyses/2009/report/results-wind-energy
TPI Composities, I. (2011). Plans for wind blade innovation center in Massachusetts
announced.http://www.mygreeneducation.com/plans-for-wind-blade-innovation-center-in-
massachusetts-announced/
Snyder, B., & Kaiser, M. J. (2009). A comparison of offshore wind power development in
Europe and the US: Patterns and drivers of development. Applied Energy, 86(10), 1845-1856.
Stephenson, S. (2011) Wind blade manufacture: Opportunities and limits. Composites World.
Retrived Oct. 3, 2011 from http://www.compositesworld.com/columns/wind-blade-manufacture-
opportunities-and-limits
Sterzinger, G., & Svreck, M. (2008). Renewable energy policy project.
Twidell, J., & Gaudiosi, G. (2010). Offshore wind power. Wind Engineering, 34(1), 123-124.
United Press International. (2011). New Materials for Stronger Wind Turbines. UPI . Retrived
Sept. 28, 2011 from http://www.upi.com/Science_News/2011/08/30/New-materials-for-stronger-
wind-turbines/UPI-71701314751079/:
University of Florida. (2006). Helium costs. Retrieved Oct. 3, 2011
from http://www.phys.ufl.edu/~cryogenics/hecost.htm

70
University of Massachusetts at Amherst. (2011). Wind Power: Capacity Factor, Intermittency,
and what happens when the wind doesn‘t blow? Retrieved on 10/09/11, from:
http://www.umass.edu/windenergy/publications/published/communityWindFactSheets/RERL_F
act_Sheet_2a_Capacity_Factor.pdf
U.S. Department of Energy. (2010). Wind turbine towers establish new height standard and
reduce cost of wind energy. Retrieved Oct. 3, 2011 from
http://www1.eere.energy.gov/office_eere/pdfs/wind_tower_systems_sbir_case_study_2010.pdf
Veers, P. S., Ashwill, T. D., Sutherland, H. J., Laird, D. L., Lobitz, D. W., Griffin, D. A., &
Zuteck, M. (2003). Trends in the design, manufacture and evaluation of wind turbine blades.
Wind Energy, 6(3), 245-259.
Wilhelmsson, D., Malm, T., & Öhman, M. C. (2006). The influence of offshore windpower on
demersal fish. ICES Journal of Marine Science: Journal Du Conseil, 63(5), 775.
Wiser, R. H., Bolinger, M., United States. Dept. of Energy, & National Renewable Energy
Laboratory (US). (2008). Annual report on US wind power installation, cost, and performance
trends: 2007. Location: Washington, D.C.. National Renewable Energy Laboratory.
Wiser, R. H., Bolinger, M., United States. Dept. of Energy, & National Renewable Energy
Laboratory (US). (2009). Annual report on US wind power installation, cost, and performance
trends: 2008. Location: Washington, D.C.. National Renewable Energy Laboratory.
Wiser, R. H., Bolinger, M., United States. Dept. of Energy, & National Renewable Energy
Laboratory (US). (2010). Annual report on US wind power installation, cost, and performance
trends: 2009 Location: Washington, D.C.. National Renewable Energy Laboratory.
Wiser, R. H., Bolinger, M., United States. Dept. of Energy, (US). (2010). 2009 Wind
Technologies Market Report. Location: Berkeley. Lawrence Berkeley National Laboratory.
Wiser, R. H., Bolinger, M., United States. Dept. of Energy, (US). (2011). 2010 Wind
Technologies Market Report. Location: Berkeley. Lawrence Berkeley National Laboratory.
Zabin, C., Benner, C., & Tilly, C. (2010). Clean energy workforce: A scoping study.
Zuteck, M. (Sept. 5, 2009). Hybrid multi-element tapered rotating tower (416/1 ed.). USA:
2006.01.
71
Appendix A: Wind Energy Research Workshop Notes
Turbine Blade Manufacturing at TPI Composites, Inc. – Stephen Nolet
- TPI Newton, Iowa (Blade Manufacturer)
o 1.1M Sq ft
o Critical to Application
―square/cube law‖ – max capacity factor and continue to improve Cp
minimize O&M costs through robust design and integrated health monitoring
systems
reduce rotor weight (and thus minimize height of CG)
materials technology
advanced design
robust manufacturing (to support reduced design margins)
reduce capital cost
- Advanced Manufacturing Innovation Initiative, Three Way Collaboration of Federal, State and
Private Industry
o Three-way Manufacturing Research Collaboration
3 year duration
equal funding
DOE
Iowa OEI
TPI
creation of sustainable US based Wind Turbine Blade manufacturing jobs
through increases in productivity, cycle time, quality and process
robustness
approach: commercial advanced manufacturing
resulting in: reduced labor hours per blade
increased product velocity/reduced cycle time
material efficiency (reduction in waste)
o AMII ―Projects‖
Goals: measurable benchmarks based on engineering value analysis upon project
completion
improve labor productivity by 35% (take out labor hours)
improve blade quality
major focus areas: factory modeling (factory, 3-D/Work Cell), Non-destructive
Inspection, Advanced Modular Automation, Mold Operations (kitting, material
transfer, layup, processing, assembly), Finishing
Current Projects: Non-Destructive Inspection Capabilities Evaluation (Sandia
National Labs), 2D Factory Process Flow Modeling (SNL), Optimization of
Wind Turbine Blade Production Through Projection of Laser Guidelines for
Fiber Placement (TPI), Engineering Data Software Platform (TPI), Edge
Operations (Iowa State University), Fabric Placement in the Spar Cap Assembly
(ISU), Ultrasonic Evaluation of Wind Blades to Improve Reliability (ISU),
Cutting Tables Ply Nesting (TPI), Novel Materials for Spar Cap Assembly (TPI),
Finishing Automation Strategy Study (SNL), Automation Test Platform: 3-Axis
Gantry (ISU)
- 800 – 1000 man hours per blade currently
72
Overview of US Department of Energy Wind Power Program – Mark Higgins
- Wind Power Program
o mission: is to enable IS deployment of clean, affordable, reliable and domestic wind
power to promote national security, economic growth, and environmental quality
land based utility wind (limited by what you can put on the highways –
transportation, radius of roads)
1- 5+ MW turbines
offshore
disturbed wind
o by 2035, 80% of America‘s electricity will come from clean energy sources (reduce 17%
by 2020)
o Offshore reduce cost of energy (2030 Goal = 6¢/kWh): increased rotor area, next
generation drive train (novel permanent magnet direct-drive architectures, non-linear
integrated modeling, high-efficiency power electronics), increased hub height (self-
erecting tower designs, hybrid composite platforms), optimized Balance of Station (BOS)
costs (optimized electrical infrastructure, advanced crane, cost reduction technology),
reduced plant losses, improved component useful life, improved access to sites with
higher wind speed
o Wind Power Plant LCOE: Wind Turbine Cost & Performance, Wind Plant Cost &
Performance, Wind Plant Reliability, Deployment Barriers & Costs, System Validation
o Wind Energy Today (2010) total capacity = +40,100MW (37 States)
o Accomplishments: National Offshore Wind Strategy (deeper offshore = aim), Recovery
Act (WTTC, Dynamometer Test Facility in SC, NWTC)
Overview of Wind Research Activities at Sandia National Laboratories – Tom Ashwill
- national security lab, mission to develop science
o Energy Program area home to research in:
renewable energy systems
nuclear energy systems
energy in transportation
o Innovative Blade Developments (lighter, stronger, larger blades and cost reduction)
swept blades
carbon-hybrid blade development
thick air foils (no-go aerodynamically)
sensor blades (fiber optics)
Blade with flaps for wind control
o Blade Reliability Collaborative Goals for future
goal: develop collaborative framework to determine the causes of premature
blade failure
methodology:
blade defect and damage database
inspection validation
effects of defects
analysis validation
certification testing
standards and partnerships (partners: SNL AANC, Montana state, NREL,
AWEA)
o Materials Research
73
Goal: advance the state of composite materials for large-scale wind turbine
blades
computational fluid dynamics analysis of WP-scale blades with
innovative inboard design features
Development of TANDEM code for prediction of wind turbine blade
trailing edge noise (drag goes up with noise)
Unsteady blade loading models for active aerodynamic load control
devices (trailing edge flaps)
o Structural and Mechanical Adaptive Rotor Technology (SMART)
Goal: investigate the blade fatigue load control potential of small, light-weight
control devices and control systems
focus:
field test
devices
sensors
controls
wind tunnel
o Continuous Reliability Enhancement database for Wind (CREW)
create a national reliability database for wind plants
fault rate & fault downtime, assess O&M faults
o Renewable Systems Integration
o Blade Design with NuMad -> 2D -> Digital Stimulation
o Wind Radar Program
keep noise down through rotor volume
o Current Offshore Wind Research Activities:
Offshore Structural Health and Prognostics Management
Offshore Innovation Concepts and Approaches
Large Off-shore Rotor Development
Sediment Studies
Interaction of Wind and Wave Loading Simulations
o Large Blade Innovations
100m Sandia Blade
Questions:
Number of blades -> 2 blades instead of 3?
- make them downwind, creates more drag, 3 are standard because Europeans use and developed
them
Two Control Problems in Wind Energy Systems – Mario Rotea
- Floating Wind Turbine Technology (independent of site)
o higher wind speeds and energy capture over deep waters
o incentives (site independence, mass production, assembly greatly simplified, lower
impact on human activities)
o problems (no experience, reduced accessibility, increase motion and mechanical loads)
o objective: improve reliability, reduce O&M costs, add new degrees of control

74
o Floating Turbine with tuned mass damper: NREL 5-MW turbine model and Tuned mass
damper (system in nacelle, fore-aft translation)
- Structural Control System
o sensor systems
tower top acceleration in fore-aft
platform pitch acceleration
o control signal
force f on nacelle
o design process
o Two Processes: Ideal and Practical
o Impact: more reliable wind turbine -> reduced O&M , lighter wind turbine
- Control of Battery Storage Systems for Wind Energy Applications
o Intermittency Issue – combined power of wind farm and the battery storage system (BSS)
to grid
BSS is controlled by commanding the battery current
objective: to minimize the error between the output power of system and an
operator reference power over an optimization horizon H
battery life objective: need better and better models to quantify the life of a
battery
problem: find the command current going out of control system to maximize
battery life and power output
solution: performance, battery life analysis, find best compromise
- strategy is modular, control technology = improve reliability, efficiency and enable the
integration of wind energy and storage systems
Questions:
- Where should you put the accelerator?
o part of research as to where the best placement is, conceptual and looking at masses
Storage Energy
- Overview of Energy Storage Technology
o Batteries: Lead Acid, NiCd (Longer life cycle, has memory), Flow batteries
o Compressed Air Energy Storage
- Energy Storage for Integrating Wind
o multifunctional tool
renewable ramp management (absorb sudden changes in wind farm output, acts
as a buffer) Denmark
Tehachapi Storage Project (2nd
largest wind park in world)
operational in 2012
System Uses: provides system capacity and resource adequacy, black
start and wind firming
Market Uses: frequency regulation, spinning and non-spinning reserves
- Flywheel Technology Energy Storage for Grid Services
o Beacon Power – supplier of fast response frequency regulation through flywheel use
1st 20 MW Flywheel Plant – NY, 2nd
20 MW plant – PA
Flywheel: goes into plant building blocks
composite rim, magnetic bearing, hub, motor, vacuum chamber, shaft

75
strong IP position, 20 yr design life, 2-3 times more effective than fossil
generators, 125,000 life cycles
Idea: Renewables need more regulation
Grid Asset – energy storage-based regulation, separate from generation and
demand response, net at wholesale price
- Electrical Energy Storage: A Utility Perspective on Distribution Applications
o Shaping and Forecasting Power Output, Wind Energy is inconstant
o Storage types:
conventional technologies:
pumped storage hydro
fixed volume/package batteries
flow batteries
flywheels
super capacitors
superconducting magnetic coils
hybrid systems
o distribution systems:
substation
renewable energy sites
distribution transformers
o Lithium-ion family, flow batteries, substations all promising
Questions:
- efficiency of flywheel = 85%
- middle of the ocean offshore could be a good option
- one of the changes that needs to happen is to limit the lost amount of energy, waste time of the
generator to account for fluctuating of the power, burning fuels unnecessarily vs. not hitting the
highest amount of energy output possible
- wind has the ability to move quickly and you have to give up something to optimize
- research gaps: communication problems, prospering evaluating (cost, performance, life cycle),
introducing the technology, how to get the new technologies working, ORGANIZATION,
recharging time/ability, bring down energy storage cost -> producing more drives cost
down/selecting the best storage device for operation, environmental costs (lithium = RRR), citing
and permitting, portability,
MAKE Consulting
- economy has turned hypercompetitive, incentives are due to run up in 2012, gas needs to get up
to $6 or 7 to make wind more competitive, tier two venders are struggling to stay in the market,
tier three are leaving the market, discussions depend on costs and demand, strategic components,
oversupply in the US wind market, technology and manufacturing efficiency critical,
- technology focus
o PMG - permanent magnet generator
o Direct Drive (reduce overall nacelle weight by 50%)
o Bearing Design
o Blade Design and Manufacturing
o Casting Manufacturing
- WTG Rotor Programs Define Market Leaders
o increase energy capture, reduce CoE

76
saturation of high wind sites and transmission bottlenecks have pushed
developers to explore sites with lower wind speed
- Turbine Vendors and Blade Suppliers all focused capacity factors
- Generator Selection Impacting Drive-train Architecture More than Ever
- Reduction of CoE is central theme
o lower service cost without the size/weight penalty
o permanent magnet generators offer enhanced efficiency at partial load conditions,
increase criticality of power conversion technology
- Diversification and Differentiation Critical
o component supplier positioning
o consolidation activity across the globe
moving towards industrialization and mass production suppliers
Workforce and Economic Development
- group trends, workforce development, higher ed/governmental organizations
Need engagement with industry, what/who do they need to attract?, how to
prepare a region for expansion within the wind industry?
o ―Green‖ Definitions
Economic Impact Definitions
Workforce Development Definitions
Environmental Protection Definitions (carbon footprint)
o Current Studies
Renewable Energy Employers are Outpacing the Nation in Job Growth
Sector is small, in MA, wind is major technology
wind is no exception
strength throughout value chain and specific proximity
o Workforce Findings
Difficulties Reported in Finding Qualified Workers
High-skill (Engineers, Prof. Staff, Ect), Jobs are important
Pathways are difficult
Significant Opportunities for Incumbent Worker Training
Employer Engagement is Critical
- The Path to Tomorrow‘s Energy, More Energy Less CO2 – Renewable‘s Workforce
o Site Worker
Wildlife & Critical habitat, utility-scale wind resources, proximity to existing
high-voltage transmission, landowner interest, highway access for materials
delivery, preliminary wind energy project study area
o Opportunities in Wind Industry
Technical (Environmental Services, Engineering Design)
Non-technical (Policy Issues)
o Workforce Development
community and undergraduate educational options
need to have cooperation, communication between
organizations/governments/states/schools
- Workforce Development to Meet Current and Future Needs
o DNV – global consulting and wind services (assessments and turbine testing)
need professionals (mechanical/electrical/civil engineering, business
management, atmospheric science, construction supervision, offshore)
with knowledge/experience of wind industry (technology, development activities,
business conditions)

77
o DOE Workforce Development Grant
6 modules (intro, assessment, systems, installation/integration/operations,
feasibility, economics)
o Internal training activities
wind pros and employees new to DNV
- Wind Industry: Economic Development Opportunities (Maine)
o supply chain (global issue)
construction/installation
maintenance and operation
o expertise that attracts investment
existing industry with transferable skills
experience in wind energy
existing industry exporting wind energy products
workforce availability
training and education
Questions
- could possibly take skilled workers in other industries that are out of work or losing work that
could benefit wind industry, give them experience and use their skills, help unemployment
- need current wind farm/wind engineers to get people interested
- develop training for rapid turnaround capability for the industry (months instead of years)
Offshore Wind
- EnBW -> Germany (6 hrs to assembly turbine, goal = 1200 kW)
- Why offshore wind?
o stronger winds that could power our onshore needs
o Mass has more offshore in shallower waters, less expensive
o uses very minimal water, water is going to be a scarce resource
o run at higher tech speeds
o larger turbines because less turbines are cheaper
o challenges:
rotor blade
new materials
two piece or multiple pieces
independent blade pitch control
active loads feedback with sensors
New Tower Concepts
composite materials
lighter and corrosion resistance
tower with feedback controls
Drive-train
Site Specific
- Offshore Wind Collaborative, Cape Wind
- Need public-private/academic relationships
- Permitting
- DeepCwind (spar buoy)
o challenges:

78
fixed foundations costs
floating: mass production, installation is less expensive
o objectives:
verify coupled aeroelastic-hydrodynamic models
support Maine floating farm development
evaluate the use of advanced composites
education and outreach
o design was completed in September, 2011 and prototype should be floating next fall
o Monhegan Island, 10 miles off mainland
Questions
- Flutter
- Seasons, Winter (more electricity demand, stronger winds?)
- Deep Water Offshore Wind
o Hydrogen design
o Problem is that money is drying up, should the government step in? Environmental
policy? commercial demonstration -> technology demonstration
Computational Modeling
Focus of this talk was the modeling used to determine the aerodynamics of turbine blades.
These models help determine entire turbine; Blades drivetrain and generator
Models can take a long time to run (days) if chasing 100% accuracy; a tolerance needs to be
better determined; Siemens usually chases 90%
Optimization model(surrogate short running optimization models) should ideally run in less than
one day
Models need to be implemented to better understand wake effects. Entire wind farms should be
modeled
Modeling has gained credibility ( from ―pretty pictures‖)
o Used to certify and inspect Boeing‘s 777 and Nuclear Weapons
Model V+V. (Verification and Validation)
o All models must be compared to experimental data (with better scaling understanding)
o Good Models should provide ―the right answer to the right questions for the right
reasons‖
o Verification: Solving the equations correctly
o Validation: Solving the right equations
Strong focus on offshore floating platforms
Testing by University of Maine
o Data and Simulation have some significant irregularities
DOE wants better models; Especially for total farms not just singular blades and turbines
DOE wants more experimental data to back up the models. Most are just estimates.
DOE wants better structural modeling to understand defects and how they affect the entirety of
the blade.
Grid operators want software to better model power output; Spot Buying electricity is incredibly
expensive; and potentially life threatening for wind farms.
DOE would like to help consolidate codes 200 to 10; Most Private companies and National Labs
use their own specific code; even though they are repetitive of each other.

79
Data proven computational modeling could help massively cut time and financial cost of third
party certification.
Federal Company will consolidate programs by using consortiums and producing publically
available codes. Publically there is no time line set, privately yes there is.
Los Alamos currently working on experimental testing of array systems.
Better communication among everyone is needed
Structural Health Monitoring and Non-Destructive Inspection
Fiber-Optic sensor systems can be used to measure strain. Bending of fiber changes wavelength
in light received to sensor. 1 fiber as opposed to 2 or 3 wires
Laser Blade monitoring; Measures point deflection on the surface from use of stereo cameras.
Theory is to create model; input measurements in real time; complete model simulation
Non Destructive Inspection through ultra sound, thermograph, digital image cartography.
NREL uses metal foil strain gages, big problem is properly interpreting dozens of point
measurements and accurately portraying the entire blade.
Digital Image cartography: Stereo Cameras; accuracy similar to that of laser micrometers
Free standing system that doesn‘t add complexity to the blades
Main focus here is to better determine defect tolerance.
Full Scale Structural Testing of Wind Turbine Blades: State of the Art and Future Outlook –
Nathan Post
- NREL, Colorado, Testing Center
o Capabilities:
Field Testing
small and mid-size turbines
MW-size turbines
Drive Train Testing
dynamometer
Blade Testing
wind and water
o Blade testing labs: WTTC/MassCEC, NWTTC, Boulder, CO
Testing sis a certification requirement (can withstand design/test loads and
validation)
Validate blade design (stress/strain, ultimate strength, buckling margins,
stiffness, properties constant with design)
o Tests: (duration 5-8 months)
Test design and preparation
Measure weight and balance
Natural frequency test
Static Test (Max flap, min flap, max edge, min edge)
Natural frequency test
Fatigue test – flap 1 to 5 mil cycles
Fatigue test – edge 1 to 5 mil cycles
Optional static test to failure
o Static Testing:
test ability of blade to withstand design load cases or ultimate strength as
required
80
4 50 6 load vectors through cranes, ballasts
Objectives: simultaneous smooth loading on all saddles, quickly rotate black and
change turning block positions to reduce overall time, lighter weight saddles so
live loads are larger portion of total load, new load introduction methods with
less stress concentrations?
o Fatigue Life: test ability of the blade to withstand operating-life loads (single-axis, two-
axis, forced displacement, resonant)
o Forces on a wind turbine blade – blade must withstand internal moments, cannot deform
too far under drag, subjected to variable loads
o Fatigue of composites and composite structures
oscillating stresses
cause fatigue damage
reduce strength and stiffness
failures at stress < initial strength
o Accelerated full-scale fatigue testing
add the years of fatigue load to blade to anticipate fatigue after 20 years
o Fatigue Goals: achieve the best method/batch of testing possible in least amount of time
and cost
WTTC – Rahul, Executive Director of WTTC Mass CEC
- MA Large Blade Testing Facility: Wind Technology Testing Center
o can test up to 90m blades
o 150ft wide, so can test flexible blades
- Wind industry has requested DOE/NREL for several years to develop better testing infrastructure
in US
o May 2011 officially opened
- Why?
o Jobs
o Increase reliability, decrease cost of energy
o Turbine certification
o Max static bending moment 84 mega Newton meter
test stand made of concrete and steel
o have NREL UREX Fatigue test system
o static test system is hydraulic based
o bi-axial fatigue testing
o flap fatigue testing
Wind Turbine Engineering R&D – Curtt Ammerman
- LANL‘s internally funded, 3 year wind energy research project
o High Performance Computation wind turbine/plant simulation
o Experimental wind turbine aerodynamics databases
o advanced multi-scale sensing
o Based on R&D 100-winning HIGRAD/FIRETEC fire simulation
o WindBlade: Turbulence of multiple scales (Las Vegas, NM)
realistic heterogeneous vegetation and terrain contribute to turbulence
used for siting and installation location
take into account the vegetation around projected site and downwind of potential
turbine

81
LF-PIV ready for Large-scale field experiments (overcoming deployment
barriers for wind turbines)
Rotating PIV Diagnostic Development (R-PLV)
real time data on a real turbine in the field through camera on hub
o Multi-Scale Sensing at LANL
provide experimental data to
validate physics-based numerical models
estimate current state of structure
predict future load characteristics
Active Sensing SHW Techniques
lamb wave propagations
high-frequency response functions
o Sensing Project Culminates with full-scale flight test
full range of instrumentation of three, 9-m blades
SHM rotor blade
blades 1-3
Tower-mounted sensors to monitor upstream and downstream flow conditions
results flow to databases
Computational Modeling and Simulation Panel Summary
- unsteady, nonlinear, nulit-physics, multi-scale & economics problem
o aero, structural, acoustics, waves etc.
complicated, multicale flow problem
complex interaction of physics and scales
Lots of degrees of freedom
offshore environment
current design codes have shortfalls
economics challenges
minimize
needs to be a predictive science:
o right answers to the right questions for the right reasons
validation and verification
o validation: solve the correct equations
o verification: math is correct
propagation/quantification of uncertainties
need computational and experimental efforts that generate and compare DATA
need experiments to compare computations
need less efforts to re-invent the computational wheel and more focus on
data-driven computations
o there seems to be some repetition/overlap between industry, academia & government
regular meetings and workshops that encourage collaboration and
communication
o how do/can computations encapsulate standards that define practical aspects of turbine
technology?
o wishlist:
1--% correct multi-physics simulations
best solution for lowest cost

82
optimization turnaround in one day
verification and validation tied to computations
data driven computations and analysis
experiments
hardware in the loop
data/physics driven computations
Economical methods for small business developers
Distilling computational options
open source of standard tools
smaller number of good codes than large number of similar codes
variety of effectively chosen fidelity levels to answer appropriate
questions
optimization and faster turnarounds
more acceptance of optimization methods
examine appropriate fidelity levels for answering questions
parallelization of stand codes
models for control with appropriate metrics
Energy Storage Technologies
- is multi-function tool
o smoothing and firming
smoothing: absorb sudden changes in wind farm output
firming: time shifting and proved energy when wind isn‘t blowing and forecast
hedging
o must think of it in terms of the grid and not just wind power
- capability gaps that currently exist in industry:
o electric power is drawn from the grid to and stored in electric car batteries
o we know the chemistry of batteries work, just need to adjust costs
o regulatory commission
o need better performance metric for energy storage systems
o recycling of batteries is problem
o increasing wind energy as a percentage of total power generation increase the need for
power regulation
o most utilities currently look at more centralized energy storage systems over private
systems in homes
o how does one monetize energy storage? incentives? who pays for what?
o power plants usually have to reduce total output to allow for internal power regulation
- research gaps:
o batteries are still very high in cost
o oil will run out in future
o must research thermal management of battery systems
o what about using compressed air or hydropower? siting of these systems and acquire
adequate permits
o storage management systems that include performance and ―life or durability‖ of storage
solution
o ammonia? hybrid wind farm, a third the energy density of gasoline (hazardous, no
greenhouse gas, could cause cyanide)
Workforce & Economic Development Activities

83
- job market trends & workforce development issues
- partnership with UMass campuses and other workforce development stakeholders
- Clean Energy Workforce Development Forum (6/4/09)
- Clean energy working group meetings
- Collaboration with MassCEC
Gaps:
- employer engagement is critical
- renewable energy employers are outpacing the nation in job growth
- difficulties reported in findings qualified workers (engineers, pro staff)
- technical and non-tech (business) jobs available, skilled workers needed
- need for professional course
o outline: intro to wind energy, wind resource&meteorology/energy assessment, turbine
s/ms and components, installation/integration/operation
- supply chain jobs: construction/installation and manufacturing
- 54 GW of offshore wind power translates to 162K jobs, types of direct jobs: 59% turbine and
component manufacturing, 16% installation, 11% maintenance and operations
- SKILLED WORKERS AND JOBS! encourage youth
Offshore
- Problems:
o liability of components, supporting infrastructure
o farther out, less known and less experience
o ―get steel in water and see what happens‖, different depths
o who pays for this? collaboration, work together (industry, academia, gov)
o splintering of efforts in region stiffened affect, lose your critical mass
o regional collaboration
o balanced financial roadmap, now there is no guarantee that the financial purse is there to
support offshore for R&D, demonstration and deployment
o needs to be a clear regulatory service, state and federal, no process in place, needs to be
an action forcing event
o top down involvement of people while we do the ―grass roots‖, need support of the
offshore and expect the political support, can‘t assume of political and economic support
o take it among ourselves to advocate offshore
o work with other industries that have money (oil, natural gas, coal)
o expand the definition of who benefits from wind industry, easier for politicians and
investors
o INNOVATION! different kinds, designs, hybrids, more artistic ability, storage
Manufacturing
Problems:
- Aerospace manufacturing costs are not acceptable for wind turbine blades
o aerospace 200-700 per lb
o blades $5 – 7 per lb
- Automation
o currently limited to material handling and pattern cutting
o hard to justify cost of the needed multi-axial machines required for placing of fabrics in a
mold

84
- Defects
o defects in materials received from suppliers
o location of defects
o if defects have to be in the composite, can the process be designed to push them into
areas that are ―not critical‖
o current ASTM standards not necessarily applicable to size of defects in blades
- Processability
o how to develop composite materials using off the shelf items
o resin-fiber systems research
- Modeling
o need for high fidelity predictive modeling for manufacturing and for structural behavior
- Residual Stress Prediction
- Time from concept to production is very short for blades
- Cycle Time
o cure time for adhesives
o time to infuse then wait to cure
Panel Motto: ―Variability Happens‖