directing cell motions on micropatterned ratchets
TRANSCRIPT

ARTICLESPUBLISHED ONLINE: 14 JUNE 2009 | DOI: 10.1038/NPHYS1306
Directing cell motions on micropatterned ratchetsGoher Mahmud, Christopher J. Campbell, Kyle J. M. Bishop, Yulia A. Komarova, Oleg Chaga,Siowling Soh, Sabil Huda, Kristiana Kandere-Grzybowska* and Bartosz A. Grzybowski*
Cell motility is a process deriving from the synchronized dynamics of the cytoskeleton. In several important physiologicalprocesses—notably, cancer metastasis—the randomly moving cells can acquire a directional motility phenotype and bias theirmotions in response to environmental cues. Despite intense research, however, the current understanding of directional cellmigration is incomplete and there is a growing need to develop systems that would enable the study and control of this process.This article demonstrates that random motions of motile cells can be rectified by asymmetric (‘ratchet’) microgeometries.Interactions between the cells and the imposed geometrical cues guide cell polarization and give rise to directional motility.Depending on the ratchet design, cells of different types can move either in the same or in opposite directions on the sameimposed pattern. In the latter case, it is possible to partially sort mixed cell populations into different collecting reservoirs.
In the presence of asymmetric potentials generated bytime-dependent external fields1–5 or by asymmetric geometricalobstacles6–10, objects agitated by random noise can move
directionally. This so-called ratcheting phenomenon11–13 hasattracted considerable scientific attention and has been studiedextensively in quantum5, (bio)molecular14, nanoscopic7,15 andcolloidal4,8 regimes—albeit, with relatively simple entities (suchas electrons3, small molecules16, proteins17, biopolymers9,14 andmicroparticles10). Here, we show that far more complex andautonomous random movers18,19—specifically, motile cells—canalso bias their motions over large distances through their in-teractions with asymmetric geometrical cues. When confined toratchet-shaped micropatterns, the cells reconfigure their internalmotility machinery and undergo sequences of morphologicalchanges that ultimately translate into biased/directional cellmotion. Fluorescent imaging suggests that this breaking ofspatial symmetry is due to the reorganization of actin bundles,which, in turn, determines the direction of a cell’s lamellipodialprotrusion20,21 and cell polarization22,23. Biased cell motion can berationalized by energetic considerations, and the degree of observeddirectional preference can be modelled by probabilistic methods.The phenomenon of cell ratcheting applies to different cell typesand to mixed cell populations. Remarkably, in the latter case,ratchet geometries can be designed that cause cells of differenttypes to migrate in opposite directions. This capability derivesfrom the differences in the morphologies of cell protrusions andprovides a basis for microsystems that can partially sort mixedcell populations (here, cancerous versus non-cancerous cells) intospatially disjoint microreservoirs. The microratchets described inthis work provide a conceptual alternative to cell guidance usingchemical gradients24–28, which degrade over time and are based oncell-specific chemoattractants (unknown for most cell types). Incontrast, microratchets preserve their function unless mechanicallybroken and can guide cells of different types.
Unidirectional ratchetsTracks for cell locomotion were microetched in glass/Ti/Ausubstrates29,30 and the unetched portions of gold were protectedwith oligo(ethylene glycol) alkane thiols known to resist celladhesion31–34 (Fig. 1a and see the Methods section). When the cells
Department of Chemical and Biological Engineering and Department of Chemistry, Northwestern University, 2145 Sheridan Rd, Illinois 60208, USA.*e-mail: [email protected]; [email protected].
were cultured onto the micropatterned substrates, they localizedexclusively onto the etched, unprotected regions. If these regionswere bounded in all directions and separated (for example, theequilateral triangular islands shown in Fig. 1b, top), the cells spreadon them but did not move. The cells also remained stationaryon more elongated triangles such as those used by Whitesidesand co-workers35. If the regions were bound along only onedirection, (that is, straight lines, Fig. 1b, middle), the cells movedrandomly in both directions but with no net bias. To guide cellmotions, the tracks had to be connected and have asymmetric,ratchet-like geometries distinguishing between the two possibledirections of motion.
Figures 1b (bottom) and 2 show one such geometry inspiredby well-known fluidic rectifiers36. Here, M = 5 etched trianglesare connected by narrow openings, and either B16F1, Rat2 orMDA-MB-231 cells (initially randomly distributed) move prefer-entially in the ‘funnelling’ direction of the patterned triangles—thatis, in the direction of a unit triangle’s vertex with an opening to thenext triangle (henceforth, ‘bias direction’). To analyse the degreeof this preference and its relation to various system parameters, wequantified it in two ways: (1) on the ratchets, by tracking multiple(>14) cells for extended periods of time (typically, 16 h in 1 hintervals; >220 data points; Table 1 and Supplementary SectionS1c) and calculating the percentage of ‘steps’ these cells took in thebias direction, b1= (nrachetbias /n
rachettotal ) ·100% and (2) in the reservoirs at
the ends of the ratchets (from counts of fixed cells; see Fig. 2a), asthe percentage of cells accumulated in the reservoir along the biasdirection, b2 = (N reservoir
bias /N reservoirtotal ) ·100% at a given time. The first
of these measures provided information about short-range bias; thesecond determined the ratchet’s ability to guide cells over longerdistances (0.3–1mm). The optimized values of both b1 and b2 forvarious cell types are summarized in Table 1. In the following, wefirst discuss the nature of the intracellular processes that give rise tothe asymmetry of motion (that is, b1, b2> 50%) and then focus onthe parameters (system’s geometry, dimensions and so on) affectingthe b1 and b2 biases.
The origin of asymmetric cell motionsThe changes in the cells’ cytoskeleton during cell migration onthe ratchets were studied in a series of microscopy experiments.
606 NATURE PHYSICS | VOL 5 | AUGUST 2009 | www.nature.com/naturephysics
© 2009 Macmillan Publishers Limited. All rights reserved.

NATURE PHYSICS DOI: 10.1038/NPHYS1306 ARTICLES
Time (h)
Glass substrate
Glass substrate
30 nmAu
EG SAM
Agarose/etchant
Glass substrate
300
300
300
0
0
0
¬300
¬300
¬3000 4 8 12 16
Dis
plac
emen
t (µm
)
a b c
Figure 1 | Fabrication of substrates for cell locomotion and motility characteristics of cells on various micropatterns. a, Anisotropic solid microetchingfor cell micropatterning uses a micropatterned agarose stamp soaked in TFA Transene etchant to remove the patterned portions of a thin gold film. Oncein contact with the substrate, the stamp acts as a two-way diffusive pump constantly delivering the etchant to the gel–substrate interface (orangearrows), while removing the etching products into its own bulk (violet arrows). As etching does not require pre-masking of the unpatterned surface,gold surrounding the transparent areas can be subsequently derivatized with a high-quality, cell-resistant self-assembled monolayer (here,(HS–(CH2)11–(OCH2CH2)6–OH, ProChimia); EG SAM). The ‘eye’ indicates the position of the objective/imaging direction from below the pattern andthrough the flat cell–glass interface. b, Cells on disconnected triangles do not move (also see Supplementary Section S2a); cells on straight lines moverandomly in both directions; cells on triangular ratchets move directionally. The white dotted lines delineate boundaries of the micropatterns. All imagesshow B16F1 cells. Colour coding: actin (green) is stained with fluorescent phalloidin, DNA (blue) is stained with Hoechst 33342 dye. The scale barcorresponds to 50 µm. c, The green lines give trajectories of typical cells on the patterns shown in b. The red lines correspond to net cell displacementafter 16 h.
Table 1 | Statistics of the motility of cells on different types of pattern.
Pattern Direction ofmigration
Cell type/substrate* ;serum conc. (%)
Bias b1 from ratchets†
Bias b2 from reservoirs‡
B16/Fn§
2 50.6% (n= 14/m= 224) 49.7% (NT= 2,047,R=9,Z=0.43)
B16/Fn§
2 No cell motion No cell motion
B16/Fn 0.5 59.0% (n= 38/m=608) 65.1% (NT= 1,250, R= 32,Z= 10.40)
2 54.6% (n= 17/m= 272) 60.9% (NT= 10,857, R= 32, Z= 21.04)10 56.1% (n= 20/m= 320) 55.4% (NT= 39,828, R=96,Z= 20.37)
Rat2/Ln 2 61.0% (n= 16/m= 256) 60.6% (NT= 2,699, R= 13, Z= 10.61)10 68.0% (n= 25/m=400) 61.8% (NT= 1,122, R=45,Z= 3.23)
MDA-MB-231/Ln 10 57.3% (n= 22/m= 352) 59.7% (NT= 1,420, R= 21, Z= 7.31)
B16/Ln 10 54.9% (n= 14/m= 224) 54.8% (NT= 11,460, R=61, Z= 10.2)Rat2/Ln 10 62.8% (n= 15/m= 240) 55.8% (NT= 5,874, R= 29,Z=8.59)MDA-MB-231/Ln 10 58.2% (n= 14/m= 224) 56.3% (NT=934, R= 11, Z= 3.85)
Straight lines (no bias), disjoint islands (no cell motion) and two types of ratchet (biased motion). All ratchets had M= 5 unit cells, each of area a∼ 1,300 µm2 .
*Fn: fibronectin; Ln: laminin.†
The biases b1 were based on live cell imaging. The typical standard deviations in b1 were of the order of 1–3%. The values of n/m give the total number of analysed cells and data points (16 one-hourintervals per cell).‡
Reservoir biases b2 were calculated from the counts of cells fixed with formaldehyde in the reservoirs after 48 h. NT is the total number of cells analysed over R reservoir arrays (∼5 ratchet systems perone coverslip used). The values of Z= (b2−0.5)/
√0.25/NT = (2b2− 1)
√NT are the Z scores of the so-called p test. To determine the validity of the hypothesis (with 99% confidence) that the bias on
straight lines is statistically equivalent to 50%, Z must be less than 2.576. For the ratchets, verification of the hypothesis that the bias is statistically greater than 50% requires Z> 2.576.§
These indicate that qualitatively similar results (that is, no bias on lines and no motion on disjoint islands) were also observed for the Rat2 and MDA-MB-231 cells. We note that no statistically significantreservoir biases were observed immediately after cell plating, t= 0. This was confirmed by the statistics taken over R= 31 reservoir arrays and NT = 7,727 cells, for which the average value of b2 was49.5% with Z=−0.88 not significantly different from 50% or no bias (also see Supplementary Section S3).
Figure 2b–d (also see Supplementary Video S1’) illustrate a typicalsequence underlying the guided motion of a B16F1 cell startingfrom one of the ratchet’s triangles. Initially, the cell conforms to theshape of this triangle. Subsequently, it forms a large lamellipodialprotrusion into the next triangle and polarizes (as demonstratedby the distribution of Arp2/3 polarity markers) in the direction ofthe bias. The lamellipodium ‘funnels’ into the next triangle where it
spreads both forward and sideways to ‘anchor’ against the back-sideand corners of the forward triangle (indicated by asterisks in Fig. 2b;also see the focal adhesions in Fig. 3b and Supplementary VideoS2). Although lamellipodial extension in the ‘backward’ directionis sometimes also observed, it is less persistent and cannot ‘anchor’against the smooth, ‘funnelling’ sides of the back triangle (indicatedby arrows in Fig. 2b). Overall, the protrusion in the direction of the
NATURE PHYSICS | VOL 5 | AUGUST 2009 | www.nature.com/naturephysics 607© 2009 Macmillan Publishers Limited. All rights reserved.

ARTICLES NATURE PHYSICS DOI: 10.1038/NPHYS1306
151 110
00:10:00
01:00:00
02:00:00
03:00:00
04:40:00
a b c d
Figure 2 | Directional cell migration on connected-triangle ratchets. a, Distribution of B16F1 cells on a pattern of two reservoirs connected by ten ratchetsat 48 h after cell plating (serum concentration 2%). The 57.8% bias illustrated here corresponds to 151 cells collected in the left reservoir and 110 cells inthe right one. The red arrow indicates the bias direction. Colour coding: array, grey; actin, fluorescent phalloidin, green; DNA, Hoechst 33342, blue. Thescale bar represents 250 µm. b, Low-magnification, phase-contrast live images of a B16F1 cell migrating on a ratchet. Live cell imaging were acquired every10 min. The red dotted lines outline the cell edge. The patterned geometry constrains the cell shape and determines the cell polarity. The cell migrates byrepeating a cycle of protrusion (at the cell’s leading edge, in the ‘funnelling direction’) and retraction (at its rear). At∼10 min after plating, the cell adopts atriangular shape, extends a protrusion into the nearest triangle (∼1 h), stretches over two triangles (∼2 h), moves its nucleus over the narrow openingbetween triangles (∼3 h) and finally contracts its rear while extending a protrusion into the next triangle (∼4 h 40 min). The scale bar represents 50 µm.c, Distribution of polarity markers (Arp2/3 complex, seen as yellow on overlay images with actin) and organization of actin cytoskeleton (fluorescentphalloidin, green) in cells fixed on the ratchets. The images correspond to different stages of cell migration shown in b. The Arp2/3 complex localizespreferentially at the cell’s front (that is, in the bias direction). Most pronounced actin stress fibres are along the cell’s sides (to constrain the shape of themigrating cell) and at its rear (to help retract its tail). Enhanced accumulation of actin in a lamellipodium at the cell’s front reveals actin polymerization intoa network of branched actin filaments pushing the membrane forward. The scale bar represents 50 µm. d, Phase-contrast images corresponding to those inc. The scale bar represents 50 µm.
bias wins this ‘tug-of-war’, and the cell propels itself along the biaswhile retracting its tail.
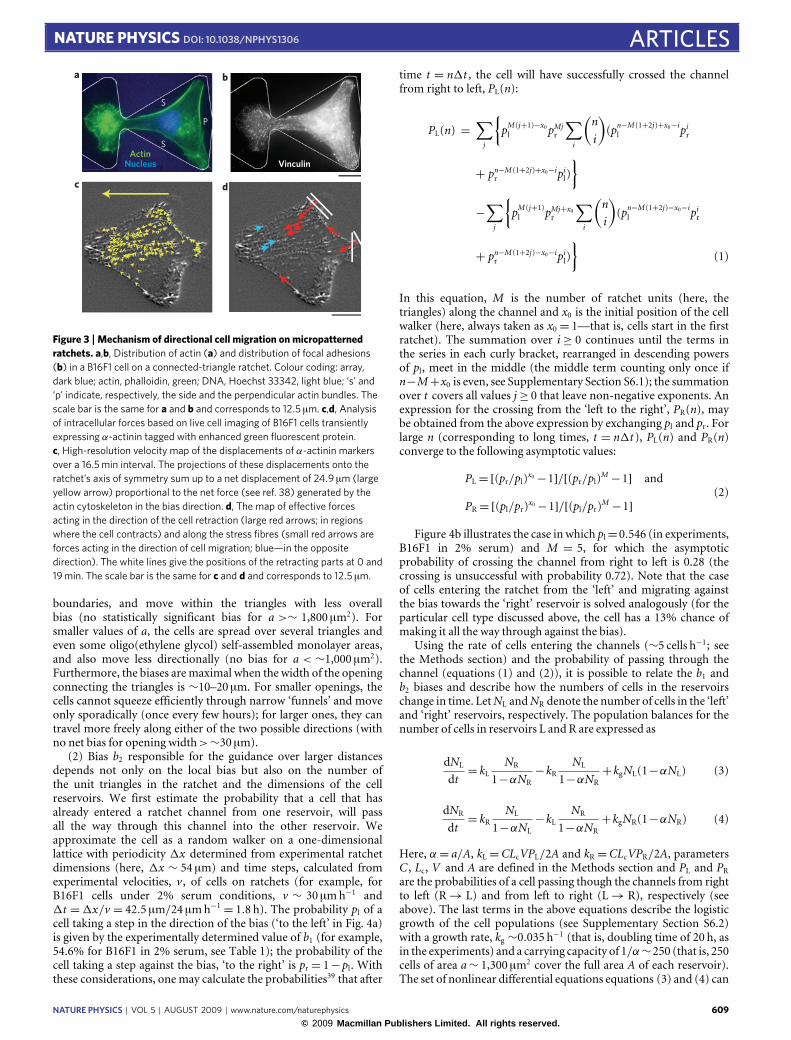
The preferential formation of a lamellipodium in the biasdirection reflects an asymmetric distribution of actin and focaladhesions in a cell subject to the ratchet’s geometry. This isillustrated in Fig. 3a, b, which shows pronounced actin bundlesrunning along the edges of a unit triangle and ‘connecting’ thepoints of highest curvature (that is, spiked edges where most focaladhesions form30,34). If the triangle were isolated, these bundleswould ‘converge’ at all three of the triangle’s vertices (see Fig. 1a andSupplementary Section S2a). On the ratchets, however, the cornerfunnelling into to the next triangle is ‘open’ and the ‘side’ bundles(indicated by the letter ‘s’ in Fig. 3a) do not converge/connect,leaving between them space through which a lamellipodium canform without disrupting the bundles. In sharp contrast, the bundleat the ‘back’ of the triangle runs perpendicular (denoted ‘p’ inFig. 3a) to the ratchet’s axis of symmetry, and if the lamellipodiumwere to form into the ‘back’ triangle, this bundle would first haveto be disrupted/broken at an energetic cost that can be roughlyestimated37 to be ∼5× 10⁻¹⁸ J (from the known energy neededto break one actin filament, 2.38× 10⁻¹⁹ J, multiplied by the ∼20filaments in one stress bundle). Therefore, it is easier for thecell to make a lamellipodium along the direction of bias thanagainst it. Once the lamellipodium forms and focal adhesionsattach to the substrate, the cell’s stress fibres reorganize (seeSupplementary Section S5).
Analysis of intracellular forces (by high-resolution velocitymapping of the actin stress fibre crosslinker, α-actinin38) in acell trying to enter a new triangle reveals (Fig. 3c, d) that thesecontractile elements straighten up and align, and that the net forceacting on them is directed in the bias direction. At the same time,the forces acting on the cell’s rear cause this part of the cell to retract.
Although this explanation of ratcheting is certainly oversim-plified in terms of the energetics involved, it can account—atleast qualitatively—for the origin of the asymmetry underlyingcell ratcheting. Also, a similar sequence of events is observed forMDA-MB-231 and Rat2 cells. We note, however, that the Rat2 cellsare more elongated than either B16F1 cells or MDA-MB-231 cells,and in addition to broad lamellipodia, they often form elongated‘exploratory’ protrusions extending over more than one triangleahead of the cell’s body (see Supplementary Video S3).
Design and theoretical considerationsThe design of efficient ratchets requires understanding andoptimization of several parameters of the system (see Supple-mentary Section S7).
(1) The ‘local’ bias b1 reflecting the asymmetry of cell motiondepends predominantly on the dimensions of the individual,unit triangles. The largest biases are observed when the areaof the unit cell, a, is commensurate with the area of a cellspread on an unpatterned surface (here, a∼ 1,300 µm2). On largertriangles, cells cannot interact simultaneously with all imposed
608 NATURE PHYSICS | VOL 5 | AUGUST 2009 | www.nature.com/naturephysics
© 2009 Macmillan Publishers Limited. All rights reserved.
NATURE PHYSICS DOI: 10.1038/NPHYS1306 ARTICLES
VinculinActin
S
S
P
Nucleus
a b
c d
Figure 3 | Mechanism of directional cell migration on micropatternedratchets. a,b, Distribution of actin (a) and distribution of focal adhesions(b) in a B16F1 cell on a connected-triangle ratchet. Colour coding: array,dark blue; actin, phalloidin, green; DNA, Hoechst 33342, light blue; ‘s’ and‘p’ indicate, respectively, the side and the perpendicular actin bundles. Thescale bar is the same for a and b and corresponds to 12.5 µm. c,d, Analysisof intracellular forces based on live cell imaging of B16F1 cells transientlyexpressing α-actinin tagged with enhanced green fluorescent protein.c, High-resolution velocity map of the displacements of α-actinin markersover a 16.5 min interval. The projections of these displacements onto theratchet’s axis of symmetry sum up to a net displacement of 24.9 µm (largeyellow arrow) proportional to the net force (see ref. 38) generated by theactin cytoskeleton in the bias direction. d, The map of effective forcesacting in the direction of the cell retraction (large red arrows; in regionswhere the cell contracts) and along the stress fibres (small red arrows areforces acting in the direction of cell migration; blue—in the oppositedirection). The white lines give the positions of the retracting parts at 0 and19 min. The scale bar is the same for c and d and corresponds to 12.5 µm.
boundaries, and move within the triangles with less overallbias (no statistically significant bias for a >∼ 1,800 µm2). Forsmaller values of a, the cells are spread over several triangles andeven some oligo(ethylene glycol) self-assembled monolayer areas,and also move less directionally (no bias for a < ∼1,000 µm2).Furthermore, the biases aremaximal when the width of the openingconnecting the triangles is ∼10–20 µm. For smaller openings, thecells cannot squeeze efficiently through narrow ‘funnels’ and moveonly sporadically (once every few hours); for larger ones, they cantravel more freely along either of the two possible directions (withno net bias for opening width>∼30 µm).
(2) Bias b2 responsible for the guidance over larger distancesdepends not only on the local bias but also on the number ofthe unit triangles in the ratchet and the dimensions of the cellreservoirs. We first estimate the probability that a cell that hasalready entered a ratchet channel from one reservoir, will passall the way through this channel into the other reservoir. Weapproximate the cell as a random walker on a one-dimensionallattice with periodicity 1x determined from experimental ratchetdimensions (here, 1x ∼ 54 µm) and time steps, calculated fromexperimental velocities, v , of cells on ratchets (for example, forB16F1 cells under 2% serum conditions, v ∼ 30 µmh−1 and1t =1x/v = 42.5 µm/24 µmh−1 = 1.8 h). The probability pl of acell taking a step in the direction of the bias (‘to the left’ in Fig. 4a)is given by the experimentally determined value of b1 (for example,54.6% for B16F1 in 2% serum, see Table 1); the probability of thecell taking a step against the bias, ‘to the right’ is pr = 1−pl. Withthese considerations, onemay calculate the probabilities39 that after
time t = n1t , the cell will have successfully crossed the channelfrom right to left, PL(n):
PL(n) =∑j
{pM (j+1)−x0l pMj
r
∑i
(ni
)(pn−M (1+2j)+x0−i
l pir
+ pn−M (1+2j)+x0−ir pil)
}−
∑j
{pM (j+1)l pMj+x0
r
∑i
(ni
)(pn−M (1+2j)−x0−i
l pir
+ pn−M (1+2j)−x0−ir pil)
}(1)
In this equation, M is the number of ratchet units (here, thetriangles) along the channel and x0 is the initial position of the cellwalker (here, always taken as x0 = 1—that is, cells start in the firstratchet). The summation over i ≥ 0 continues until the terms inthe series in each curly bracket, rearranged in descending powersof pl, meet in the middle (the middle term counting only once ifn−M+x0 is even, see Supplementary Section S6.1); the summationover t covers all values j ≥ 0 that leave non-negative exponents. Anexpression for the crossing from the ‘left to the right’, PR(n), maybe obtained from the above expression by exchanging pl and pr. Forlarge n (corresponding to long times, t = n1t ), PL(n) and PR(n)converge to the following asymptotic values:
PL= [(pr/pl)x0−1]/[(pr/pl)M −1] and
PR= [(pl/pr)x0−1]/[(pl/pr)M −1](2)
Figure 4b illustrates the case in which pl=0.546 (in experiments,B16F1 in 2% serum) and M = 5, for which the asymptoticprobability of crossing the channel from right to left is 0.28 (thecrossing is unsuccessful with probability 0.72). Note that the caseof cells entering the ratchet from the ‘left’ and migrating againstthe bias towards the ‘right’ reservoir is solved analogously (for theparticular cell type discussed above, the cell has a 13% chance ofmaking it all the way through against the bias).
Using the rate of cells entering the channels (∼5 cells h−1; seethe Methods section) and the probability of passing through thechannel (equations (1) and (2)), it is possible to relate the b1 andb2 biases and describe how the numbers of cells in the reservoirschange in time. LetNL andNR denote the number of cells in the ‘left’and ‘right’ reservoirs, respectively. The population balances for thenumber of cells in reservoirs L and R are expressed as
dNL
dt= kL
NR
1−αNR−kR
NL
1−αNR+kgNL(1−αNL) (3)
dNR
dt= kR
NL
1−αNL−kL
NR
1−αNR+kgNR(1−αNR) (4)
Here, α= a/A, kL=CLcVPL/2A and kR=CLcVPR/2A, parametersC , Lc, V and A are defined in the Methods section and PL and PRare the probabilities of a cell passing though the channels from rightto left (R→ L) and from left to right (L→ R), respectively (seeabove). The last terms in the above equations describe the logisticgrowth of the cell populations (see Supplementary Section S6.2)with a growth rate, kg ∼0.035 h−1 (that is, doubling time of 20 h, asin the experiments) and a carrying capacity of 1/α∼250 (that is, 250cells of area a∼ 1,300 µm2 cover the full area A of each reservoir).The set of nonlinear differential equations equations (3) and (4) can
NATURE PHYSICS | VOL 5 | AUGUST 2009 | www.nature.com/naturephysics 609© 2009 Macmillan Publishers Limited. All rights reserved.

ARTICLES NATURE PHYSICS DOI: 10.1038/NPHYS1306
Reservoir
L
Reservoir
R
pl pr x0 = 1
0
P L,R
(n)
0
0.05
0.10
0.15
0.20
0.25
0.30
PL
NL
PR NR
10 20n = t/Δt
30 40 50 0
50
100
150
10 20 30t (h)
N
40 50 60
0 10 20 30t (h)
b 2
40 50 600.50
0.52
0.54
0.56
0.58
0.5 0.6 0.7b1
b 2
0.8 0.9
M = 10M = 5
1.00.5
0.6
0.7
0.8
0.9
a
b c
d e
Figure 4 | Probabilities of directional migration, ratcheting efficiency and the scaling properties of the reservoir bias, b2. a, Schematic illustration of themodel geometry. A cell (red), initially located at x0= 1, moves across the ratcheted channel from reservoir R to reservoir L with probability PL, whichdepends on the single-ratchet probabilities, pl and pr, for stepping left and right, respectively. b, Probabilities of crossing a channel of M= 5 ratchets in thebias direction, PL, and against the bias direction, PR, as a function of the number of steps n taken. Here, the underlying single-ratchet stepping probabilitiesare pl=0.546 and pr=0.454 corresponding to the experiment with B16F1 cells in 2% serum. c, Cell populations, N, in reservoirs L and R as a function oftime for the experimental/model parameters presented in the text (V=60 µm h−1, a= 1,300 µm2, A= 320,000 µm2, CLc= 10×35 µm, PL=0.28 andPR=0.13). d, The b2 reservoir bias for data in c as a function of time. The maximum bias is achieved after∼48 h, after which cell division/growth begins toovercome the effect of the ratchets. e, The b2 reservoir bias as a function of the underlying b1 ratchet bias for M= 5 and M= 10 ratchets and for 48 hof ratcheting.
be solved numerically. For example, for the typical experimentalconditions for B16F1 cells in 2% serum described here, the crossingrates are estimated as kL=0.0092 h−1 and kR=0.0043 h−1 to give thetime-dependent cell populations in the reservoirs (Fig. 4c). Thesevalues allow for the calculation of the time dependence of biasb2 =NL/(NR+NL) (Fig. 4d), of which the final value at ∼50 h is∼57.7%—that is, close to 60.9%observed experimentally for B16F1cells in 2% serum (see Table 1). Similar agreement is observed forother conditions and cell types. In addition, as illustrated in Fig. 4efor M = 5 and M = 10, the values of b2 increase only slowly withincreasing number of unit triangles in the ratchet channel. Again,this observation is in agreement with experiments and reflectsthe fact that making ratchets longer significantly decreases theprobability of cells crossing in either direction—in other words, PLand PR decrease significantly despite the fact that the ratio PL/PRincreases. Finally, the model correctly predicts that for times longerthan ∼50 h, the growth of the cells will take over the ratcheting,until both reservoirs are fully populated with no bias. Therefore,48 h used in experiments is close to the ‘optimal’ time for ratchetoperation (see Supplementary Section S3 for time analysis).
Two-directional ratchetsThe applicability of the one-directional ratchets discussed so far isprobably limited to themechanistic studies of cellmigration inwell-definedmicrogeometries. Ratchets that could guide cells of differenttypes in opposite directions would be much more useful, especially
in the context of cell sorting40–42 and relatedmedical diagnostics43,44.We investigated the possibility of such two-directional ratchetsbased on the differences in the morphology of cells’ protrusions—for instance, the broad lamellipodia formed by the cancerous B16F1or MDA-MB-231 cells and the combination of lamellipodia andlong, ‘exploratory’ protrusions of non-cancerous Rat2 fibroblasts(see Supplementary Video S3). As mentioned before, the longprotrusion of the Rat2 cell extends more than one triangle aheadof the cell’s body and often ‘anchors’ against the ‘obstacles’ (forexample, the sides of the ratchet’s triangles) within the confiningchannels. Although for triangular ratchets this phenomenon hasnegligible effect on the overall direction of motion, it couldbe made more manifest if the in-channel protrusions weremore pronounced.
This reasoning guided the design of morphology-based ratchetson which B16F1 and Rat2 (or MDA-MB-231 and Rat2) cellsmove in opposite directions. In these ratchets, the asymmetric‘spike’ protrusions alternate on the opposite sides of the channel(Fig. 5a). If the cells are compact (Fig. 5a, left), they spread onthe ratchet, contact the boundaries on the opposite walls andtherefore experience a ‘funnel’-like geometry akin to that in the one-directional ratchets. Both live imaging as well as immunostainingexperiments showed that B16F1 cells and MDA-MB-231 behavein this way and form lamellipodia that are broader near the shortbase of a unit trapezium than near the ‘open’ vertex of a longbase (see Fig. 5a, left). Consequently, these cells polarize towards
610 NATURE PHYSICS | VOL 5 | AUGUST 2009 | www.nature.com/naturephysics
© 2009 Macmillan Publishers Limited. All rights reserved.

NATURE PHYSICS DOI: 10.1038/NPHYS1306 ARTICLES
‘anchor’
B16F1 Rat2
Large lamellipodium
B16F1 Rat2
Stack
B16F1Rat2
a
b
c
Figure 5 | Cells on bi-directional ‘lines-with-spikes’ ratchets. a, B16F1 andRat2 cells move in opposite directions on linear ratchets with spikesinclined at 45◦ (staining: phalloidin, green; Hoechst 33342, blue). B16F1cells (left column) form large lamellipodial protrusions near the ‘open’vertices of the short base of a unit trapezium (delineated by a yellow dottedline, adhesive area∼1,300 µm2). In contrast, Rat2 cells extend longprotrusions into the ‘open’ vertex of a long base (top) and ‘anchor’ at thenearby spike. The borders between adhesive and non-adhesive areas areoutlined by dotted lines. The scale bar corresponds to 30 µm.b, Distribution of B16F1 (left), Rat2 (middle) and a mixture of B16F1 andRat2 (right) cells over a pattern of two reservoirs connected by ten spikedratchets (after 48 h from cell plating, also see Supplementary Section S3;serum concentration 10%; laminin). Superimposed images of phasecontrast and nuclei (Hoechst 33342, blue) illustrate 54.8% bias for B16F1cells (189 cells in the left reservoir and 156 in the right one) and 56.0% biasfor Rat2 (80 and 102 cells). For the mixture of B16F1 cells and Rat2 cells,the former are stained with a red DiI dye; the image is a superposition ofphase contrast and DiI. The cells of two types partly sort out and the biasesfrom reservoir counts are 57.7% bias for B16F1 cells (15 cells in the leftreservoir and 11 in the right one) and 56.5% bias for Rat2 cells (27 and 35cells). The scale bar represents 250 µm. c, An idea for a ‘cancer trap’comprising stacks of radially arranged ratchet channels. When implantednext to a tumour, the channels could selectively guide motile cancerouscells (green) inwards, but not other cells (red).
this large lamellipodium, which then spreads into the next unitcell and facilitates the overall migration of the cell with biasesb1= 54.9%; b2= 54.8% for B16F1 and b1= 58.2%; b2= 56.3% forMDA-MB-231 cells (Table 1). In sharp contrast, the elongated Rat2cells do not contact all ratchet boundaries but instead use their longprotrusions to ‘grab’ against the in-channel spikes, preferentiallyaround the spikes slanted in the protrusion’s direction (that is, tothe right in Fig. 5a, also see Supplementary Video S4). Once an‘anchor’ is stabilized by focal adhesions, the protrusion lays downa larger lamellipodium around it, and the cell pulls the trailing partof its body into the new location. The on-ratchet biases for the Rat2cells were b1= 62.8% and b2= 55.8%.
Importantly, the biased motions were also observed on ratchetsplated simultaneously with two cell types (specifically, B16F1/Rat2or MDA-MB-231/Rat2 pairs; Fig. 5b, rightmost image). Startingfrom an initial, uniform distribution over the pattern, the ratchetsmoved cells of different types in opposite directions—B16F1 cellsor MDA-MB-231 along the ‘funnels’ and Rat2 cells along theslant of the spiked in-channel obstacles. The morphological andstructural changes accompanying these migrations were similarto those observed in the single-cell-type experiments described inthe previous paragraph. Although the b1 biases on the ratchetscould not be directly assigned (as live imaging of cells labelledwith fluorescent dyes caused photo-damage and reduced theirmotility), the counts over the reservoirs after 48 h showed that thecells partly sorted out. For the B16F1/Rat2 pair, the biases wereb2 (B16F1) = 55.0% and b2 (Rat2) = 56.3% (data based on 30reservoir pairs with a total of 702 B16F1 and 2788 Rat2 cells; Zscores >6 for both cell types). For the MDA-MB-231/Rat2 pair,b2 (MDA-MB-231)= 57.3% and b2 (Rat2)= 63.4% (data based on47 reservoir pairs with a total of 1012MDA-MB-231 and 3513 Rat2cells; Z scores> 10 for both cell types). We observe that becausethese values are close to those from single-cell-type experimentson the same ratchet, it seems that interactions between B16F1cells and Rat2 cells do not affect the motility of either cell typeperceptibly (see Supplementary Section S4c). We also note thatcontrol experiments with reservoirs connected by straight linesshowed no bias, indicating that directional cell guiding on the spikeratchets is a consequence of the imposed geometry alone.
OutlookIf optimized further to achieve significantly higher biases andlonger operational times, ratchet microsystems could find uses insorting motile cells of different42,44–48 types. Of course, the designof ratchet systems should not be confined to planar substratesand parallel channels. Concentric arrangements of two-directionalratchets such as the one proposed in Fig. 5c could be considered,whereby only the motile/metastatic cells were drawn towards thecentre and permanently trapped therein. Fabrication of such ‘cancertraps’ and their potential extension to implantable materials couldunderlie a new approach to cancer therapy—one based on thephysical principle of ratcheting. Finally, cell ratchets offer severalopportunities for further theoretical research in biophysics wherethe quantitative relationship(s) between the imposed geometry andthe cytoskeletal processes underlying cellmotility remains elusive.
MethodsExperimental set-up. Tracks for cell locomotion were microetched in glass/Ti/Ausubstrates using the so-called anisotropic solid microetching technique29,30. Briefly,agarose stamps micropatterned in bas relief were first soaked in a solution ofa gold etchant for ∼1min, blotted dry under a stream of nitrogen for ∼30 sand applied onto an electron-beam evaporated layer of gold (30 nm Au, 5 nmTi adhesion layer) to etch the metal at the regions of contact (see Fig. 1a). Theremaining portion of the gold film was then covered with a self-assembledmonolayer of oligo(ethylene glycol) alkane thiol (HS–(CH2)11–(OCH2CH2)6–OH,ProChimia) known to resist cell adhesion31–34. The etched glass/Ti regions werecoated with either fibronectin or laminin and the slides were incubated in a 1%BSA solution for 15min. The substrates thus prepared offered high optical contrastbetween the cell-adhesive and non-adhesive regions, and facilitated visualizationof the boundaries of the imprinted patterns. In addition, the transparency of theadhesive areas allowed for fluorescent imaging inside the adhered, living cells30.The motile cells considered in this study were B16F1 mouse melanoma, Rat2fibroblasts and MDA-MB-231 human breast carcinoma, all plated at a density of10,000–20,000 cells cm−2 (for further experimental details on patterning and cellculturing, see Supplementary Section S1).
Probabilities of cells entering the ratchets from reservoirs. Initially, N cells aredistributed randomly over the entire reservoir of area A (typically, ∼320,000 µm2)and move about at random with a characteristic velocity V (for example,V ∼ 60 µmh−1 for B16F1 on planar substrates; note that V is, in general, differentto the velocity v on the ratchet). Neglecting the persistence49 of the cell motions,the rate per unit length at which cells ‘collide’ with the walls of the reservoir may
NATURE PHYSICS | VOL 5 | AUGUST 2009 | www.nature.com/naturephysics 611© 2009 Macmillan Publishers Limited. All rights reserved.

ARTICLES NATURE PHYSICS DOI: 10.1038/NPHYS1306
be estimated using the formulae from the kinetic theory of gases (specifically,the rate of collisions of randomly moving particles with the walls) and the vander Waals equation of state accounting for the area taken by the cells themselves:NV /2Afree, where Afree =A−Na is the ‘free’ area unoccupied by cells and a is theaverage area per cell (typically, a∼ 1,300 µm2). Thus, the rate at which cells enterthe channel is simply the above relation multiplied by the length of the channelentrance, Lc, and the number of channels, C—that is, the rate of entering thechannel is NCLcV /2(A−Na). For a typical experimental system of C = 10 ratchetchannels each with Lc ∼ 35 µm entrance (see Fig. 2a), for two reservoirs of typicalarea A= 320,000 µm2 each, and with∼120 cells evenly distributed on the reservoirs(typical number of cells at the midpoint of the experiment, at 24 h), the totalrate at which cells enter the channels is ∼5 cells h−1. Thus, over the course of theexperiment (48 h), each cell is expected to enter a channel on average twice. From apractical/design point of view, it is important to note that the chances of cells enter-ing the ratchets decreasewith increasing reservoir area (for a fixed number of cells).
Received 4 January 2009; accepted 14 May 2009;published online 14 June 2009
References1. Lee, S. H. & Grier, D. G. One-dimensional optical thermal ratchets. J. Phys.
Condens. Matter 17, S3685–S3695 (2005).2. Lee, C. S., Janko, B., Derenyi, I. & Barabasi, A. L. Reducing vortex density in
superconductors using the ‘ratchet effect’. Nature 400, 337–340 (1999).3. Lorke, A. et al. Far-infrared and transport properties of antidot arrays with
broken symmetry. Physica B 251, 312–316 (1998).4. Rousselet, J., Salome, L., Ajdari, A. & Prost, J. Directional motion of
Brownian particles induced by a periodic asymmetric potential. Nature 370,446–448 (1994).
5. Engel, A.,Muller, H. W., Reimann, P. & Jung, A. Ferrofluids as thermal ratchets.Phys. Rev. Lett. 91, 060602 (2003).
6. Linke, H. et al. Experimental tunneling ratchets. Science 286, 2314–2317 (1999).7. van Oudenaarden, A. & Boxer, S. G. Brownian ratchets: Molecular separations
in lipid bilayers supported on patterned arrays. Science 285, 1046–1048 (1999).8. Villegas, J. E. et al. A superconducting reversible rectifier that controls the
motion of magnetic flux quanta. Science 302, 1188–1191 (2003).9. Hiratsuka, Y., Tada, T., Oiwa, K., Kanayama, T. & Uyeda, T. Q. P.
Controlling the direction of kinesin-driven microtubule movements alongmicrolithographic tracks. Biophys. J. 81, 1555–1561 (2001).
10. Matthias, S. & Muller, F. Asymmetric pores in a silicon membrane acting asmassively parallel Brownian ratchets. Nature 424, 53–57 (2003).
11. Reimann, P. Brownian motors: Noisy transport far from equilibrium.Phys. Rep.-Rev. Sec. Phys. Lett. 361, 57–265 (2002).
12. Astumian, R. D. & Hanggi, P. Brownian motors. Phys. Today 55, 33–39 (2002).13. Feynman, R. P., Leighton, R. B. & Sands, M. L. The Feynman Lectures on Physics
Vol. 1 (Pearson/Addison-Wesley, 2006).14. Peskin, C. S., Odell, G. M. & Oster, G. F. Cellular motions and thermal
fluctuations—the Brownian ratchet. Biophys. J. 65, 316–324 (1993).15. Silva, C. C. D., de Vondel, J. V., Morelle, M. & Moshchalkov, V. V. Controlled
multiple reversals of a ratchet effect. Nature 440, 651–654 (2006).16. Kelly, T. R., De Silva, H. & Silva, R. A. Unidirectional rotary motion in a
molecular system. Nature 401, 150–152 (1999).17. Simon, S. M., Peskin, C. S. & Oster, G. F. What drives the translocation of
proteins. Proc. Natl Acad. Sci. USA 89, 3770–3774 (1992).18. Alt, W. Biased random-walk models for chemotaxis and related diffusion
approximations. J. Math. Biol. 9, 147–177 (1980).19. Dunn, G. A. & Brown, A. F. A unified approach to analyzing cell motility.
J. Cell Sci. Suppl. 8, 81–102 (1987).20. Theriot, J. A. & Mitchison, T. J. Actin microfilament dynamics in locomoting
cells. Nature 352, 126–131 (1991).21. Ponti, A., Machacek, M., Gupton, S. L., Waterman-Storer, C. M. & Danuser, G.
Two distinct actin networks drive the protrusion of migrating cells. Science305, 1782–1786 (2004).
22. Thery, M. et al. Anisotropy of cell adhesive microenvironment governs cellinternal organization and orientation of polarity. Proc. Natl Acad. Sci. USA103, 19771–19776 (2006).
23. Thery, M., Pepin, A., Dressaire, E., Chen, Y. & Bornens, M. Cell distributionof stress fibres in response to the geometry of the adhesive environment.Cell Motil. Cytoskeleton 63, 341–355 (2006).
24. Jiang, X. Y. et al. A general method for patterning gradients of biomolecules onsurfaces using microfluidic networks. Anal. Chem. 77, 2338–2347 (2005).
25. Dertinger, S. K. W., Jiang, X. Y., Li, Z. Y., Murthy, V. N. & Whitesides, G. M.Gradients of substrate-bound laminin orient axonal specification of neurons.Proc. Natl Acad. Sci. USA 99, 12542–12547 (2002).
26. Brandley, B. K. & Schnaar, R. L. Tumor-cell haptotaxis on covalentlyimmobilized linear and exponential gradients of a cell-adhesion peptide.Dev. Biol. 135, 74–86 (1989).
27. Smith, J. T. et al. Measurement of cell migration on surface-bound fibronectingradients. Langmuir 20, 8279–8286 (2004).
28. Plummer, S. T., Wang, Q., Bohn, P. W., Stockton, R. & Schwartz, M. A.Electrochemically derived gradients of the extracellular matrix proteinfibronectin on gold. Langmuir 19, 7528–7536 (2003).
29. Campbell, C. J., Smoukov, S. K., Bishop, K. J. M., Baker, E. & Grzybowski, B. A.Direct printing of 3d and curvilinear micrometer-sized architectures into solidsubstrates with sub-micrometer resolution. Adv. Mater. 18, 2004–2008 (2006).
30. Kandere-Grzybowska, K., Campbell, C., Komarova, Y., Grzybowski, B. A. &Borisy, G. G. Molecular dynamics imaging in micropatterned living cells.Nature Meth. 2, 739–741 (2005).
31. Maroudas, N. G. Polymer exclusion, cell adhesion and membrane-fusion.Nature 254, 695–696 (1975).
32. Prime, K. L. & Whitesides, G. M. Self-assembled organic monolayers—modelsystems for studying adsorption of proteins at surfaces. Science 252,1164–1167 (1991).
33. Singhvi, R. et al. Engineering cell-shape and function. Science 264,696–698 (1994).
34. Kandere-Grzybowska, K. et al. Cell motility on micropatterned treadmills andtracks. Soft Matter 3, 672–679 (2007).
35. Jiang, X. Y., Bruzewicz, D. A., Wong, A. P., Piel, M. & Whitesides, G. M.Directing cell migration with asymmetric micropatterns. Proc. Natl Acad.Sci. USA 102, 975–978 (2005).
36. Groisman, A. & Quake, S. R. A microfluidic rectifier: Anisotropic flowresistance at low reynolds numbers. Phys. Rev. Lett. 92, 094501 (2004).
37. Grazi, E., Cintio, O. & Trombetta, G. On the mechanics of the actin filament:The linear relationship between stiffness and yield strength allows estimationof the yield strength of thin filament in vivo. J. Muscle Res. Cell Motil. 25,103–105 (2004).
38. Brown, C. M. et al. Probing the integrin-actin linkage using high-resolutionprotein velocity mapping. J. Cell Sci. 119, 5204–5214 (2006).
39. Thatcher, A. R. Studies in the history of probability and statistics vi. A noteon the early solutions of the problem of the duration of play. Biometrika 44,515–518 (1957).
40. Kumar, A., Galaev, I. Y. & Mattiasson, B. (eds) Cell Separation: Fundamentals,Analytical and Preparative Methods Vol. 106 (Springer, 2007).
41. Steinberg, M. S. & Takeichi, M. Experimental specification of cell sorting,tissue spreading, and specific spatial patterning by quantitative differences incadherin expression. Proc. Natl Acad. Sci. USA 91, 206–209 (1994).
42. Xu, Q. L., Mellitzer, G., Robinson, V. & Wilkinson, D. G. In vivo cell sorting incomplementary segmental domains mediated by eph receptors and ephrins.Nature 399, 267–271 (1999).
43. Keren, D. F., McCoy, J. P. & Carey, J. L. Flow Cytometry in Clinical Diagnosis3rd edn (American Society Clinical Pathology, 2001).
44. Jennings, C. D. & Foon, K. A. Recent advances in flow cytometry: Applicationto the diagnosis of hematologic malignancy. Blood 90, 2863–2892 (1997).
45. Steinberg, M. S. Reconstruction of tissues by dissociated cells. Science 141,401–408 (1963).
46. Townes, P. L. & Holtfreter, J. Directed movements and selective adhesion ofembryonic amphibian cells. J. Exp. Zool. 128, 53–120 (1955).
47. Discher, D. E., Janmey, P. & Wang, Y. L. Tissue cells feel and respond to thestiffness of their substrate. Science 310, 1139–1143 (2005).
48. Wyckoff, J. B., Segall, J. E. & Condeelis, J. S. The collection of the motilepopulation of cells from a living tumor. Cancer Res. 60, 5401–5404 (2000).
49. Gail, M. H. & Boone, C. W. Locomotion of mouse fibroblasts in tissue culture.Biophys. J. 10, 980–993 (1970).
AcknowledgementsThis work was supported by the NCI Northwestern CCNE (NIH 1U54CA119341-01), thePew Scholars Program in the Biomedical Sciences (to B.A.G.) and the Sloan Fellowship(to B.A.G.). G.M. was supported by a Gates Fellowship. C.J.C. was supported by aNorthwestern University Presidential Fellowship. K.J.M.B. was supported by an NSFGraduate Research Fellowship. K.K.-G. was supported by a Fellowship from aDepartmentof Defense Breast Cancer Research Program (W81XW4-05-1-0312).
Author contributionsG.M. C.J.C, Y.A.K. and K.K.-G. carried out most experiments and data analysis; Y.A.K.,K.K.-G., O.C. and S.H. carried out high-resolution in-cell imaging; K.J.M.B. andS.S. developed the theoretical model; K.K.-G. and B.A.G. conceived the experimentsand wrote the paper.
Additional informationSupplementary information accompanies this paper on www.nature.com/naturephysics.Reprints and permissions information is available online at http://npg.nature.com/reprintsandpermissions. Correspondence and requests for materials should beaddressed to K.K.-G. or B.A.G.
612 NATURE PHYSICS | VOL 5 | AUGUST 2009 | www.nature.com/naturephysics
© 2009 Macmillan Publishers Limited. All rights reserved.