directed inspection and maintenance and infrared leak ... · directed inspection and maintenance...
TRANSCRIPT
Directed Inspection and Maintenance and Infrared
Leak DetectionLessons Learned from the
Natural Gas STAR Program
SGA Environmental Round TableCharlotte, North Carolina
June 25 -
27, 2008
epa.gov/gasstar
1
Directed Inspection and Maintenance and Infrared Leak Detection Agenda
Methane LossesWhat are the sources of emissions?How much methane is emitted?
Methane Recovery Directed Inspection and Maintenance (DI&M)DI&M by Infrared Leak Detection
Is Recovery Profitable? Partner ExperienceDiscussion
2
Methane Losses –
Natural Gas Transmission
Fugitive emissions from gas transmission and storage facilities are estimated to be 58 billion cubic feet per year (Bcf/year)Estimated 26 million cubic feet per year (MMcf/year) per compressor station in fugitive emissions
Source: TransCanada
3
Methane Losses –
Natural Gas Distribution
Fugitive emissions from natural gas distribution systems are estimated to be 59 billion cubic feet per year (Bcf/year)Estimated 270 thousand cubic feet per year (Mcf/year) per surface facility in fugitive emissions
Source: ULC Robotics
4
What is the Problem?
Methane gas leaks are invisible, unregulated,
and go unnoticed
Natural Gas STAR Partners find that valves, connectors, compressor seals,
and open-ended lines
(OELs) are major methane fugitive emission
sourcesTransmission and distribution fugitive methane emissions depend on operating practices, equipment age, and maintenance
5
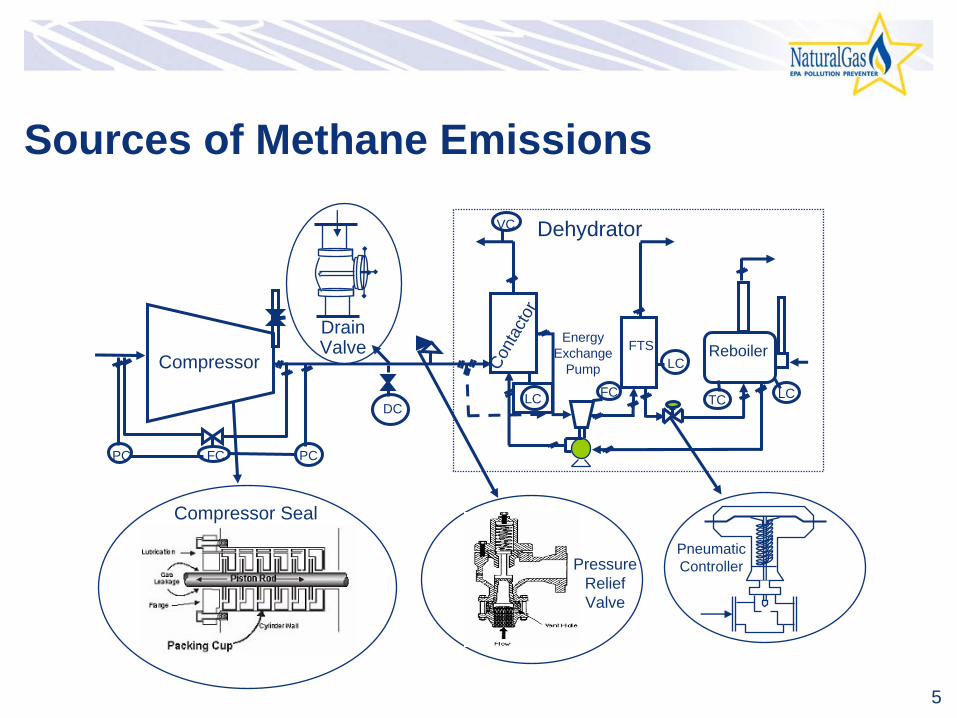
Sources of Methane Emissions
PC PC
Compressor
FC
DCLC TC
VC
FTS
FC LC
LCCont
acto
r
Energy Exchange
Pump
Dehydrator
Reboiler
PressureReliefValve
DrainValve
Compressor Seal
Pneumatic Controller
6
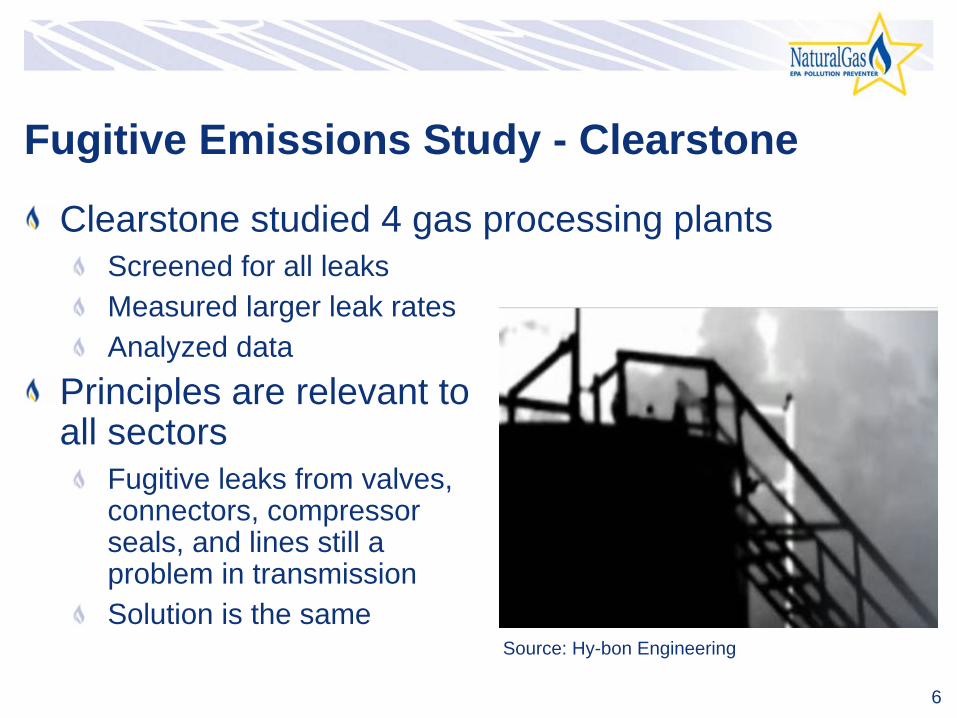
Fugitive Emissions Study -
Clearstone
Clearstone studied 4 gas processing plantsScreened for all leaksMeasured larger leak ratesAnalyzed data
Principles are relevant to all sectors
Fugitive leaks from valves, connectors, compressor seals, and lines still a problem in transmissionSolution is the same
Source: Hy-bon Engineering
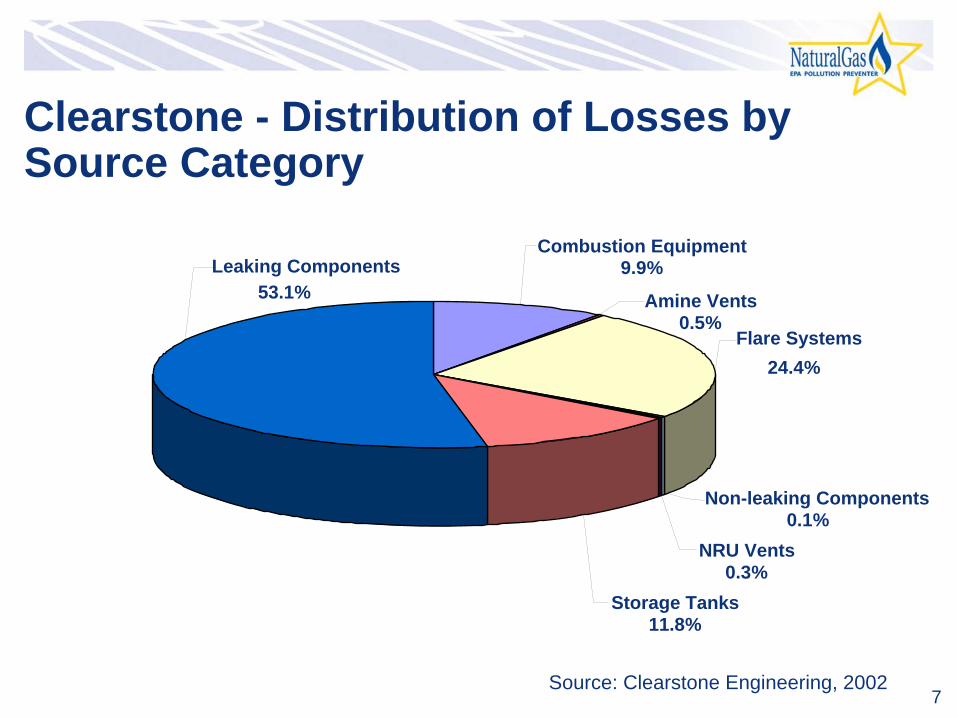
7Source: Clearstone Engineering, 2002
Combustion Equipment9.9%
Amine Vents0.5%
Flare Systems24.4%
Non-leaking Components0.1%
NRU Vents0.3%
Storage Tanks11.8%
Leaking Components53.1%
Clearstone -
Distribution of Losses by Source Category
8
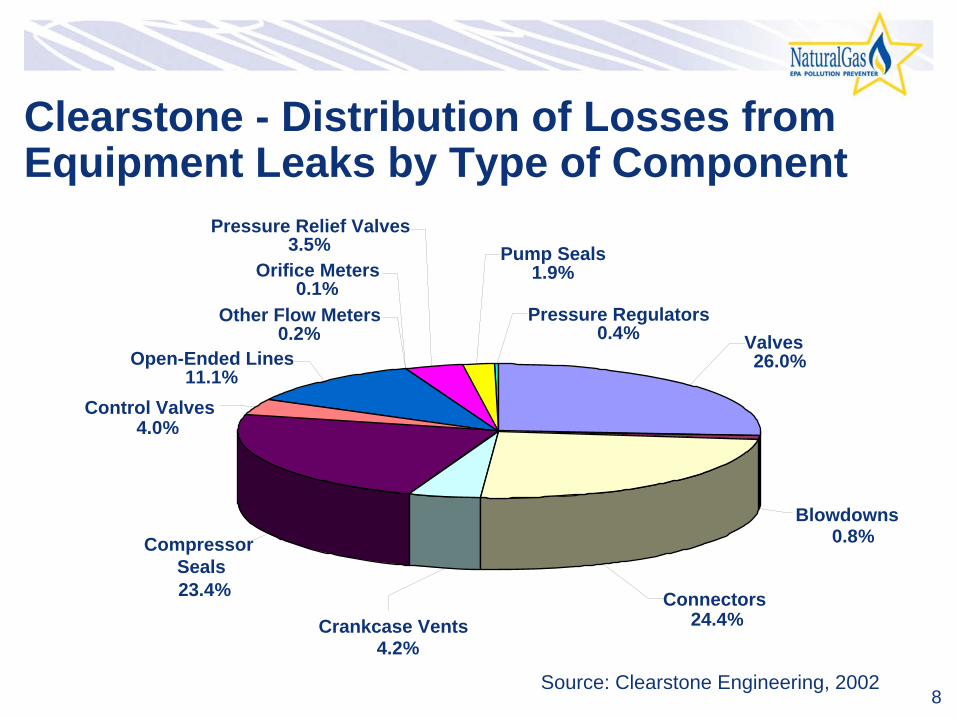
Control Valves
4.2%
4.0%
Open-Ended Lines11.1%
Other Flow Meters0.2%
Orifice Meters0.1%
Pressure Relief Valves3.5%
Valves26.0%
Blowdowns0.8%
Connectors24.4%
CompressorSeals23.4%
Crankcase Vents
Pump Seals1.9%
Pressure Regulators0.4%
Source: Clearstone Engineering, 2002
Clearstone -
Distribution of Losses from Equipment Leaks by Type of Component
9
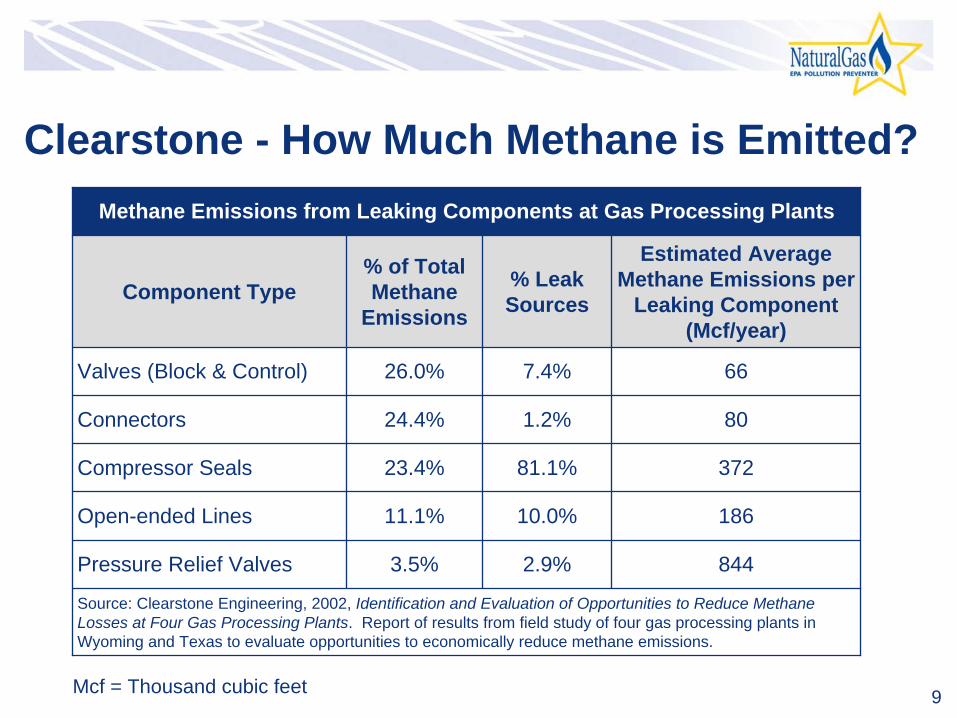
Clearstone -
How Much Methane is Emitted?
Mcf = Thousand cubic feet
Methane Emissions from Leaking Components at Gas Processing Plants
Component Type% of Total Methane
Emissions
% Leak Sources
Estimated Average Methane Emissions per
Leaking Component (Mcf/year)
Valves (Block & Control) 26.0% 7.4% 66
Connectors 24.4% 1.2% 80
Compressor Seals 23.4% 81.1% 372
Open-ended Lines 11.1% 10.0% 186
Pressure Relief Valves 3.5% 2.9% 844
Source: Clearstone Engineering, 2002,
Identification and Evaluation of Opportunities to Reduce Methane Losses at Four Gas Processing Plants. Report of results from field study of four gas processing plants in Wyoming and Texas to evaluate opportunities to economically reduce methane emissions.
10
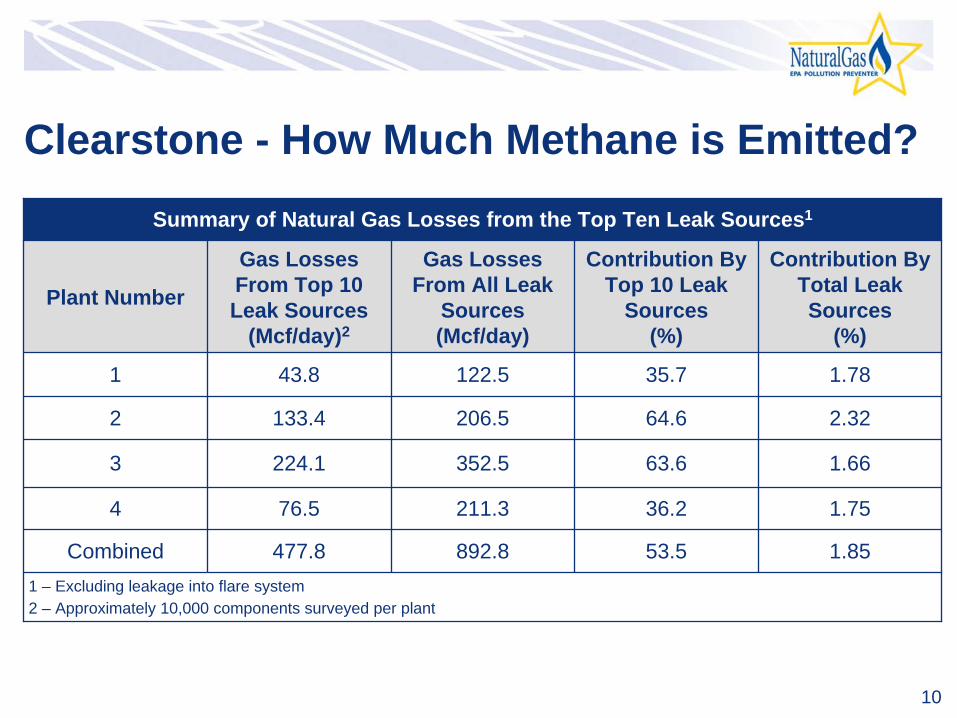
Clearstone -
How Much Methane is Emitted?Summary of Natural Gas Losses from the Top Ten Leak Sources1
Plant Number
Gas Losses From Top 10 Leak Sources
(Mcf/day)2
Gas Losses From All Leak
Sources
(Mcf/day)
Contribution By Top 10 Leak
Sources
(%)
Contribution By Total Leak Sources
(%)
1 43.8 122.5 35.7 1.78
2 133.4 206.5 64.6 2.32
3 224.1 352.5 63.6 1.66
4 76.5 211.3 36.2 1.75
Combined 477.8 892.8 53.5 1.851 –
Excluding leakage into flare system2 –
Approximately 10,000 components surveyed per plant
11
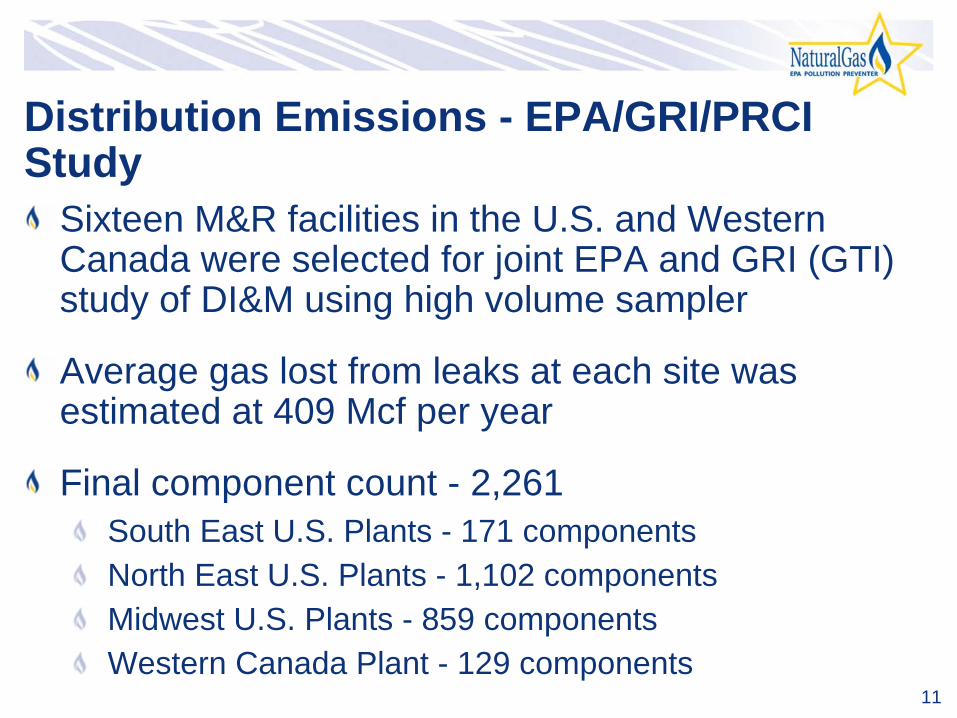
Distribution Emissions -
EPA/GRI/PRCI Study
Sixteen M&R facilities in the U.S. and Western Canada were selected for joint EPA and GRI (GTI) study of DI&M using high volume sampler
Average gas lost from leaks at each site was estimated at 409 Mcf per year
Final component count -
2,261South East U.S. Plants -
171 components
North East U.S. Plants -
1,102 componentsMidwest U.S. Plants -
859 components
Western Canada Plant -
129 components
12
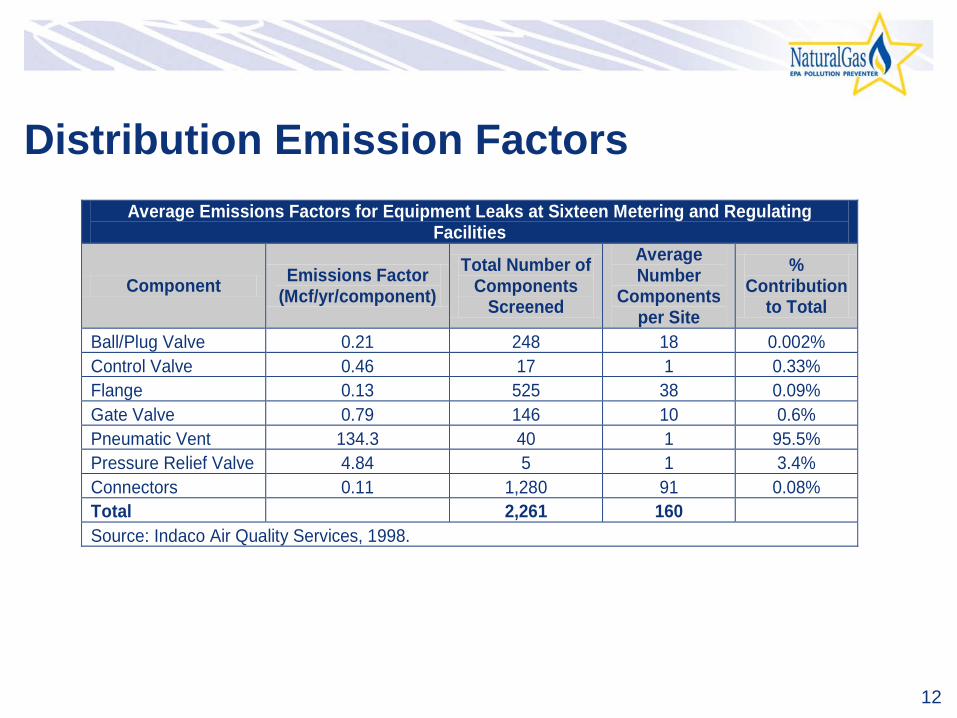
Distribution Emission FactorsAverage Emissions Factors for Equipment Leaks at Sixteen Metering and Regulating
Facilities
Component Emissions Factor (Mcf/yr/component)
Total Number of Components
Screened
Average Number
Components per Site
% Contribution
to Total
Ball/Plug Valve 0.21 248 18 0.002% Control Valve 0.46 17 1 0.33% Flange 0.13 525 38 0.09% Gate Valve 0.79 146 10 0.6% Pneumatic Vent 134.3 40 1 95.5% Pressure Relief Valve 4.84 5 1 3.4% Connectors 0.11 1,280 91 0.08% Total 2,261 160 Source: Indaco Air Quality Services, 1998.
13
Methane Recovery
Fugitive losses can be dramatically reduced by implementing a directed inspection and maintenance program
Voluntary program to identify and fix leaks that are cost- effective to repair
Survey cost will pay out in the first yearProvides valuable data on leak sources with information on where to look “next time”
14
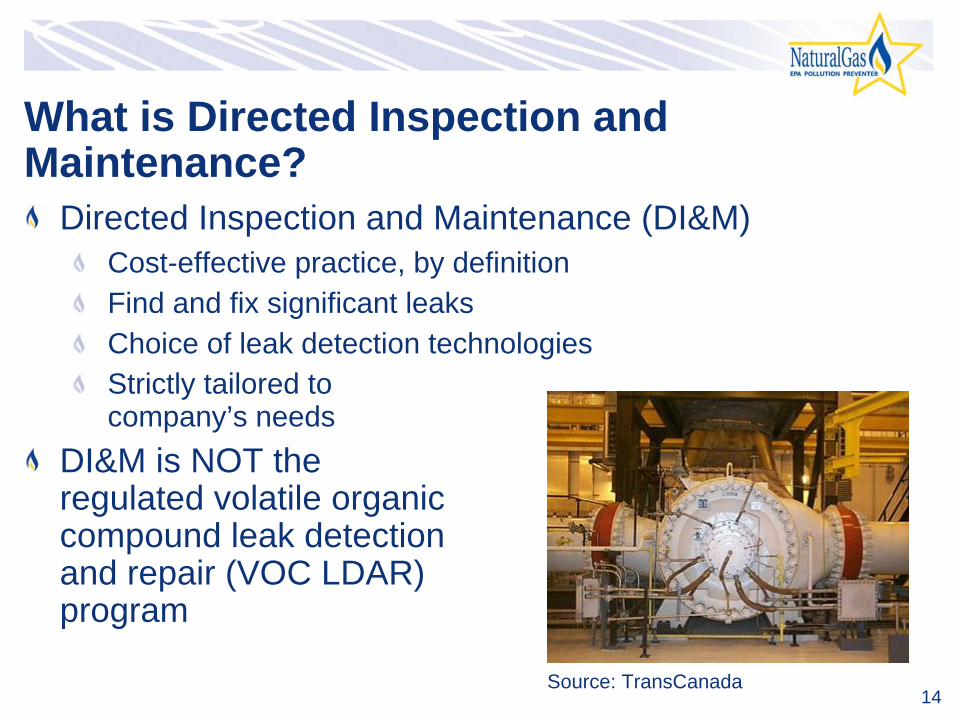
What is Directed Inspection and Maintenance?
Directed Inspection and Maintenance (DI&M)Cost-effective practice,
by definition
Find and fix significant leaksChoice of leak detection technologiesStrictly tailored to company’s needs
DI&M is NOT the regulated volatile organic compound leak detection and repair (VOC LDAR) program
Source: TransCanada
15
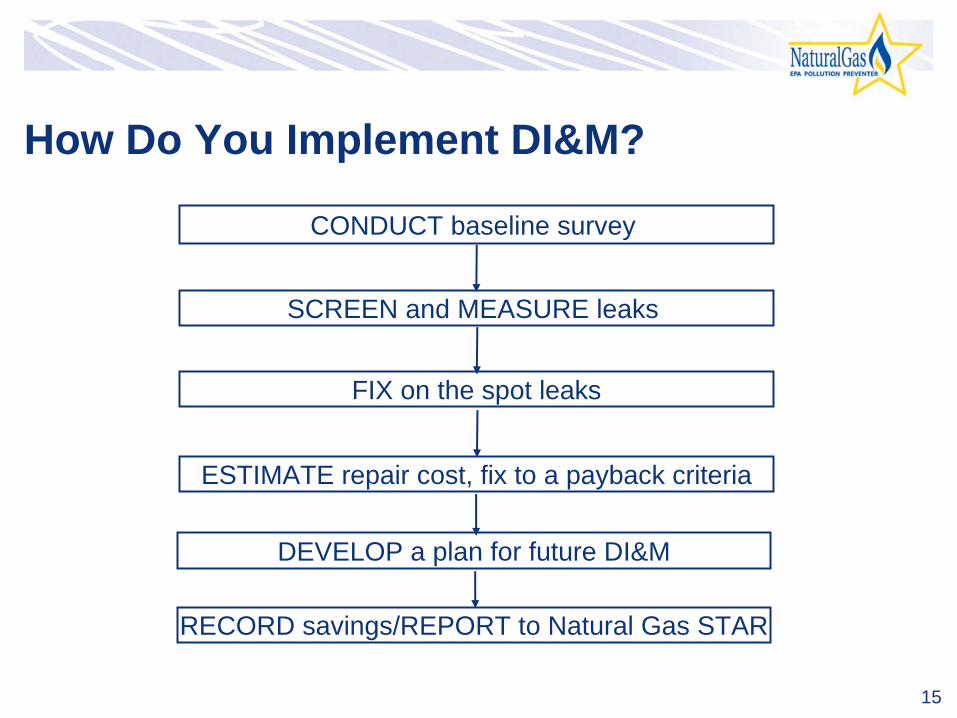
How Do You Implement DI&M?
SCREEN and MEASURE leaks
ESTIMATE repair cost, fix to a payback criteria
DEVELOP a plan for future DI&M
RECORD savings/REPORT to Natural Gas STAR
CONDUCT baseline survey
FIX on the spot leaks
16
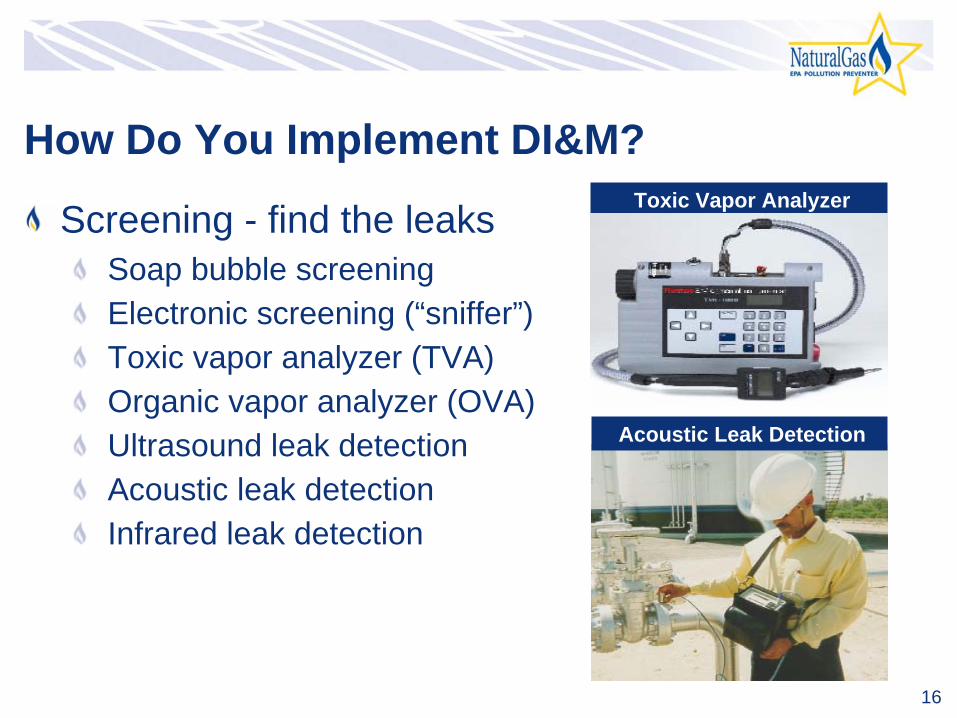
How Do You Implement DI&M?
Screening -
find the leaksSoap bubble screeningElectronic screening (“sniffer”)Toxic vapor analyzer (TVA)Organic vapor analyzer (OVA)Ultrasound leak detection Acoustic leak detection Infrared leak detection
Acoustic Leak Detection
Toxic Vapor Analyzer
17
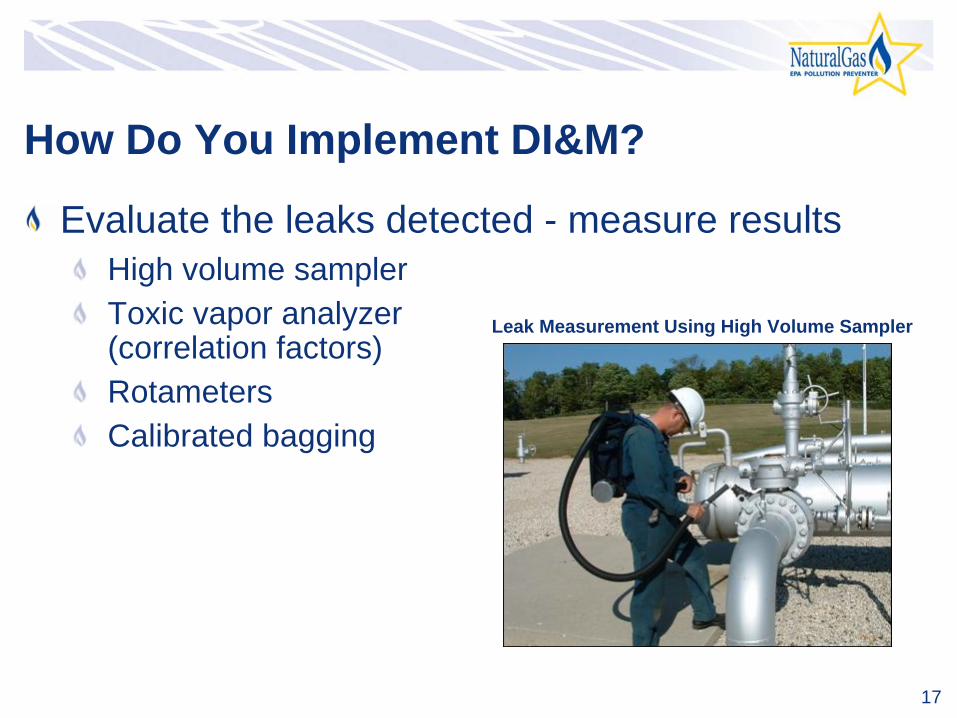
How Do You Implement DI&M?
Evaluate the leaks detected -
measure resultsHigh volume samplerToxic vapor analyzer
(correlation factors)RotametersCalibrated bagging
Leak Measurement Using High Volume Sampler
18
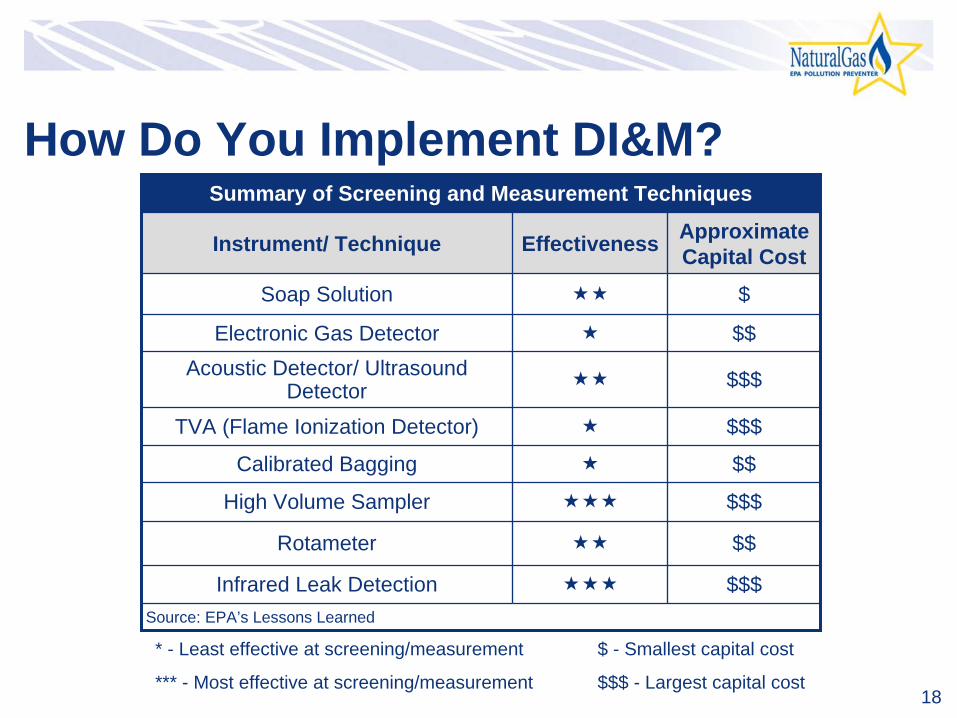
How Do You Implement DI&M?Summary of Screening and Measurement Techniques
Instrument/ Technique Effectiveness Approximate Capital Cost
Soap Solution $
Electronic Gas Detector $$Acoustic Detector/ Ultrasound
Detector $$$
TVA (Flame Ionization Detector) $$$
Calibrated Bagging $$
High Volume Sampler $$$
Rotameter $$
Infrared Leak Detection $$$Source: EPA’s Lessons Learned
* -
Least effective at screening/measurement
*** -
Most effective at screening/measurement
$ -
Smallest capital cost
$$$ -
Largest capital cost
19
Estimating Comprehensive Survey Cost
Cost of complete screening survey using high volume sampler (processing plant)
Ranges $15,000 to $20,000 per medium size plantRule of Thumb: $1 per component for an average processing plantCost per component for compressor stations would be higher than $1
25 to 40% cost reduction for follow-up surveyFocus on higher probability leak sources (e.g. compressors)
20
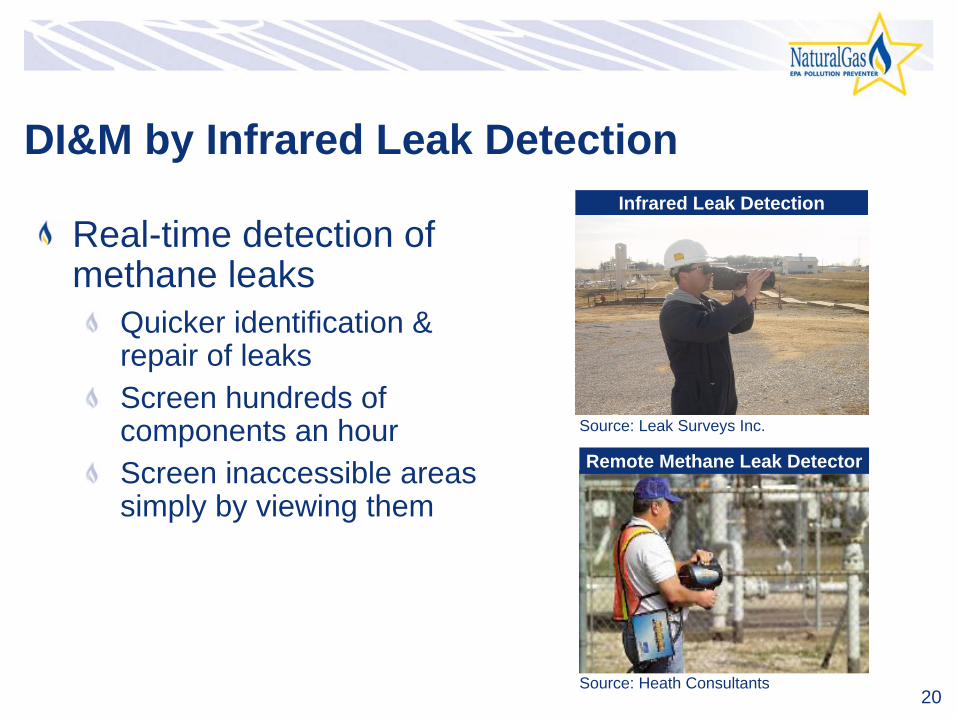
DI&M by Infrared Leak Detection
Real-time detection of methane leaks
Quicker identification & repair of leaksScreen hundreds of components an hourScreen inaccessible areas simply by viewing them
Source: Leak Surveys Inc.
Infrared Leak Detection
Remote Methane Leak Detector
Source: Heath Consultants

21
Infrared Methane Leak Detection
Video recording of fugitive leaks detected by various infrared devices
22
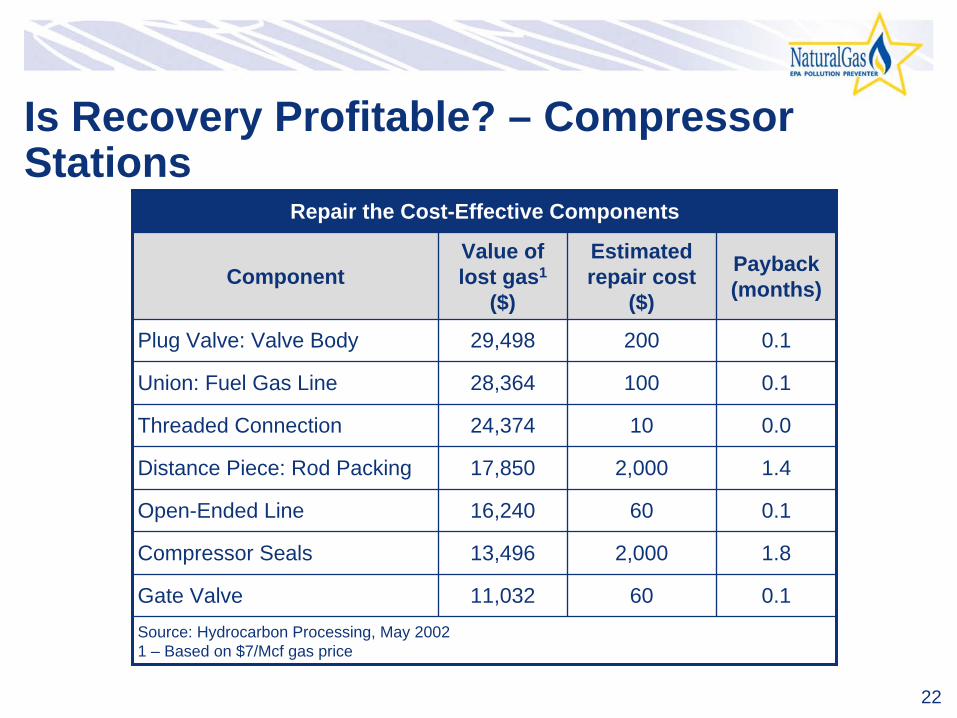
Is Recovery Profitable? –
Compressor Stations
Repair the Cost-Effective Components
ComponentValue of lost gas1
($)
Estimated repair cost
($)
Payback (months)
Plug Valve: Valve Body 29,498 200 0.1
Union: Fuel Gas Line 28,364 100 0.1
Threaded Connection 24,374 10 0.0
Distance Piece: Rod Packing 17,850 2,000 1.4
Open-Ended Line 16,240 60 0.1
Compressor Seals 13,496 2,000 1.8
Gate Valve 11,032 60 0.1Source: Hydrocarbon Processing, May 2002
1 –
Based on $7/Mcf gas price
23
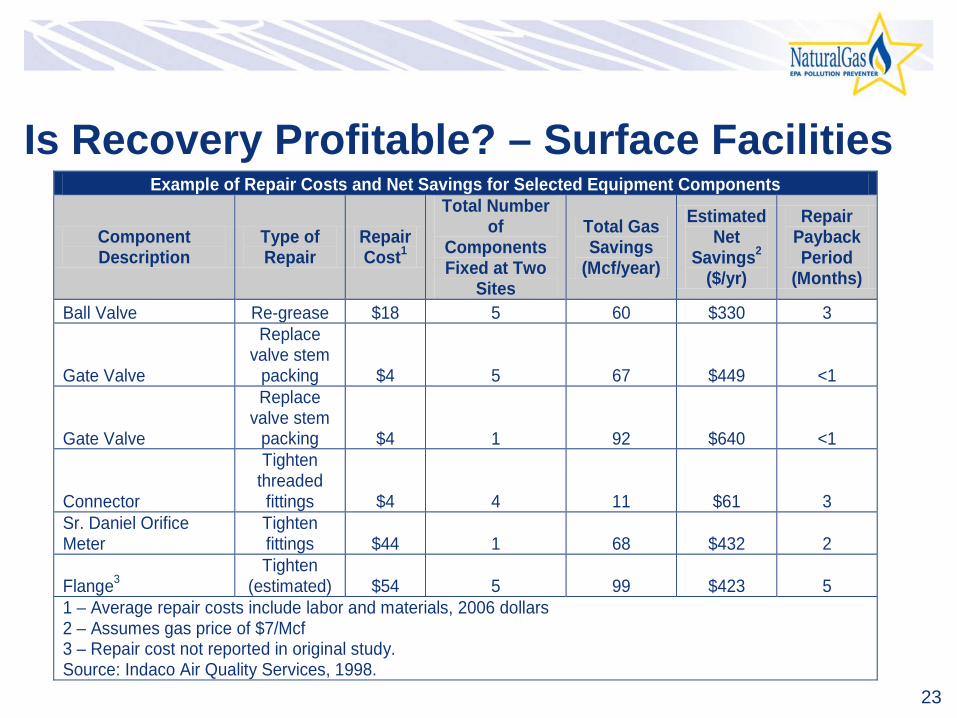
Is Recovery Profitable? –
Surface FacilitiesExample of Repair Costs and Net Savings for Selected Equipment Components
Component Description
Type of Repair
Repair Cost1
Total Number of
Components Fixed at Two
Sites
Total Gas Savings
(Mcf/year)
Estimated Net
Savings2 ($/yr)
Repair Payback Period
(Months)
Ball Valve Re-grease $18 5 60 $330 3
Gate Valve
Replace valve stem
packing $4 5 67 $449 <1
Gate Valve
Replace valve stem
packing $4 1 92 $640 <1
Connector
Tighten threaded fittings $4 4 11 $61 3
Sr. Daniel Orifice Meter
Tighten fittings $44 1 68 $432 2
Flange3 Tighten
(estimated) $54 5 99 $423 5 1 – Average repair costs include labor and materials, 2006 dollars 2 – Assumes gas price of $7/Mcf 3 – Repair cost not reported in original study. Source: Indaco Air Quality Services, 1998.
24
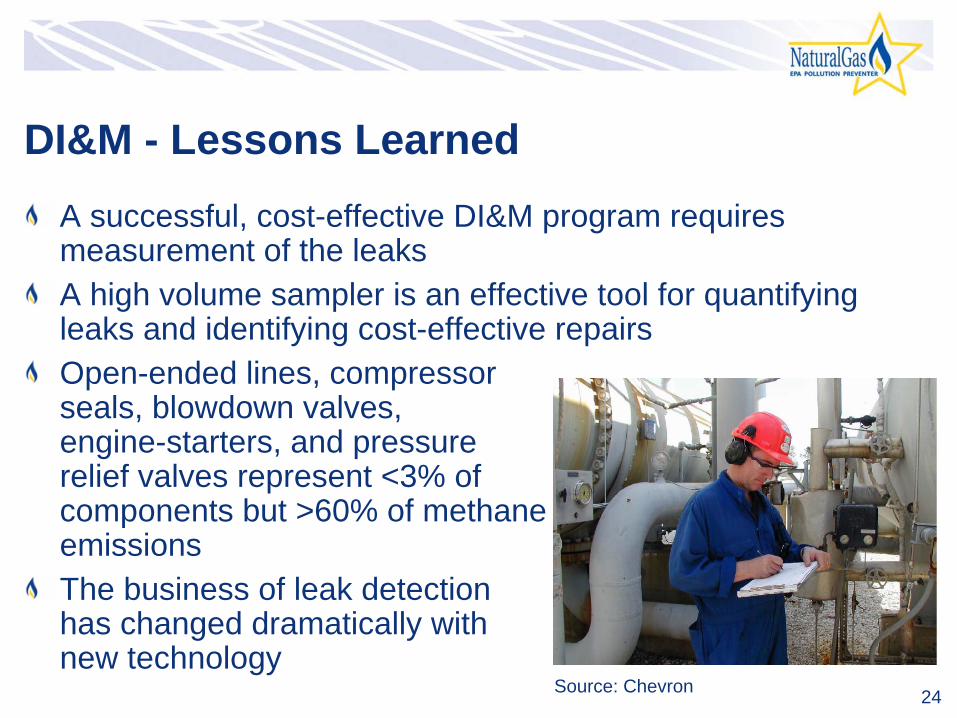
DI&M -
Lessons LearnedA successful, cost-effective DI&M program requires measurement of the leaksA high volume sampler is an effective tool for quantifying leaks and identifying cost-effective repairsOpen-ended lines, compressor
seals, blowdown valves, engine-starters,
and pressure
relief valves represent <3% of components but >60% of methane emissionsThe business of leak detection has changed
dramatically with
new technologySource: Chevron
25
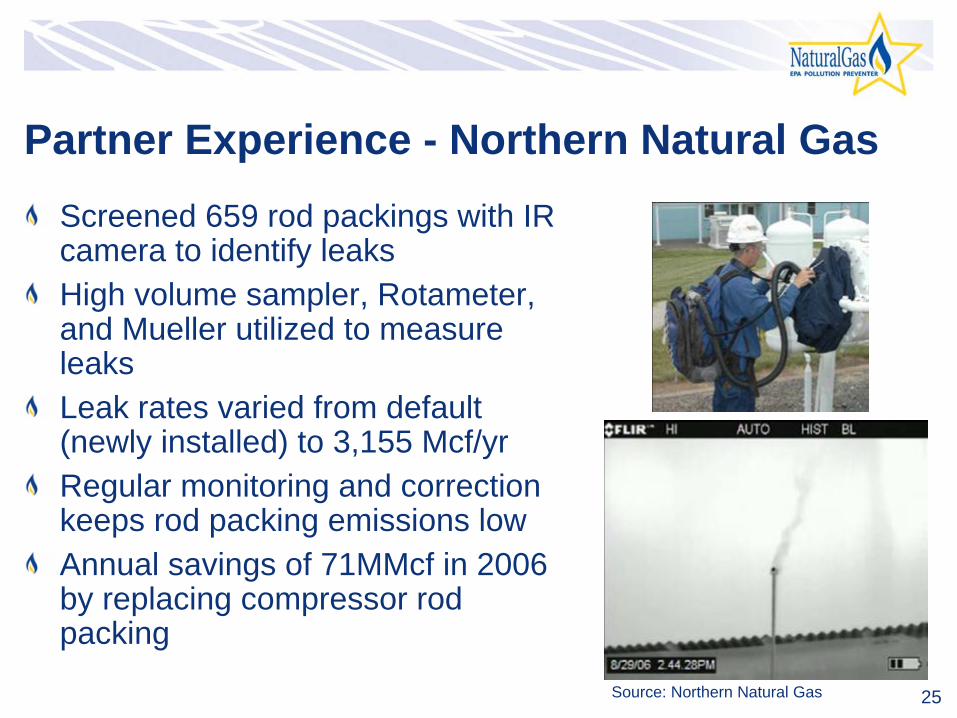
Partner Experience -
Northern Natural GasScreened 659 rod packings with IR camera to identify leaksHigh volume sampler, Rotameter, and Mueller utilized to measure leaksLeak rates varied from default (newly installed) to 3,155 Mcf/yrRegular monitoring and correction keeps rod packing emissions lowAnnual savings of 71MMcf in 2006 by replacing compressor rod packing
Source: Northern Natural Gas
26
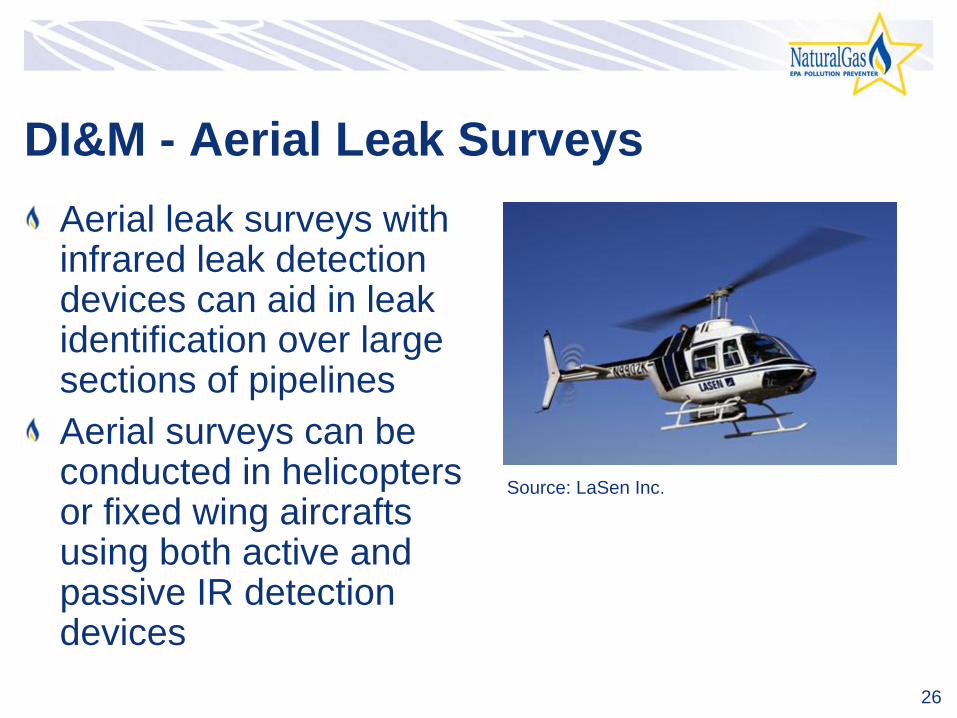
DI&M -
Aerial Leak SurveysAerial leak surveys with infrared leak detection devices can aid in leak identification over large sections of pipelinesAerial surveys can be conducted in helicopters or fixed wing aircrafts using both active and passive IR detection devices
Source: LaSen
Inc.

27
Partner Experience -
Northern Natural Gas1,183 miles of pipeline surveyed using ITT ANGEL Service (Airborne Natural Gas Emission Lidar) with Data collection time: 13.4 hoursDifferential Absorption LIDAR (DIAL) laser technology provides accurate leak detection and measurementColor digital geospatial video of rights-of-way and surrounding areasDatasets show complete pipeline leak survey coverageLeaks found and verified in 27 locations
Source: Northern Natural Gas
28
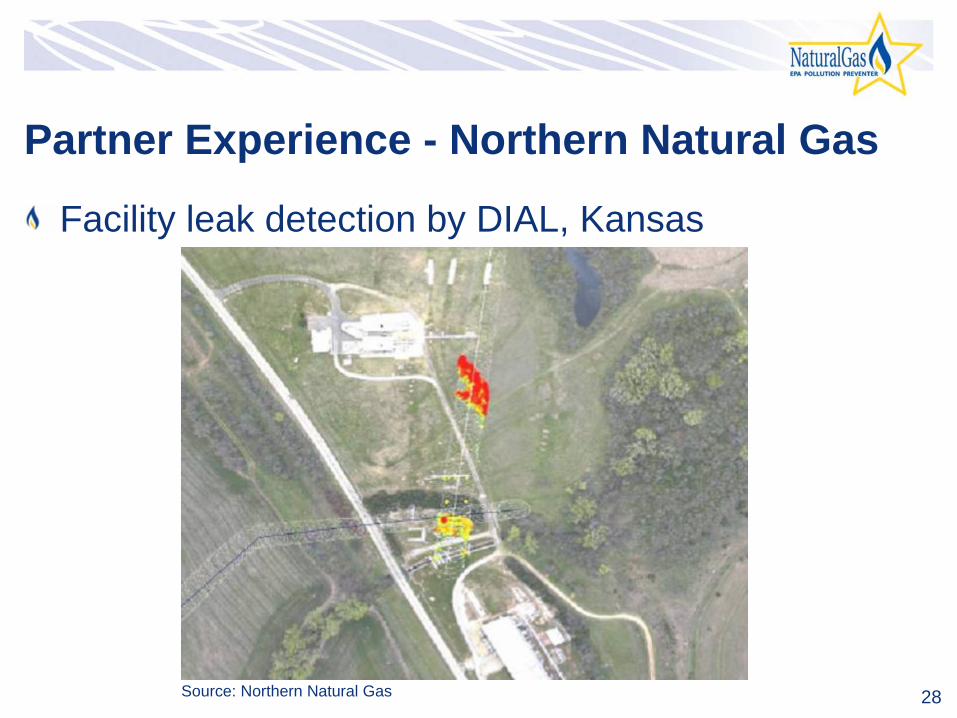
Partner Experience -
Northern Natural Gas
Facility leak detection by DIAL, Kansas
Source: Northern Natural Gas
29
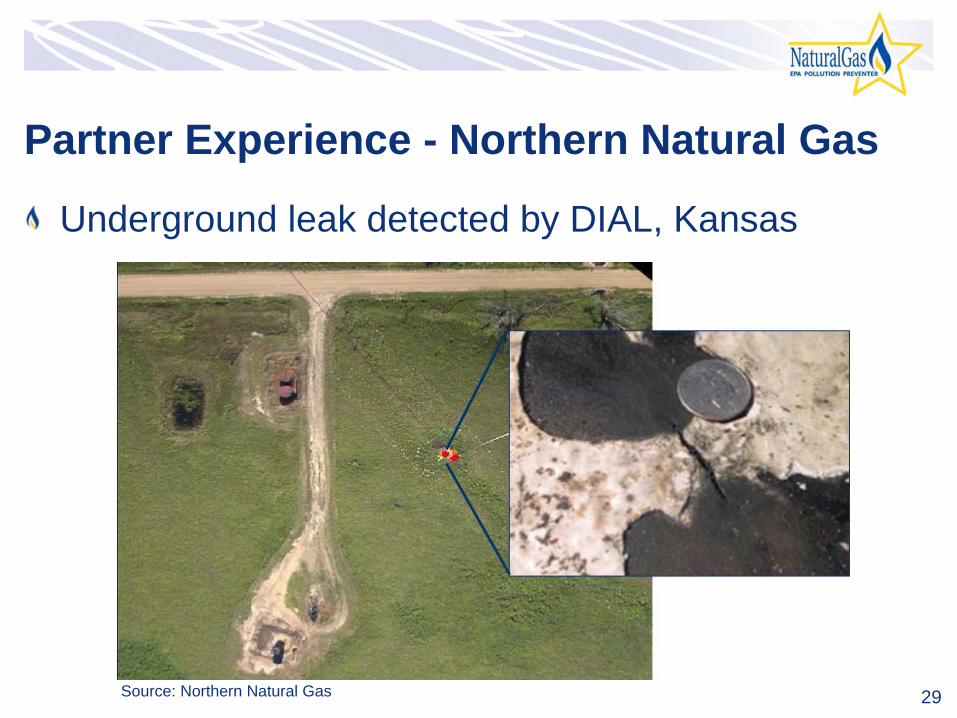
Partner Experience -
Northern Natural Gas
Source: Northern Natural Gas
Underground leak detected by DIAL, Kansas
30
DiscussionIndustry experience applying these technologies and practicesLimitations on application of these technologies and
practicesActual costs and benefits