direct tension test method for characterization of tensile...
TRANSCRIPT

Direct Tension Test Method for
Characterization of Tensile Behavior of Ultra
High Performance Concrete (UHPC)
Pizhong Qiao, Ph.D., PE, Professor
Zhidong Zhou, Ph.D. Candidate
Department of Civil and Environmental Engineering
Washington State University
08/10/2017

o Ultra High Performance Concrete (UHPC) is an innovative
cementitious composite that possesses a compressive strength
greater than 22,000 psi (ACI committee 239) and flexural strengths
greater than 1,500 psi at 28 days.
Performance: strength, durability, ductility and toughness, etc.
• Usually produced with cement, fine quartz sand, silica fume,
steel fibers, and high range water reducing admixture.
• Very low water-to-cementitious materials (w/cm) ratios (< 0.25,
per FHWA) were used to produce UHPC.
• Presetting pressure and/or heat treatment
Key: very dense microstructure & discontinuous pore structure
Smaller sections, reduced weight, more durable, longer service life,
low maintenance cost, seismic/impact resistance.
Background-What, How, Why
2

Normal concrete: flexural strength (ASTM C78) and splitting
tensile strength (ASTM C496).
Methods for Tensile Behavior of UHPC
Fiber reinforced concrete (FRC) and Engineered cementitious
composite (ECC): direct tensile strength
Direct tension method can more realistically predict the tensile
strength and ductile behavior
support, biaxial stress and geometry effects: ratio 1~3 (Victor Li, 1994)
3
4
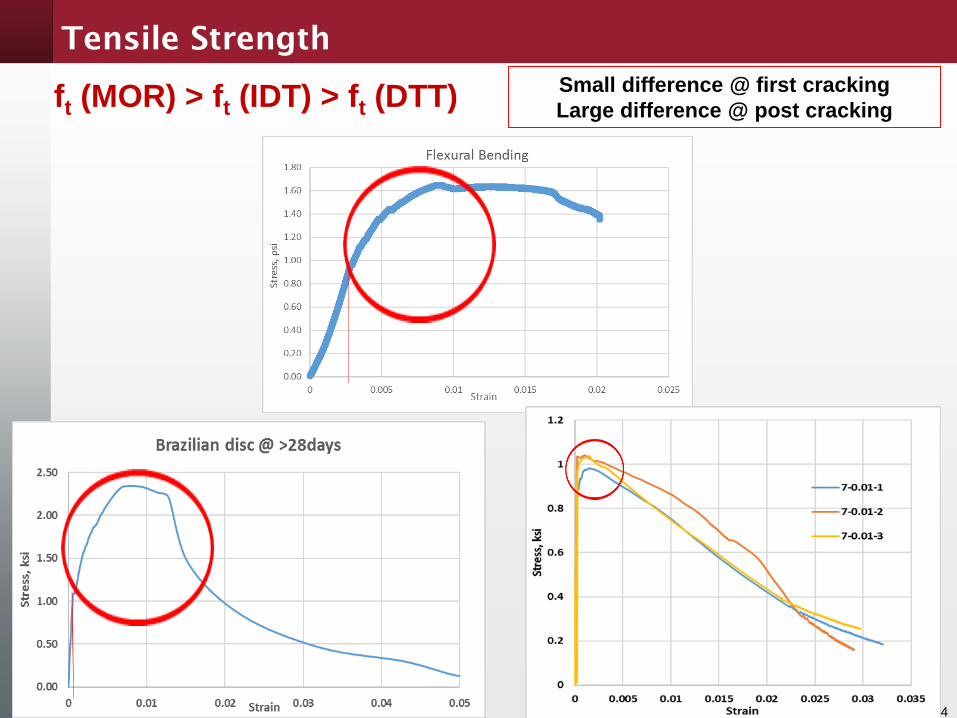
Tensile Strength
ft (MOR) > ft (IDT) > ft (DTT)Small difference @ first cracking
Large difference @ post cracking
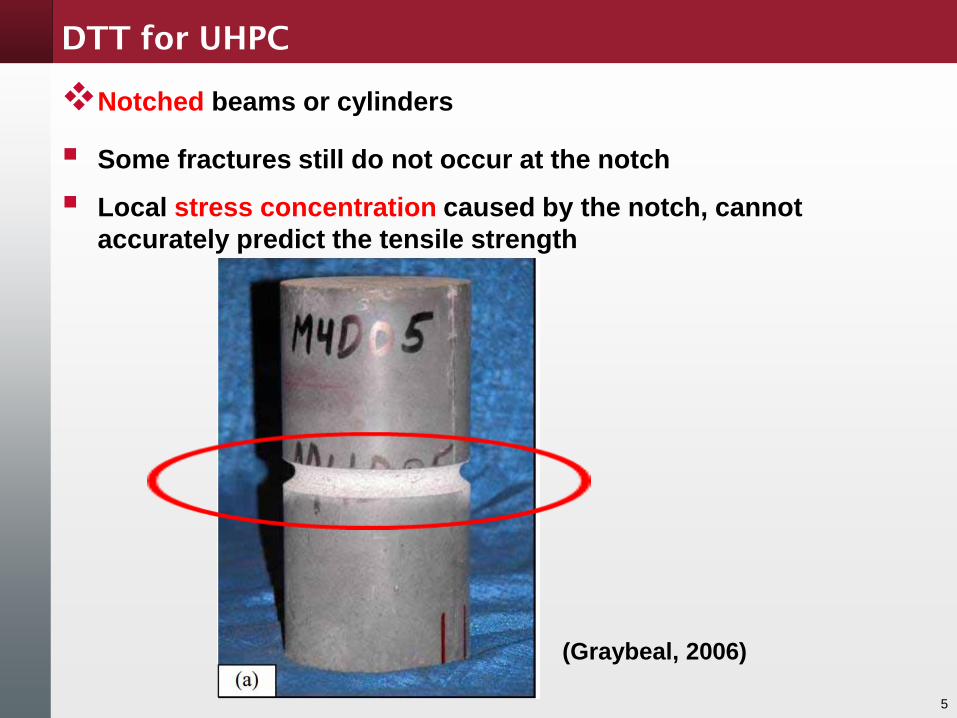
Notched beams or cylinders
Some fractures still do not occur at the notch
Local stress concentration caused by the notch, cannot
accurately predict the tensile strength
(Graybeal, 2006)
DTT for UHPC
5

Unnotched beams or cylinders
High requirements of grip system
Stress concentrations at ends, fractures occur beyond to the gauge
length of LVDTs
(Graybeal, 2006) (Graybeal & Baby, 2013)6
DTT for UHPC
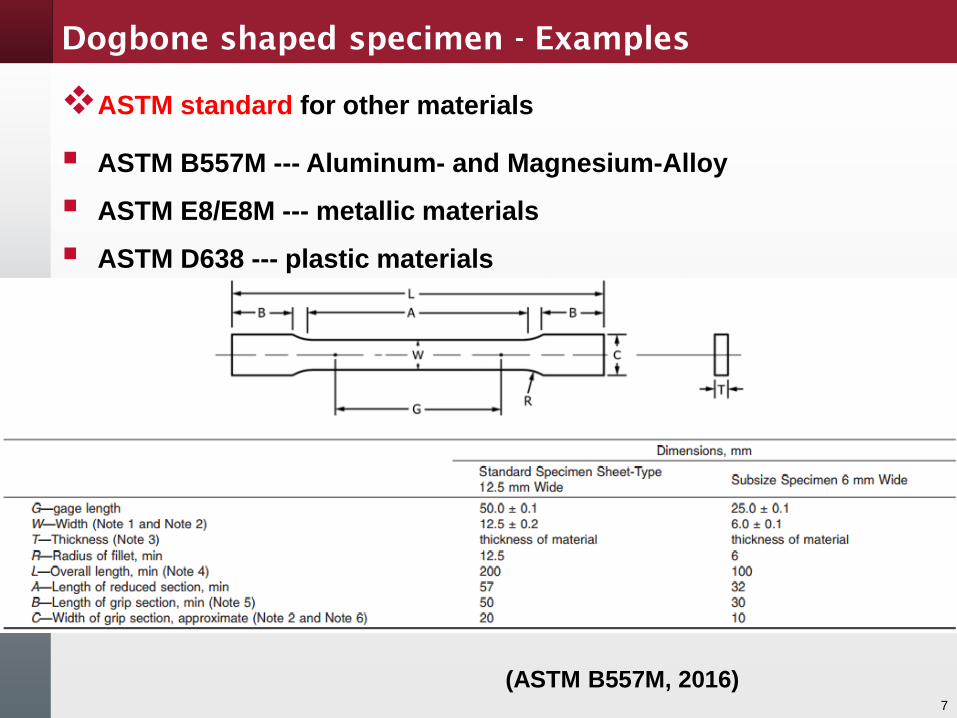
(ASTM B557M, 2016)7
Dogbone shaped specimen - Examples
ASTM standard for other materials
ASTM B557M --- Aluminum- and Magnesium-Alloy
ASTM E8/E8M --- metallic materials
ASTM D638 --- plastic materials

Dogbone shaped specimen
Easily grip and avoid stress concentration
Constant section area and tensile stress at middle part
8
• No standard test protocol:
Specimen dimension
requirements and casting
molds
• Some rotation may form at
post cracking
DTT for UHPC
Modified from ASTM C190-85:
Small cross-section: 1” x 1” x 3”
(Wille et al., 2016)
9
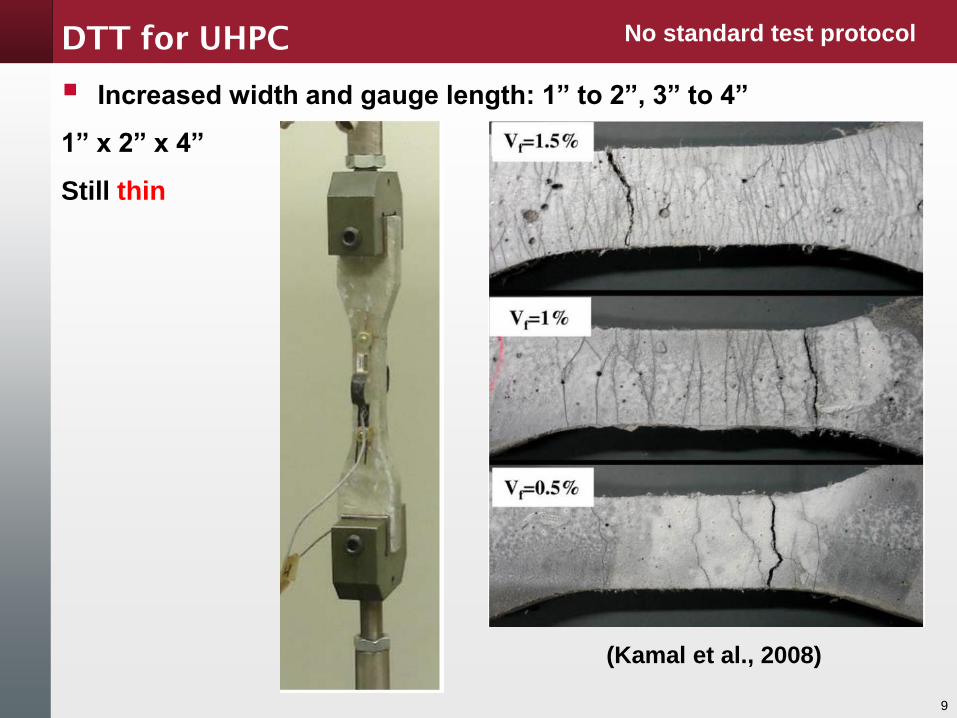
No standard test protocolDTT for UHPC
Increased width and gauge length: 1” to 2”, 3” to 4”
1” x 2” x 4”
Still thin
(Kamal et al., 2008)
10
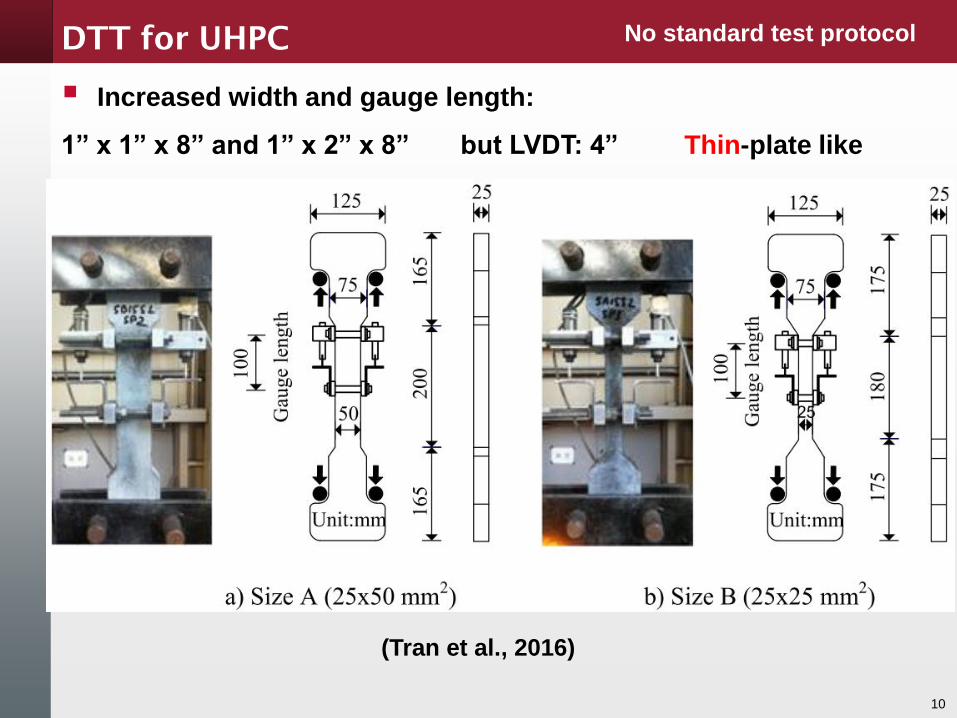
No standard test protocolDTT for UHPC
Increased width and gauge length:
1” x 1” x 8” and 1” x 2” x 8” but LVDT: 4” Thin-plate like
(Tran et al., 2016)
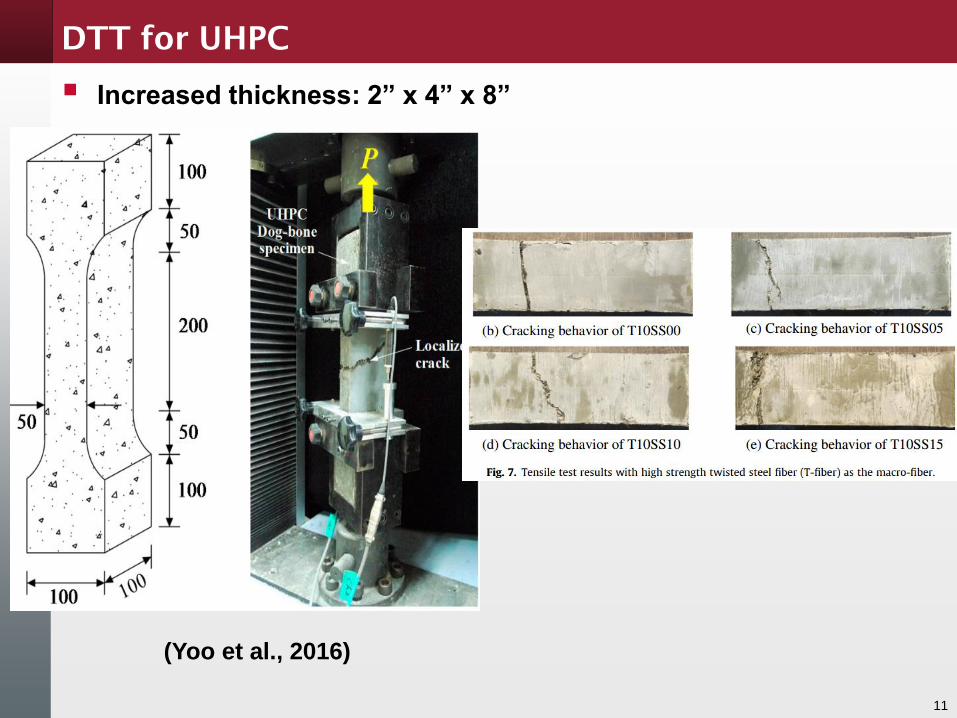
(Yoo et al., 2016)
11
DTT for UHPC
Increased thickness: 2” x 4” x 8”
12
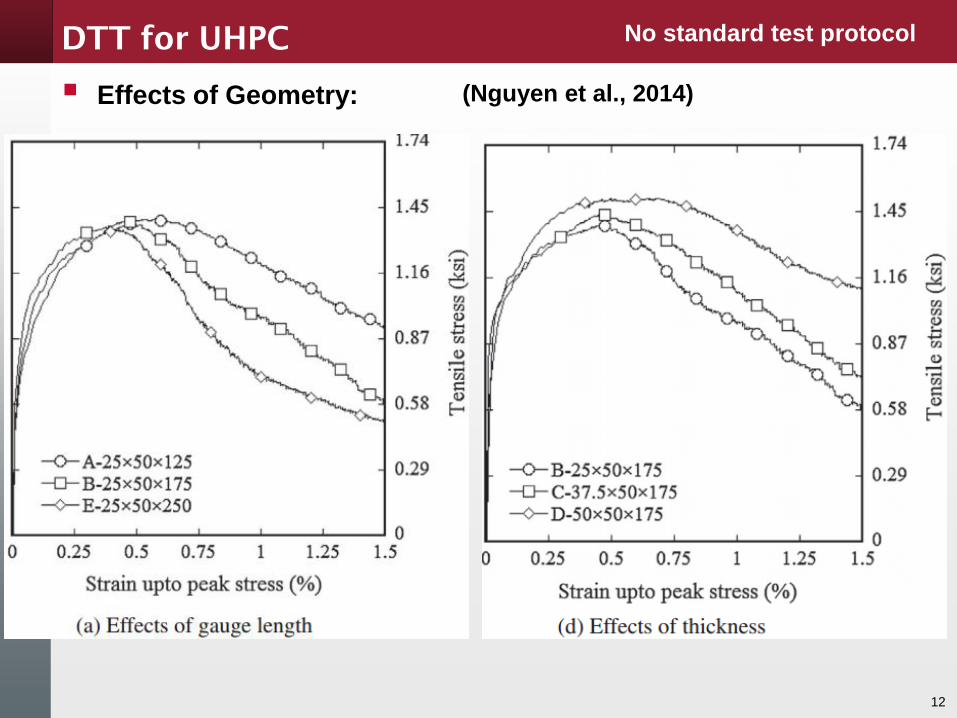
No standard test protocolDTT for UHPC
Effects of Geometry: (Nguyen et al., 2014)

Direct Tension Test for Characterization of Tensile Behavior of
Ultra High Performance Concrete:
• Develop a practical standardized dogbone-shaped specimen
based on trial-and-error experiment and finite element models
• Investigate the tensile behaviors of UHPC using the proposed
DDT design.
• Provide idealized constitutive model to characterize the tensile
responses of UHPC.
Objectives
Development phase
Execution phase
Characterization Model
13
Specimen Design
14
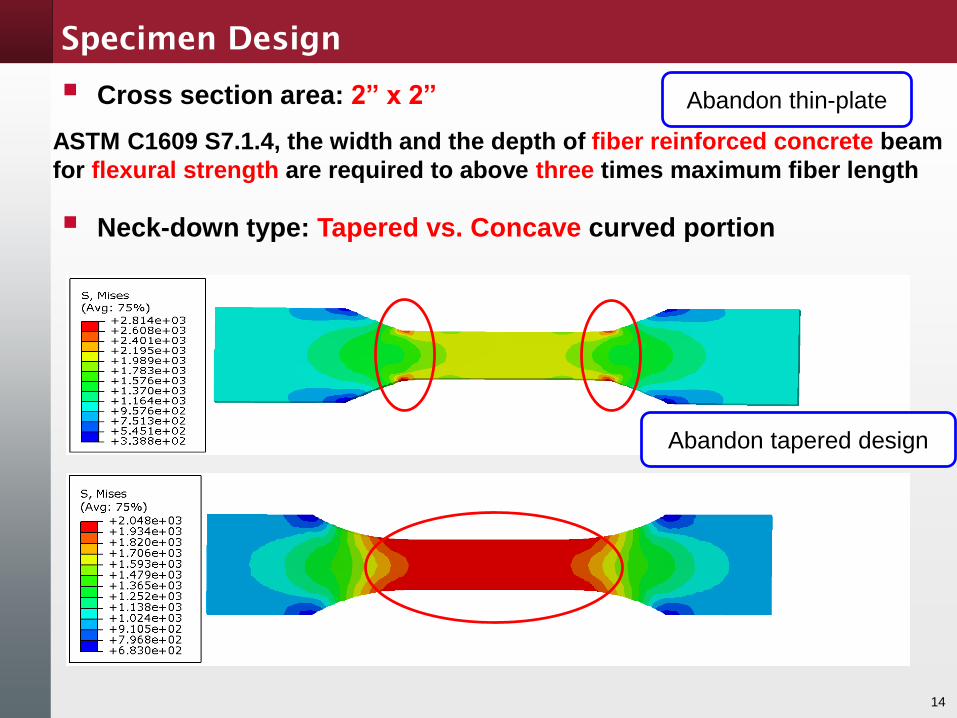
Cross section area: 2” x 2”
ASTM C1609 S7.1.4, the width and the depth of fiber reinforced concrete beam
for flexural strength are required to above three times maximum fiber length
Neck-down type: Tapered vs. Concave curved portion
Abandon thin-plate
Abandon tapered design

• Tapered portion (incompetent Design)
Dimensions of Specimen for DTT Crack pattern
Direct Tension Test (DTT)
15
4.27"
1.73"
6"
1.73"
4.27"
18"2"
2"4"
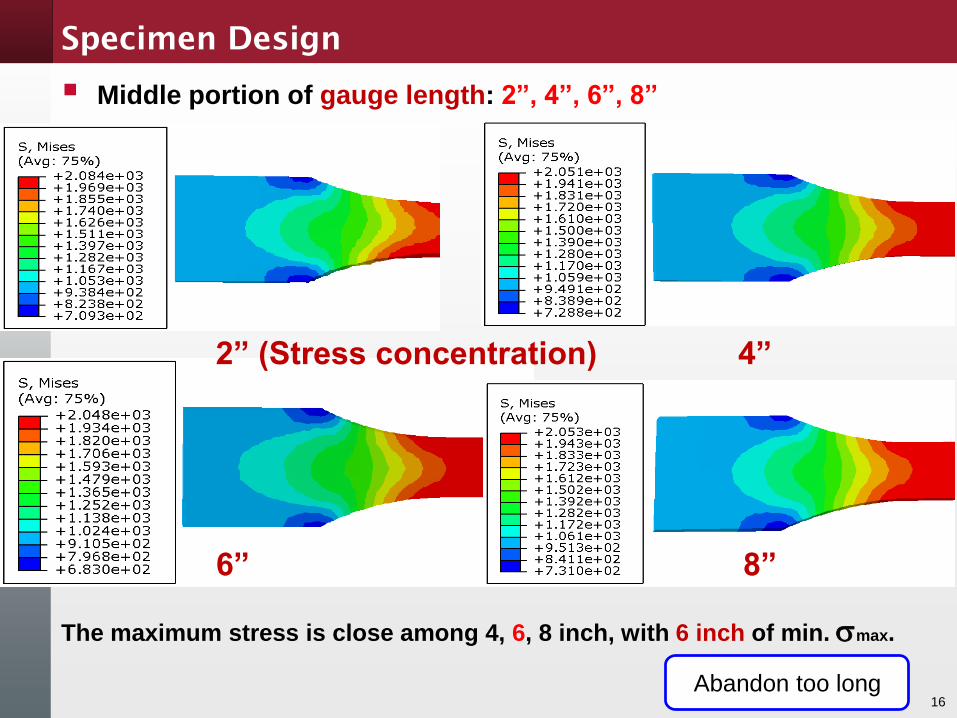
Specimen Design
16
Middle portion of gauge length: 2”, 4”, 6”, 8”
The maximum stress is close among 4, 6, 8 inch, with 6 inch of min. smax.
2” (Stress concentration) 4”
6” 8”
Abandon too long
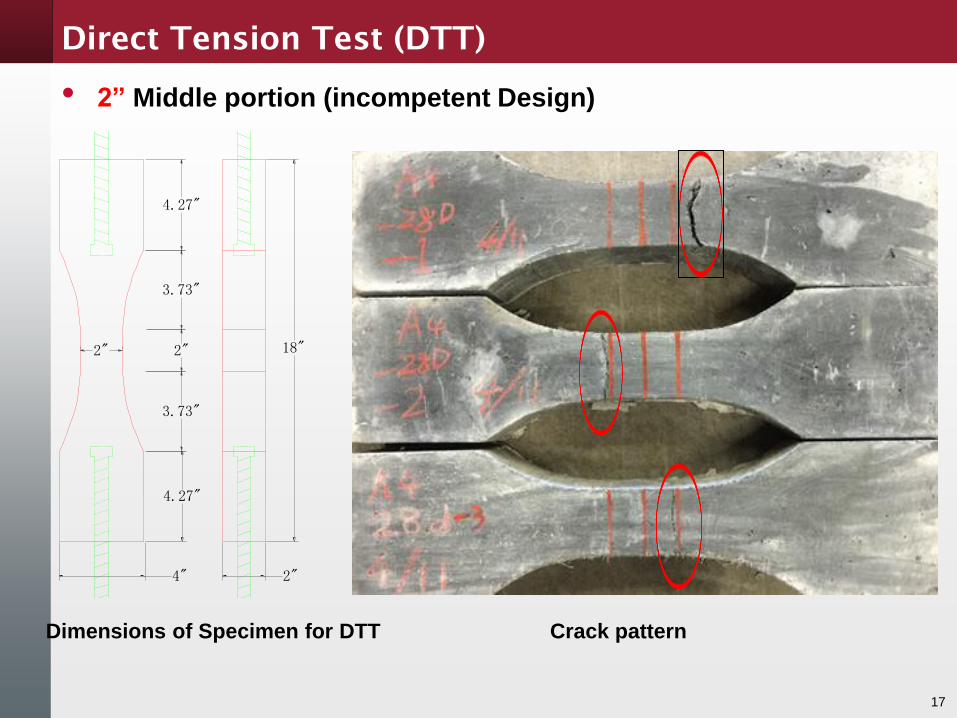
• 2” Middle portion (incompetent Design)
Dimensions of Specimen for DTT Crack pattern
Direct Tension Test (DTT)
17
2"4"
4.27"
3.73"
2"
3.73"
4.27"
18"2"
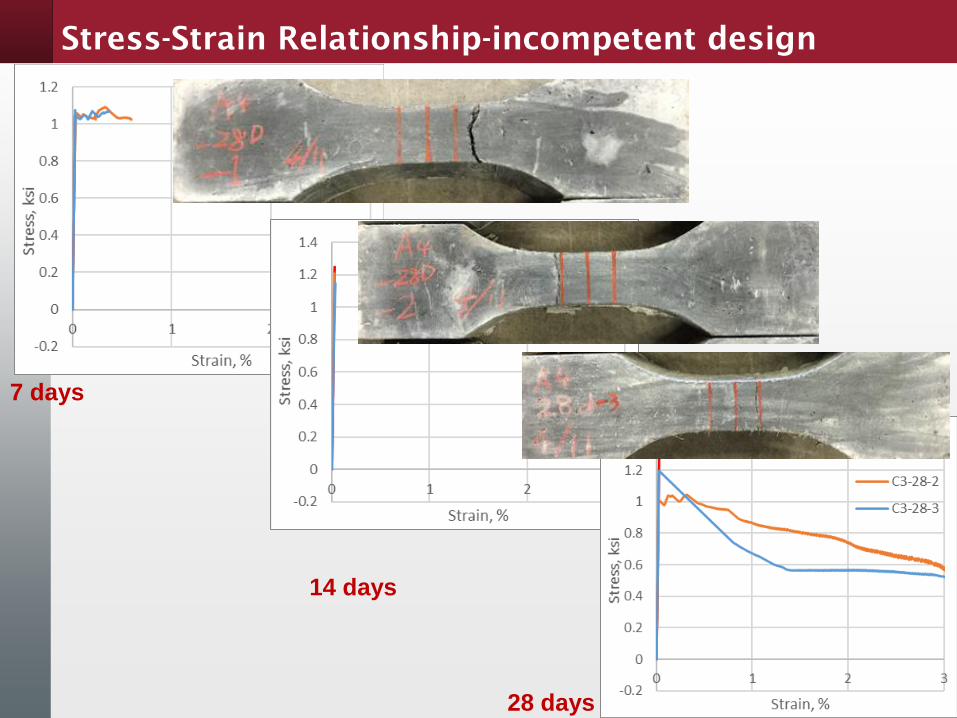
Stress-Strain Relationship-incompetent design
18
7 days
14 days
28 days

Specimen Design
19
End portion width: 3”, 4” Radius of Concave
3” radius
much uniform
stress
distribution
Choose 3” with larger radius
4” radius
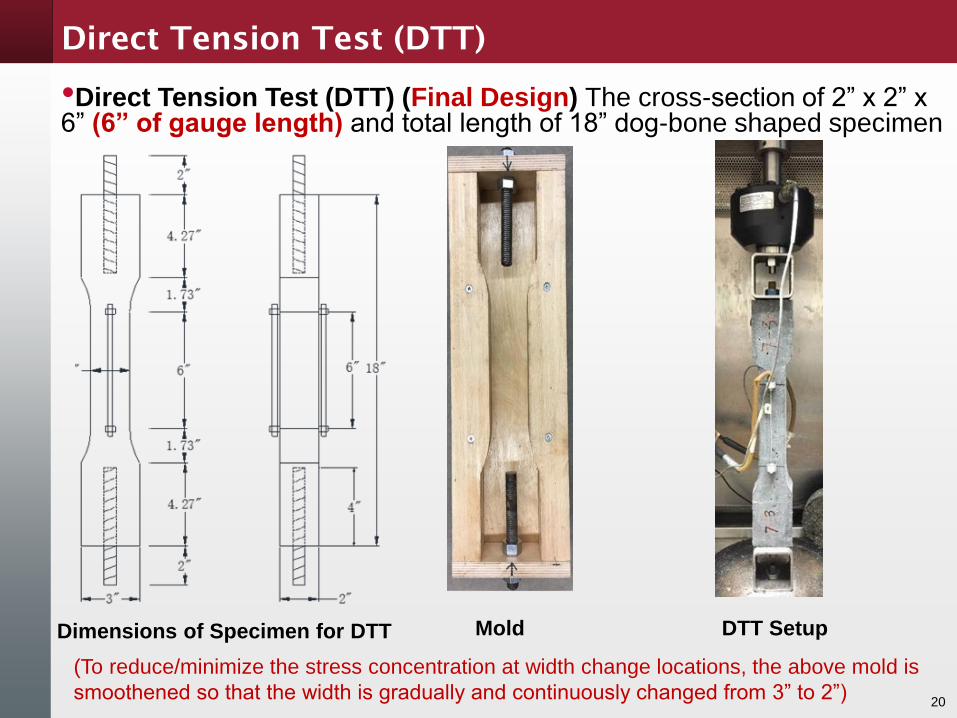
•Direct Tension Test (DTT) (Final Design) The cross-section of 2” x 2” x 6” (6” of gauge length) and total length of 18” dog-bone shaped specimen
Dimensions of Specimen for DTT Mold
Direct Tension Test (DTT)
(To reduce/minimize the stress concentration at width change locations, the above mold is
smoothened so that the width is gradually and continuously changed from 3” to 2”)
DTT Setup
20

UHPC Mix Design
Mixture Type UnitAmoun
tType I/II Portland
Cementlb/yd3 1500
Silica Fume lb/yd3 260
Fine Sand lb/yd3 1574
Steel Fibers lb/yd3 236
HRWRA gal/yd3 11.5
Water lb/yd3 325
w/cm 0.18
Spread Testing In. 9.50
• Locally available sand and
cement
• Domestic steel fibers
• More importantly, the
expensive materials, such as
quartz powder and imported
fibers, are not used
• Within limited low w/cm ratio
and w/o steel aggregates
• Any procedures, such as
application of pre-setting
pressure and heating (which
needs costly equipment), are
not used.
21

Experimental Plan
22
Influencing Factor
Curing age, days
7 days (benchmark)
14 days
28 days
Fiber content
Vf 0%
Vf 1%
Vf 2% (benchmark)
Loading rate
0.01 in./min. (benchmark)
0.1 in./min.
1 in./min.
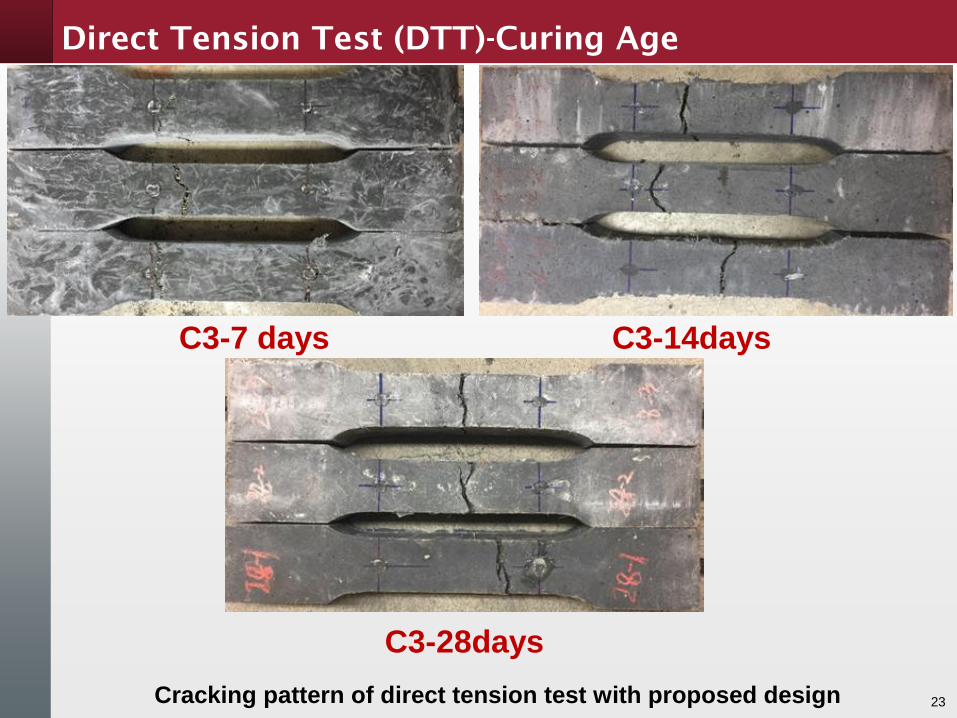
Direct Tension Test (DTT)-Curing Age
C3-28days
C3-7 days C3-14days
Cracking pattern of direct tension test with proposed design 23
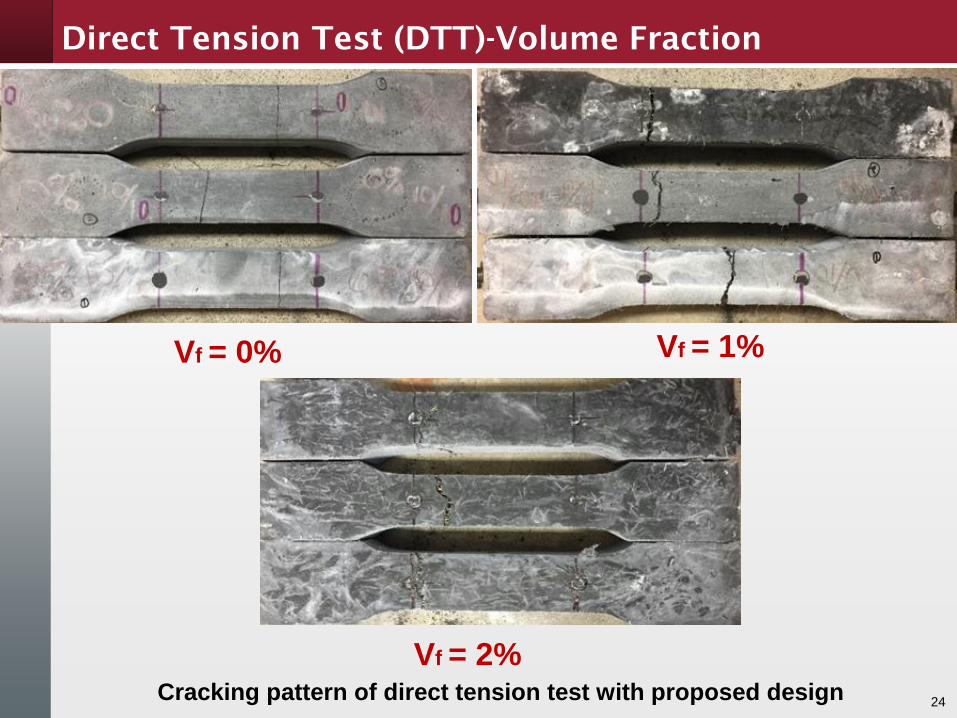
Direct Tension Test (DTT)-Volume Fraction
Vf = 2%Cracking pattern of direct tension test with proposed design
24
Vf = 0% Vf = 1%
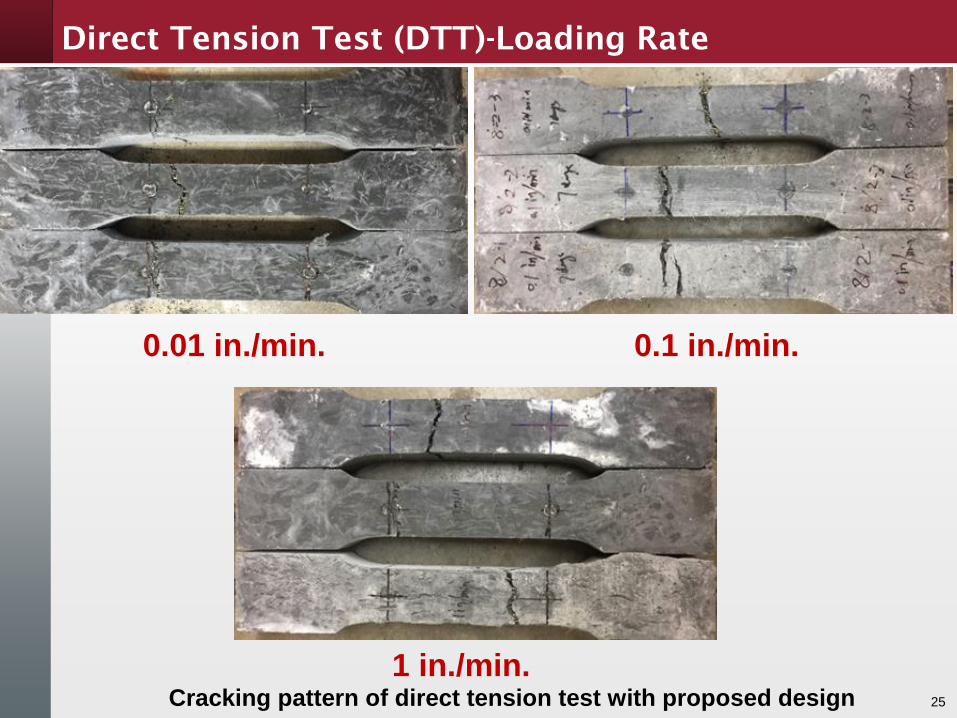
Direct Tension Test (DTT)-Loading Rate
1 in./min. Cracking pattern of direct tension test with proposed design 25
0.01 in./min. 0.1 in./min.
26
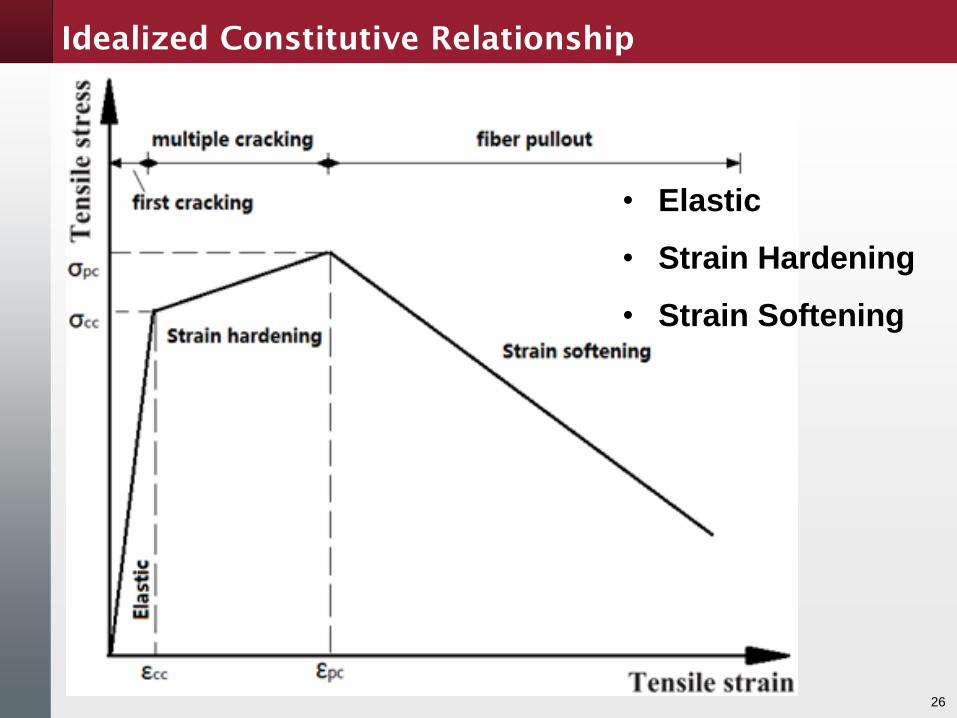
Idealized Constitutive Relationship
• Elastic
• Strain Hardening
• Strain Softening

27
Tensile parameters
• @first cracking strength (σcc)
• @post-cracking tensile strength (σpc)
• Strain @first cracking (εcc)
• Strain @post-cracking (εpc)
• Tangent modulus of elasticity (Ecc)
• Initial modulus of elasticity (Et) @ 40% of tensile strength
• Dissipated energy density prior to post cracking (Gp)
• Total dissipated energy density (Gt)

Stress-Strain Relationship-new design
28
Influence of curing age

29
ID
7days-1 218
224
0.89
0.94
1578
1941
0.98
1.027days-2 242 1.00 2144 1.04
7days-3 213 0.94 2101 1.04
14days-1 200
221
1.01
0.99
2330
2104
1.15
1.1314days-2 240 0.95 1864 1.14
14days-3 224 1.03 2117 1.10
28days-1 228
232
1.10
1.15
2382
2510
1.22
1.2828days-2 217 1.13 2450 1.27
28days-3 252 1.22 2697 1.34
Tensile parameters - Influence of curing age

30
ID
7days-1 4079
4213
4600
4386
1.474
1.868
18.04
18.497days-2 4132 4144 2.091 19.30
7days-3 4428 4413 2.038 18.13
14days-1 5058
4529
4681
4647
2.511
2.457
18.99
17.6914days-2 3946 4653 2.131 17.04
14days-3 4582 4606 2.729 17.05
28days-1 4823
4960
5324
5229
2.675
2.991
18.02
20.5028days-2 5204 5470 2.929 21.31
28days-3 4853 4894 3.370 22.19
Tensile parameters - Influence of curing age
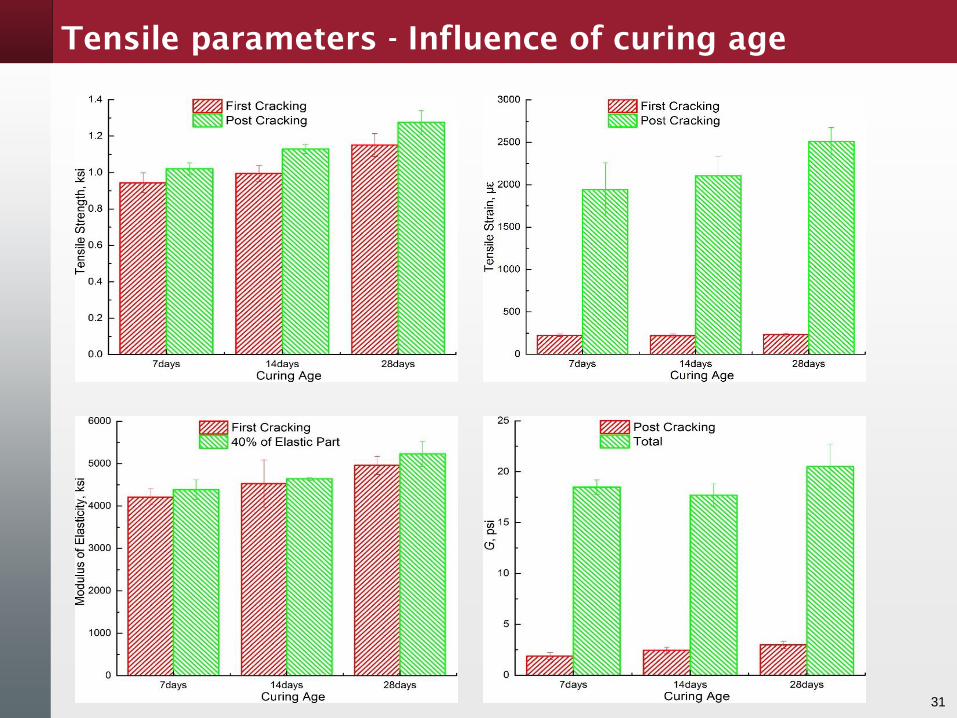
31
Tensile parameters - Influence of curing age
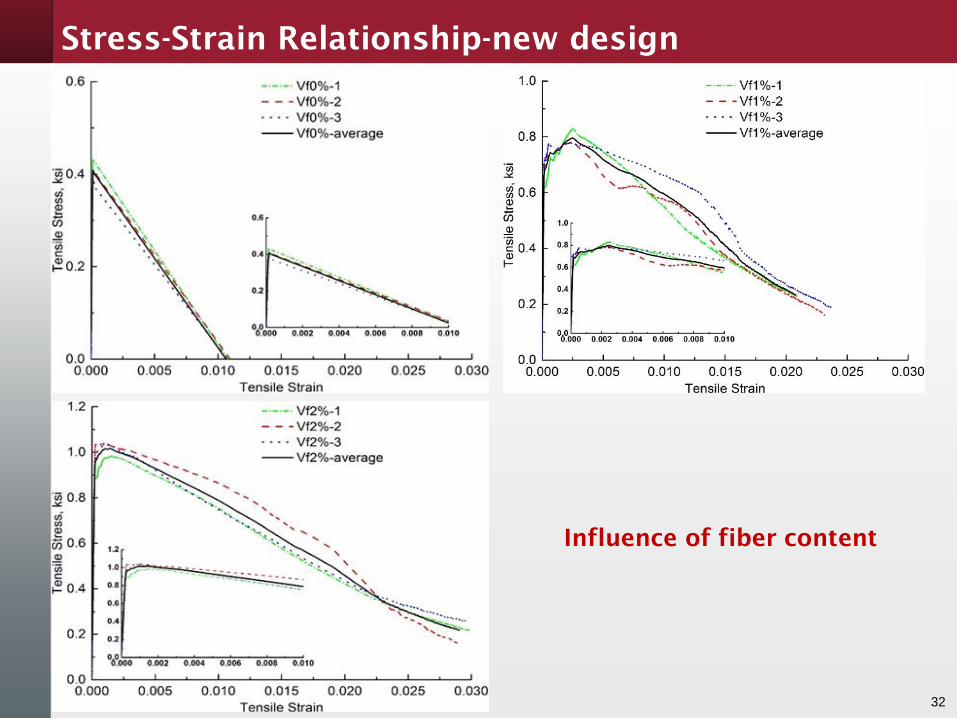
Stress-Strain Relationship-new design
32
Influence of fiber content

33
ID
Vf0%-1 123
121
0.42
0.39
141
154
0.43
0.41Vf0%-2 127 0.38 166 0.41
Vf0%-3 113 0.36 155 0.39
Vf1%-1 156
185
0.62
0.65
2462
2402
0.83
0.80Vf1%-2 187 0.69 2529 0.78
Vf1%-3 213 0.64 2216 0.78
Vf2%-1 218
224
0.89
0.94
1578
1941
0.98
1.02Vf2%-2 242 1.00 2144 1.04
Vf2%-3 213 0.94 2101 1.04
Tensile parameters - Influence of fiber content

34
ID
Vf0%-1 3403
3198
3535
3643
0.037
0.041
0.040
0.062Vf0%-2 3000 3655 0.044 0.059
Vf0%-3 3191 3740 0.041 0.086
Vf1%-1 4000
3576
4023
3954
1.769
1.753
10.98
11.01Vf1%-2 3707 3960 1.854 11.32
Vf1%-3 3021 3878 1.636 10.74
Vf2%-1 4079
4213
4600
4386
1.474
1.868
18.04
18.49Vf2%-2 4132 4144 2.091 19.30
Vf2%-3 4428 4413 2.038 18.13
Tensile parameters - Influence of fiber content

35
Tensile parameters - Influence of fiber content

Stress-Strain Relationship-new design
36
Influence of loading rate

37
ID
0.01in./min.-1 218
224
0.89
0.94
1578
1941
0.98
1.020.01in./min.-2 242 1.00 2144 1.04
0.01in./min.-3 213 0.94 2101 1.04
0.1in./min.-1 220
211
0.88
0.94
2342
2062
1.00
1.050.1in./min.-2 213 0.87 2068 1.04
0.1in./min.-3 200 1.06 1777 1.10
1in./min.-1 226
221
1.09
1.04
2629
2271
1.18
1.121in./min.-2 214 0.98 1925 1.08
1in./min.-3 224 1.06 2258 1.09
Tensile parameters - Influence of loading rate
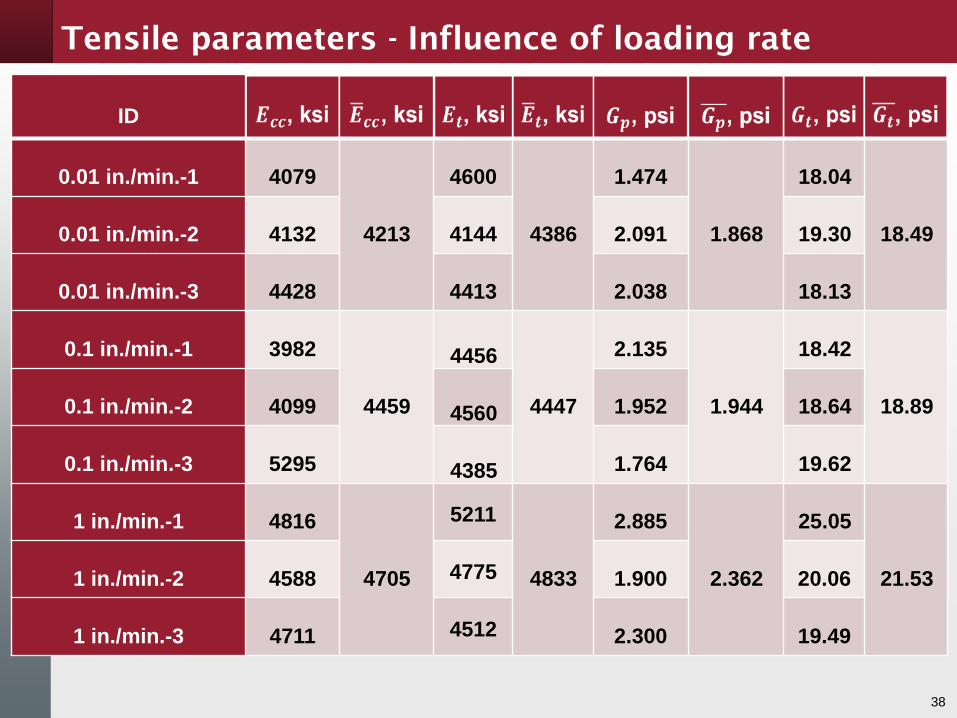
38
ID
0.01 in./min.-1 4079
4213
4600
4386
1.474
1.868
18.04
18.490.01 in./min.-2 4132 4144 2.091 19.30
0.01 in./min.-3 4428 4413 2.038 18.13
0.1 in./min.-1 3982
4459
4456
4447
2.135
1.944
18.42
18.890.1 in./min.-2 4099 4560 1.952 18.64
0.1 in./min.-3 5295 4385 1.764 19.62
1 in./min.-1 4816
4705
5211
4833
2.885
2.362
25.05
21.531 in./min.-2 4588 4775 1.900 20.06
1 in./min.-3 4711 4512 2.300 19.49
Tensile parameters - Influence of loading rate

Tensile parameters - Influence of loading rate
39

Constitutive Model
• Higher tensile strength, strain hardening & softening, and more
ductile behaviors than conventional fiber reinforced concrete
• Three phases: Linear elastic, strain hardening phase (multiple
cracking), strain softening phase (fiber pull-out).
•UHPC matrix and fibers resist
the tensile force cooperatively
•Numerous microcracks form,
interfacial bond starts working
•A visible macrocrack forms,
steel fibers start pulling out
𝜎 =
𝜀
𝜀𝑐𝑐𝜎𝑐𝑐 0 ≤ 𝜀 ≤ 𝜀𝑐𝑐
𝜎𝑐𝑐 +𝜀 − 𝜀𝑐𝑐𝜀𝑝𝑐 − 𝜀𝑐𝑐
(𝜎𝑝𝑐 − 𝜎𝑐𝑐) 𝜀𝑐𝑐 ≤ 𝜀 ≤ 𝜀𝑝𝑐
1 −𝜀 − 𝜀𝑐𝑐𝜀𝑝𝑐 − 𝜀𝑐𝑐
𝜎𝑝𝑐 𝜀 ≥ 𝜀𝑝𝑐
40(Hung et al., 2013)
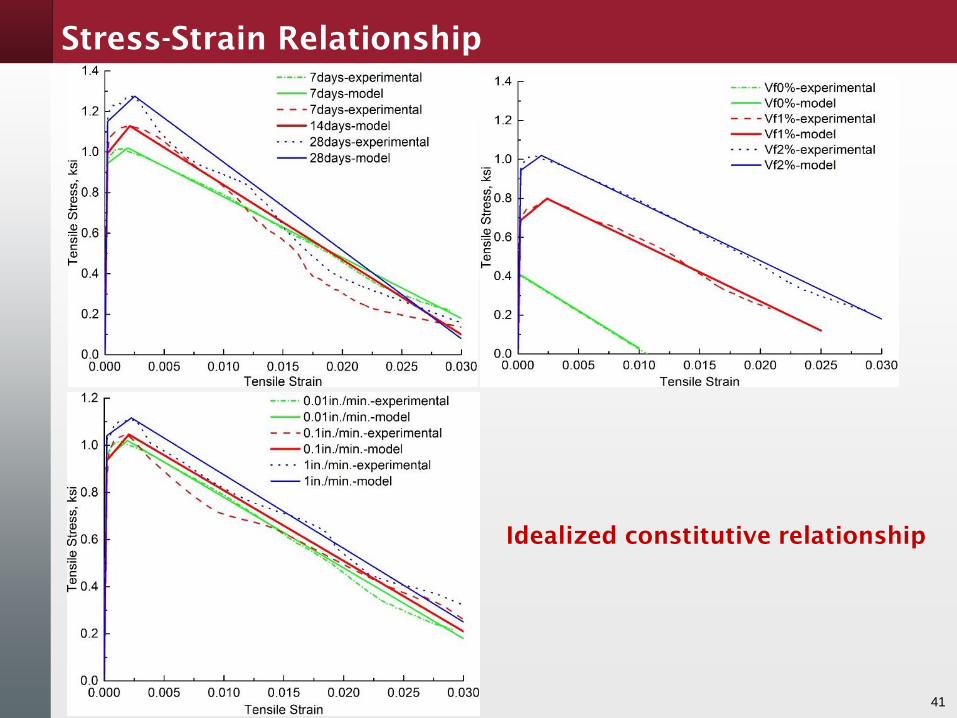
Stress-Strain Relationship
41
Idealized constitutive relationship
42
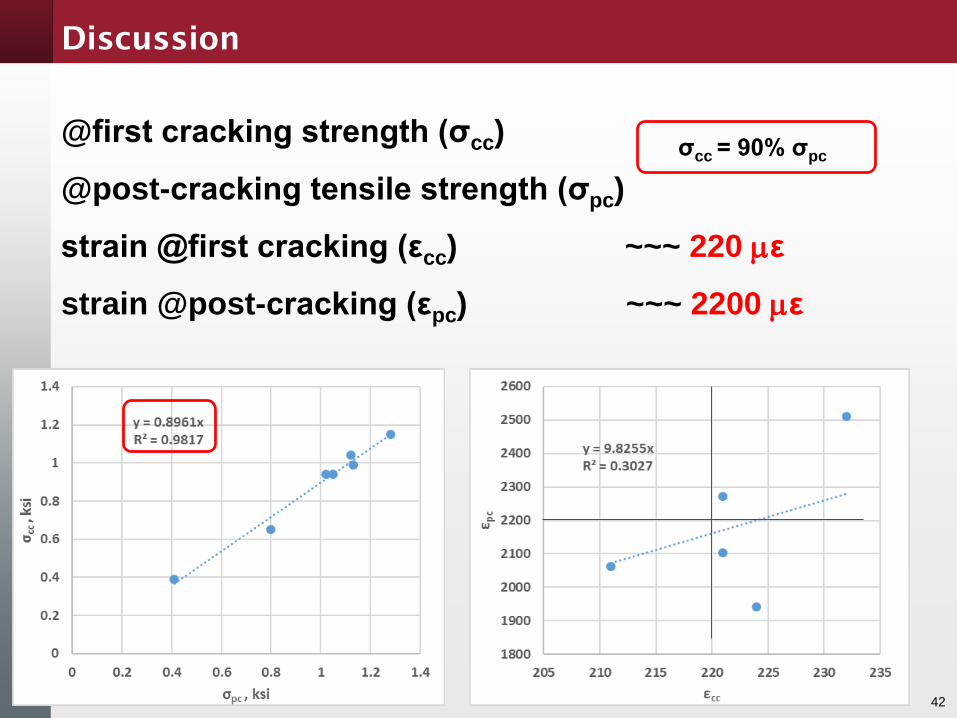
Discussion
@first cracking strength (σcc)
@post-cracking tensile strength (σpc)
strain @first cracking (εcc) ~~~ 220 mε
strain @post-cracking (εpc) ~~~ 2200 mε
σcc = 90% σpc
43
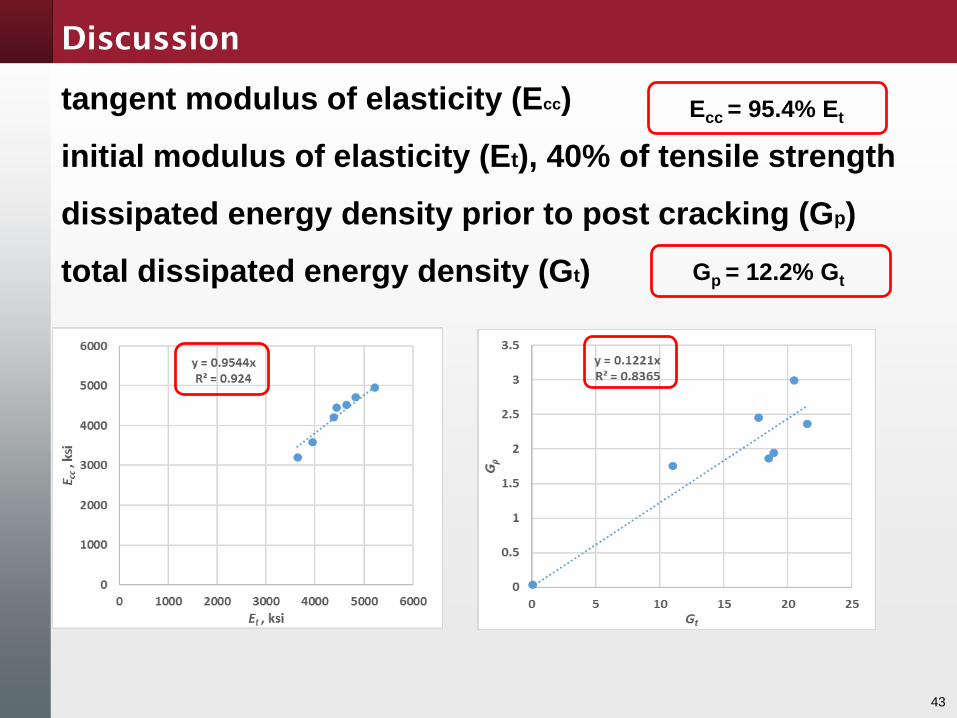
Discussion
tangent modulus of elasticity (Ecc)
initial modulus of elasticity (Et), 40% of tensile strength
dissipated energy density prior to post cracking (Gp)
total dissipated energy density (Gt)
Ecc = 95.4% Et
Gp = 12.2% Gt
Conclusions
• A designated dogbone-shaped specimen was developed for
direct tension test based on trial-and-error experimental
characterization and finite element modeling, from which
drawbacks in specimen design from literature were minimized.
• Tensile behaviors of UHPC were investigated using the
proposed DDT specimen design: .
• An idealized constitutive model was used to characterize the
tensile responses of UHPC into three phases: linear elastic,
strain hardening, and strain softening.
• Four tensile parameters extracted from DTT were implemented
into the idealized constitutive model to reconstruct the three-
phase responses.
• Most of tensile parameters increased with the increasing of
affecting factors (fiber content, curing age, and loading rate).

Conclusions
• Curing age: 7 days of curing gains 85% of stiffness and 82% of
“mature” strength (early properties development).
• Fiber content: 2% fiber UHPC is about 1.32 (stiffness) and 2.41
(strength) times higher than no-fiber reinforced UHPC; but
significant energy dissipation increase (about 46 (up to post
cracking) and 298 times (total energy) higher) (contribution of fiber
to ductility and energy absorption).
• Loading rate: in the studied range of 0.1 to 1 in/min, the effect is
minimal.
45
σcc = 90% σpc Ecc = 95.4% Et Gp = 12.2% Gt
εcc = 220 uε εpc = 2200 uε

46
Acknowledgements
Washington State Department of Transportation
(WSDOT)
Center for Environmentally Sustainable
Transportation in Cold Climates (CESTiCC)

Thank you!
Questions?
47