direct estimation of the rate constant of the reaction ... · direct estimation of the rate...
TRANSCRIPT

Atmos. Chem. Phys., 14, 255–266, 2014www.atmos-chem-phys.net/14/255/2014/doi:10.5194/acp-14-255-2014© Author(s) 2014. CC Attribution 3.0 License.
Atmospheric Chemistry
and PhysicsO
pen Access
Direct estimation of the rate constant of the reactionClO + HO2 → HOCl + O2 from SMILES atmospheric observations
K. Kuribayashi 1,2, H. Sagawa2, R. Lehmann3, T. O. Sato1,2, and Y. Kasai2,1
1Tokyo Institute of Technology, 4259 Nagatsuta-cho, Midori-ku, Yokohama, Kanagawa 226-8503, Japan2National Institute of Information and Communications Technology (NICT), Nukui-kita, Koganei, Tokyo, 184-8795, Japan3Alfred Wegener Institute for Polar and Marine Research, Potsdam, Germany
Correspondence to:K. Kuribayashi ([email protected])
Received: 3 April 2013 – Published in Atmos. Chem. Phys. Discuss.: 14 May 2013Revised: 29 November 2013 – Accepted: 29 November 2013 – Published: 9 January 2014
Abstract. Diurnal variations of ClO, HO2, and HOClwere simultaneously observed by the SuperconductingSubmillimeter-Wave Limb-Emission Sounder (SMILES) be-tween 12 October 2009 and 21 April 2010. These were thefirst global observations of the diurnal variation of HOClin the upper atmosphere. A major reaction for the produc-tion of HOCl is ClO + HO2 →HOCl + O2 (Reaction(R1))in extra-polar regions. A model study suggested that in themesosphere, this is the only reaction influencing the amountof HOCl during the night. The evaluation of the pure re-action period, when only Reaction(R1) occurred in theCly chemical system, was performed by checking the con-sistency of the HOCl production rate with the ClO lossrate from SMILES observation data. It turned out that theSMILES data at the pressure level of 0.28 hPa (about 58 km)in the autumn mid-latitude region (20–40◦ S, February–April2010) during night (between modified local time 18:30 and04:00) were suitable for the estimation of the rate constant,k1. The rate constant obtained from SMILES observationswask1(245 K)= (7.75± 0.25)×10−12 cm3 molecule−1 s−1.This result is consistent with results from a laboratory ex-periment and ab initio calculations for similar low-pressureconditions.
1 Introduction
The Reaction (R1) converts active chlorine monoxide (ClO)into hypochlorous acid (HOCl) as a short-lived reservoir inthe atmosphere:
ClO+ HO2 → HOCl+ O2. (R1)
The Reaction (R1) is the rate-limiting step of a catalyticozone depletion cycle that causes about 7 % and 10 % ofthe ozone loss in the extra-tropical lower stratosphere and inthe Arctic stratospheric vortex, respectively (Lee et al., 2002;Chipperfield et al., 1994).
Several laboratory studies on the rate constant of the Re-action (R1), k1, have been reported (Stimpfle et al., 1979;Knight et al., 2000; Nickolaisen et al., 2000; Hickson et al.,2007). k1 has relatively large uncertainties compared with therate constants of other major reactions in the atmosphericchemistry. For example, thek1 value from Hickson et al.(2007) has an error of about 25 % (k1(296 K)= (6.4±1.6)×
10−12 cm3 molecule−1 s−1), while the rate constant of theCl + O3 →ClO + O2 reaction,k, has an error of about10 % (k(298 K)= (1.21±0.13)×10−11 cm3 molecule−1 s−1)(Seely et al., 1996). Table 1 showsk1 and the error (1σ )calculated from previous laboratory studies at 225 K (whichcorresponds to the typical temperature of the lower strato-sphere). A discrepancy of a factor of 2 between thek1 val-ues fromStimpfle et al.(1979) andKnight et al.(2000) canbe noticed. There is no consistency in the previous labora-tory studies. One reason for this is that the quantification ofthe production of HO2 and ClO in laboratory experiments isdifficult. Large uncertainties and discrepancies ofk1 lead touncertainties of the estimation of the ozone loss in the extra-tropical lower stratosphere and in the Arctic stratosphericvortex.
The validity of k1 values from laboratory studies havebeen discussed using atmospheric observations and modelcalculations of HOCl. Several atmospheric observations ofHOCl in the lower/middle stratosphere have been reported
Published by Copernicus Publications on behalf of the European Geosciences Union.

256 K. Kuribayashi et al.: SMILES HOCl
Table 1.k1 and the error (1σ ) calculated based on previous labora-tory studies at 225 K.
Laboratory measurementsk1(225K)∗ 1σ∗
Stimpfle et al.(1979) 13.80 NoneNickolaisen et al.(2000) 11.36 3.03Knight et al.(2000) 6.61 0.66Hickson et al.(2007) 8.98 3.20
∗ Units: 10−12 cm3 molecule−1 s−1.
(Kovalenko et al., 2007; von Clarmann et al., 2012). Ko-valenko et al.(2007) reported that their HOCl measurementsby balloon-borne infrared spectrometers FIRS-2 and MkIVagreed better with thek1 value based onStimpfle et al.(1979) than that recommended by the Jet Propulsion Labo-ratory (JPL) 2006 (Sander et al., 2006). von Clarmann et al.(2012) confirmed that thek1 of the JPL 2009 recommenda-tion (Sander et al., 2010) explained the middle stratosphericHOCl abundance measured by the Envisat/MIPAS instru-ment better than thek1 of the JPL 2006 recommendation(Sander et al., 2006).
A high-sensitivity remote sensing instrument namedthe Superconducting Submillimeter-Wave Limb-EmissionSounder (SMILES) on the International Space Station (ISS)performed the first simultaneous observations of the diur-nal variations of HOCl, ClO, and HO2 in the middle at-mosphere. The observation period was between 12 October2009 and 21 April 2010. The latitude and altitude coverageof the SMILES observations was nominally 38◦ S–65◦ N and16–90 km, respectively. An overview of SMILES is given inKikuchi et al. (2010). Details of the observation of O3 andClO are described inKasai et al.(2013), Sato et al.(2012),andSagawa et al.(2013).
In this paper, we directly derivek1 from the diurnal vari-ations of HOCl, ClO, and HO2 observed by SMILES in thelower mesosphere. We evaluate the “purity” of Reaction (R1)using both of the rate of HOCl production and the rate ofClO loss. Here “purity” means that only the Reaction (R1)modifies the concentration of ClO and HOCl, and the effectof competitive reactions does not appear in the observation.This “purity” condition is essential for the accurate estima-tion of k1. It is difficult to obtain such a condition in strato-spheric observations. In the stratosphere, several competitivereactions exist that modify the amount of HOCl and ClO.The photolysis of HOCl occurs during daytime, and ClO isconsumed by the reaction ClO + NO2 + M →ClONO2 + Mduring nighttime.
2 Model calculation of Cly chemistry in the lowermesosphere
In order to derive the rate constant of a chemical reac-tion from the observations of the concentrations of chemicalspecies in the atmosphere, two basic approaches are possible.
a. Steady-state approach: if the reaction of interest is in-volved in the production or destruction of a chemicalspecies that is at steady state, then the correspondingbalance equation (chemical production= depletion)may be exploited. It can be solved for the unknownrate constant, if the rate constants of all other involvedreactions and the concentrations of all the reactantsare known. The disadvantage of this method is that,besides the reaction of interest, at least one more re-action is involved in the chemical equilibrium. Thatis why assumptions about the corresponding reactionrate constant(s) must be made.
b. Exploitation of the temporal evolution of the concen-tration of a chemical species: an estimate of the rateconstant of the reaction of interest can be obtainedfrom the rate of change of the concentration of a reac-tant or product of this reaction. This approach is espe-cially useful if it is applied under conditions in whichthe concentration of a certain species is affected onlyby the reaction of interest, because then no assump-tions about the rate constants of other reactions areneeded.
We used approach (b) for the calculation ofk1 from theSMILES HOCl, ClO, and HO2 observations. In order tofind out under which conditions the temporal evolution ofHOCl can be expected to be determined solely by the Reac-tion (R1), we ran the AWI (Alfred Wegener Institute) chem-ical box model at different altitudes. This model simulates175 reactions between 48 chemical species in the strato-sphere and mesosphere. We performed 3D runs, the last 24 hof which were used for the analysis. SMILES observations(bi-monthly mean data within latitude and altitude bins) wereused for the initialization of these runs. For the species whichwere not observed by SMILES, initial mixing ratios weretaken fromBrasseur et al.(1999), Appendix C, with the ex-ception of that of water vapour; its initial mixing ratio wasadjusted such that the diurnally varying mixing ratio of ClOrepeated every 24 h in the simulation.
These model runs yielded the following results:
1. Daytime conditions are not suitable for the applicationof method (b), because the photolysis of HOCl coun-teracts the Reaction (R1).
2. Nighttime conditions in the lower and mid stratosphereare not suitable, because the Reaction (R1) nearlystops shortly after sunset, when the concentration ofHO2 almost vanishes (the production of [HOx] = [OH]
Atmos. Chem. Phys., 14, 255–266, 2014 www.atmos-chem-phys.net/14/255/2014/
K. Kuribayashi et al.: SMILES HOCl 257K. Kuribayashi et al.: SMILES HOCl 3
0 6 12 18 24
0
20
40
60
80
100
120
ClO
Cl
ClONO2
HOCl
Chlorine partitioning (HCl omitted), 58 km
[h]
[ppt]
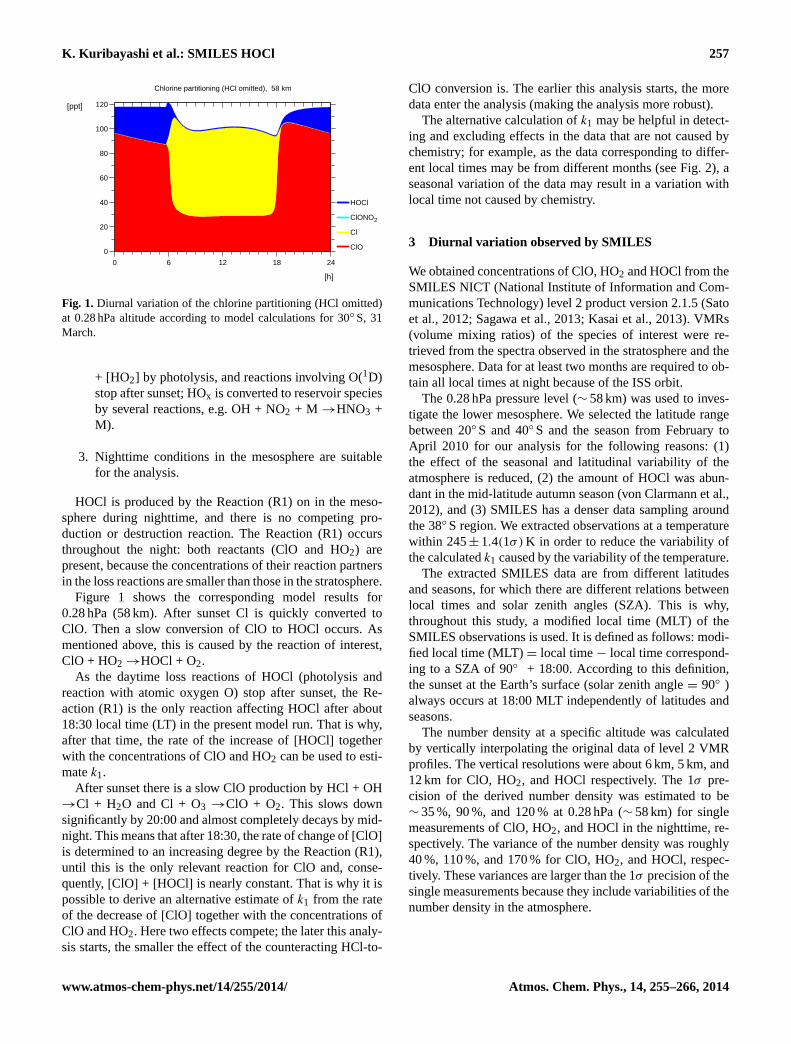
Fig. 1. Diurnal variation of the chlorine partitioning (HCl omitted)at 0.28 hPa altitude according to model calculations for 30◦S, 31March.
present, because the concentrations of their reaction partnersin the loss reactions are smaller than those in the stratosphere.
Figure 1 shows the corresponding model results for0.28 hPa (58 km). After sunsetCl is quickly converted toClO. Then, a slow conversion ofClO to HOCl occurs. As5
mentioned above, this is caused by the reaction of interest,ClO + HO2 →HOCl + O2.
As the daytime loss reactions ofHOCl (photolysis andreaction with atomic oxygenO) stop after sunset, the Re-action (R1) is the only reaction affectingHOCl after about10
local time (LT) 18:30 in the present model run. That is why,after that time, the rate of the increase of[HOCl] togetherwith the concentrations ofClO andHO2 may be used to es-timatek1.
After sunset there is a slowClO production byHCl + OH15
→Cl + H2O andCl + O3 →ClO + O2. This slows downsignificantly until 20:00 and almost completely decays untilmidnight. This means that after 18:30 the rate of change of[ClO] is determined to an increasing degree by the reaction(R1), until this is the only relevant reaction forClO and, con-20
sequently,[ClO] + [HOCl] is nearly constant. That is why itis possible to derive an alternative estimate ofk1 from therate of the decrease of[ClO] together with the concentra-tions ofClO andHO2. Here two effects compete: The laterthis analysis starts, the smaller is the effect of the counteract-25
ing HCl–to–ClO conversion. The earlier this analysis starts,the more data enter the analysis, making it more robust.
The alternative calculation ofk1 may be helpful to detectand exclude effects in the data that are not caused by chem-istry: for example, as the data corresponding to different local30
times may be from different months (see Fig. 2), a seasonalvariation of the data may result in a variation with local timenot caused by chemistry.
3 Diurnal variation observed by SMILES
We obtained concentrations ofClO, HO2 andHOCl from35
the SMILES NICT level-2 product version 2.1.5 (Sato et al.,2012; Sagawa et al., 2013; Kasai et al., 2013). VMRs (vol-ume mixing ratios) of the species of interest were retrievedfrom the spectra observed in the stratosphere and the meso-sphere. Data of at least two months are required to obtain all40
local times at night because of the ISS orbit.The 0.28 hPa pressure level (∼58 km) was used to inves-
tigate the lower mesosphere. We selected the latitude rangebetween 20◦S and 40◦S and the season between Februaryand April 2010 for our analysisby the following reasons: (1)45
The effect of the seasonal and latitudinal variability of theatmosphere is reduced, (2) the amount ofHOCl was abun-dant in the mid-latitude autumn season (von Clarmann et al.,2012), and (3) SMILES has a denser data sampling aroundthe 38◦S region. We extracted observations at a temperature50
within 245± 1.4(1σ)K in order to reduce the variability ofthe calculatedk1 caused by the variability of the temperature.
The extracted SMILES data merge different latitudes andseasons that have a different relation between local timesand solar zenith angles (SZA). This is why, throughout this55
study, a Modified Local Time (MLT) of the SMILES obser-vations is used. It is defined as follows: Modified Local Time(MLT) = local time - local time corresponding to a SZA of90◦ + 18:00. According to this definition, the sunset at theEarth’s surface (solar zenith angle = 90◦ ) always occurs at60
MLT18:00 independently of latitudes and seasons.The number density at a specific altitude was calculated
by vertically interpolating the original data of level-2 VMRprofiles. The vertical resolutions were about 6 km, 5 km, and12 km forClO, HO2, andHOCl respectively. The1σ pre-65
cision of the derived number density was estimated to be∼ 35 %, 90 %, and 120 % at 0.28 hPa (∼58 km) for singlemeasurements ofClO, HO2, andHOCl in the nighttime, re-spectively. The variance of the number density was roughly40 %, 110 %, and 170 % forClO, HO2, andHOCl, respec-70
tively. These variances are larger than the1σ precisionof thesingle measurements because they include variabilities of thenumber density in the atmosphere.
The number of data was about 6,000 during the nighttime(MLT 18:00–06:00). This number is large enough for statis-75
tical analysis.Figure 2 shows the diurnal variations ofClO,HO2,HOCl,
and the sum of [ClO] and [HOCl] in the lower meso-sphere (0.28 hPa).Individual observations and averages over3.75 min are presented.The horizontal and vertical axes are80
the modified local time and the number density of eachmolecule, respectively.The lowest panel in Fig. 2 is themod-ified local time dependence of the number of the extractedSMILES data for each month.
The systematic error (bias) of SMILES NICTClO data85
was estimated theoretically by Sato et al. (2012) and Sagawaet al. (2013). These theoretical estimations of the system-
Fig. 1. Diurnal variation of the chlorine partitioning (HCl omitted)at 0.28 hPa altitude according to model calculations for 30◦ S, 31March.
+ [HO2] by photolysis, and reactions involving O(1D)stop after sunset; HOx is converted to reservoir speciesby several reactions, e.g. OH + NO2 + M →HNO3 +M).
3. Nighttime conditions in the mesosphere are suitablefor the analysis.
HOCl is produced by the Reaction (R1) on in the meso-sphere during nighttime, and there is no competing pro-duction or destruction reaction. The Reaction (R1) occursthroughout the night: both reactants (ClO and HO2) arepresent, because the concentrations of their reaction partnersin the loss reactions are smaller than those in the stratosphere.
Figure 1 shows the corresponding model results for0.28 hPa (58 km). After sunset Cl is quickly converted toClO. Then a slow conversion of ClO to HOCl occurs. Asmentioned above, this is caused by the reaction of interest,ClO + HO2 →HOCl + O2.
As the daytime loss reactions of HOCl (photolysis andreaction with atomic oxygen O) stop after sunset, the Re-action (R1) is the only reaction affecting HOCl after about18:30 local time (LT) in the present model run. That is why,after that time, the rate of the increase of[HOCl] togetherwith the concentrations of ClO and HO2 can be used to esti-matek1.
After sunset there is a slow ClO production by HCl + OH→Cl + H2O and Cl + O3 →ClO + O2. This slows downsignificantly by 20:00 and almost completely decays by mid-night. This means that after 18:30, the rate of change of[ClO]
is determined to an increasing degree by the Reaction (R1),until this is the only relevant reaction for ClO and, conse-quently,[ClO] + [HOCl] is nearly constant. That is why it ispossible to derive an alternative estimate ofk1 from the rateof the decrease of[ClO] together with the concentrations ofClO and HO2. Here two effects compete; the later this analy-sis starts, the smaller the effect of the counteracting HCl-to-
ClO conversion is. The earlier this analysis starts, the moredata enter the analysis (making the analysis more robust).
The alternative calculation ofk1 may be helpful in detect-ing and excluding effects in the data that are not caused bychemistry; for example, as the data corresponding to differ-ent local times may be from different months (see Fig.2), aseasonal variation of the data may result in a variation withlocal time not caused by chemistry.
3 Diurnal variation observed by SMILES
We obtained concentrations of ClO, HO2 and HOCl from theSMILES NICT (National Institute of Information and Com-munications Technology) level 2 product version 2.1.5 (Satoet al., 2012; Sagawa et al., 2013; Kasai et al., 2013). VMRs(volume mixing ratios) of the species of interest were re-trieved from the spectra observed in the stratosphere and themesosphere. Data for at least two months are required to ob-tain all local times at night because of the ISS orbit.
The 0.28 hPa pressure level (∼ 58 km) was used to inves-tigate the lower mesosphere. We selected the latitude rangebetween 20◦ S and 40◦ S and the season from February toApril 2010 for our analysis for the following reasons: (1)the effect of the seasonal and latitudinal variability of theatmosphere is reduced, (2) the amount of HOCl was abun-dant in the mid-latitude autumn season (von Clarmann et al.,2012), and (3) SMILES has a denser data sampling aroundthe 38◦ S region. We extracted observations at a temperaturewithin 245± 1.4(1σ) K in order to reduce the variability ofthe calculatedk1 caused by the variability of the temperature.
The extracted SMILES data are from different latitudesand seasons, for which there are different relations betweenlocal times and solar zenith angles (SZA). This is why,throughout this study, a modified local time (MLT) of theSMILES observations is used. It is defined as follows: modi-fied local time (MLT)= local time− local time correspond-ing to a SZA of 90◦ + 18:00. According to this definition,the sunset at the Earth’s surface (solar zenith angle= 90◦ )always occurs at 18:00 MLT independently of latitudes andseasons.
The number density at a specific altitude was calculatedby vertically interpolating the original data of level 2 VMRprofiles. The vertical resolutions were about 6 km, 5 km, and12 km for ClO, HO2, and HOCl respectively. The 1σ pre-cision of the derived number density was estimated to be∼ 35 %, 90 %, and 120 % at 0.28 hPa (∼ 58 km) for singlemeasurements of ClO, HO2, and HOCl in the nighttime, re-spectively. The variance of the number density was roughly40 %, 110 %, and 170 % for ClO, HO2, and HOCl, respec-tively. These variances are larger than the 1σ precision of thesingle measurements because they include variabilities of thenumber density in the atmosphere.
www.atmos-chem-phys.net/14/255/2014/ Atmos. Chem. Phys., 14, 255–266, 2014

258 K. Kuribayashi et al.: SMILES HOCl
The number of data was about 6000 during the nighttime(18:00–06:00 MLT). This number is large enough for statis-tical analysis.
Figure2 shows the diurnal variations of ClO, HO2, HOCl,and the sum of [ClO] and [HOCl] in the lower meso-sphere (0.28 hPa). Individual observations and averages over3.75 min are presented. The horizontal and vertical axes arethe modified local time and the number density of eachmolecule, respectively. The lowest panel in Fig.2 is the mod-ified local time dependence of the number of the extractedSMILES data for each month.
The systematic error (bias) of SMILES NICT ClO datawas estimated in a theoretical manner bySato et al.(2012)andSagawa et al.(2013). Theoretical estimations of the sys-tematic errors are done by a forward-model simulation usinga certain reference atmospheric state, and they do not includethe actual measurement noise of SMILES observations in or-der to estimate the maximum impact of each error factor onthe bias uncertainties. According toSagawa et al.(2013), thesystematic error for ClO is up to about 3 % at 0.28 hPa for themid-latitude nighttime. In this study, we adopt the systematicerror of 3 %, which is derived from the theoretical system-atic error analysis of ClO, for all the considered species. TheSMILES ClO, HO2, and HOCl products have been comparedto other satellite measurements (Khosravi et al., 2013). How-ever, due to the limitation in the number of compared instru-ments and due to the large difference in the sensitivity andobservation local time of each instrument, it is not possibleto determine which instrument has positive/negative bias er-rors. Despite such technical difficulties, the diurnal variationof the SMILES ClO, HO2, and HOCl show general agree-ment both in the quantity and shape (Khosravi et al., 2013).It is noted that more robust evaluation on the systematic er-ror of our analysis will be addressed when further validationworks of SMILES products are completed.
4 Estimation of k1
4.1 Method of the estimation
The results of our model calculation suggested that[ClO] +[HOCl] increases rapidly until about 18:30 and undergoesonly a small increase (10 %) afterwards. As shown in Fig.1,the sum of[ClO] + [HOCl] is nearly constant after that. Thisrelation is equivalent to the following relation:
d[ClO]
dt+
d[HOCl]
dt= 0 (1)
We consider the Eq. (1) a necessary condition to prove thepurity of Reaction (R1) in the atmosphere.
The Reaction (R1) is a second-order reaction of ClO andHO2. Its reaction rate is represented with the help of the num-ber densities of relevant species as:
d[HOCl]
dt= k1[ClO][HO2] (2)
Eq. (1) is equivalent to:
d[ClO]
dt= −
d[HOCl]
dt(3)
Equation (3) can be rewritten as follows using Eq. (2):
d[ClO]
dt= −k1[ClO][HO2] (4)
The calculation ofk1 in Sects. 4.2 and 4.3 will be based onEqs. (2) and (4), respectively. In order to distinguish the re-sults, the rate constants determined on the basis of Eqs. (2)and (4) will be denoted byck1 andck′
1, respectively. Here thesuperscriptc means “calculated”. To fulfill the condition ofEq. (1), ck1 andck′
1 must be identical. If other reactions af-fect either the increase of HOCl or the decrease of ClO, therecan be some difference betweenck1 andck′
1.
4.2 Calculation ofck1 based on increase of HOCl
To calculateck1 based on the increase of HOCl, we start fromEq. (2). After substitutingk1 by ck1, the integration equationof Eq. (2) yields
[HOCl](t)=[HOCl](t0)+ck1·
t∫t0
[ClO](τ )·[HO2](τ )dτ. (5)
Using the trapezoidal rule, we obtain the following ap-proximate solution of the integration Eq. (5):
[HOCl]calc0 = [HOCl](t0) (6)
[HOCl]calcm+1 = [HOCl]calc
m
+
ck1
2
([ClO]
obsm [HO2]
obsm
+[ClO]obsm+1[HO2]
obsm+1
)×(tobs
m+1 − tobsm ). (7)
In these equations,[ClO]obsm and [HO2]
obsm are themth ob-
served number densities of ClO and HO2. tobsm is the mth
elapsed time from the calculation start time. The intervalsof tobs
m+1 − tobsm are about 7 s.[HOCl](t0) is the initial value
of HOCl at the calculation start time. The calculation is per-formed for various modified local time intervals from differ-ent start time to end time. The observation values of ClO andHO2 were extracted for each time interval for the calculationof Eq. (7).
The rate constant of interested,ck1, and also[HOCl](t0)are considered as variable parameters. The reason for not fix-ing [HOCl](t0) is that there is a variability of the SMILES ob-servation data of HOCl at the calculation start time for eachtime interval.ck1 and[HOCl](t0) are determined by the mini-mization of the following functionχ2 using the least-squaresmethod:
χ2=
1
N
N∑m=1
(([HOCl]calc
m − [HOCl]obsm
)2(σHOCl
m
)2)
. (8)
Atmos. Chem. Phys., 14, 255–266, 2014 www.atmos-chem-phys.net/14/255/2014/

K. Kuribayashi et al.: SMILES HOCl 259
K. Kuribayashi et al.: SMILES HOCl 5
15 20 1 6 11−0.5
0.0
0.5
1.0
1.5
[ClO]
15 20 1 6 11−2
0
2
4
6
8
[HO2]
15 20 1 6 11
−0.5
0.0
0.5
1.0
Num
ber
densi
ty [106
mole
cule
cm−3
]
[HOCl]
15 20 1 6 11−0.5
0.0
0.5
1.0
1.5
2.0[ClO] + [HOCl]
15 20 1 6 11Modified Local Time [ h ]
050
100150200250300350
Data
num
ber Feb.
Mar.
Apr.
Fig. 2. Diurnal variation of the number density ofClO, HO2, HOCl, and the sum of [ClO] and [HOCl] at 0.28 hPa obtained by SMILES.Data from 20–40◦S between February and April 2010 are used in this study. Small dots represent the results from each single measurementof SMILES. Large dots show the smoothed temporal evolution with an average over 3.75 min.The modified local time dependenceof thenumber of data is shown in the bottom panel. The number of data is integrated over every 0.5 h for February (red), March (green), and April(blue) separately.
Fig. 2. Diurnal variation of the number density of ClO, HO2, HOCl, and the sum of [ClO] and [HOCl] at 0.28 hPa obtained by SMILES.Data from 20–40◦ S from February to April 2010 are used in this study. Small dots represent the results from each single measurementof SMILES. Large dots show the smoothed temporal evolution with an average over 3.75 min. The modified local time dependence of thenumber of data is shown in the bottom panel. The number of data is integrated over every 0.5 h for February (red), March (green), and April(blue) separately.
The observation values of HOCl and the observation errorof HOCl were extracted in the same time interval as in thecalculation of Eq. (7). [HOCl]obs
m is themth observed numberdensity andσHOCl
m is themth observation error of HOCl.N isthe number of data for each time interval. To reduce the effectof random errors from SMILES measurements, we ignoredtime intervals with a data volume less than 3000 (half of thetotal data number at night). We also obtained the calculatederror (fitting error) ofck1 from the optimization ofck1 and[HOCl](t0).
4.3 Calculation ofck′1 based on decrease of ClO
To calculateck′
1 based on the decrease of HOCl, we startfrom Eq. (4). After substitutingk1 by ck′
1, the integrationequation of Eq. (4) yields
[ClO](t) = [ClO](t0) −c k′
1 ·
t∫t0
[ClO](τ ) · [HO2](τ )dτ. (9)
www.atmos-chem-phys.net/14/255/2014/ Atmos. Chem. Phys., 14, 255–266, 2014

260 K. Kuribayashi et al.: SMILES HOCl
Using the trapezoidal rule, we obtain the following ap-proximate solution for the integration Eq. (9):
[ClO]calc0 = [ClO](t0) (10)
[ClO]calcm+1 = [ClO]
calcm
−
ck′
1
2
([ClO]
obsm [HO2]
obsm
+[ClO]obsm+1[HO2]
obsm+1
)×(tobs
m+1 − tobsm ). (11)
In these equations, the rate constant of interest,ck′
1, andalso[ClO](t0) are considered as variable parameters.ck′
1 and[ClO](t0) are determined by the minimization of the follow-ing function,χ2, using the least-squares method:
χ2=
1
N
N∑m=1
(([ClO]
calcm − [ClO]
obsm
)2(σClO
m
)2)
(12)
Similarly, calculated errors ofck′
1 were obtained in parallelwith the optimization ofck′
1 and [ClO](t0).
4.4 Results
Figure 3 shows the calculatedck1 and ck′
1 values in eachmodified local time interval.
In addition, the difference betweenck1 and ck′
1 is pre-sented. We denote this difference by
1k = |ck1 −
c k′
1|. (13)
The horizontal and vertical axes are the start and end timesof the considered time intervals, respectively. The blank arearepresents the time intervals where the data numbers are lessthan the threshold of 3000 or1k values are greater than5.0×10−12 cm3 molecule−1 s−1.
5 Discussion
5.1 Evaluation of the purity of Reaction (R1) by 1k
As already described in Sect. 4.1,1k is an indicator of thepurity of the Reaction (R1). 1k = 0 is necessary for the rela-tion expressed in Eq. (1) to be fulfilled.
Our results in Fig.3 show the following typical distribu-tions of1k in the nighttime:
1. Range1k ∼ 0 ×10−12 cm3 molecule−1 s−1: for thestart time of 18:30–19:30 MLT and the end time of01:45–04:00 MLT.
2. Range1k ∼ 1.0 ×10⁻¹² cm3 molecule−1 s−1: for thestart time of 18:30–19:30 MLT the end time of 00:45–01:45 MLT or 04:00–06:00 MLT.
3. Range1k > 3.0 ×10⁻¹² cm3 molecule−1 s−1: for thestart time later than 20:00 MLT and the end timearound 03:00 MLT.
6 K. Kuribayashi et al.: SMILES HOCl
than 3000 (half of the total data number at night).We alsoobtained the calculated error (fitting error) ofck1 from otheoptimization ofck1 and [HOCl](t0).
4.3 Calculation ofck′1 based on decrease inClO
To calculateck′1 based on the decrease inHOCl, we start5
from Eq. (4).After substitutingk1 by ck′1, the integrationequation of Eq. (4) yields:
[ClO](t)=[ClO](t0)−ck′1 ·t∫
t0
[ClO](τ) · [HO2](τ)dτ (9)
Using the trapezoidal rule, we obtain the following ap-10
proximate solution of the integration Eq. (9):
[ClO]calc0 = [ClO](t0) (10)
[ClO]calcm+1 = [ClO]calcm
−ck′12
([ClO]obsm [HO2]
obsm
+[ClO]obsm+1[HO2]obsm+1
)15
×(tobsm+1 − tobsm )
(11)
The rate constant of interested,ck′1, and also[ClO](t0) areconsidered as variable parameters.ck′1 and[ClO](t0) are de-terminedby the minimization of the following functionχ2
20
using the least-squares method:
χ2 =1
N
N∑m=1
([ClO]
calcm −[ClO]
obsm
)2
(σClOm )
2
(12)
Similarly, calculated errors ofck′1 were obtained in parallelwith the optimization ofck′1 and [ClO](t0).
4.4 Results25
Figure 3 shows the calculatedck1 and ck′1 values in eachmodified local time interval.In addition, the difference be-tweenck1 and ck′1 is presented. We denote this differenceby:
∆k = |ck1 −c k′1| (13)30
The horizontal and vertical axes are the start and end timeof the considered time intervals, respectively. The blank arearepresents the time intervals where the data numbers are lessthan the threshold of 3,000 or∆k values are greater than5.0 ×10−12 cm3 molecule−1 s−1.35
18 19 20 21 22 23 0 1Start time [ h ]
23
0
1
2
3
4
5
6
7
8
End tim
e [ h ]
0
3
6
9
12
15
18
21
24
27
Rate constant [ 10−
12 cm
3 m
olecu
le−1 s−1 ]
18 19 20 21 22 23 0 1Start time [ h ]
23
0
1
2
3
4
5
6
7
8
End tim
e [ h ]
0
3
6
9
12
15
18
21
24
27
Rate constant [ 10−
12 cm
3 m
olecu
le−1 s−1 ]
18 19 20 21 22 23 0 1Start time [ h ]
23
0
1
2
3
4
5
6
7
8
End tim
e [ h ]
0.0
0.5
1.0
1.5
2.0
2.5
3.0
3.5
4.0
4.5
Difference
[ 10−
12 cm
3 m
olecu
le−1 s−1 ]
Fig. 3. Contour plots ofck1 (top), ck′1 (middle), and∆k (bottom)
calculated from SMILES observation dataset.ck1 andck′1 are cal-
culated in time periods from each start time (horizontal axis) to eachend time (vertical axis).
Fig. 3. Contour plots ofck1 (top), ck′1 (middle), and1k (bottom)
calculated from the SMILES observation data set.ck1 andck′1 are
calculated in time periods from each start time (horizontal axis) toeach end time (vertical axis).
Atmos. Chem. Phys., 14, 255–266, 2014 www.atmos-chem-phys.net/14/255/2014/

K. Kuribayashi et al.: SMILES HOCl 261
4. Another range1k > 3.0×10⁻¹² cm3 molecule−1 s−1:for the start time later than 20:00 MLT and the end timelater than 04:00 MLT.
Result 3 may be caused by two problems. One is the vari-ability observed in the ClO data around 02:40 MLT. In Fig.2,the ClO data around this modified local time show a rel-atively smaller number density compared to neighbouringmodified local times (0.5×10⁶ molecule cm−3 at 02:40 MLTwhile it is around 0.7×10⁶ molecule cm−3 at neighbouringmodified local times). Another one is the inhomogeneouslocal time sampling of SMILES in the extracted February–April data set. As shown in Fig.2, the data for 21:00–00:00 MLT was quite evenly distributed throughout Febru-ary, March, and April 2010, while that for 02:00–03:00 MLTmostly is from March 2010. Such a problem in result 2 be-tween 00:45–01:45 MLT is also considered to be due to theinhomogeneous sampling.
The effect of photochemistry in the morning time causesrelatively large1k in the result 4 and the result 2. Duringsunrise ClO and HOCl start to decrease, and HO2 starts toincrease. This time range should be excluded from our anal-ysis in order to ensure the purity of the Reaction (R1).
A good possibility exists that the modified local time inter-val of 18:30–04:00 MLT was the time in which the reactionClO + HO2 →HOCl + O2 predominantly occurred in the Clychemistry. The sum of [ClO] and [HOCl] was near constantafter 18:30 MLT in Fig.2. However, as shown in Sect.2, themodel calculation suggested that the ClO production by HCl+ OH →Cl + H2O and Cl + O3 →ClO + O2 affected thesum of HOCl and ClO until 20:00 LT. The sum of HOCl andClO in Fig.1 increased by about 11 % after 18:30 LT. Thus,a noticeable difference occurred between the numerical anal-ysis result using the SMILES observation data and the modelcalculation result. We considered this difference as causedby the following reason: although we used the modified lo-cal time to reduce effects of variabilities from latitude andseason, some variabilities (e.g. water vapour) are still left.The ClO production by HCl + OH→Cl + H2O and Cl +O3 →ClO + O2 might still remain between 18:30 and 19:30MLT, but did not appear in the SMILES observations.
As a conclusion, we derived from the SMILES data setthat the modified local time interval of 18:30–04:00 MLT isthe time in which the reaction ClO + HO2 →HOCl + O2purely happens in the Cly chemistry in the lower mesosphere.The condition of the SMILES data set used here is the pres-sure level of 0.28 hPa in the mid-latitude region (20–40◦ S)in February–April 2010, having a temperature of 245 K.
5.2 Estimation of the rate constant of Reaction (R1)
In the modified local time interval of 18:30–04:00MLT, the derived ck1 and ck′
1 range between 1.1 and11.3×10−12 cm3 molecule−1 s−1. This variability includesthe irrelevant results as discussed in Sect. 5.1. To reduce
K. Kuribayashi et al.: SMILES HOCl 7
5 Discussion
5.1 Evaluation of the purity of Reaction (R1) by∆k
As already described in Sect. 4.1,∆k is an indicator of thepurity of the Reaction (R1).∆k = 0 is necessary for the re-lation (1) to be fulfilled.5
Our results in Fig. 3 show the following typical distribu-tions of∆k in the nighttime:
1. Range∆k ∼ 0 ×10−12 cm3 molecule−1 s−1: for thestart time ofMLT 18:30–19:30 and the end time ofMLT 1:45–4:0010
2. Range∆k ∼1.0 ×10⁻¹² cm3 molecule−1 s−1: forthe start time ofMLT 18:30–19:30 the end time ofMLT 00:45–1:45 orMLT 4:00–06:00.
3. Range∆k > 3.0×10⁻¹² cm3 molecule−1 s−1: for thestart time later thanMLT 20:00 and the end time around15
MLT 03:00
4. Another range∆k > 3.0×10⁻¹² cm3 molecule−1 s−1:for the start time later thanMLT 20:00 and the end timelater thanMLT 04:00.
Result 3 may be caused by two problems. One is the vari-20
ability observed in theClO data aroundMLT 02:40. In Fig. 2,the ClO data around thismodified local time show a rel-atively smaller number density compared to neighbouringmodifiedlocal times (0.5×10⁶ molecule cm−3 atMLT 02:40while it is around 0.7×10⁶ molecule cm−3 at neighbour-25
ing modifiedlocal times). Another one is the inhomogeneouslocal time sampling of SMILES in the extracted February–April dataset. As shown in Fig. 2, the data forMLT 21:00–00:00 was mixed well homogeneously between February,March, and April, 2010 while that ofMLT 02:00–03:0030
mostly is from March 2010. Such a problem in result 2 be-tweenMLT 00:45–01:45 is also considered to be due to theinhomogeneous sampling.
The effect of photochemistry in the morning time causesrelatively large∆k of the result 4 and the result 2. During35
sunriseClO andHOCl start to decrease, andHO2 starts toincrease. This time range should be excluded from our anal-ysis in order to ensure the purity of the Reaction (R1).
A good possibility exists that the modified local time inter-val of MLT 18:30–04:00 was the time in which the reaction40
ClO + HO2 →HOCl + O2 predominantly occurred in theCly chemistry. The sum of [ClO] and [HOCl] was close tothe constant after MLT18:30 in Fig.2. However, as shown inSect. 2, the model calculation suggested that theClO pro-duction byHCl + OH →Cl + H2O andCl + O3 →ClO +45
O2 affected the sum ofHOCl andClO until LT 20:00. Thesum ofHOCl andClO in Fig. 1 increased by about 11 % af-ter LT18:30. Thus, a noticeable difference occurred betweenthe numerical analysis result using the SMILES observation
18.6 18.8 19.0 19.2 19.4Start time [ h ]
3.0
3.2
3.4
3.6
3.8
4.0
End tim
e [ h ]
0.0
0.5
1.0
1.5
2.0
2.5
3.0
3.5
4.0
4.5
Difference
[ 10−
12 cm
3 m
olecu
le−1 s−1 ]
Fig. 4. The contour plot of∆k calculated from the SMILES obser-vation data set between MLT 18:30–19:30 and MLT 03:00–04:30.
data and the model calculation result. We considered this dif-50
ference was caused by the following reason: Although weused the modified local time to reduce effects of variabilitiesfrom latitude and season, still some variabilities (e.g. watervapour) are left. TheClO production byHCl + OH →Cl +H2O andCl + O3 →ClO + O2 might still remain between55
MLT18:30 and MLT19:30, but did not appear in the SMILESobservation.
As a conclusion, we derived from the SMILES dataset thatthe modifiedlocal time interval ofMLT 18:30–04:00 is thetime in which the reactionClO + HO2 →HOCl + O2 purely60
happens in the Cly chemistry in the lower mesosphere. Thecondition of the SMILES dataset used here is the pressurelevel of 0.28 hPa in the mid-latitude region (20–40◦S) inFebruary–April 2010, having a temperature of 245 K.
5.2 Estimation of the rate constant of Reaction (R1)65
In the modified local time interval of MLT 18:30–04:00, thederivedck1 andck′1 range between 1.1 and 11.3×10⁻¹² cm3
molecule−1 s−1. This variability includes the irrelevant re-sults as discussed in Sect. 5.1. To reduce the effect of thisvariability on the estimation ofk1, for the following calcula-70
tion we use the time range between start time of MLT 18:30–19:30 and end time of MLT 03:00–04:00 where the∆k ac-cording to Eq. (13) value is closest to zero in Fig. 3. Figure 4is a magnified figure of the∆k shown in Fig. 3 in this timerange.∆k is close to zero for start times near MLT 18:30.75
To estimatek1 under the condition that∆k approacheszero, we calculated average values ofck1 andck′1 under thecondition of∆k ≤ x, wherex is a variable threshold rang-ing from 0.01 to 2.5×10⁻¹² cm3 molecule−1 s−1 in incre-ments of 0.01×10⁻¹² cm3 molecule−1 s−1. The average80
value of ck1 and ck′1 under the condition of∆k ≤ x is de-
Fig. 4. The contour plot of1k calculated from the SMILES obser-vation data set between 18:30–19:30 and 03:00–04:30 MLT.
the effect of this variability on the estimation ofk1, for thefollowing calculation we use the time range between starttime of 18:30–19:30 MLT and end time of 03:00–04:00 MLTwhere the1k according to Eq. (13) value is closest to zeroin Fig. 3. Figure4 is a magnified figure of the1k shown inFig. 3 in this time range.1k is close to zero for start timesnear 18:30 MLT.
To estimatek1 under the condition that1k approacheszero, we calculated average values ofck1 andck′
1 under thecondition of1k ≤ x, wherex is a variable threshold rangingfrom 0.01 to 2.5×10⁻¹² cm3 molecule−1 s−1 in incrementsof 0.01×10⁻¹² cm3 molecule−1 s−1. The average values ofck1 and ck′
1 under the condition of1k ≤ x are denoted asck̄1(x) andck̄′
1(x), respectively. The calculation of the stan-dard deviation,σck̄1(x) andσck̄′
1(x), of ck̄1(x) andck̄′
1(x) wasperformed simultaneously.
Figure5 shows the dependence ofck̄1(x), ck̄′
1(x), σck̄1(x),
andσck̄′
1(x) on x. The values of ¯ck1(x) and ¯ck′
1(x) and thevalues ofσc k̄1(x) andσc k̄′
1(x) converge in a case in whichxapproaches zero. We estimated the following limits:
k̄1(0) = limx→0
ck̄1(x), (14)
k̄′
1(0) = limx→0
ck̄′
1(x), (15)
σk̄1(0) = limx→0
σck̄1(x), (16)
σk̄′
1(0)= lim
x→0σck̄′
1(x). (17)
In this estimation, we linearly extrapolated the results shownin Fig. 5 to x = 0× 10−12 cm3 molecule−1 s−1. The depen-dence ofk̄1(0) andσk̄1(0) on how to take the value of incre-
ments ofx or to extrapolate is much smaller than 1 % ofk̄1(0)
andσk̄1(0), respectively. The differences between the resultsof Eqs. (14) and (15) and between the results of Eqs. (16)
www.atmos-chem-phys.net/14/255/2014/ Atmos. Chem. Phys., 14, 255–266, 2014

262 K. Kuribayashi et al.: SMILES HOCl
and (17) are much smaller than 1 % of these limits. We usedk̄1(0) andσk̄1(0) as thek1 and 1σ provided by the SMILESobservations, respectively:
k1(245K)=(7.75±0.25)×10−12cm3molecule−1s−1. (18)
Moreover, a comparison between the derived 1σ of k1 andthe uncertainties ofck1 andck′
1 calculated in Sects. 4.2 and4.3 was performed. As described in Sect.4, the uncertainties(calculated errors) ofck1 andck′
1 were calculated simultane-ously with ck1 andck′
1, respectively. These uncertainties aredenoted asσck1 andσck′
1hereafter. The average values ofσck1
andσck1 in the time range between start time of 18:30–19:30MLT and end time of 03:00–04:00 MLT are
σck1 = 1.15± 0.09(1σ) × 10−12cm3/molecule−1 s−1, (19)
σck′
1= 0.26± 0.03(1σ) × 10−12cm3/molecule−1 s−1. (20)
σck1 is larger thanσck′
1because SMILES has less sensitiv-
ity to HOCl compared to ClO. If bothσck1 andσck′
1are the
standard deviations of a Gaussian distribution andck1 andck′
1 are assumed to be statistically independent, then the jointdistribution ofck1 andck′
1 is the product of two Gaussian dis-tributions. A short calculation shows that the selection ofck1andck′
1 according to the condition1k ≤ x for x → 0 yieldsa Gaussian distribution with the following standard deviationσG:
1
σ 2G
=1
σ 2ck1
+1
σ 2ck′
1
. (21)
σG was calculated to be 0.25× 10⁻¹² cm3 molecule−1 s−1,and is consistent with 1σ of k1 given in Eq. (18). This con-firms that a reasonable estimate for the precision of the de-rived reaction rate constant was obtained.
The derived 1σ error ofk1 is attributable to the 1σ preci-sions of [ClO], [HOCl], and [HO2] which are caused by therandom errors in the single-scan spectrum of SMILES. Thereare systematic errors in [ClO], [HOCl], and [HO2] observedby SMILES. As described in Sect.3, the systematic errorsof ClO, HO2, and HOCl are another error source of the de-rived k1. The total impact on the rate constant of Reaction(R1) was estimated to be 4.3 % at maximum using 3 % for[ClO], [HO2], and [HOCl] as the systematic errors (cf. Ap-pendix A). Thus, the impact of systematic errors was slightlylarger than that of the 1σ precision (3.3 %) of the derivedk1in Eq. (18).
Figure6 shows the time dependence of [HOCl] and [ClO]both for observations and calculations using the derivedk1 inEq. (18). The lowest panel in Fig.6 is the sum of observations([HOCl] + [ClO]) and the sum of the optimized[HOCl](t0)and[ClO](t0). Both of them show good agreement with eachother.
5.3 Comparison ofk1 with previous studies
We estimatedk1 using the SMILES atmospheric remotesensing data, which have advantages owing to the high in-
Table 2.Comparison with previous studies.
Measurement method k1 (245 K)a 1σa P [Torr]
– Atmospheric measurementSMILES 7.75 0.25 0.21– Laboratory measurementStimpfle et al.(1979)b 10.55 None 0.8–3.4Nickolaisen et al.(2000) 10.15 2.49 50–700Knight et al.(2000) 6.65 0.63 1.1–1.7Hickson et al.(2007) 7.86 2.60 1.5JPL 2011c 8.49 2.87 None– Ab initio calculationXu et al.(2003)400 Torr 9.27 None 4001 Torr 7.85 None 1
a Units 10−12 cm3 molecule−1 s−1.b Kovalenko et al.(2007) supported.c von Clarmann et al.(2012) supported.
strumental sensitivity and the long line-of-sight of the limbmeasurement from space. We compared our derivedk1, here-after denoted “SMILESk1”, with previous laboratory experi-ments (Stimpfle et al., 1979; Knight et al., 2000; Nickolaisenet al., 2000; Hickson et al., 2007), an ab initio calculation (Xuet al., 2003), and JPL 2011 recommendation (Sander et al.,2011).
Figure7 shows the comparison ofk1 from our work andthat from previous works. To see the detail number at 245 K,which we analyse in the presented study, we summarized thek1 values with 1σ errors in Table2. The value of the SMILESk1 is consistent with the one fromHickson et al.(2007) andthe ab initio value at 1 Torr fromXu et al. (2003) withinthe margin of error. The measurement ofNickolaisen et al.(2000) was performed under higher pressure (50–700 Torr),and the value ofk1 is larger than the other values whichwere performed under the condition of 0.21–1.7 Torr (exceptStimpfle et al., 1979). A pressure dependence of the Reaction(R1) was noticed byXu et al. (2003) due to the long life-time of the reaction intermediate HOOOCl. As mentioned inXu et al.(2003), the large value ofNickolaisen et al.(2000)might be caused by the pressure dependence.
The 1σ error of k1 from the SMILES observation data is2–10 times smaller than those of previous laboratory exper-iments at 245 K. In the laboratory experiments, the radicalamount calibration is difficult because of the light source ofthe photolysis. The smaller 1σ error of the SMILESk1 canbe attributed to the fact that the SMILESk1 was derived fromthe data set in which only the Reaction (R1) happened andother competitive radical reactions did not appear in the ob-servation.
Atmos. Chem. Phys., 14, 255–266, 2014 www.atmos-chem-phys.net/14/255/2014/

K. Kuribayashi et al.: SMILES HOCl 263
8 K. Kuribayashi et al.: SMILES HOCl
0.0 0.5 1.0 1.5 2.0 2.5
7.5
7.6
7.7
7.8
7.9
8.0
8.1
Avarage value
[ 10−
12 cm
3 m
olecu
le −
1 s−1 ]
c k̄1(x)c k̄′1(x)
0.0 0.5 1.0 1.5 2.0 2.5x [ 10−12 cm3 molecule −1 s−1 ]
0.25
0.30
0.35
0.40
0.45
0.50
0.55
Standard deviation
[ 10−1
2 cm
3 m
olecu
le −
1 s−1 ]
σc k̄1(x)
σc k̄′1(x)
Fig. 5.The plot of the dependence ofck̄1(x)(blue) andck̄′1(x)(red)
onx in the time range between start time of MLT 18:30–19:30 andend time of MLT 03:00–04:00(top). The plot of the dependence ofσk̄1(0)
(blue) andσk̄′1(0)
(red) onx in the same time range(bottom).
noted asck̄1(x) andck̄′1(x), respectively. The calculation ofthe standard deviation,σck̄1(x) andσck̄′
1(x), of ck̄1(x) and
ck̄′1(x) was performed simultaneously.Figure 5 shows the dependence ofck̄1(x), ck̄′1(x), σck̄1(x),
andσck̄′1(x)
on x. The values of ¯ck1(x) and ¯ck′1(x) and the5
values ofσck̄1(x) andσck̄′1(x)
converge in the case thatx ap-proaches zero. We estimated the following limits:
k̄1(0) = limx→0
ck̄1(x) (14)
k̄′1(0) = limx→0
ck̄′1(x) (15)
σk̄1(0) = limx→0
σck̄1(x) (16)10
σk̄′1(0)
= limx→0
σck̄′1(x)
(17)
In this estimation, we linearly extrapolated the results shownin Fig. 5 to x= 0 ×10−12 cm3 molecule−1 s−1. The de-pendence of̄k1(0) andσk̄1(0) on how to take the value ofincrements ofx or to extrapolate is much smaller than 1%15
of k̄1(0) andσk̄1(0), respectively. The differences betweenthe results of Eqs. (14) and (15) and between the results ofEqs. (16) and (17) are much smaller than 1% of these limits.We used̄k1(0) andσk̄1(0) as thek1 and1σ provided by theSMILES observations, respectively:20
k1(245K) = (7.75± 0.25)× 10−12 cm3molecule−1 s−1
(18)
Moreover, a comparison between the derived1σ of k1 andthe uncertainties ofck1 andck′1 calculated in Sects. 4.2 and25
4.3 was performed. As described in Sect. 4, the uncertainty(calculated error) ofck1 and ck′1 was calculated simulta-neously withck1 and ck′1, respectively. These uncertaintiesare denoted asσck1 andσck′
1hereafter. The average values
of σck1 and σck1 in the time range between start time of30
MLT 18:30–19:30 and end time of MLT 03:00–04:00 are:
σck1 = 1.15± 0.09(1σ) × 10−12cm3/molecule−1 s−1 (19)
σck′1= 0.26± 0.03(1σ) × 10−12cm3/molecule−1 s−1 (20)
σck1 is larger thanσck′1
because SMILES has less sensitivityto HOCl compared toClO. If both of σck1 andσck′
1are the35
standard deviation of a Gaussian distribution andck1 andck′1are assumed to be statistically independent, then their jointdistribution is the product of two Gaussian distributions. Ashort calculation shows that the selection ofck1 andck′1 ac-cording to the condition∆k ≤ x for x→ 0 yields a Gaussian40
distribution with the following standard deviationσG:
1
σ2G
=1
σ2ck1
+1
σ2ck′
1
(21)
σG was calculated to be0.25 ×10−12 cm3 molecule−1 s−1
and is consistent with1σ of k1 given in Eq. (18). This con-firms that a reasonable estimate for the precision of the de-45
rived reaction rate constant was obtained.The derived1σ error ofk1 is attributable to the1σ preci-
sions of [ClO], [HOCl], and [HO2] which are caused by therandom errors in the single scan spectrum of SMILES. Thereare systematic errors in [ClO], [HOCl], and [HO2] observed50
by SMILES. As described in Sect.3, the systematic errors ofClO,HO2, andHOCl are another error source of the derivedk1. The total impact on the rate constant of Reaction (R1) wasestimated to be 4.3% by the maximum using 3% for [ClO],[HO2], and [HOCl] as the systematic errors (cf. Appendix).55
Thus, the impact of systematic errors was slightly larger thanthat of the1σ precision, 3.3% of the derivedk1 in Eq.(18).
Figure 6 shows the time dependence of [HOCl] and [ClO]both for observations and calculations using the derivedk1 inEq. (18). The lowest panel in Fig. 6 is the sum of observations60
([HOCl] + [ClO]) andthe sum of the optimized[HOCl](t0)and[ClO](t0). Both of them show good agreement with eachother.
5.3 Comparison ofk1 with previous studies
We estimatedk1 using the SMILES atmospheric remote65
sensing data which have advantages owing to the high instru-mental sensitivity and a long line-of-sight of the limb mea-surement from space. We compared our derivedk1, hereafterdenoted ’SMILESk1’, with previous laboratory experiments(Stimpfle et al., 1979; Knight et al., 2000; Nickolaisen et al.,70
2000; Hickson et al., 2007), an ab initio calculation (Xu et al.,2003), and JPL 2011 recommendation (Sander et al., 2011).
Figure 7 shows the comparison ofk1 from our and pre-vious works. To see the detail number at 245 K, which we
Fig. 5. The plot of the dependence ofck̄1(x) (blue) andck̄′1(x) (red) onx in the time range between start time of 18:30–19:30 MLT and end
time of 03:00–04:00 MLT (top). The plot of the dependence ofσk̄1(0) (blue) andσk̄′
1(0) (red) onx in the same time range (bottom).K. Kuribayashi et al.: SMILES HOCl 9
18 20 22 24 26 28 300.00.20.40.60.81.0 [ClO]
18 20 22 24 26 28 30−0.4−0.2
0.00.20.40.60.8
Num
ber
densi
ty [
106
mole
cule
cm−3
]
[HOCl]
18 20 22 24 26 28 30Modified Local Time [ h ]
0.00.20.40.60.81.01.21.41.6
[ClO]+[HOCl]
Fig. 6.Diurnal variation plot ofClO with average values (red) and calculation values using the rate constant of this work (black) in 0.28 hParegion (top). Diurnal variation plot ofHOCl with average values (black) and calculation values using the rate constant of this work (red) in0.28 hPa region (middle). Diurnal variation plot of the sum ofClO + HOCl with average values (green) and the sum of calculation values.
analyze in the presented study, we summarized thek1 valueswith 1σ errors in Tab. 2. The value of the SMILESk1 is con-sistent with the one from Hickson et al. (2007) and the ab ini-tio value at 1 Torr from Xu et al. (2003) within the margin oferror.The measurement of Nickolaisen et al. (2000) was per-5
formed under higher pressure (50–700 Torr), and the valueof k1 is larger than the other values which were performedunder the condition of 0.21–1.7 Torr (except Stimpfle et al.(1979)). A pressure dependence of the Reaction (R1) wasnoticed by Xu et al. (2003) due to the long lifetime of the10
reaction intermediateHOOOCl. As mentioned in Xu et al.(2003), the large value of Nickolaisen et al. (2000) might becaused by the pressure dependence.
The1σ error ofk1 from the SMILES observation data is2–10 times smaller than those of previous laboratory exper-15
iments at 245 K.In the laboratory experiments, the radicalamount calibration is difficult because of the light source ofthe photolysis.The smaller1σ error of the SMILESk1 can beattributed to the fact that the SMILESk1 was derived fromthe dataset in which only the Reaction (R1) happened and20
other competitive radical reactions did not appear in the ob-servation.
6 Conclusions
The model calculation of the chlorine partitioning suggeststhat the reactionClO + HO2 →HOCl + O2 is the only reac-25
tion affectingHOCl after about LT 18:30 in the lower meso-sphere. This provides an opportunity for determining the rate
Table 2.Comparison with previous studies.
Measurement method k1(245K)a 1σ a P [Torr]
-Atmospheric measurementSMILES 7.75 0.25 0.21-Laboratory measurementStimpfle et al. (1979)b 10.55 None 0.8–3.4Nickolaisen et al. (2000) 10.15 2.49 50–700Knight et al. (2000) 6.65 0.63 1.1–1.7Hickson et al. (2007) 7.86 2.60 1.5JPL 2011c 8.49 2.87 None-Ab initio calculationXu et al. (2003)400 Torr 9.27 None 4001 Torr 7.85 None 1
a Units10−12 cm3 molecule−1 s−1
b Kovalenko et al. (2007) supported.c von Clarmann et al. (2012) supported
constantk1 of this reaction from diurnal variations ofClO,HO2, andHOCl.
The SMILES NICT Level-2 product version 2.1.5 in the30
mid-latitude between 20◦S and 40◦S at a temperature rangeof 245±1.4(1σ)K, in the period from February to April 2010was used for our study. We evaluated the purity of the Reac-tion (R1) at the 0.28 hPa pressure level (58 km) by checkingthe consistency between two reaction rates estimated from35
HOCl production andClO loss using SMILES observationdata. We derived from the SMILES dataset that themodified
Fig. 6.Diurnal variation plot of ClO with average values (red) and calculation values using the rate constant of this work (black) in 0.28 hParegion (top). Diurnal variation plot of HOCl with average values (black) and calculation values using the rate constant of this work (red) in0.28 hPa region (middle). Diurnal variation plot of the sum of ClO + HOCl with average values (green) and the sum of calculation values.
www.atmos-chem-phys.net/14/255/2014/ Atmos. Chem. Phys., 14, 255–266, 2014

264 K. Kuribayashi et al.: SMILES HOCl10 K. Kuribayashi et al.: SMILES HOCl
200 220 240 260 280 300Temperature [ K ]
4
6
8
10
12
14
16
18
20
22
Rate
const
ant
[ 10−
12 c
m3 m
ole
cule−1
s−1
]
Stimpfle et al., 1979
Nickolaisen et al., 2000
Knight et al., 2000
Hickson et al., 2007
JPL2011
Xu et al., 2003 (1 Torr)
Xu et al., 2003 (400 Torr)SMILES k1
Fig. 7.Comparison with previous work. The dots and lines represented the experimental values from Stimpfle et al. (1979) (yellow), Knightet al. (2000) (red), Nickolaisen et al. (2000) (cyan), and Hickson et al. (2007) (blue). Further lines show the calculation values from JPL2011 recommendation (Sander et al., 2011) (green) and the ab initio calculation (Xu et al., 2003) (purple (1 Torr) and orange (400 Torr)).The black dot is the value of the SMILESk1. Solid and dashed lines arek1 values at higher pressure (50–700 Torr) and lower pressure (≤5.0 Torr), respectively.
local time interval ofMLT 18:30–04:00 is the time in whichthe reactionClO + HO2 →HOCl + O2 purely happens inthe Cly chemistry in the lower mesosphere. The SMILESk1was directly estimated using the remote sensing data withthe long line-of-sight under the condition that the reaction5
ClO +HO2 →HOCl +O2 purely happened in the Cly chem-istry. This condition could not have been achieved in the pre-vious laboratory experiments and the previous stratosphericHOCl measurements. Based on these facts, we consider thatthe SMILESk1 has an advantage over the results of previous10
studies, while it is valid only for one temperature (245 K) andone pressure (0.28 hPa).
The rate constant of the reactionClO + HO2 →HOCl+ O2 is obtained to bek1 = (7.75± 0.25) ×10−12 cm3
molecule−1 s−1 at 245 K. This is a 2–10 times better preci-15
sion than that from laboratory measurements.The SMILESk1 is consistent with that from the laboratory experiment ofHickson et al. (2007) and the ab initio calculations of Xuet al. (2003) for similar low-pressure conditions.
Appendix A20
Estimation of the impact of systematic errors
In this appendix, we describe the estimation of the impact ofthe systematic observation errors on the calculation ofk1.
We considered two cases for the way of implementing thesystematic errors: treating it as a constant offset term or as a25
term positively/negatively proportional to the amount of con-sidered molecules. These two effects are expressed as fol-lows:
[X]bias = [X]obs × (1± 0.03×B)
± ¯[X]× 0.03× (1−B), (A1)30
whereX is ClO,HO2, orHOCl
In this equation,[X]bias is the number density including theadditional systematic errors of 3%,[X]obs is the number den-sity obtained from SMILES observations,B is the contribu-tion ratio of the proportional term and the offset term, and35
¯[X] is the average value of[X]obs in the modified local timerange between MLT18:30 – MLT04:00.
We estimated the total impact of the systematic errors onk1 in the two cases ofB = 1 (only the slope term) andB = 0(only the base line term) by the following method: We cal-40
culated two rate constants,ckbias1 andck′bias1 , including the
systematic errors given in Eq. (A1) using the same method asin the calculations ofck1 andck′1 in Eqs. (6)–(8) and (10)–(12) with respect to each molecule. The rate constant,kbias1 ,including the systematic errors given in Eq. (A1) was esti-45
mated fromckbias1 andck′bias1 using the same method as for
the estimation of thek1 in Eq. (18). The impact of includ-ing the systematic errors given in Eq. (A1) was calculatedfrom the difference betweenkbias1 and thek1 in Eq. (18) with
Fig. 7. Comparison with previous works. The dots and lines rep-resented the experimental values fromStimpfle et al.(1979) (yel-low), Knight et al. (2000) (red), Nickolaisen et al.(2000) (cyan),andHickson et al.(2007) (blue). Further lines show the calculationvalues recommended by JPL 2011 (Sander et al., 2011) (green) andthe ab initio calculation (Xu et al., 2003) (purple (1 Torr) and orange(400 Torr)). The black dot is the value of the SMILESk1. Solid anddashed lines arek1 values at higher pressures (50–700 Torr) andlower pressures (≤ 5.0 Torr), respectively.
6 Conclusions
The model calculation of the chlorine partitioning suggeststhat the reaction ClO + HO2 →HOCl + O2 is the only reac-tion affecting HOCl after about 18:30 LT in the lower meso-sphere. This provides an opportunity for determining the rateconstantk1 of this reaction from diurnal variations of ClO,HO2, and HOCl.
The SMILES NICT Level-2 product version 2.1.5 in themid-latitude between 20◦ S and 40◦ S at a temperature rangeof 245±1.4(1σ) K, in the period from February to April 2010was used for our study. We evaluated the purity of the Reac-tion (R1) at the 0.28 hPa pressure level (58 km) by checkingthe consistency between two reaction rates estimated fromHOCl production and ClO loss using SMILES observationdata. From the SMILES data set, we derived that the mod-ified local time interval of 18:30–04:00 MLT is the time inwhich the reaction ClO + HO2 →HOCl + O2 purely happensin the Cly chemistry in the lower mesosphere. The SMILESk1 was directly estimated using the remote sensing data witha long line-of-sight under the condition that the reaction ClO+ HO2 →HOCl + O2 purely happened in the Cly chemistry.This condition could not have been achieved in the previ-ous laboratory experiments and the previous stratosphericHOCl measurements. Based on these facts, we consider theSMILES k1 to have an advantage over the results of previ-ous studies, even though it is valid only for one temperature(245 K) and one pressure (0.28 hPa).
The rate constant of the reaction ClO + HO2→HOCl + O2 is found to be k1 = (7.75± 0.25)
×10−12 cm3 molecule−1 s−1 at 245 K. This is a 2–10times better precision than that from laboratory mea-surements. The SMILESk1 is consistent with that fromthe laboratory experiment ofHickson et al. (2007) andthe ab initio calculations ofXu et al. (2003) for similarlow-pressure conditions.
Appendix A
Estimation of the impact of systematic errors
In this Appendix, we describe the estimation of the impact ofthe systematic observation errors on the calculation ofk1.
We considered two different ways of implementing thesystematic error: treating it as a constant offset term, ortreating it as a term positively/negatively proportional to theamount of considered molecules. These two effects are ex-pressed as follows:
[X]bias
= [X]obs
× (1± 0.03× B)
± ¯[X] × 0.03× (1− B), (A1)
where X is ClO, HO2, orHOCl.
In this equation,[X]bias is the number density including the
additional systematic errors of 3 %,[X]obs is the number den-
sity obtained from SMILES observations,B is the contribu-tion ratio of the proportional term and the offset term, and¯[X] is the average value of[X]
obs in the time range between18:30–04:00 MLT.
We estimated the total impact of the systematic errors onk1 in the two cases ofB = 1 (only the slope term) andB = 0(only the base line term) by the following method: we calcu-lated two rate constants,ckbias
1 andck′bias1 , including the sys-
tematic errors given in Eq. (A1) using the same method asfor the calculations ofck1 andck′
1 in Eqs. (6)–(8) and (10)–(12) with respect to each molecule. The rate constant,kbias
1 ,including the systematic errors given in Eq. (A1) was esti-mated fromckbias
1 andck′bias1 using the same method as for
the estimation of thek1 in Eq. (18). The impact of includ-ing the systematic errors given in Eq. (A1) was calculatedfrom the difference betweenkbias
1 and thek1 in Eq. (18) withrespect to each molecule. The total impact of including thesystematic errors was calculated from the root-sum-square ofimpacts of the systematic errors for each molecule. TableA1shows the impacts of the systematic errors. The total impactfor the rate constant of Reaction (R1) was estimated to beup to 4.3 % using 3 % for [ClO], [HO2], and [HOCl] as thesystematic errors.
Atmos. Chem. Phys., 14, 255–266, 2014 www.atmos-chem-phys.net/14/255/2014/

K. Kuribayashi et al.: SMILES HOCl 265
Table A1. Impacts of the systematic errors.
systematic Proportional term Offset termerrors (B = 1) (B = 0)
ClO 3 % 2.2 % 2.9 %HO2 3 % 3.0 % 3.0 %HOCl 3 % 2.2 % 0.0 %Total 4.3 % 4.2 %
Acknowledgements.The JEM/SMILES mission is a joint projectof the Japan Aerospace Exploration Agency (JAXA) and theNational Institute of Information and Communications Technology(NICT). We are grateful for valuable discussions with and supportfrom C. Fittschen (Lille University of Science and Technology),K. Walker (University of Toronto), and Y. Nakano (Tokyo GakugeiUniversity). We appreciate the careful peer review and constructivecomments from D. G. Johnson (National Aeronautics and SpaceAdministration), O. Kirner (Karlsruhe Institute of Technology),and T. von Clarmann (Karlsruhe Institute of Technology). Y. Kasaiis supported by a Funding Program for Next Generation World-Leading Researchers (NEXT Program) (No. 6GR101). T. O. Satois supported by a Grant in Aid for Research Fellowship for YoungScientists DC1 (No. 23–9766) from the Japan Society for thePromotion of Science.
Edited by: T. von Clarmann
References
Brasseur, G., Orlando, J., and Tyndall, G.: Atmospheric Chemistryand Global Change, Oxford University Press, 1999.
Chipperfield, M., Cariolle, D., and Simon, P.: A 3D model studyof chlorine activation during EASOE, Geophys. Res. Lett., 21,1467–1470, 1994.
Hickson, K. M., Keyser, L. F., and Sander, S. P.: Temperature De-pendence of the HO2 + ClO Reaction. 2. Reaction Kinetics Usingthe Discharge-Flow Resonance-Fluorescense Technique, J. Phys.Chem. A, 111, 8126–8138, 2007.
Kasai, Y., Sagawa, H., Kreyling, D., Dupuy, E., Baron, P., Men-drok, J., Suzuki, K., Sato, T. O., Nishibori, T., Mizobuchi, S.,Kikuchi, K., Manabe, T., Ozeki, H., Sugita, T., Fujiwara, M., Ir-imajiri, Y., Walker, K. A., Bernath, P. F., Boone, C., Stiller, G.,von Clarmann, T., Orphal, J., Urban, J., Murtagh, D., Llewellyn,E. J., Degenstein, D., Bourassa, A. E., Lloyd, N. D., Froidevaux,L., Birk, M., Wagner, G., Schreier, F., Xu, J., Vogt, P., Traut-mann, T., and Yasui, M.: Validation of stratospheric and meso-spheric ozone observed by SMILES from International SpaceStation, Atmos. Meas. Tech., 6, 2311–2338, doi:10.5194/amt-6-2311-2013, 2013.
Khosravi, M., Baron, P., Urban, J., Froidevaux, L., Jonsson, A. I.,Kasai, Y., Kuribayashi, K., Mitsuda, C., Murtagh, D. P., Sagawa,H., Santee, M. L., Sato, T. O., Shiotani, M., Suzuki, M., vonClarmann, T., Walker, K. A., and Wang, S.: Diurnal variation ofstratospheric and lower mesospheric HOCl, ClO and HO2 at theequator: comparison of 1-D model calculations with measure-
ments by satellite instruments, Atmos. Chem. Phys., 13, 7587–7606, doi:10.5194/acp-13-7587-2013, 2013.
Kikuchi, K., Nishibori, T., Ochiai, S., Ozeki, H., Irimajiri, Y.,Kasai, Y., Koike, M., Manabe, T., Mizukoshi, K., Murayama,Y., Nagahama, T., Sano, T., Sato, R., Seta, M., Takahashi, C.,Takayanagi, M., Masuko, H., Inatani, J., Suzuki, M., and Sh-iotani, M.: Overview and early results of the Superconduct-ing Submillimeter-Wave Limb-Emission Sounder (SMILES), J.Geophys. Res., 115, D23306, doi:10.1029/2010JD014379, 2010.
Knight, G. P., Beiderhase, T., Helleis, F., Helleis, F., Moortgat,G. K., and Crowley, J. N.: Reaction of HO2 with ClO : FlowTube Studies of Kinetics and Product Formation between 215and 298 K, J. Phys. Chem. A, 104, 1674–1685, 2000.
Kovalenko, L. J., Jucks, K. W., Salawitch, R. J., Toon, G. C.,Blavier, J. F., Jhonson, D. G., Kleinböhl, A., Livesey, N. J., Mar-gitan, J. J., Pickett, H. M., Santee, M. L., Sen, B., Stachnik, R. A.,and Waters, J. W.: Observed and modeled HOCl profiles in themidlatitude stratosphere Implication ozone loss, Geophys. Res.Lett., 34, L19801, doi:10.1029/2007GL031100, 2007.
Lee, A. M., Jones, R. L., Kilbane-Dawe, I., and Pyle, J. A.: Diagnos-ing ozone loss in the extratropical lower stratosphere, J. Geophys.Res., 107, 4110, doi:10.1029/2001JD000538, 2002.
Nickolaisen, S. L., Roehl, C. M., Blakeley, L. K., Friedl, R. R.,Francisco, J. S., Liu, R., and Sander, S. P.: Temperature Depen-dence of the HO2 + ClO Reaction. 1. Reaction Kinetics by PilsedPhotolisis-Ultraviolet Abosrption and ab Initio Studies of the Po-tential Surface, J. Phys. Chem. A, 104, 308–319, 2000.
Sagawa, H., Sato, T. O., Baron, P., Dupuy, E., Livesey, N., Urban,J., von Clarmann, T., de Lange, A., Wetzel, G., Connor, B. J., Ka-gawa, A., Murtagh, D., and Kasai, Y.: Comparison of SMILESClO profiles with satellite, balloon-borne and ground-based mea-surements, Atmos. Meas. Tech., 6, 3325–3347, doi:10.5194/amt-6-3325-2013, 2013.
Sander, S. P., Golden, D. M., Kurylo, M. J., Morrtgat, G. K., Wine,P. H., Ravishankara, A. R., Kolb, C. E., Molina, M. J., Finlayson-Pitts, B. J., Huie, R. E., Orkin, V. L., Friedl, R. R., and Keller-Rudek, H.: Chemical kinetics and photochemical data for use inatmospheric studies, JPL Publication, 2006.
Sander, S. P., Friedl, R. R., Barker, J. R., Golden, D. M., Kurylo,M. J., Wine, P. H., Abbatt, J., Burkholder, J. B., Kolb, C. E.,Moortgart, G. K., Huie, R. E., and Orkin, V. L.: Chemical Kinet-ics and Photochemical Data for Use in Atmospheric Studies, JPLPublication, 2010.
Sander, S. P., Barker, J. R., Golden, D. M., Kurylo, M. J., Wine,P. H., Abbatt, J. P. D., Burkholder, J. B., Kolb, C. E., Moort-gat, G. K., Huie, R. E., and Orkin, V. L.: Chemical Kinetics andPhotochemical Data for Use in Atmospheric Studies, JPL Publi-cation, 2011.
Sato, T. O., Sagawa, H., Kreyling, D., Manabe, T., Ochiai, S.,Kikuchi, K., Baron, P., Mendrok, J., Urban, J., Murtagh, D.,Yasui, M., and Kasai, Y.: Strato-mesospheric ClO observationsby SMILES: error analysis and diurnal variation, Atmos. Meas.Tech., 5, 2809–2825, doi:10.5194/amt-5-2809-2012, 2012.
Seely, J. V., Jayne, J. T., and Molina, M. J.: Kinetic Studies of Chlo-rine Atom Reactions Using the Turbulent Flow Tube Technique,J. Phys. Chem., 100, 4019–4025, 1996.
Stimpfle, R. M., Perry, R. A., and Howard, C. J.: Temperature de-pendence of the reaction of ClO and HO2 radicals, J. Chem.Phys., 71, 5183–5190, 1979.
www.atmos-chem-phys.net/14/255/2014/ Atmos. Chem. Phys., 14, 255–266, 2014

266 K. Kuribayashi et al.: SMILES HOCl
von Clarmann, T., Funke, B., Glatthor, N., Kellmann, S., Kiefer,M., Kirner, O., Sinnhuber, B.-M., and Stiller, G. P.: The MI-PAS HOCl climatology, Atmos. Chem. Phys., 12, 1965–1977,doi:10.5194/acp-12-1965-2012, 2012.
Xu, Z. F., Zhu, R. S., and Lin, M. C.: Ab Initio Studies of ClOx
Reactions: VI. Theoretical Prediction of Total Rate Constant andProduct Branching Probabilities for the HO2 + ClO Reaction, J.Phys. Chem. A, 107, 3841–3850, 2003.
Atmos. Chem. Phys., 14, 255–266, 2014 www.atmos-chem-phys.net/14/255/2014/