diploma thesis criticality analysis as a tool for strategy
TRANSCRIPT

Diploma Thesis
Criticality Analysis as a Tool for Strategy
Development in Maintenance
An exemplary Application on new Woodyard Equipment at a
Pulp- and Papermill in Russia
Submitted by
Thomas Buchhäusl
In cooperation with
MONDI UNCOATED FINE & KRAFT PAPER GmbH
Assessor:
Univ.-Prof. Dipl. Ing. Dr. techn. Wolfgang Bauer
Advisor:
Dipl. Ing., MBA Franz Stebegg
Institute for Paper, Pulp and Fiber Technology University of Technology Graz
Kopernikusgasse 24/ II A - 8010 Graz
Graz, December 2009


Statutory Declaration
I declare that I have authored this thesis independently, that I have not used other than
the declared sources / resources, and that I have explicitly marked all material which has
been quoted either literally or by content from the used sources.
Graz, Date:_____________________________ Signature:_____________________
Eidesstaatliche Erklärung
Ich erkläre an Eides Statt, dass ich die vorliegende Arbeit selbstständig und ohne fremde
Hilfe verfasst, andere als die angegebenen Quellen nicht benutzt und die den benutzten
Quellen wörtlich und inhaltlich entnommenen Stellen als solche kenntlich gemacht habe.
Ich versichere, dass ich dieses Diplomarbeitsthema bisher weder im In- noch im Ausland
(einem Beurteiler oder einer Beurteilerin) in irgendeiner Form als Prüfungsarbeit vorgelegt
habe.
Graz, Datum:_____________________________ Unterschrift:_____________________

Danksagung
„LEIDER LÄSST SICH EINE WAHRHAFTE DANKBARKEIT MIT WORTEN NICHT AUSDRÜCKEN.“ (J. W.
v. Goethe)
Von ganzem Herzen danke ich meinen Eltern für Ihre Geduld und Unterstützung in jegli-
cher Form. Danke, dass Ihr immer an mich geglaubt habt!
Besonders bedanke ich mich bei Herrn Univ. Prof. Dipl. Ing. Dr. techn. Wolfgang Bauer für
die Vermittlung dieser Arbeit, sowie bei Herrn Dipl. Ing. MBA Franz Stebegg für die Einbli-
cke in einen umfassenden Veränderungsprozess in einer russischen Zellstoff- und Papier-
fabrik. Danke an die Mondi Uncoated Fine & Kraft Paper GmbH und ihren Mitarbeitern für
die Möglichkeit und Unterstützung dieser Arbeit.
Weiterer Dank gilt: Herrn Dipl. Ing. (FH) Dr. mont. Werner Schröder (Departement für
Wirtschaft- und Betriebswissenschaften, Montanuniversität Leoben) für die Versorgung
mit hilfreichen Informationen zum Thema. Frau Dr. Stephanie Rainer für das Korrekturle-
sen der Arbeit. Meiner Freundin Lisa für die mentale Unterstützung, auch über große Ent-
fernungen hinweg.

Abstract
An international paper manufacturing group is expanding their production site in Russia.
At the pulp mill, equipment based on newest technology will be installed. To fulfill the new
requirements on equipment uptime and reliability, an improvement of practical and me-
thodical knowledge of the maintenance organization on site is necessary. Criticality analy-
sis is a tool in maintenance engineering to optimize the efforts in maintenance activities.
This work is providing a guideline in order to apply a criticality analysis based on the prac-
tical example of wood yard equipment. Key equipment and common failures are mainly
identified by experiences at foreign mills and analysis of the plant layout. Risk matrix, fail-
ure mode and effects analysis and a maintenance strategy portfolio are the explained and
used tools. The importance of risk based strategy development and the implementation of
a clear reporting and planning system are examples of interesting potentials which were
found.
Kurzfassung
Ein internationaler Papierhersteller erweitert seinen Produktionsstandort in Russland. In
der Zellstofffabrik werden Anlagen mit der neuesten Technologie installiert. Um die neuen
Anforderungen an Laufzeit und Verfügbarkeit zu erfüllen, ist eine Verbesserung des prak-
tischen und methodischen Wissens der Instandhaltungsorganisation notwendig. Die Kriti-
kalitätsanalyse ist ist ein Werkzeug der Instandhaltungs-Technik, um die Instandhaltung-
saktivitäten zu optimieren. Diese Arbeit liefert einen Leitfaden für die Anwendung einer
Kritikalitätsanalyse, basierend auf dem praktischen Beispiel eines Holzplatzes. Schlüssel-
komponenten und übliche Störfälle werden durch Erfahrungen anderer Fabriken und
durch Analyse des Anlagenschemas identifiziert. Die Risiko-Marix, eine Failure Mode and
Effects Analyse und ein Portfolio an Instandhaltungsstrategien werden erklärt und ange-
wendet. Die Bedeutung einer risikobasierenden Strategieentwicklung und die Einführung
eines Berichts- und Planungssystem, sind interessante Potentiale, die unter anderem ge-
funden wurden.

Table of contents
I
Table of contents
1 Introduction ............................................................................................................. 1-1
1.1 Initial Situation ................................................................................................. 1-1
1.2 Problem statement ........................................................................................... 1-1
1.3 Approach and Objectives ................................................................................. 1-2
1.4 Work Structure ................................................................................................. 1-3
2 Theoretical Background .......................................................................................... 2-4
2.1 Maintenance in general ................................................................................... 2-4
2.1.1 Maintenance definition .............................................................................. 2-4
2.1.2 Maintenance strategies ............................................................................. 2-4
2.1.3 Maintenance engineering ......................................................................... 2-6
2.1.4 Maintenance organization ......................................................................... 2-7
2.1.5 Maintenance management ....................................................................... 2-8
2.1.6 Reliability and Reliability Centered Maintenance (RCM) ......................... 2-10
2.2 Relevance of maintenance in the pulp- and paper industry ............................ 2-11
2.2.1 Influence of maintenance on the production ........................................... 2-12
3 Theoretical Basics and Tools ................................................................................ 3-16
3.1 Risk Matrix ..................................................................................................... 3-16
3.1.1 Risk assessment approach supported by Turnbull .................................. 3-16
3.1.2 Risk portfolio approach established in maintenance ............................... 3-17
3.2 Failure Modes and Effects Analysis (FMEA) .................................................. 3-19
3.2.1 FMEA process ........................................................................................ 3-20
3.2.2 Failure analysis ....................................................................................... 3-21
3.2.3 Risk evaluation ....................................................................................... 3-22
3.2.4 Follow-up and optimization ..................................................................... 3-26
3.3 Strategy development .................................................................................... 3-26
3.3.1 Maintenance strategy based on severity and occurrence ....................... 3-26

Table of contents
II
3.3.2 Maintenance strategy based on criticality and detection ......................... 3-27
3.3.3 Maintenance strategy based on RPN and detection ............................... 3-27
4 Criticality analysis of wood yard equipment at Mondi Syktyvkar ............................ 4-28
4.1 Plant and process overview ........................................................................... 4-28
4.1.1 Process description ................................................................................ 4-28
4.1.2 Plant layout ............................................................................................. 4-32
4.1.3 Equipment .............................................................................................. 4-34
4.1.4 Plant profile ............................................................................................ 4-37
4.2 Experiences at other mills .............................................................................. 4-37
4.2.1 Mondi Frantschach ................................................................................. 4-38
4.2.2 Zellstoff Poels ......................................................................................... 4-42
4.2.3 Mondi Ruzomberok................................................................................. 4-45
4.2.4 Most important process areas ................................................................. 4-47
4.2.5 Most important equipment ...................................................................... 4-49
4.3 Preselection of critical equipment .................................................................. 4-50
4.3.1 Risk assessment by Turnbull .................................................................. 4-51
4.3.2 Risk assessment by risk portfolio ............................................................ 4-54
4.4 FMEA (example): Pile reclaiming system ....................................................... 4-57
4.4.1 Operating conditions ............................................................................... 4-57
4.4.2 Constituent parts .................................................................................... 4-57
4.4.3 Functional structure ................................................................................ 4-58
4.4.4 Analysis table ......................................................................................... 4-58
5 Conclusions and recommendations ...................................................................... 5-61
5.1.1 Lessons from other mills ......................................................................... 5-61
5.1.2 Lessons from criticality analysis .............................................................. 5-61
5.1.3 Lessons from FMEA ............................................................................... 5-63
5.1.4 Lessons for maintenance management .................................................. 5-63
Table of contents
III
5.1.5 Future project ideas ................................................................................ 5-64
6 Appendix I ............................................................................................................. 6-66
6.1 Bibliography ................................................................................................... 6-66
6.2 List of tables .................................................................................................. 6-69
6.3 List of figures ................................................................................................. 6-69
6.4 Abbreviations ................................................................................................. 6-71
7 Appendix II ............................................................................................................ 7-74
7.1 Questionnaire ................................................................................................ 7-74
7.2 Layout drawing: Woodroom ........................................................................... 7-84
7.3 Layout drawing: Chip handling ....................................................................... 7-85
7.4 Drawing: Reclaimer ....................................................................................... 7-86
7.5 Other drawings .............................................................................................. 7-87

Introduction
1-1
1 Introduction
1.1 Initial Situation
The international Mondi Group is an integrated packaging and business paper producer.
The Group is fully integrated across the paper and packaging process, from the growing
of wood and the manufacture of pulp and paper (including recycled paper) to conversion
of packaging papers into corrugated packaging and industrial bags. Mondi has production
operations across 35 countries and had an average of 33.400 employees in 2008. The
Europe & International Division has 95 production plants and is producing corrugated pa-
per, bags, specialties and uncoated fine paper (UFP). The business unit Uncoated Fine
Paper has 4 mills and 10 paper machines producing more than 1,5 million tons of paper.
Since 2002, the mill in Syktyvkar (Komi Republic, Russia) has belonged to the Mondi Eu-
rope & International Division (at that time Neusiedler Group, a subsidiary of Mondi Group).
Syktyvkar is located 1.200 km away from Moscow and 1.000 km from St. Petersburg. The
mill produces more than 672.000 tons of pulp (hardwood, softwood, CTMP) and over
830.000 tons of board and paper per year, with one board machine and three paper ma-
chines. The mill is provided with energy by its own power plant generating with a capacity
of 468 MW. Excess electricity and heat is on-sold to the Komi Republic. Between 2008
and 2010 Mondi Group is investing more than 500 million EUR in Syktyvkar (STEP-
project). The STEP-project is designed to increase the pulp production by 190.000 tons
per year and the board and paper output by 120.000 tons per year.
1.2 Problem statement
One of the main principles of the STEP-project is the application of newest technologies
for pulp- and paper production. Due to this, the maintenance concept of the mill has to be
adapted. Wood yard, evaporation plant and recovery boiler will receive completely new
and modern equipment. Therefore, the development of new maintenance concepts for
these departments is necessary. Currently, a lot of redundant equipment is available in
the case of break downs. The future situation (after STEP) of the mill will lead close to a
single line concept. So the influence of breakdowns on the time efficiency of the produc-
tion lines will be serious. The previous strength of the maintenance organization lies in

Introduction
1-2
repair activities (reactive maintenance). This system will not be sufficient to ensure the
reliability of the plant. An additional challenge in ensuring a maximum of equipment up-
time is Syktyvkar’s “remote location”, geographically away from other industrial infrastruc-
ture. It is a corporate requirement to build up a new maintenance organization with best
practice character. The target of the pulp mill in Syktyvkar is 350 days of continuous pro-
duction and one annual shutdown (10 – 14 days). So maximum equipment up-time at min-
imum maintenance costs are the overall target. Therefore it is important to know, which
effort in maintaining certain equipment is essential and which effort is sufficient.
1.3 Approach and Objectives
In order to identify an adequate maintenance strategy, the criticality of a certain device will
be determined. Experiences from other mills using similar equipment, are the first sources
for figuring out the critical plant assets. Therefore, a benchmarking with the pulp produc-
tion area of other mills will be initiated. A questionnaire and personal mill visits are the
basis of this benchmarking process. Regarding wood yard, evaporation plant and recov-
ery boiler, three core questions should be answered:
• Which critical equipment can be found at these systems?
• What are the most common failures and their reasons?
• How is the maintenance organization handling the related tasks?
The second input is delivered by the original equipment manufacturer (OEM) and his op-
eration and maintenance manuals. During this work, the manuals will be evaluated to find
out whether they fulfill the requirements to be useful for maintenance management and
maintenance execution in the daily work.
The next phase is solely concentrating on the new wood yard. A closer look at the plant
layout (flow sheets) of the new equipment should help to discover possible bottlenecks. If
a breakdown of an equipment is influencing (constraining) the production process, this
equipment should be considered as a key equipment. Based on this information (other mill
experiences, supplier instructions, plant layout), the crucial equipment will be identified.
To recommend a certain way of treating equipment by maintenance, the knowledge about
the failure risk and the risk of failure results is necessary. The next step is a failure mode
and effects analysis (FMEA) of the plant. This will be done in an interdisciplinary work-

Introduction
1-3
shop. The gained results should be criticality classes for certain failures and a list of the
most critical items.
Summarized overview of the process:
1. Basis input
• Identification of key equipment (other mill experiences, supplier instructions,
plant layout)
• Identification of common failures (other mill experiences, operator experiences,
supplier experiences)
2. Failure modes, effects and causes
• Severity of failures
• Likelihood of failure occurrence
• Probability of failure detection
3. Criticality determination
4. Outcome
• Maintenance strategies based on risk assessment
• Criticality ranking of process areas, equipment, items, etc.
The result of this work is a tool to apply the methodology of a criticality analysis in main-
tenance engineering projects. It should help to understand the importance of a selective
strategy development and simultaneously act as a guideline for practical use.
1.4 Work Structure
Chapter 2 (“Theoretical background”) explains the meaning of frequently used terms. It
describes the theoretical framework of maintenance in the industry. Chapter 3 (“Theoreti-
cal basics and tools”) describes the applied methods and illustrates the scientific basics of
criticality analysis. Chapter 4 (“Criticality analysis of wood yard equipment at MSY”)
represents the practical work of a criticality analysis. The scientific theories of the previous
chapters and the practical results of questionnaire, layout study, etc. will be combined to a
brief and open criticality analysis. Chapter 5 (“Conclusions and recommendations”) shows
the results of the analysis itself, but also points out some improvement potentials for main-
tenance at Mondi Syktyvkar.

Theoretical Background
2-4
2 Theoretical Background
2.1 Maintenance in general
To understand the approach of this work and comprehend the meaning of its outcomes, it
is recommended to know about the framework in which this work is embedded. Mainten-
ance engineering and maintenance management are essential for the profitability of a mill.
2.1.1 Maintenance definition
Maintenance and all its related processes and activities are part of the Asset Manage-
ment. “The main role of the asset management is to administer operating resources in
view to corporate goals. Operating resources are plants, equipment (machines, devices),
manufacturing facilities, means of transport and spares.” (Biedermann, 2007)
The German standard DIN 31051 describes “all measures for maintaining and restoring
the target condition as well as determining and assessing the actual condition of technical
equipment in a system”. (Stengl & Ematinger, 2001)
Thus maintenance is a procedure to create values in order to balance or recover ex-
pended or consumed values. (Biedermann, 2007)
Maintenance is composed of
• Service
• Inspection
• Repair
Service summarizes all actions taken to keep the target condition, like cleaning, lubricat-
ing, replacing, adjusting, etc. Actions like detecting and proving are inspection activities
and attend to the identification of the actual condition. To rebuild the target condition, re-
pair work like correcting and replacing has to be done. (Biedermann, 2007)
The main outcome of all maintenance actions is to ensure sufficient reliability and availa-
bility at minimal costs.
2.1.2 Maintenance strategies
“Maintenance strategies are rules to quote, which actions should be done on which devic-
es at which time.” (Matyas, 2002)

Theoretical Background
2-5
Four basic maintenance strategies are established in the industrial practice:
Figure 2-1: Maintenance strategies
Reactive/ corrective maintenance:
Breakdown based strategy. The strategy is to apply the corrective action (repair, restora-
tion, replacement) only, when it is required to correct a failure that has occurred. There
are no routine or scheduled tasks. The principle is also known as Run-to-Failure Mainten-
ance.
Preventive maintenance:
“This is a time based strategy where on a predetermined periodic basis, equipment is tak-
en off-line, opened up and inspected, repairs are made and the equipment is then put
back on-line.” (Jabar, 2003) The idea is to prevent a failure before it occurs.
If the equipment wear is checked within defined intervals, the strategy will be called pe-
riodical preventive maintenance. (Rasch, 2000)
Predictive maintenance:
Condition based strategy. Adequate diagnostic and monitoring systems are providing on-
time information about variations from the target condition. So the maintenance activities
can be based on the concrete rate of wear of the equipment. This enables the planning
and execution of maintenance activities to optimized costs.
If the maintenance period is adjusted to the actual condition of the equipment, the metho-
dology is also called deterministic-sequential. (Rasch, 2000)

Theoretical Background
2-6
Often used diagnostic measurement is vibration measurement for bearings. In most cas-
es, the condition monitoring is done by hand, but in the last years a lot of online diagnostic
systems have also come up.
Proactive maintenance:
“The principle of this strategy is the detection and correction of root causes to equipment
failures. It is also designed to extend the useful age of the equipment.” (Jabar, 2003)
Proactive maintenance is not only concentrating on the symptoms. It is also looking for the
causes of equipment failures, to eliminate these factors, so that a further appearance of
the failure can be avoided. This approach has to be supported by analysis work (e. g. la-
boratories) and would be most effective in combination with real-time data.
In the modern industry, a mix of these strategies is utilized. Which equipment and device
is maintained by which strategy is identified by a substantial analysis. The following crite-
ria will be determined: interlinked equipment, redundant equipment, environmental-, safe-
ty- and health criteria, employment law, time to repair, availability of spare parts, buffer
time, peak load. (Matyas, 2002)
2.1.3 Maintenance engineering
A maintenance strategy is always defined for certain maintenance objects (devices, items,
etc.) and is developed within a maintenance engineering process. Parts of maintenance
engineering are:
• Criticality analysis, Failure Mode and Effects Analysis (FMEA)
• Maintainability analysis
• Life cycle analysis
• Root Cause Failure Analysis (RCFA)
• Development of inspection and lubrication plans and routes
• Determining of spare part needs
• Set-up and modification of the Computerized Maintenance Management Sys-
tem (CMMS)
• Etc.
Theoretical Background
2-7
Maintenance engineering influences each section of the maintenance function and makes
the conditions to do
• the right maintenance
• on the right equipment
• at the right time
• with the right people
• for the right reasons
(Velthoven, 2009)
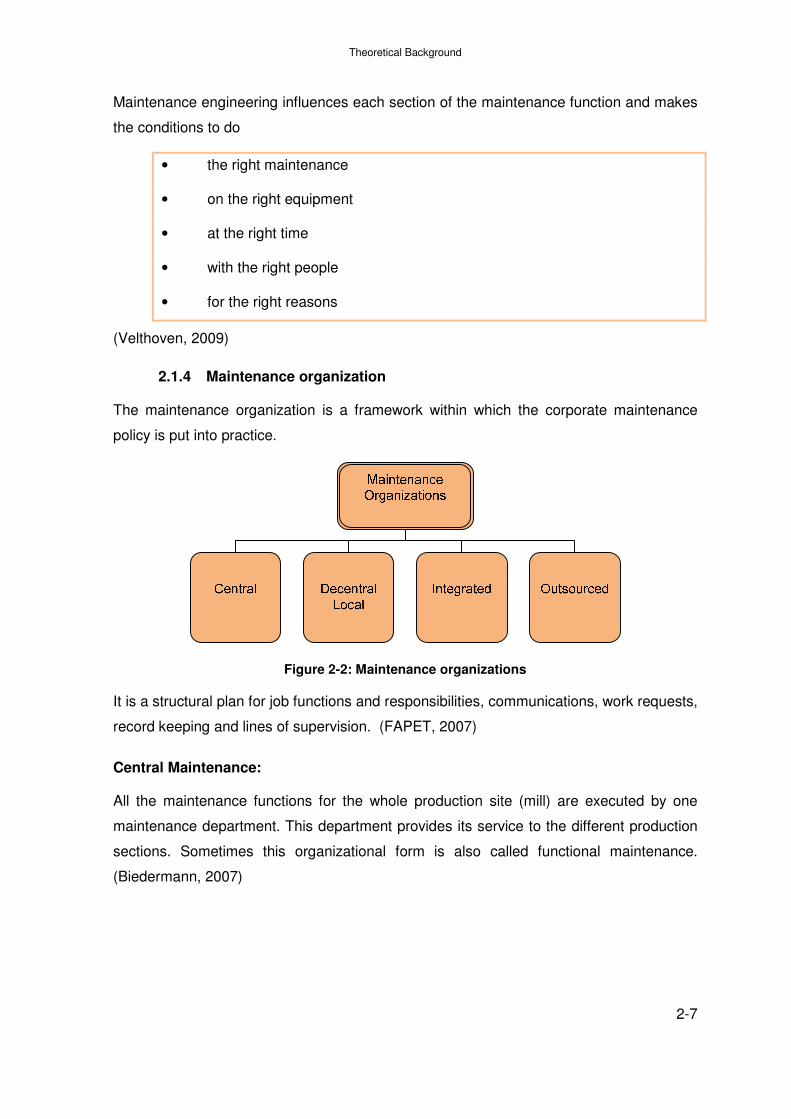
2.1.4 Maintenance organization
The maintenance organization is a framework within which the corporate maintenance
policy is put into practice.
Figure 2-2: Maintenance organizations
It is a structural plan for job functions and responsibilities, communications, work requests,
record keeping and lines of supervision. (FAPET, 2007)
Central Maintenance:
All the maintenance functions for the whole production site (mill) are executed by one
maintenance department. This department provides its service to the different production
sections. Sometimes this organizational form is also called functional maintenance.
(Biedermann, 2007)

Theoretical Background
2-8
Decentral (local) Maintenance:
Each production section (departments, “business units”) has its own maintenance de-
partment, which is responsible for all maintenance activities (including planning and sche-
duling). It is also called object oriented maintenance. (Biedermann, 2007)
Integrated Maintenance:
The operators are part of the maintenance function. Inspection, lubrication and repairs,
which could easily be done, are executed by the operators. Maintenance personnel will be
called just for special inspection and repair tasks.
Outsourced Maintenance:
The maintenance tasks are transferred to an outside contractor. The external partner
builds up his own inner structure.
Most of the organizational concepts in the industrial praxis are a mix of these forms. For
instance, Mondi Ruzomberok has decentral maintenance departments in their business
units (e. g. recovery line), and those are supported by a central maintenance department
for special tasks and in case of staff shortage. The more interwoven the central mainten-
ance and the local maintenance are, the more it is important to clarify the responsibilities.
It is essential to avoid overlapping, especially in the case of shutdown planning.
Outsourcing is seldom used in its pure form, like at Metsa-Botnia mill in Fray Bentos (Uru-
guay). (Andritz AG, 2007) On the other hand, it is common to call external contractors for
big shutdowns (annual shutdown, revision) and special tasks.
2.1.5 Maintenance management
The maintenance management represents all the functions to plan and control the main-
tenance organization in terms of effectiveness and efficiency. It is a closed loop process,
based on decisions on the corporate level.

Theoretical Background
2-9
Figure 2-3: Maintenance management process
The maintenance function has to execute the tasks according to the maintenance strate-
gy, under the basic conditions of the maintenance organization. It is the executing part of
the process and delivers the main impact on the maintenance performance. Therefore it is
essential for performance analysis to have meaningful and controllable information availa-
ble in each section of the maintenance function.
Figure 2-4: Maintenance function and activities
To expand and support the strategies mentioned before, several management tools are
offered. Some of them are part of “maintenance philosophies”, which have started to

Theoretical Background
2-10
come up in the last few decades like Reliability Centered Maintenance (RCM), Total Pro-
ductive Maintenance (TPM), etc. One of the most powerful tools for maintenance man-
agement are Key Performance Indicators (KPI). Measures are widely spread instruments
to figure out whether an organization is making progress towards a defined goal. For ex-
ample at the work scheduling section: the percentage of work orders completed during the
scheduled period before the late finish or required by date (world class maintenance
should achieve >90 % schedule compliance). (Weber, 2005) KPI are classified as lead-
ing or lagging indicators. Leading indicators (e. g. percentage of maintenance work orders
requiring rework) measure and track performance before a problem arises, while lagging
indicators (e. g. maintenance costs/manufacturing costs) show if certain results were
achieved. (Smith & Hawkins, 2004) Both types of KPI should be considered. It is more
productive to use less, but meaningful measures. The effectiveness-KPI registering the
target achievement and the efficiency-KPI should display if the target has been reached in
a convenient way.
2.1.6 Reliability and Reliability Centered Maintenance (RCM)
Moubray is defining RCM as “a process used to determine what must be done to ensure
that any physical asset continues to what its user wants it to do in its present operating
context.” (Moubray, 1997) This definition is too imprecise. It has to become clear, what is
really meant by the term reliability. Reliability means a reasonable confidence in the
equipment to fulfill its function at the required time in the required quality. To build up this
reasonable confidence, it is indispensible to gain information about the breakdown charac-
teristics of the item. For that reason, the following definition of RCM is more appropriate:
“RCM is a step-by-step instructional tool for how to analyze a system’s all failure modes
and define how to prevent or find those failures early.” (Idcon Inc., 2006)
In other words, RCM helps to establish the need for and the type and frequencies of pre-
ventive and predictive maintenance. (Dufresne)
But the reason to utilize RCM is not just because of improving the equipment availability.
Benefits will also be gained from a better balance between maintenance costs and main-
tenance advantage. In applying this concept, several other tools, like FMEA, RCFA, etc.
will be used. So the RCM is not a self-standing process, but rather a fusion of analyzing
and implementing tools. The result is a mix of maintenance strategies according to the
real needs of the maintenance object.

Theoretical Background
2-11
Some of the fundamental considerations of the present work are influenced by RCM.
2.2 Relevance of maintenance in the pulp- and paper indus-
try
Pulp- and paper production is characterized by highly developed equipment and complex
processes. Therefore the investment costs and further on the fixed costs of the assets are
very high. It is an important challenge to keep equipment uptime as high as possible.
Maintenance costs constitute 4 – 14 % of production costs in the paper industry. (FAPET,
2007)
There are two major risks for the asset management in the industry:
• Risk of breakdown
• Risk of breakdown consequences
The last result of a breakdown is the production loss on salable pulp or paper.
Example: Pulp mill
Pulp mill production output: 2000 t/d Non Bleached Softwood Kraft Pulp (NBSK)
Pulp sales price: 456,54 €/t (Actual price for NBSK on 2009-07-28) (FOEX Indexes Ltd.)
Resulting sales value of the lost production for one downtime day: 913.080,- €/d
Maintenance costs pulp mill: 30,- €/t
Resulting maintenance costs for one production day: 60.000,- €/d
This means that an investment of 1,- €/t in maintenance can generate more than 15,- €/t
in production value. On the other hand, if 1,- € is invested in improper maintenance and
causes a breakdown, the resulting costs are more than 15,- €.
Example: Integrated mill (pulp and paper production on one site)
Paper production output: 2.500 t/d A4 B-copy (uncoated woodfree)
Paper sales price: 805,37 €/t (Actual price for A4 B-copy on 2009-07-28) (FOEX Indexes
Ltd.)
Resulting sales value of the lost production for one downtime day: 2.013.425,- €/d
Maintenance costs integrated mill: 45,- €/t

Theoretical Background
2-12
Resulting maintenance costs for one day: 112.500,- €/d
So the ratio would be nearly 1:18 for improper maintenance expenses and their resulting
costs.
Gross margin pulp mill: 322,15 €/t
Loss of gross margin for one downtime day: 805.375,- €/d
As these examples show, everything has to be done by mill management to enable very
good and smooth maintenance performance.
On mill level it is not possible to control the market or the raw material costs. Thus the mill
is forced to look inward to find ways for improving its bottom-line results. For most mills,
improved reliability is a key area of cost and productivity improvement. (Hykin, 2003)
On the Fortune 500 listening from 2004, the forest and paper product sector is ranked on
position 42 out of 45, related to its return on assets (ROA). (Steele, 2006) In the same
listening from 2008, the forest and paper sector has already disappeared. Concerning this
fact, several approaches to increase the profit margin in this industry are needed. One of
these ways is to improve the equipment efficiency together with lowering the maintenance
costs.
2.2.1 Influence of maintenance on the production
The common goal of all mill departments is to produce pulp and/ or paper in the most
competitive way. In achieving this goal, both departments, operations and maintenance,
are equal partners.
At this point it must be considered that time efficiency, operating rate and overall equip-
ment effectiveness (OEE) are not only maintenance related KPI. These measures are
strongly interlinked with operations. Related to definitions from the associations Zellchem-
ing and FAPET: (Zellcheming, 2005)
Time efficiency = Production time / Maximum available time
Production time = Maximum available time - Idle time
The idle time contains breaks and setup works (e. g. grade changes) as well.
Maximum available time = Calender time - Time not available

Theoretical Background
2-13
If the production line is shut down for external reasons and the operations is not responsi-
ble for these reasons (holidays, rebuilds, crashes, lack of orders, etc.), this downtime is
called time not available.
The approach behind the definitions by Zellcheming refers directly to the six major losses.
(Ouvreloeil, 2004)

Theoretical Background
2-14
OEE-factor Loss Remarks Influenced by
maintenance
Influenced by
operation
Availability Equipment failure
causes produc-
tion downtime
Maintenance as-
sistance required
Yes (Yes)
Setup and ad-
justments
Grade changes No Yes
Small stops Minor adjust-
ments, simple
tasks (cleaning)
Yes Yes
Speed Speed losses Lower machine
speed because of
machine wear,
substandard mate-
rials, operator
inefficiency
Yes Yes
Quality Losses during
regular produc-
tion
Less than accepta-
ble quality
(Yes) Yes
Losses during
warm-up
Less than accepta-
ble quality during
the first period
after downtime
(Yes) Yes
Table 2-1: OEE-factors and major losses
Obviously, maintenance and operations are belonging together. The OEE is influenced by
both elements, so it can also be called overall plant efficiency (OPE).

Theoretical Background
2-15
Maintenance work delivers equipment reliability and prolonging life of assets and the op-
erations department delivers process reliability. Their common result is production reliabili-
ty. (Idhammar, 2001) According to Idhammar, reliability can be measured with the follow-
ing formula: Reliability = Mean time between production loss (MTBPL) / mean production
loss (MPL). (Idhammar, Operations + Maintenance = Production, 2000) To avoid opera-
tional and equipment problems and to increase OPE and reliability respectively, both de-
partments should work on increasing the MTBPL and decreasing the MPL. High OPE in-
creases the production output and net sales of the mill.
Figure 2-5: Influence of operations and maintenance on production
A PricewaterhouseCoopers survey in the global forestry industry has shown that the aver-
age ROCE of the Top 100 companies dropped from 4,9% in 2007 to 2,4% in 2008.
(PricewaterhouseCoopers LLP, 2009) This movement has its reason in the global eco-
nomic slowdown. But during market downturns, it is important from a cost saving point of
view to prevent the need for repair work and to execute the maintenance activities more
efficiently. Well defined inspection and lubrication routes and root cause failure analyses
would eliminate many repair works, as well as good operating practices. A clear work
identification and prioritization, accurate planning and scheduling and detailed reporting
will help to do maintenance activities more cost-efficiently. The Norske Skog mill in Skogn
(Norway) had 30 planned bearing replacements (at three paper machines) in 2004, based
on their inspection route and condition monitoring. The planned replacement work saved

Theoretical Background
3-16
on average four hours to an unplanned work. This resulted in an additional 120 hours pro-
duction time, which represented 2880 t of saleable paper at a market value of 850.000
USD. (Jonsson, 2005)
3 Theoretical Basics and Tools
The practical approach of a criticality analysis is based on several scientific methodologies
in fields like risk management, reliability engineering, etc. These methodologies and tools
will be briefly explained below.
3.1 Risk Matrix
RCM tools like Failure Modes and Effects Analysis (FMEA) are requiring a lot of time and
personal resources. Therefore these tools should be applied just on really critical equip-
ment and parts. A new wood yard will have approximately 20.000 items, and not all of
them must fulfill the same requirements on reliability. The Pareto-Principle applied to the
plant means that 20% of the equipment is causing 80% of the problems. (Cowley, 2006)
To preselect the most critical equipment, a risk assessment was done. The whole product
flow at the wood yard was divided in typical process steps. Each process step and its
main malfunction were evaluated by defined criteria:
• Impact, consequence, effect of break down
• Likelihood, probability of break down
3.1.1 Risk assessment approach supported by Turnbull
The company was applying a Turnbull-Guidance in 2004. Turnbull is mainly used for cor-
porate risk management processes, and was modified to use it in the context of mainten-
ance. The result of this approach is a risk matrix, which should easily show the equipment
with the highest priority.

Theoretical Basics and Tools
3-17
IMP
AC
T
Machinery Break down LIKELIHOOD
HARM TO Business DAILY WEEKLY MONTHLY ANNUAL >10 YEARS
Z Y X W V
1 month breakdown A 9 8 7 6 5
1 week breakdown B 8 7 6 5 4
1 day breakdown C 7 6 5 4 3
Reportable breakdown D 6 5 4 3 2
Minor E 5 4 3 2 1
Table 3-1: Turnbull Risk Assessment Matrix (Mondi AG former Neusiedler AG, 2004)
Red cells (numbers 6, 7, 8, 9): Most critical
Yellow cells (numbers 4, 5): Medium critical
Green cells (numbers 1, 2, 3): Less critical
3.1.2 Risk portfolio approach established in maintenance
Several authors recommend a risk matrix model following the ONR 49001 (Risk Manage-
ment for Organizations and Systems - Risk Management - Practical use of
ISO/DIS 31000) (Strohmeier, 2006)
Pro
ba
bil
ity
of
fail
ure
Consequence of failure
Figure 3-1: Risk portfolio, criticality matrix

Theoretical Basics and Tools
3-18
Red cells: Most critical; Principle of risk mitigation by maintenance.
Yellow cells: Medium critical; Principle of expenditure minimization in maintenance.
Green cells: Less critical; Principle of close to zero expenditure in maintenance.
Consequence
rating SHE Production Repair
Catastrophic 4 - 5 Death, large num-
ber of serious inju-
ries, environmen-
tal disaster
Serious interrup-
tion of production
process, big pro-
duction loss, more
than 1 week
downtime
Extensive repair
costs > 1.000.000,-
EUR, equipment
replacement
Major 3 - 4 Serious injuries,
extensive injuries,
massive effect on
environment
Stop of production
process, more
than 1 day down-
time, extensive
loss in product
quality
High repair costs <
1.000.000,- EUR
Moderate 2 - 3 Medical treatment
required, con-
tained environ-
mental impact,
Interruption of
production
process, more
than 6 hours
downtime, mod-
erate loss in prod-
uct quality
Moderate repair
costs < 100.000,-
EUR
Minor 1 - 2 First aid treatment
required, minor
environmental
effect
Short interruption
of production
process, less loss in
product quality
Slight repair costs
< 10.000,- EUR
Insignificant 0 - 1 No injuries, no
environmental
impact
Very short or no
interruption of
production
process, no loss in
product quality
Insignificant repair
costs
Table 3-2: Rating criteria for failure consequence
Theoretical Basics and Tools
3-19
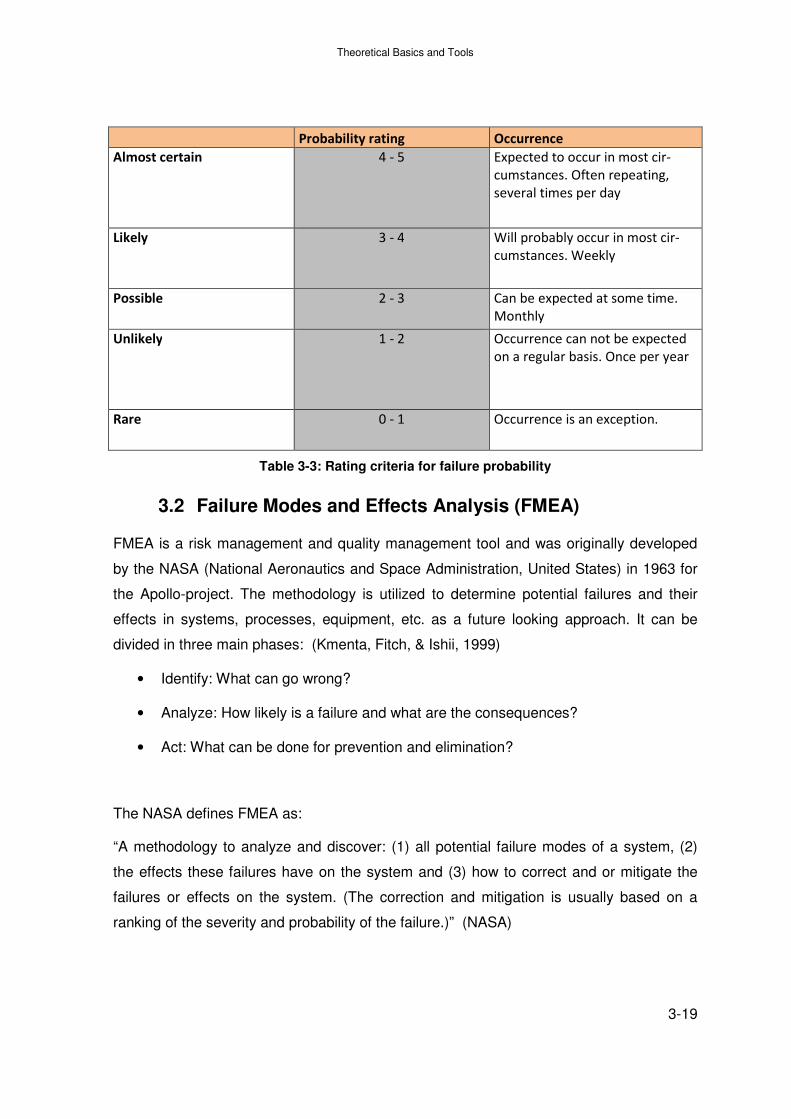
Probability rating Occurrence
Almost certain 4 - 5 Expected to occur in most cir-
cumstances. Often repeating,
several times per day
Likely 3 - 4 Will probably occur in most cir-
cumstances. Weekly
Possible 2 - 3 Can be expected at some time.
Monthly
Unlikely 1 - 2 Occurrence can not be expected
on a regular basis. Once per year
Rare 0 - 1 Occurrence is an exception.
Table 3-3: Rating criteria for failure probability
3.2 Failure Modes and Effects Analysis (FMEA)
FMEA is a risk management and quality management tool and was originally developed
by the NASA (National Aeronautics and Space Administration, United States) in 1963 for
the Apollo-project. The methodology is utilized to determine potential failures and their
effects in systems, processes, equipment, etc. as a future looking approach. It can be
divided in three main phases: (Kmenta, Fitch, & Ishii, 1999)
• Identify: What can go wrong?
• Analyze: How likely is a failure and what are the consequences?
• Act: What can be done for prevention and elimination?
The NASA defines FMEA as:
“A methodology to analyze and discover: (1) all potential failure modes of a system, (2)
the effects these failures have on the system and (3) how to correct and or mitigate the
failures or effects on the system. (The correction and mitigation is usually based on a
ranking of the severity and probability of the failure.)” (NASA)

Theoretical Basics and Tools
3-20
3.2.1 FMEA process
FMEA is a deductive procedure and will be done as a top-down analysis. The following
structured approach is recommended: (Denkena, 2009) (Bitsch, Canver, & Moik, 1999)
Figure 3-2: FMEA procedure

Theoretical Basics and Tools
3-21
1. Structure analysis:
At first there must be a clear description of the process which will be the subject of the
FMEA. To illustrate the structure, it is helpful to create a block diagram, wherein each
block represents a major element of the process. Furthermore, the elements will be
split in sub-elements and so on. The result is a hierarchic picture, comparable with a
tree structure.
2. Function analysis:
Each element and sub-element has to fulfill a certain function and task. This function
will be determined and allocated. The functional coactions of the elements will also be
shown in tree structures.
3. Failure analysis:
Potential malfunctions of elements or sub-elements will be determined. The result is
again a structured overview of potential failures and their systematic connections.
4. Risk evaluation:
A rating of the severity, probability of detection and probability of occurrence of each
failure should give a measure about the risk.
5. Follow-up and optimization:
Based on a failure ranking list and/or critical items list, the improvement process will
be started. Clear responsibilities for improvement actions and revision must be pointed
out.
3.2.2 Failure analysis
Each element and sub-element has to fulfill a certain function. The inability to perform its
function is characterized as a failure. (Denkena, 2009) [The malfunction will be analyzed
by its:
• Cause
• Consequence (Effect)
According to the functional structure, a failure structure can be built. Sometimes it might
be necessary to do the examination on a deep level of small maintainable items.

Theoretical Basics and Tools
3-22
Figure 3-3: Principle scheme of failure structure
Operating and environmental conditions should be considered in any case. The manner,
in which a process, element, item, etc. could potentially fail to meet its intent, can be
called failure mode. (Crow, 2002) Behind each failure mode observed, there is a mechan-
ism of occurrence like: corrosion, cracking, deformation, abrasion, material fatigue, elec-
trical short, etc. Each failure mode can cause a further failure mode in another element. It
is strongly recommended to execute the failure analysis by an interdisciplinary team of
experts. The complexity and importance of the procedure require a lot of experience in
different fields (e. g. engineering, technology, operations, maintenance, etc.).
The 5-Why-Method:
This method is an analytical tool, which can be easily applied to get the root cause of a
problem. In asking “why?” five times, the root cause of a problem should be discovered. It
goes beyond the scope of this work to discuss advantages and disadvantages of this me-
thod.
Other tools to determine root causes:
Fishbone diagrams, logic trees, brain storming, etc.
3.2.3 Risk evaluation
The risk evaluation process should also be done by the team of experts mentioned before
and is answering the following questions:

Theoretical Basics and Tools
3-23
• How probable is the detection of a failure with consideration of the current actions
for prevention and detection?
• How severe or serious is a failure for safety, health, environment, process, plant,
product, etc.?
• How is the likelihood or frequency of the occurrence of a failure?
To gain appraisable information out of the answers to these questions, a risk priority num-
ber (RPN) will be calculated. Each of the three questions results in a certain amount of
“risk points”. The RPN will be calculated by multiplying the three single assessments for
each failure mode relating to each element and/or sub-element. (Denkena, 2009) (Crow,
2002)
RPN = Detection (D) * Severity (S) * Occurrence (O)
The figures D, S and O reach from 1 to 10 or even higher, depending on the amount and
details of the data available and experiential knowledge. If the estimation of the probabili-
ties is just vague, the evaluation scheme should also be chosen roughly. (Denkena, 2009)
For this work, the evaluation scheme (risk criteria) established at Mondi Ruzomberok is
used. Modifications were just done on terms and abbreviations. See table 3-4. A higher
RPN indicates more critical failure modes. But one should consider that severity is the
most decisive factor in assessing risk. So it is possible to have failures with equal RPN,
but one of them has a higher severity, and also failures with low RPN compared with the
others but with higher severity. These effects will be considered by using criticality as the
product of severity and occurrence. (www.fmea-fmeca.com)
Criticality = S * O
Some analyses found in literature are purely based on criticality. (Souza & Álvares, 2008)
(Latino, 1996). A risk evaluation or criticality analysis should be done on a regular basis
(for example once a year) by a project group or at least after changes in equipment or
maintenance strategies.

Theoretical Basics and Tools
3-24
FAILURE IMPLIES A RISK TO SAFETY, HEALTH AND ENVIRONMENT (SHE)
Significant: Significant impact on SHE (injury, illness, destruction, etc.) Yes
Insignificant: Impact on person or environment is insignificant. No
FAILURE IMPLIES A RISK TO PRODUCT QUALITY
Exists: Status of the equipment failure has considerable influence on quality of production process and products. Menace of customer loss. Yes
Does not exist: Quality of production process is not endangered. Insignificant influence on quality in case of element or sub-element or whole unit function failure.
No
Maintenance:
PROBABILITY OF FAILURE OCCURANCE – O POINT ASSESSMENT
Small: It is not probable that failure occurs. The failure would be exceptional. The element and/or sub-element works only temporary. Dynamics of the plant is small.
1
Medium: Occasionally, the failure of minor meaning could occur. Based on experience, failure occurrence could be expected. In the past, failure has already existed. The element and/or sub-element is not used to full capacity, but the operation is dynamic.
2
Big: It is almost sure that failure will occur. Very often repeating failures. Very high exploitation in element and/or sub-element operation. Very dynamic influence.
3
SEVERITY OF FAILURE – S POINT ASSESSMENT
Insignificant: Failure has no influence on production process, will not limit the production. Alter-nate (redundant) equipment is existing, parallel production.
1
Medium: Failure will limit production process. 4
Serious: Loss of element and/or sub-element function will stop or interrupt production process. Big production losses.
6
PROBABILITY OF FAILURE DETECTION – D
POINT ASSESSMENT
Big: Detection of failure and its reason is probable, can be identified easily. Result and demon-stration of failure are obvious.
1
Medium: Detection of failure or its reason is difficult. 2
Small: Detection of failure or its reason is impossible or very unlikely. Result is not visible imme-diately.
3
COSTS CAUSED BY REPAIR AFTER FAILURE
POINT ASSESSMENT
Negligible: Failure simply removable. Quick exchange of the element and/or sub-element. Costs for failure remove will not exceed 30% of the element and/or sub-element price. Quickly available spare parts. Time and costs for repair are not significant.
1
Considerable: Failure hardly and slowly removable. The costs will exceed more than 30% of the price of a new element and/or sub-element, high value equipment value. Long delivery time for spare parts. Big labour consumption for repair.
2
Table 3-4: RPN criteria, (Mondi) modified by author

Theoretical Basics and Tools
3-25
The scheme shown in table 3 enables the assessment of risk. This information is now
summarized in the RPN and can be easily exploited. The flow chart for determining the
criticality classes is shown in figure 3-4.
Influence on
SHE
Influence on
quality
RPN = S * O * D
Failure
modes,
causes and
effects
Risk criteria for S,
O and D
Class
assignment
Costs
Criticality
A
Criticality
B
Criticality
C
Yes
No
Yes
No
6 to 54 1 to 2
3 to 42
1
Figure 3-4: Process for determining criticality classes, (Mondi) modified by author
Criticality classes for each failure related to a certain element (equipment, etc.) and/or
sub-element (device, component, etc.) are the result of the analysis and have a big impact
on defining the right maintenance strategies.

Theoretical Basics and Tools
3-26
3.2.4 Follow-up and optimization
The follow-up and optimization phase includes all actions to utilize the risk analysis results
for improvement actions. Based on criticality classes, strategic maintenance actions can
be taken. It is important to understand that neither the RPN and criticality nor the criticality
class have an exclusive influence on the maintenance strategies or further decisions in
treating the equipment. Life cycle costs, maintainability, recommendations of the original
equipment manufacturer (OEM), etc. will also be considered.
Pareto analysis:
A Pareto analysis can support the evaluation and help to define the right strategy. The
Pareto analysis can be done according to RPN, criticalities and/or criticality classes, and
identifies which failure cause presents the greatest risk to the system. (Mayfield)
3.3 Strategy development
3.3.1 Maintenance strategy based on severity and occurrence
It is possible to use the criticality matrix again to define the right maintenance strategy for
the objects which were analyzed by FMEA. The most occurring failure mode and its se-
verity will be opposed in the same portfolio matrix as mentioned in chapter 3.1.2. This
helps to select rough directions for maintenance activities.
Criticality A: Principle of risk mitiga-
tion
Attention by maintenance above OEM recommendation.
Frequent maintenance
Criticality B: Principle of expenditure
minimization.
Attention by maintenance meets OEM recommendation.
ALARP (as low as reasonable practicable - via periodical and
condition based maintenance). Regular maintenance
Criticality C: Principle of close to zero
expenditure
Attention by maintenance can be below OEM recommen-
dation, but be aware of guarantee requirements. RTF (run
to failure). Intermittent maintenance
Table 3-5: Maintenance strategies based on criticality matrix, (Herold, 2009) modified by
author

Theoretical Basics and Tools
3-27
3.3.2 Maintenance strategy based on criticality and detection
The maintenance strategy portfolio enables the user to develop a concrete maintenance
strategy by opposing criticality and detection.
Planned maintenance
Unplanned maintenance
Criticality
Detection
(D)
High (not tolerable) 9 - 12 Medium (tolerable) 4 – 8 Small (insignificant) 1 - 3
High (pre-
dictable) 1
Preventive actions; Consi-
dering age and lifecycle;
Inspections
Preventive or event driven
actions, depending on:
effort, costs, break down
scenario, etc.
Run to failure; Event dri-
ven actions; Avoiding ac-
cumulation; Stock keep-
ing, Ability to deliver
Medium
(noticable) 2
Preventive actions; Condi-
tion monitoring; Inspec-
tions
Preventive or event driven
actions, depending on:
effort, costs, break down
scenario, etc.
Run to failure; Event dri-
ven actions; Avoiding ac-
cumulation; Stock keep-
ing, Ability to deliver
Small (not
predictable)
3
Preventive actions; In-
spections; Redundancy;
Protection and safeguard-
ing
Preventive or event driven
actions, depending on:
effort, costs, break down
scenario, etc.
Run to failure; Event dri-
ven actions; Avoiding ac-
cumulation; Stock keep-
ing, Ability to deliver
Table 3-6: Maintenance strategy portfolio, (Biedermann & Schröder, Risikoorientierte
Strategien in der Instandhaltung, 2007) modified by author
3.3.3 Maintenance strategy based on RPN and detection
The rubric “criticality” and its scores are replaced by RPN in the strategy portfolio of chap-
ter 3.3.2.

Criticality analysis of wood yard equipment at MSY
4-28
4 Criticality analysis of wood yard equipment at
Mondi Syktyvkar
It is intended by Mondi Syktyvkar to start a detailed maintenance pre-engineering project
for wood yard, evaporation plant and recovery boiler by external assistance. This work is
not in the scope of the project. Its purpose is to provide a guideline for doing a criticality
analysis on mill level without support of external consultants. The following analysis has
just an exemplary character, and has already been carried out, when the maintenance
pre-engineering project started. The wood yard was chosen as an example because of its
clearly laid out equipment structure.
4.1 Plant and process overview
4.1.1 Process description
Generally, the wood yard consists of
• Wood room (debarking drum, chipper, bark handling)
• Chip storage (stacker, piles)
• Chip handling (reclaimer, conveyors)
• Chip screening (gyratory screen, etc.)
The wood yard represents the link between forest and pulp production. Operating condi-
tions and methods at the wood yard have an enormous impact (chip quality) on pulp pro-
duction (cooking conditions, yield, etc.). The process can be divided in nine steps. The
following description is mainly based on the documentation of Andritz OY, Finland and
FMW Industrieanlagenbau GmbH, Austria, and is just slightly modified by the author.
1. Wood receiving
Wood is delivered by trucks to the wood room area of the pulp mill. Two similar lines for
debarking and chipping are installed, one for softwood (spruce, pine) and one for hard-
wood (birch, aspen). The logs are unloaded from the trucks by mobile cranes directly onto
the loading section of the deicing conveyor. Logs are unloaded to the wood storage only
when the wood room is not in operation or for intermediate storage to compensate sea-
sonal fluctuation in wood supply.

Criticality analysis of wood yard equipment at MSY
4-29
2. Deicing
Freezing of logs increases the bond strength between wood and bark, therefore deicing is
necessary before the debarking process. Log bundles are carried to the debarking drum
by infeed, which consists of a deicing conveyor section. The conveyor is equipped with
adjustable conveying speed to regulate the feeding capacity. Warm water is sprayed on
the logs to melt remained ice and snow. Water temperature is adjusted by adding the right
amount of steam into the deicing water. Spray nozzles are located under the conveyor
cover. Retention time of wood in the deicing chamber can be 15 to 30 seconds. At the end
of the conveyor, the log bundles are disintegrated and sand is removed by washing.
3. Debarking
Bark is not suitable for pulp production and further on for paper making. It has a high con-
tent of ash, its particles can break easily and it can be hardly bleached. This results in
dark spots in the paper. Sand and stones are also often brought in by bark and can harm
mechanical equipment like chipper knives. Therefore, bark is removed by dry tumbling
debarking in a debarking drum. The logs are moved through the rotating drum and be-
come debarked by rubbing against each other. The bark goes through the outlet slots of
the drum to the bark handling equipment. Frequency converters allow a variable rotational
speed of 3 to 7 rounds per minute (rpm) of the drum. A double drive system on two rolled
steel support rings, supported by steel wheels, is driven by a girth gear. A hydraulically
operated diagonal gate and the feeding capacity of the drum are controlling the retention
time of the logs. The bark chutes are furnished with overhead shrouds and rubber sealing
against the drum shell. One of the two debarking drums is working 100% with hardwood,
whereas the other drum is just working one third of its production time with hardwood.
Thus the second drum is running as a batch-process (1/3 HW, 2/3 SW).
4. Bark handling
Bark and waste coming out of the outlet slots of the debarking drum are collected by bark
chutes and fed onto the bark belt conveyor under the drum. Loose bark from deicing and
washing section is collected with water flumes and led through underground channels via
screw pump to the dewatering conveyor. From the dewatering conveyor, the dewatered
bark and waste are discharged onto the bark belt conveyor under the drum and mixed
with the bark from the drum.

Criticality analysis of wood yard equipment at MSY
4-30
5. Chipping
Chip dimension, especially the thickness of the chips have a significant impact on the
process and the result of pulping. Penetration in the pulping process depends on the spe-
cific surface of the wood chips. Water, heat and chemicals should be able to penetrate
uniformly into the material. Disintegration during cooking is forced by diffusion. The longer
the way for lignin to diffuse out of the chip, the longer the cooking time and the higher the
risk of re-condensation (“black cooking”). To meet all the preconditions for good pulping
results, an optimum chip size for softwood is approximately 25 mm of length and 4 mm of
thickness, and 20 mm of length and 3 mm of thickness for hardwood. (FAPET, Wood
handling, 2007) After debarking, the logs are transported by a chain conveyor to a roller
case where they get washed by four high-pressure showers. The logs are also passing
two stone traps, wherein the first one is connected to the stone conveyor that automatical-
ly empties the stone trap. Logs from the roller conveyors are fed via a belt conveyor
equipped with a metal detector for protecting the chipper against ferrous material to the
chain conveyor for chipper feeding. Detected logs are lifted out of the line with an over-
head crane of knuckle boom loader. To enable a smooth log flow to the chipper, the chain
conveyor is equipped with a spreading section. The chipper is of horizontal feed type, em-
ploys a multi-motor drive and has a side discharge directly to an equalizing bin mounted
beside the chipper. The capacity depends on the log flow to the chipper and on the diame-
ter of the logs. The chip level in the equalizing bin is controlled by a level indicator, based
on capacitive function. There is a disc brake mounted on the chipper shaft for braking
down the chipper for knife change and also a turning device for rotating the disk to the
next position. The casing of the chipper is furnished with a hydraulically operated large
access opening for maintenance and knife change. From the surge bin, the chips are dis-
charged by a metering screw feeder at a constant output rate to chip conveying lines to
feed them onto the storage piles.
6. Stacking
Chips received from two chipper dischargers are directed via the screw conveyor and re-
ceiving conveyors to the selected pile (to the softwood pile or to the hardwood pile).
Stacker feeding conveyors transports the chips to the stackers and the piles. The piles
(softwood pile and hardwood pile) are equipped with two identical stacker systems. The
pile stacker is of rotary cantilevered design with a 360° rotation capability in order to build
up a circular pile. The stacker is equipped with a travelling stacker conveyor. Stacking will
be continuously controlled to build up the pile to the maximum level. As a safety feature
for strong wind, the stacker is equipped with an anemometer with the following function.

Criticality analysis of wood yard equipment at MSY
4-31
Stop of pile feed conveyors and the stacker is automatically turned into an optimal position
towards the wind when the wind is above 80 km/h (adjustable 50 ... 80 km/h).
7. Reclaiming
The piles (softwood pile and hardwood pile) are equipped with two identical reclaimer sys-
tems. Reclaiming of pile will be maintained by the automatic reclaimer system. The pile
reclaimer is of rotary design with a 360° rotation capability in order to reclaim the chips on
the basis of the first-in, first-out method with a 100% active volume rate. The reclaimer
main frame is supported by the central wheel arrangement at the centre of the pile and by
the drive / wheel arrangement at the circumference of the pile. A multi-supported reclaim
screw travelling with the main frame is constantly moving the chips along the pile slab to
the central hopper of the pile. A rake moving along the main frame ensures a constant
flow of chip from the pile slope to the reclaim screw. The central hopper is level controlled
and equipped with a multi screw discharger, which meters the reclaimed chips onto the
chip reclaim conveyor. A lump breaker at the multi screw discharger breaks down the fro-
zen lumps, which can arrive occasionally. Each of the chip reclaim conveyors (for hard-
wood chips and for softwood chips) transports the chips to the hardwood and softwood
screening. The chip reclaim conveyor is equipped with a belt scale and magnet separator.
8. Screening
Hardwood screening:
Chips received from the pile reclaiming system are distributed by a distribution screw con-
veyor onto a chip screen. A two way chute in front of the distribution screw is responsible
for the bypass of the screens, if necessary. The chip screen separates the chips into three
fractions. The accept fraction is transferred by accept conveyors to the transfer point. Se-
parated fines are transferred via a fines conveyor to the existing fines and bark handling
system. Separated overs are sent via reversible oversize conveyors to the re-chipper,
which blows the chips to the screen for re-screening or to the existing fines and bark han-
dling system. After screening, the accept fraction is moved to the cooking plant by a con-
veying system.
Softwood screening:
In principle the softwood screening system is equal to the hardwood screening.
9. Sawmill chip handling
Saw mill chips are unloaded from self-unloading trucks and dumped directly into a receiv-
ing hopper. The receiving hopper is covered with a safety grate and equipped with a multi

Criticality analysis of wood yard equipment at MSY
4-32
screw discharger. This discharger meters the chips to a disc screen (scalper screen) via a
transfer conveyor in order to eliminate occasionally transported large impurities. The
transfer conveyor is equipped with a magnet separator for ferromagnetic separation, a
metal detector and a two way chute for non-ferromagnetic separation and a belt scale.
Beyond the disc screen, the purchased chips are fed to the softwood pile.
4.1.2 Plant layout
Figure 4-1 illustrates the process flow in principle, without any details, and is based on
layout drawings, flow sheets and P&I-drawings from Andritz OY, Finland and FMW Indu-
strieanlagenbau GmbH, Austria. Bark handling and bark pressing, stone and waste han-
dling, water piping, etc. are not displayed. More detailed drawings can be found in the
appendix.

Criticality analysis of wood yard equipment at MSY
4-33
Figure 4-1: Principle flow sheet of the wood yard

Criticality analysis of wood yard equipment at MSY
4-34
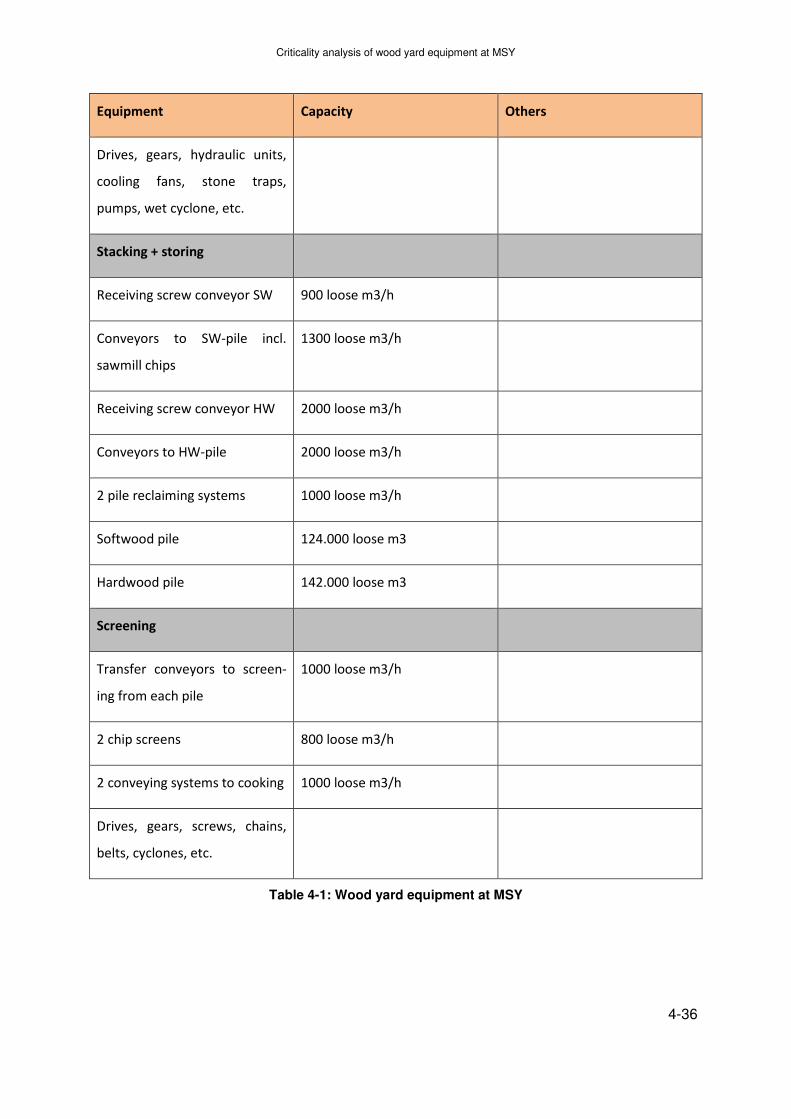
4.1.3 Equipment
The wood yard at MSY consists of two debarking and chipping lines, one for hardwood and
one for softwood. Two different storage piles (hardwood and softwood) are needed as well.
Each pile has its own reclaiming system and the chips are moved to two screens. It is possi-
ble to bypass the screens in case of a break down. A connection to the existing wood yard is
not designed.

Criticality analysis of wood yard equipment at MSY
4-35
Equipment Capacity Others
Deicing + debarking
2 feeding-deicing conveyors 415 solid m3/h SW, 300 solid
m3/h HW
2 debarking drum 415 solid m3/h SW, 300 solid
m3/h HW
Diameter 5,5 m; length 42 m
2 drum discharge conveyors 360 solid m3/h
Chipping
2 chipper feeding conveyors 360 solid m3/h
2 horizontal feed chippers 360 m3/h Disc diameter 3,8 m; 18 knives,
electrical performance 4x315
kW, spout width 1010 mm
(max. log diameter)
2 chip equalizing bins 32 m3
2 screw conveyors 1200 loose m3/h
2 dewatering conveyors
2 belt conveyors with magnet
separator
1 central lubrication unit for
debarking and chipping
Bark handling
2 bark shredders 135 loose m3/h
2 bark presses 100 loose m3/h
Criticality analysis of wood yard equipment at MSY
4-36
Equipment Capacity Others
Drives, gears, hydraulic units,
cooling fans, stone traps,
pumps, wet cyclone, etc.
Stacking + storing
Receiving screw conveyor SW 900 loose m3/h
Conveyors to SW-pile incl.
sawmill chips
1300 loose m3/h
Receiving screw conveyor HW 2000 loose m3/h
Conveyors to HW-pile 2000 loose m3/h
2 pile reclaiming systems 1000 loose m3/h
Softwood pile 124.000 loose m3
Hardwood pile 142.000 loose m3
Screening
Transfer conveyors to screen-
ing from each pile
1000 loose m3/h
2 chip screens 800 loose m3/h
2 conveying systems to cooking 1000 loose m3/h
Drives, gears, screws, chains,
belts, cyclones, etc.
Table 4-1: Wood yard equipment at MSY

Criticality analysis of wood yard equipment at MSY
4-37
4.1.4 Plant profile
The following profile gives a brief overview of the situation and condition of the plant. It helps
to characterize the plant without going into detail.
Plant/ equipment profile
Determinate Score
Complexity High Middle Low
Sensitivity to failures High Middle Low
Interlinking internal High Middle Low
Interlinking external High Middle Low
Break down costs Always high Depending on du-
ration of break-
down
Low
Key equipment Yes No
Role of operation staff Supervision Active control
Drive of technological deve-
lopment
High Middle Low
Level of load High Middle Low
Risk potential High Middle Low
Maintenance knowledge of
operation staff
High Middle Low
Methodological knowledge of
maintenance staff
High Middle Low
Table 4-2: Plant profile
The wood yard is a key equipment at the pulp mill. Its main functions are:
• making chips out of pulp wood (logs) and
• storing the chips to ensure a continuous production flow
In general all machines and devices at the wood yard are robust and solid in their constructi-
on. The internal and external interlinked equipment structures are reasons for paying suffi-
cient attention by maintenance.
4.2 Experiences at other mills
The experiences at other mills in operating and maintaining wood yard equipment are some
of the inputs to define key equipment (most important equipment) at the wood yard. The un-
derlying questionnaire was focusing on maintenance in general and on maintenance at wood
yard, evaporation plant and recovery boiler in particular. It was sent to the mills in Frant-
schach, Ruzomberok and Poels. A personal visit at these mills to directly discuss the topics

Criticality analysis of wood yard equipment at MSY
4-38
was following. Just the information regarding wood yard was used for this work. Evaporation
plant and recovery boiler are out of scope, and just important for Mondi Syktyvkar in general.
The questionnaire can be found in the appendix. The results and reports of the mill visits and
the survey are property of Mondi Group and will be not displayed within the current work.
Just data related to wood yard maintenance are included.
4.2.1 Mondi Frantschach
Frantschach is located in the southern part of Austria. The mill specializes in packaging and
kraft paper. Therefore the integrated pulp production needs long fiber pulp (soft wood) only.
Wood demand 1.100.000 solid m3/a Softwood
Market pulp 55.000 t/a Unbleached
Packaging paper 230.000 t/a 60 – 125 g/m2
Kraft paper 21.000 t/a 30 – 140 g/m2
Table 4-3: Key figures of Mondi Frantschach
A new wood yard was started up in 2007. This replacement investment was necessary be-
cause of cost reduction, quality improvement, production increase, and improvement of the
environmental situation (e. g. surface water, noise emissions, etc.).

Criticality analysis of wood yard equipment at MSY
4-39
Equipment Capacity Others
Log loading section 290 solid m3/h
Debarking drum 290 solid m3/h Diameter 5,5 m; length 32 m
Chipper 250 solid m3 (without bark)/h Disc diameter 3,3 m, electrical
performance 4x400 kW, max.
log diameter 850 mm
3 storage silos 27.000 solid m3
Silo reclaimer 50 – 250 m3/h Screw dimensions: diameter
1,1 m, length 18 m
Sawmill chip take over 1000 m3/h 12 truck loads per hour; 12
railway containers per hour
Round pile 30.000 solid m3
Pile reclaimer 90 – 350 m3/h Screw dimension: diameter 1
m, length 53 m
Screen Thickness screen: disc distance
7 mm, Fine screen: disc dis-
tance 0,7 mm
Table 4-4: Wood yard equipment Frantschach
There are several differences to the wood yard at MSY. Mondi Frantschach (MFR) is just
using one line without a deicing conveyor. Also the capacities are much lower than at MSY.
The technical principles are predominantly the same and notable differences in possible fail-
ure modes cannot be found. From this point of few, a comparison of the two wood yards is
allowed. Preventive and predictive activities are well developed at Mondi Frantschach. The
total amount of measurement points for condition monitoring has increased from 5769 (in
2001) to 11541 (in 2006). There are 79 different monitoring routes in the mill.

Criticality analysis of wood yard equipment at MSY
Figure 4-2: Ranking of process areas at MFR by inspection points
Visual and audio checks, condition monitoring (thermovision, infrared, vibration measur
ment) and lubrication actions are summarized in the amount of inspection points. The
amount of electronic aided condition monitoring points is 70 for the whole wood yard.
handling, chip handling and screening are
and predictive activities.
Figure 4-3: Ranking of equipment at MFR by inspection points
Conveyors are mainly rotating devices with a big amount of bea
tion and lubrication effort is very high in
050
100150200250300350400450
Process area ranking by inspection points
Criticality analysis of wood yard equipment at MSY
: Ranking of process areas at MFR by inspection points
and audio checks, condition monitoring (thermovision, infrared, vibration measur
ment) and lubrication actions are summarized in the amount of inspection points. The
amount of electronic aided condition monitoring points is 70 for the whole wood yard.
handling, chip handling and screening are those areas with the highest effort on preventive
: Ranking of equipment at MFR by inspection points
rotating devices with a big amount of bearing. Therefore
ation effort is very high in these areas.
Process area ranking by inspection points
4-40
: Ranking of process areas at MFR by inspection points
and audio checks, condition monitoring (thermovision, infrared, vibration measure-
ment) and lubrication actions are summarized in the amount of inspection points. The
amount of electronic aided condition monitoring points is 70 for the whole wood yard. Bark
areas with the highest effort on preventive
: Ranking of equipment at MFR by inspection points
herefore, the inspec-
Process area ranking by inspection points

Criticality analysis of wood yard equipment at MSY
4-41
Figure 4-4: Ranking of process areas by frequency of lubrication
Most of the devices in the debarking area are treated by a central lubrication unit, gears and
bearings for conveyors in the chipping area as well. The labyrinth bearing of the chipper has
to be lubricated by hand on a daily basis.
Figure 4-5: Lubricated items per area at MFR
Most items that need to be lubricated are in the chip handling areas, which consist mainly of
belt conveyors, screw conveyors, etc. These rotating devices themselves are consisting of a
big amount of bearings. Also the pile reclaimer and the silo reclaimer are part of the chip
handling areas. Chips are moved to the screening by these devices. Thus they can be de-
fined as key equipment.
0
500
1000
1500
2000
2500
3000
Area ranking by frequency of lubrication
020406080
100120140160180200
Number of lubricated items per process
area

Criticality analysis of wood yard equipment at MSY
4-42
Figure 4-6: Ranking of devices by inspection points at MFR
Gears and drives are the most inspected devices in the process, together with belt con-
veyors. This is not surprising, since these devices also represent the highest amount of rota-
tional equipment at a wood yard.
4.2.2 Zellstoff Poels
Zellstoff Poels is located in Austria and is the largest manufacturer of elemental chlorine free
(ECF) bleached softwood sulfate pulp in Central and South East Europe. (Pöls, 2007)
Wood demand 2.000.000 solid m3/a Softwood
Market pulp production 400.000 t/a
Kraft paper 14.000 t/a 40 – 140 g/m2
Table 4-5: Key figures Zellstoff Poels
Zellstoff Poels has a KPI-controlled maintenance concept, with a strong focus on planning,
condition monitoring, and root cause analysis. Total Productive Maintenance (TPM) prin-
ciples are partly in use. The operators at the wood yard (49 employees) are doing the ma-
chine care (e. g. recommended service) and the inspection work (including all vehicles). The
maintenance department is just called for repair work. 7% of the total maintenance costs can
be allocated to wood yard maintenance. It must be considered that maintenance costs are
not the same as repair costs. Repair costs are expenses just for repair and replacement
work, and are one part of the maintenance costs.
0
100
200
300
400
500
600
700
800
900
Gears Belt conveyors Drives Misc Chipper
Device ranking by inspection points

Criticality analysis of wood yard equipment at MSY
4-43
Figure 4-7: Ranking of equipment by the number of repairs at Zellstoff Poels (1999 – 2009)
Conveyors, most of whom are in the chip handling area, have a lot of wear parts which have
to be changed at certain times. Drives and gears have caused most of the repair work at the
chipper.
Figure 4-8: Ranking of equipment by repair costs at Zellstoff Poels (1999 – 2009)
The high costs at the debarking drum are due to the replacement of the first drum section in
2005.
0
2
4
6
8
10
12
14
16
Conveyors Chipping Debarking
drum
Long log
feeder
Short log
feeder
Reclaiming Chain
conveyor
Equipment ranking by number of repairs
> 10.000 EUR
€ 0
€ 500.000
€ 1.000.000
€ 1.500.000
€ 2.000.000
€ 2.500.000
Debarking
drum
Conveyors Chipping Long log
feeder
Short log
feeder
Reclaiming Chain
conveyor
Equipment ranking by repair costs

Criticality analysis of wood yard equipment at MSY
Figure 4-9: Ranking of devices by repair frequency at Zellstof
There are a lot of wear parts at
almost clear to have high repair costs at these devices and items.
Figure 4-10: Ranking of
Zellstoff Poels defines the chip conveyors (after the screen) to the cooking plant as key
equipment. In case of failures at the
plants to ensure an undisturbed cooking process.
0123456789
Device ranking by number of repairs >
Criticality analysis of wood yard equipment at MSY
: Ranking of devices by repair frequency at Zellstoff Poels (1999
wear parts at conveyors that have to be replaced at certain times
almost clear to have high repair costs at these devices and items.
of devices by repair frequency at Zellstoff Poels (1999
Zellstoff Poels defines the chip conveyors (after the screen) to the cooking plant as key
equipment. In case of failures at these conveyors, there is too little buffer
ensure an undisturbed cooking process.
Device ranking by number of repairs >
10.000 EUR
4-44
(1999 – 2009)
replaced at certain times. Thus it is
devices by repair frequency at Zellstoff Poels (1999-2009)
Zellstoff Poels defines the chip conveyors (after the screen) to the cooking plant as key
buffer time between the
Device ranking by number of repairs >

Criticality analysis of wood yard equipment at MSY
4-45
4.2.3 Mondi Ruzomberok
Mondi Ruzomberok (MRU) is located in Slovakia. The wood demand can be split into 88%
hardwood (HW) and 12% softwood (SW). Most of the wood is delivered by trucks.
Wood demand 2.000.000 solid m3/a Softwood, Hardwood
Pulp production 450.000 t/a
Wood free printing paper and
cardboards
40.000 t/a 100 – 300 g/m2
Wood free printing paper 140.000 t/a 60 – 100 g/m2
Wood free office paper 330.000 t/a 70 – 90 g/m2
Table 4-6: Key figures Mondi Ruzomberok
The mill is using a well developed maintenance concept, which is the result of different
projects to optimize and simplify the maintenance organization. Each business unit (wood
yard, recovery line, etc.) has its own maintenance department with full responsibility (direc-
tives, costs), which gets support from a central maintenance department in diagnostics, spe-
cial repair (welding) and covering higher demand on personnel. Central maintenance is also
responsible for planning and scheduling the regular shut downs. Wood yard maintenance
department: 1 maintenance department manager, 4 blue collar people (2 electrical, 2 me-
chanical), but only in the morning shift.

Criticality analysis of wood yard equipment at MSY
4-46
Equipment Capacity Others
Feeding section 340 solid m3/h
Debarking drum 340 solid m3/h Diameter 5,3 m; length 39 m
Bark crusher 250 loose m3/h
Chipper 340 solid m3/h SW, 280 m3/h
HW
Disc diameter 3,3 m, max. log
diameter 700 mm
Stacker HW 1.500 loose m3/h
Round pile HW 170.000 loose m3
Reclaimer HW 730 loose m3/h
Stacker SW 1.500 loose m3/h
Round pile (so) 58.000 loose m3
Reclaimer SW 730 loose m3/h
Belt conveyor to screening 730 loose m3/h
Screen 730 loose m3/h Surface 3 x 26 m2
Thickness screen 400 loose m3/h
Silo (between screening and
cooking)
500 loose m3 Buffer time approximately 30
min
Belt conveyor to cooking 1200 loose m3/h
Table 4-7: Wood yard equipment Ruzomberok
If one of the equipment (e. g. conveyor, debarking drum, chipper, ...) in front of the chip
screening is broken, there are chips for 11 days (on average) on the pile to feed the pulp
production. Mondi Ruzomberok is defining the chip screening as critical to be a bottleneck.
The buffer time between chip screen and cooking plant is about 30 minutes. The old chip

Criticality analysis of wood yard equipment at MSY
4-47
screen is available to bypass the new screen if it is broken, but then the process has to run
with lower capacity. A break down with impact on the pulp production occurs one to two
times a year. One to two times a day, the chip screen has to be cleaned. This work takes
approximately 20 minutes. The chipper itself is very sensible to loadings of hardwood logs
with bigger diameters. The higher weight of these logs is pressing on the disk under vibra-
tions. Thus the knife encounters the counter blade, which can result in damages on bearings.
The required repair work takes 12 hours with 6 people. This happens once a year. Approxi-
mately 70% of the maintenance hours at the wood yard are from preventive maintenance
activities. A criticality analysis detected the equipment shown in the following table as most
critical.
Equipment Device
Log feeding conveyor
Debarking drum Drives
Bark crusher
Chipper Chains inside of chipper discs
Hydraulic unit of chipper
Belt conveyor to cooking plant
Table 4-8: Critical wood yard equipment at MRU
One of the reasons of high criticality is the long delivery time for spare parts, which can be
more than one month for some items. In the past, the debarking drum had the highest repair
costs because of cracks in the shell of the drum, but in summer 2009 the drum was replaced.
4.2.4 Most important process areas
It was not possible to get directly comparable data from the mills. Their maintenance report-
ing systems and data evaluation by the controlling department are different. To figure out the
areas to which maintenance pays the most attention (inspection, lubrication, repairs), ranking
results from other mills were used and a weighting systems of the areas was applied. The
lower the position in rankings, which means more efforts by maintenance, the higher the
weighting of the area (place 1 = 5, place 2 = 4, place 3 = 3, place 4 = 2, place 5 = 1). The

Criticality analysis of wood yard equipment at MSY
4-48
weighting points are summarized by each area. The percentage of weighting points an area
has achieved from the whole sum of weighting points, is now defining the “importance” of the
area.
Process step
(area)
MFR
Insp.
MFR
Lubr.
MFR lubr.
Items
ZP nr. of
rep.
ZP rep.
costs
MR
U
Weigthing
sum
Ran-
king %
Debarking 3 5 3 3 5 3 19 17
Stacking + storing 3 3 3 5 4 0 18 16
Chipping 2 4 3 4 3 3 16 14
Transportation to
cooking 3 2 2 5 4 3 16 14
Reclaiming 4 3 5 2 0 0 14 13
Screening 4 1 4 0 1 0 10 9
Log feeding + dei-
cing 0 3 1 3 2 3 9 8
Bark handling 5 3 1 0 0 3 9 8
Sum 111 100
Table 4-9: Attention by maintenance on process areas – “importance”, in Frantschach, Poels
and Ruzomberok
The most important areas of these three mills (Frantschach, Poels, Ruzomberok) from the
maintenance point of few are debarking, stacking + storing, chipping and transportation to
cooking.

Criticality analysis of wood yard equipment at MSY
4-49
Figure 4-11: Attention by maintenance on process areas – “importance”, in Frantschach, Poels
and Ruzomberok
4.2.5 Most important equipment
With data available, it was not very easy to determine the “importance” of equipment and/ or
devices. In general, there is a big amount of (belt) conveyors with gears and drives at the
wood yard, so these equipments are obviously very often treated by maintenance.
Debarking
17%
Stacking +
storing
16%
Chipping
15%Transportation
to cooking
14%
Reclaiming
13%
Screening
9%
Log feeding +
deicing
8%
Bark handling
8%
Attention to process areas by
maintenance
(Frantschach, Poels, Ruzomberok)

Criticality analysis of wood yard equipment at MSY
4-50
Figure 4-12: Attention by maintenance on equipment – “importance”, Frantschach, Poels
The number of belt conveyors in the stacking area and the transportation to the cooking area
is very high. So this result fits to the importance of process areas. The same applies to the
chipping area.
A mill in Fernandina Beach (United States) has developed 83 condition monitoring routes for
its wood yard and pays its attention to each area as follows: log system 19%, bark system
7%, chip system 20% and screening 53%. (Brown, 2004) This example and the results iden-
tified by the author show that there is no univocal strategy in setting priorities in maintenance
on the wood yard.
4.3 Preselection of critical equipment
It was assumed by Mondi Syktyvkar that the production is running on full capacity and that
the process is stable: Continuous loading of logs on the feeding conveyor, full piles and con-
tinuous chip demand of the cooking plant. Several (layout) drawings and design information
used in this work are property of the Mondi Group. Any kind of use, copy or distribution is
forbidden.
Belt conveyors
38%
Debarking
drum
12%
Chipper
29%
Gears + drives
21%
Attention to equipment/ devices by
maintenance (Frantschach, Poels)

Criticality analysis of wood yard equipment at MSY
4-51
4.3.1 Risk assessment by Turnbull
Process step
(area)
Potential failure
mode
Potential effect of
failure
Im-
pact
Likeli-
hood
Motivation for
evaluation
Risk
factor
Log feeding +
deicing
Chain conveyor
doesn´t work
No logs to debark-
ing drum
D W Robust construc-
tion, no complex
parts, easy to re-
pair, simple availa-
ble spare parts
3
Debarking Debarking drum
doesn’t work
No logs to chipper C W Robust construc-
tion, high repair
effort, eventual
weak spare part
availability
4
Drum discharge
conveyor
doesn’t work
No logs to chipper C W 4
Bark handling Bark conveyors
don’t work
No bark removed
from debarking
drum
D W No heavy loads, no
complex parts, easy
to repair, simple
available spare
parts
3
Shredder
doesn’t work
Bark is not crushed E W No heavy loads, no
complex parts, easy
to repair, simple
available spare
parts, bark will be
still removed from
the wood room -
process is not dis-
turbed
2
Bark press
doesn’t work
Bark ist not pres-
sed
E W No heavy loads, no
complex parts, easy
to repair, simple
available spare
parts, bark will be
still removed from
the wood room -
process is not dis-
turbed
2
Chipping Feeding con-
veyor doesn’t
work
No logs to chipper D W High repair effort,
enough buffer ca-
pacity (chips for
min 10 days on
pile) after chipper
4

Criticality analysis of wood yard equipment at MSY
4-52
Process step
(area)
Potential failure
mode
Potential effect of
failure
Im-
pact
Likeli-
hood
Motivation for
evaluation
Risk
factor
Chipper doesn’t
work
No chips produ-
ced
C W Heavy loads, high
repair effort, even-
tual weak spare
part availability,
enough buffer ca-
pacity (chips for
min 10 days on
pile) after chipper
5
Screw conveyor
doesn’t work
No chips to pile D W No heavy loads,
robust construction
3
Belt conveyor
doesn’t work
No chips to pile D W No heavy loads,
simple construction
3
Central lubrica-
tion unit doesn’t
work
Bearings are not
lubricated
E W Chipper has to be
stopped in certain
intervals (approx.
once per shift) for
knife change, dur-
ing this time bear-
ings can be lubri-
cated by hand
2
Stacking +
storing
Stacker feeding
conveyor
doesn’t work
No chips to pile D W No heavy loads, no
complex parts,
simple spare parts
3
Pile stacker
doesn’t work
No chips to pile D W No heavy loads 3
Stacker conveyor
doesn’t work
No chips to pile D W No heavy loads 3
Reclaiming Reclaimer
doesn’t work
No chips to screen C W No heavy loads, a
lot of drives, rotat-
ing and electric
equipment
4
Screw discharger
doesn’t work
No chips to screen C W No heavy loads, a
lot of drives, rotat-
ing and electric
equipment
4
Screening Transfer con-
veyor does’t
work
No chips to screen D W No heavy loads, no
complex parts, easy
to repair, simple
available spare
parts
3
Two-way chute
doesn’t work
Bypassing the
screen is not poss-
ible
E W No complex parts,
no heavy loads, not
so frequently in use
2

Criticality analysis of wood yard equipment at MSY
4-53
Process step
(area)
Potential failure
mode
Potential effect of
failure
Im-
pact
Likeli-
hood
Motivation for
evaluation
Risk
factor
Screen doesn’t
work
Chip size not ideal C W A lot of rotating
and oscillating
parts, possibility to
bypass the screen
4
Transportati-
on to cooking
Belt conveyors
don’t work
No chips to coo-
king
C W No heavy loads,
easy to repair, sim-
ple available spare
parts, bottleneck
4
Legend: A=1 month breakdown, B=1 week, C=1 day, D=Reportable, E=Minor, V=>10 years,
W=Annual, X=Monthly, Y=Weekly, Z=Daily
Table 4-10: Risk assessment of process areas by Turnbull
The process steps that can be defined as most critical are debarking, chipping, reclaiming
and transportation to cooking. There is little difference in the risk value between these areas,
and none of them requires high interest by maintenance.

Criticality analysis of wood yard equipment at MSY
4-54
4.3.2 Risk assessment by risk portfolio
Process step (area) Potential effect of breakdown Consequence Probability Explanation
Log feeding + deicing No logs to debarking drum 2,5 2 Less repair
effort. During
standard
production
situation
enough chips
on pile.
Debarking No logs to chipper 2,5 3 Could be high
repair effort.
Complex
parts (e. g.
drives for
debarking
drum). Du-
ring standard
situation
enough chips
on pile.
Bark handling No bark removed from de-
barking drum
3 1,5 No complex
parts. Easy to
repair. Dur-
ing standard
situation
enough chips
on pile. Inter-
ruption of
process pos-
sible.
Chipping No chips produced 3 3,5 Heavy loads.
Could be high
repair effort.
During stan-
dard situa-
tion enough
chips on pile.
Stacking + storing No chips to pile 3 2 A lot of rotat-
ing equip-
ment. Big
stack height.
High loads
because of
wind and
snow.

Criticality analysis of wood yard equipment at MSY
4-55
Process step (area) Potential effect of breakdown Consequence Probability Explanation
Reclaiming No chips to screen 5 3,4 Could be high
repair effort.
A lot of
drives, rotat-
ing and elec-
tric equip-
ment
Screening Worse chip quality 4 2 Could be high
repair effort.
A lot of rotat-
ing and oscil-
lating parts.
Negative
impact on
chip quality.
Possible im-
pact on cook-
ing process.
Can be by-
passed.
Transportation to cooking No chips to cooking 5 3 Less repair
effort. Can
stop the
whole pulp
production.
Table 4-11: Criticality evaluation for risk portfolio
The results of the risk evaluation process are transferred to the risk portfolio or criticality ma-
trix.

Criticality analysis of wood yard equipment at MSY
4-56
Figure 4-13: Criticality matrix
Now it was possible to identify those process areas with the highest priority for maintenance.
Reclaiming and transportation to cooking are most crucial. If the plant is operating under sta-
ble design conditions, there are enough chips on pile so that the pile can fulfill its buffer func-
tion.
Design data:
HW-pile storage capacity: 142.000 loose m3
Reclaimer: 613 loose m3/h, 24 h operating time
Resulting buffer time: approximately 9,5 days
Maintenance has almost 10 days to repair and fix the break down or failure in front of the
piles, without any remarkable influence on the pulp production.
0
1
2
3
4
5
0 1 2 3 4 5
Fa
ilu
re p
rob
ab
ilit
y
Failure consequence
Risk portfolio (criticality matrix)
Log feeding + deicing
Debarking
Bark handling
Chipping
Stacking + storing
Reclaiming
Screening
Transportation to cooking

Criticality analysis of wood yard equipment at MSY
4-57
The decision was made to concentrate on those areas by FMEA. As these areas are in-
stalled twice (one for SW, on for HW) in nearly the same structure, it is enough to do detailed
analysis just for the HW-line.
4.4 FMEA (example): Pile reclaiming system
The following FMEA is just an example of how to use this analysis tool. In general a FMEA is
a detailed part of criticality analysis. It should be carried out by a team of experts in opera-
tion, maintenance, technology, construction, etc. It was planned to initiate a workshop with
experienced people at Mondi Syktyvkar. Because of time reasons and lack of personnel re-
sources it was not possible to do the FMEA together with a team. So the following FMEA
was done by the author without assistance. Nevertheless teamwork is strongly recommend-
ed.
4.4.1 Operating conditions
Working time: 350 days per year, 24 h per day, 8.400 hours per year
Temperature: -36 °C to +35 °C
4.4.2 Constituent parts
• Reclaimer: To reclaim the chips from the pile and move them to the hopper in the
center of the pile into the discharge screw. It is assembled with a rake which is con-
stantly moving along the pile to scrape off the chips. The chips trickle to the screw
shaft which moves them to the hopper.
• Electrical equipment for reclaimer
• Screw discharger: To transport the chips out of the hopper to the reclaim conveyor.
• Lump breaker: Is situated above the outlet of the screw discharger. It breaks down
frozen lumps of chips.
• Reclaim conveyor: To transport the chips from the screw conveyor to the transfer
conveyor.
• Belt scale: To measure the amount of chips reclaimed from the pile.
• Magnet separator: Is situated above the drive drum of the transfer conveyor. It sepa-
rates magnetic materials from the chips.
• Transfer conveyors: To transport the chips to the two-way-chute in front of the screen.

Criticality analysis of wood yard equipment at MSY
4-58
Figure 4-14: Pile stacking and reclaiming system (FMW)
4.4.3 Functional structure
A functional structure and detailed drawings of the reclaiming system can be found in the
appendix and on the enclosed CD-ROM.
4.4.4 Analysis table
Failure analysis and risk evaluation are done according to the established scheme in table 3-
4 and figure 3-5. Strategies are developed according to table 3-5 and table 3-6.

Criticality analysis of wood yard equipment at MSY
4-59
Table 4-12: FMEA sheet for pile reclaimer

Criticality analysis of wood yard equipment at MSY
4-60
The drive unit for the reclaimer screw shaft is marked as criticality “A”. The device requires
more attention by maintenance than it is recommended by the OEM. Regular preventive ac-
tivities and inspections should be done. The condition of the device should be recorded in the
CMMS.
The FMEA-table above is also available as an Excel-File on the CD-ROM enclosed.

Conclusions and recommendations
5-61
5 Conclusions and recommendations
5.1.1 Lessons from other mills
Mondi Frantschach has well developed inspection and lubrication plans and routes. The mill
has a strong focus on condition monitoring. A criticality analysis was still not done at the
Frantschach mill. Maybe this is the reason for the big effort in lubricating the bark handling
area, which is not crucial for the process. Obviously there is no reason for this big preventive
effort in an area which can be treated partly with a run-to-failure strategy (criticality matrix:
transition zone green to yellow).
Mondi Ruzomberok has a well functioning maintenance organization and also applied a criti-
cality analysis for the whole mill. The results of this analysis at the wood yard are not con-
gruent with the results of the analysis for Mondi Syktyvkar. If the bark crusher is an equip-
ment of highest priority for maintenance, one should think about a re-design to lower the in-
fluence on the production flow by a break down in this area.
If the piles are full, a breakdown of equipment in front of the piles does not influence the pro-
duction for at least one week. This should be enough time for a maintenance organization to
solve the problem, also from a spare part point of view. An empty pile will result in too little
time for decomposition of resin during storing. In case of kraft pulping, this impact should be
negligible.
At Zellstoff Poels, a criticality analysis of the mill equipment was done, an equipment struc-
ture was determined and a detailed breakdown and repair reporting is in use. A big issue for
the mill in Poels is the planning and scheduling of maintenance activities.
Potentials:
• Definition of an equipment structure and integration in the CMMS
• Development of a reporting procedure (required data, forms, etc.) and integration in
the CMMS
• CA for the whole mill equipment to concentrate on the right equipment with adequate
effort
• Strengthen planning and scheduling and utilize the CMMS for these tasks
5.1.2 Lessons from criticality analysis
If the piles are full, which is the case during standard operation, just the equipment after the
pile can be critical. The pile reclaiming system is a key element of the process and is abso-

Conclusions and recommendations
5-62
lutely necessary to move the chips from the storage to the chip screen. The chip screen itself
can be bypassed in case of a break down. This will ensure a continuous flow to the cooking
plant, but will also have a negative impact on the cooking process. A high content of overs
can result in incomplete digested wood material, whereas a high content of fines can plug the
digester. The next critical aggregate are the conveyors after screening, which transport the
chips to the cooking plant. It is recommended to apply a FMEA to the full conveying system
to the cooking plant. It should involve the items 1000-1350-27-155, -156, -157 and 1000-
1350-27-165, -166, -167.So it is not necessary to put high effort in maintaining devices in
front of the piles; it is sufficient to follow the OEM recommendations. After the guarantee pe-
riod is over, it is also possible to stay below these recommendations for the feeding and deic-
ing conveyor and the bark handling area. Debarking drums and chippers are of significance
for the chip quality and should always be treated as recommended by the OEM.
The Turnbull approach is unsuitable for an equipment related risk or criticality evaluation. It is
too little to measure the criticality just by likelihood and time based effects. The dimension of
the analysis has to be extended to cover all the parameters which can have critical effects:
SHE, availability, speed and quality. One can also go further and try to develop a risk evalua-
tion model by a holistic approach, which is considering all stakeholders.
Until today, no one has noticed maintainability and serviceability as single parameters with
influence on criticality. Improved maintainability optimizes inspection and repair effort and will
help to reduce fixing time. It would be a big advantage for equipment manufacturer and user
to dispose of an assessment model for maintainability and serviceability and its impact on
criticality. There is a possibility for future research.
Potentials:
• Identification of key equipment
• Optimization of maintenance effort and strategy development
• Consideration of SHE, availability, speed and quality
• Consideration of maintainability
• Identification of improvement potentials on plant layout and equipment design

Conclusions and recommendations
5-63
5.1.3 Lessons from FMEA
Severity is the parameter with the biggest impact on criticality. To weaken the severity, which
means lowering the severity rating, big efforts in redesign and reconstruction are needed. For
maintenance it is not easily possible to lower the severity. The convenient way of taking in-
fluence on criticality by maintenance is by the parameter of occurrence and detection. This
leads directly to preventive and predictive maintenance. The success of these actions set by
maintenance must be checked by a review of the FMEA or at least of the risk evaluation part.
I propose to extend the FMEA to evaluate the responsibilities for the failure mode and its
prevention and detection. Competencies between operations and maintenance must be
clear. It will not make sense to hand over the full responsibility for each failure to the main-
tenance department. A helpful question can be: Who can prevent, detect or correct the fail-
ure in the most (cost-) efficient way?
To realize and implement a FMEA, it is absolutely necessary to have a team with experience
in maintenance and operation of the equipment. By using this equipment knowledge and
brainstorming techniques, the yield of possible failure modes will be much higher than by
doing it as a single person. The team approach will also avoid subjective assumptions during
the risk evaluation.
Potentials:
• Risk based strategy development
• Review and measurement of results
• Determination of competencies and responsibilities
• Assignment of tasks
• Teamwork between operations, maintenance, technology, etc.
• Detailed investigation of spare part availability and estimation of fixing times
5.1.4 Lessons for maintenance management
In the course of this work it was possible to get an overview of several maintenance organi-
zations. Obviously, maintenance is seen as a “necessary evil” by corporate management and
by operations. Maintenance needs to entitle itself a key partner for the operational depart-
ment to fulfill its tasks. If the corporate goal can be simplified as “making profit by satisfying
the customer”, the mission statement of the maintenance organization should be “enable the

Conclusions and recommendations
5-64
operational department to produce satisfying products (pulp and/ or paper)”. Operations and
maintenance should define themselves as partners. Maintenance should supply equipment
reliability, whereas operations should supply process reliability. Maintenance costs are re-
lated to how the equipment is used, so the responsibility for these expenses is at the opera-
tions department. Optimizing maintenance costs means providing equipment reliability and
asset preservation in the most cost-effective way. This implies also a lifecycle oriented main-
tenance strategy development, a detailed reporting system and a high amount of planned
work. The latter two will also help to improve safety during maintenance activities.
Potentials:
• Maintenance mission statement based on corporate goals
• Operations and maintenance as a partnership
• Operations (e. g. business unit) responsible for maintenance costs
• Lifecycle orientation in strategy development and budgeting
• Detailed breakdown and repair reports (conditions, loads, detection, historical data,
drawings, manuals, evaluation, causes, repair, etc.)
• Increase of planning degree
5.1.5 Future project ideas
Standards for maintenance manuals:
A review of the maintenance manuals delivered by the OEM during this work displayed some
weak points in structure and content. For big industrial projects and also for the OEM, a well
developed standard for maintenance manuals would help to save time in commissioning,
operating and maintaining complex pants and equipment.
Plant knowhow center:
Operations personnel, technologists and maintenance personnel are collecting information
and experiences about processes and plant equipment separately. It would generate big ad-
vantages for operating and maintaining existing equipment and also for future investment
projects, if each of these partners would share their knowledge by creating “plant knowhow
centers”: regular meetings, CMMS support, etc.

Conclusions and recommendations
5-65
Criticality database:
The results of each criticality analysis at each mill or site should be stored in a central data-
base. It would be an ease for reliability engineers to evaluate or estimate criticality factors for
certain equipment or devices.
Methodology training:
The maintenance staff is often not familiar with maintenance terms and their implication on
the daily work. It is recommendable to develop a knowledge and mindset training concept for
the maintenance staff as well as for the corporate management.
Chipper knife lifetime and conditions of logs:
A detailed analysis of the lifetime of a chipper knife according to the water content of logs
(fresh wood, dry wood) and its effect on wood yard maintenance and wood room availability
can be done. The results of this investigation should be considered in a new CA of the wood
yard.
Influences of low temperatures on operations and maintenance:
The mill is operating during winter for approximately 6 months, whereof 2 months have very
low temperatures. It should be observed and recorded in which way the conditions during
winter time are influencing the equipment and the process. This information should be consi-
dered by maintenance engineering.
Training for “extended” condition monitoring by operations staff:
The operators should be trained to use the data and information delivered by the DCS (dis-
tributed control system) as references to the current condition of equipment and devices.

Appendix I
6-66
6 Appendix I
6.1 Bibliography
Andritz AG. (2007). www.andritz.com. Retrieved July 30, 2009, from
http://reports.andritz.com/2007/de/index/business-areas/ba-pp/ba-pp-business-
development/ba-pp-metsea-botnia.htm
Biedermann, H. (2007). Anlagenwirtschaft. Leoben: Department Wirtschaft- und
Betriebswissenschaft, Montanuniversität Leoben.
Biedermann, H., & Schröder, W. (2007). Risikoorientierte Strategien in der Instandhaltung.
Leoben: Department Wirtschafts- und Betriebswissenschaften, Montanuniversität Leoben.
Bitsch, F., Canver, E., & Moik, A. (1999, December). Strukturierte Erstellung von
Sicherheitsspezifikationen in UML mit Hilfe der FMEA-Methode. FORMS-Workshop .
Braunschweig.
Brown, M. (2004). www.paperindustrymaintenance.com. Abgerufen am 26. May 2009 von
Maintenance knowhow in the global pulp and paper industry, Atlanta:
http://www.paperindustrymaintenance.com/operation-inspection-reliability.htm
Cowley, M. (2006). www.cemaintenancesolutions.com. Retrieved September 1, 2009, from
CE Maintenance solutions: http://www.cemaintenancesolutions.com/pdf/scorecards.pdf
Crow, K. (2002). www.npd-solutions.com. Retrieved September 1, 2009, from New product
development solutions: http://www.npd-solutions.com/fmea.html
Denkena, B. (2009). Qualitätsmanagement. Hannover: Institute of Production Engineering
and Machine Tools, University Hannover.
Dufresne, P. (kein Datum). www.reliabilityweb.com. Abgerufen am 30. July 2009 von
Reliability web - A culture of reliability:
http://www.reliabilityweb.com/index.php/articles/when_does_it_pay_to_use_reliability_center
ed_maintenance/
FAPET. (1998). Papermaking Science and Technology, Concepts of maintenance in the pulp
and paper industry. Finnish Paper Engineer´s Association.

Appendix I
6-67
FAPET. (1998). Papermaking Science and Technology, Wood handling. Finnish Paper
Engineer´s Association.
FOEX Indexes Ltd. (n.d.). www.foex.fi. Retrieved July 28, 2009, from FOEX Indexes Ltd:
http://www.foex.fi/pix.asp
Herold, M. (2009). Technisches Risikomanagement. TÜV Süd Industrie Service GmbH.
Hykin, C. (2003). Operator Driven Reliability - Who owns your mill´s equipment? Retrieved
July 31, 2009, from http://www.paperindustrymaintenance.com/pprm2003/paper2.htm
Idcon Inc. (2006, October). www.idcon.com. Retrieved July 29, 2009, from Idcon Inc
Maintenance management consultants: http://www.idcon.com/reliability-tips-610.html
Idhammar, C. (2000, October). Operations + Maintenance = Production. Pulp & Paper .
Idhammar, C. (2001, April). Operations + Maintenance = Production. Pulp & Paper .
Jabar, H. B. (2003). Plant Maintenance Strategy: Key for Enhancing Profitability. Retrieved
July 29, 2009, from www.maintenanceresources.com:
http://www.maintenanceresources.com/referencelibrary/ezine/chemclean.htm
Jonsson, H. (2005). Condition Monitoring at Norske Skogn Mill. Pulp and Paper Reliability &
Maintenance Conference and Exhibit, (p. 11). Atlanta.
Kmenta, S., Fitch, P., & Ishii, K. (1999). Advanced Failure Modes and Effects Analysis of
Complex Processes. ASME Design Engineering Technical Conferences , (p. 9). Las Vegas.
Latino, K. C. (1996). Failure Modes and Effects Analysis: A Modified Approach. Retrieved
August 13, 2009, from www.maintenanceresources.com:
http://www.maintenanceresources.com/referencelibrary/failureanalysis/failuremodes.htm
Matyas, K. (2002, Nr. 18). Ganzheitliche Optimierung durch individuelle
Instandhaltungsstrategie. Industrie Management , pp. 13-16.
Mayfield, P. (n.d.). www.sigmazone.com. Retrieved August 13, 2009, from Six Sigma:
http://www.sigmazone.com/gondola_lift_fmea.htm
Metso Paper Inc. (2008). 2008 Production Survey Woodfree Paper Machines. Helsinki.
Mondi AG former Neusiedler AG. (2004). Turnbull Risk Assessment.
Mondi. (n.d.). Instruction and criteria for assignment of the nodes criticality classes.
Ruzomberok.
Moubray, J. (1997). Reliability-Centered Maintenance. Industrial Press.

Appendix I
6-68
NASA, L. R. (n.d.). www.fmeainfocentre.com. Retrieved September 1, 2009, from FMEA
Infocentre: http://www.fmeainfocentre.com/presentations.htm
Ouvreloeil, T. (2004, May). Hidden Capacity and Overall Equipment Effectiveness. Retrieved
August 06, 2009, from www.tappi.org:
http://www.tappi.org/s_tappi/sec_publications.asp?CID=4637&DID=512403
Pöls. (2007). Annual Report 2007. Zellstoff Pöls AG.
PricewaterhouseCoopers LLP. (2009). Global Forest, Paper & Packaging Industry Survey.
Rasch, A. A. (2000). Erfolgspotential Instandhaltung. Erich Schmidt Verlag.
Smith, R., & Hawkins, B. (2004). Lean Maintenance: Reduce Costs, Improve Quality, and
Increase Market Share . Butterworth-Heinemann .
Souza, R. d., & Álvares, A. J. (2008). FMEA and FTA Analysis for Application of the
Reliability-Centered Maintenance Methodology: Case Study on Hydraulic Turbines. ABCM
Symposium Series in Mechatronics Vol. 3 , 10.
Steele, S. (2006, April). Stragegic Approach Earns By-In for Reliability Based Maintenance.
Pulp & Paper , pp. 44-47.
Stengl, B., & Ematinger, R. (2001). SAP R/3 Plant Maintenance: Making it work for your
business. Addison-Wesley Professional.
Strohmeier, G. (2006). Komplexitätsbewältigung in der Instandhaltung durch ein
ganzheitliches und wissensbasiertes Risikomanagement. ÖVIA-Kongress,
Komplexitätsorientiertes Anlagenmanagement - Methoden, Konzepte und Lösungen für
Produktion und Instandhaltung, (p. 26). Semmering.
Velthoven, M. v. (2009, September 22). SKF Presentation of Service Concept. Syktyvkar.
Weber, A. (2005, November). Key Performance Indicators: Measuring and Managing the
Maintenance Function. Retrieved May 13, 2009, from www.plant-maintenance.com:
www.plant-maintenance.com/articles/KPIs.pdf
www.fmea-fmeca.com. (n.d.). Retrieved September 3, 2009, from FMEA and FMECA
Information: http://www.fmea-fmeca.com/fmea-rpn.html
Zellcheming. (21. April 2005). Production Indices for Paper Production.
Appendix I
6-69
6.2 List of tables
Table 2-1: OEE-factors and major losses ......................................................................... 2-14
Table 3-1: Turnbull Risk Assessment Matrix (Mondi AG former Neusiedler AG, 2004) ..... 3-17
Table 3-2: Rating criteria for failure consequence ............................................................. 3-18
Table 3-3: Rating criteria for failure probability ................................................................. 3-19
Table 3-4: RPN criteria, (Mondi) modified by author ......................................................... 3-24
Table 3-5: Maintenance strategies based on criticality matrix, (Herold, 2009) modified by
author ............................................................................................................................... 3-26
Table 3-6: Maintenance strategy portfolio, (Biedermann & Schröder, Risikoorientierte
Strategien in der Instandhaltung, 2007) modified by author .............................................. 3-27
Table 4-1: Wood yard equipment at MSY ......................................................................... 4-36
Table 4-2: Plant profile .................................................................................................... 4-37
Table 4-3: Key figures of Mondi Frantschach ................................................................... 4-38
Table 4-4: Wood yard equipment Frantschach ................................................................. 4-39
Table 4-5: Key figures Zellstoff Poels ............................................................................... 4-42
Table 4-6: Key figures Mondi Ruzomberok ....................................................................... 4-45
Table 4-7: Wood yard equipment Ruzomberok................................................................. 4-46
Table 4-8: Critical wood yard equipment at MRU .............................................................. 4-47
Table 4-9: Attention by maintenance on process areas – “importance”, in Frantschach, Poels
and Ruzomberok .............................................................................................................. 4-48
Table 4-10: Risk assessment of process areas by Turnbull .............................................. 4-53
Table 4-11: Criticality evaluation for risk portfolio .............................................................. 4-55
Table 4-12: FMEA sheet for pile reclaimer ........................................................................ 4-59
6.3 List of figures
Figure 2-1: Maintenance strategies .................................................................................... 2-5
Figure 2-2: Maintenance organizations ............................................................................... 2-7

Appendix I
6-70
Figure 2-3: Maintenance management process .................................................................. 2-9
Figure 2-4: Maintenance function and activities .................................................................. 2-9
Figure 2-5: Influence of operations and maintenance on production ................................. 2-15
Figure 3-1: Risk portfolio, criticality matrix ........................................................................ 3-17
Figure 3-2: FMEA procedure ............................................................................................ 3-20
Figure 3-3: Principle scheme of failure structure ............................................................... 3-22
Figure 3-4: Process for determining criticality classes, (Mondi) modified by author .......... 3-25
Figure 4-1: Principle flow sheet of the wood yard ............................................................. 4-33
Figure 4-2: Ranking of process areas at MFR by inspection points .................................. 4-40
Figure 4-3: Ranking of equipment at MFR by inspection points ........................................ 4-40
Figure 4-4: Ranking of process areas by frequency of lubrication ..................................... 4-41
Figure 4-5: Lubricated items per area at MFR .................................................................. 4-41
Figure 4-6: Ranking of devices by inspection points at MFR ............................................. 4-42
Figure 4-7: Ranking of equipment by the number of repairs at Zellstoff Poels (1999 – 2009) 4-
43
Figure 4-8: Ranking of equipment by repair costs at Zellstoff Poels (1999 – 2009) ........... 4-43
Figure 4-9: Ranking of devices by repair frequency at Zellstoff Poels (1999 – 2009) ........ 4-44
Figure 4-10: Ranking of devices by repair frequency at Zellstoff Poels (1999-2009) ......... 4-44
Figure 4-11: Attention by maintenance on process areas – “importance”, in Frantschach,
Poels and Ruzomberok .................................................................................................... 4-49
Figure 4-12: Attention by maintenance on equipment – “importance”, Frantschach, Poels 4-50
Figure 4-13: Criticality matrix ............................................................................................ 4-56
Figure 4-14: Pile stacking and reclaiming system (FMW) ................................................. 4-58

Appendix I
6-71
6.4 Abbreviations
a Anno, year
CA Criticality analysis
CBM Condition based maintenance
CMMS Computerized maintenance management
system
CTMP Chemo thermo mechanical pulp
D Detection
DCS Distributed control system
EBDIT Earnings before depreciation, interest and
tax
EUR Euro (currency)
FAPET Finish American paper engineer’s text-
book
FMEA Failure mode and effects analysis
FTA Failure tree analysis
H Hours
HW Hardwood
KPI Key performance indicator
m2 Square meter
m3 cubic meter
MFR Mondi Frantschach
Min Minutes

Appendix I
6-72
MPL Mean production loss
MRU Mondi Ruzomberok
MSY Mondi Syktyvkar
MTBPL Mean time between production loss
MW Megawatt
NASA National aeronautics and space adminis-
tration
NBSK Non bleached softwood kraft pulp
O Occurrence
OEE Overall equipment effectiveness
OEM Original equipment manufacturer
OPE Overall plant efficiency
RCFA Root cause and failure analysis
RCM Reliability centered maintenance
ROA Return on assets
ROCE Return on capital employed
RPN Risk priority number
RTF Run to failure
S Severity
S Seconds
SHE Safety, health and evironment
SW Softwood

Appendix I
7-73
T Tons
TPM Total productive maintenance
UFP Uncoated fine paper
USD United States Dollar (currency)
ZP Zellstoff Poels

Appendix II
7-74
7 Appendix II
7.1 Questionnaire
Maintenance Benchmarking Questionnaire
1 General mill overview
1.1 Paper grades
1.2 Wood demand
1.3 Pulp production output
1.4 Pulp internal usage
1.5 Pulp external sold
1.6 Saleable paper output
1.7 Total number of employees
1.8 Energy generation
1.9 Energy consumption
1.10 Geographic location (e. g. industrial environment, …)
2 Maintenance overview
2.1 How is the structure of the maintenance organization?
2.2 Which general maintenance concept (central, local, preventive, outsourcing, …) is in
use?
2.3 Since when is this concept working?
2.4 Was there another (additional) reason than cost reduction to change the maintenance
concept? (e. g. rebuilds, plant or equipment modifications, …)
2.5 If there was a technical or equipment based change, what was the reason in detail?
2.6 Why was the former maintenance concept no longer feasible?
2.7 Which CMMS is in use?
2.8 What applications of the CMMS are in constant use?
2.9 Which interfaces with other departments (e. g. procurement, spare part management,
controlling, …) are considered in the CMMS?

Appendix II
7-75
2.10 Which KPI are measured in maintenance?
2.11 According to the specific KPI: How are they composed/ measured/ calculated and
why?
2.12 According to the specific KPI: Why are they measured and in which way are they uti-
lized?
2.13 Are periodically maintenance meetings taking place?
2.14 Who is attending these meetings?
2.15 What are the topics which are discussed regularly?
2.16 What are often occurring topics related to certain problems?
2.17 What is the total number of employees in maintenance?
2.18 How does the splitting of the maintenance personnel in terms of skills and function
work?
2.19 How does the splitting of the maintenance personnel in terms of work area function
(mechanical, electrical, automation, …)?
2.20 Will the operating and maintenance personnel get premiums for achieving certain KPI
goals?
2.21 What is the legal situation according to working time? (e. g. 12 hour shift, 4 days on, 4
days off, labor unions, …)
2.22 What are the maintenance department operating costs? (notice: outsourcing!)
2.23 In the case of outsourcing: Who is the outsourcing partner?
2.24 In the case of outsourcing: Which maintenance activities are executed by the external
partner?
2.25 In the case of outsourcing: How many external people are working on site?
2.26 In the case of outsourcing: Is the outsourcing partner controlling its maintenance func-
tion for itself?
2.27 In the case of outsourcing: In which way is the outsourcing partner integrated in the
maintenance organization (e. g. flow of information, reporting, meetings, evaluation …)?
3 Work identification
3.1 Is there a work request process (request – validation – approval - ready to be
planned) applied?

Appendix II
7-76
3.2 Which KPI are available in this issue?
3.3 Is the KPI “Amount of available man hours for proactive work on whole available man
hours (proactive + corrective)” in use?
4 Work planning and scheduling
4.1 Which KPI are available in this issue?
4.2 Is the amount of planned and scheduled work on total effort hours in maintenance
known?
5 Work execution
5.1 Which KPI are available in this issue?
5.2 Is the quality of the executed work reviewed?
6 Diagnostic (Predictive/ condition based maintenance)
6.1 How are the diagnostic activities integrated in the maintenance function?
6.2 Is there a schedule for certain diagnostic activities in specific mill areas?
6.3 In the case of outsourcing: Who is the outsourcing partner?
6.4 In the case of outsourcing: Which diagnostic activities are executed by the external
partner?
6.5 In the case of outsourcing: According to which schedule are these activities ex-
ecuted?
6.6 In case of outsourcing: What was the main reason for outsourcing diagnostic work?
6.7 Which diagnostic equipment is available?
6.8 Which diagnostic equipment is in constant use?
6.9 Which diagnostic equipment is just rarely used and why?
6.10 Which diagnostic equipment would be useful, but isn’t available at the moment?
6.11 What is the working schedule (shift plan, plant areas, …) of the department?
6.12 What is the number of employees in this department?
6.13 How often do they get trainings in new equipment and technology?
7 Wood yard maintenance

Appendix II
7-77
7.1 What are the current key data/ design data of the wood yard? (e. g. capacities, pile
storage volume, …)
7.2 How many operating people are necessary at the wood yard?
7.3 What is the maximum sustainable rate?
7.4 Are there some special reasons (operating modes, …) for the characteristics of the
sustainable production level curve?
7.5 How many days are they performing the maximum production?
7.6 If the stability profile is poor, what are the main reasons (large amount of downtime,
large variations in production rate) for this trend?
7.7 What are the main reasons for downtime?
7.8 What are the main reasons for the variations in the production rate?
7.9 What do you define as key equipment (conveyors, debarking drums, chipper,
screens, …) at the wood yard?
7.10 According to key equipment: What are the current key data/ design data? (e. g. sup-
plier, capacities, feed rate, …)
7.11 What is the technical layout of the wood yard?
7.12 How long is the buffer time between wood yard and cooking plant?
7.13 Is there a working schedule for certain equipment?
7.14 What equipment could be a bottleneck and in which cases?
7.15 Were a Failure Modes and Effects Analysis (FMEA) carried out for the plant area or
certain equipment? (If yes, pleas provide this information.)
7.16 Which equipment can be defined as “critical” according to failure frequency and fail-
ure consequence?
7.17 According to the specific equipment: What are the most common failures?
7.18 According to the specific equipment: How often does a certain failure occur?
7.19 According to the specific equipment: Which consequences (effects) are triggered off
by a certain failure and how are they valuated?
7.20 According to the specific equipment: How long is the downtime because of a certain
failure?

Appendix II
7-78
7.21 According to the specific equipment: What are the reasons for the frequent break-
downs?
7.22 According to the specific equipment: Which parts or elements (motors, bearings,
chains, …) are responsible for the breakdowns?
7.23 According to the specific equipment: Which actions were taken by the operators relat-
ing to certain failures?
7.24 According to the specific equipment and a certain failure: Which actions (preventive,
reactive, …) were taken by the maintenance department relating to certain failures?
7.25 According to the specific equipment: What maintenance recommendations were giv-
en by the supplier relating to certain failures?
7.26 According to the specific equipment: What are the downtime costs?
7.27 According to the specific equipment: What is the percentage of reactive maintenance
hours?
7.28 According to the specific equipment: What is the ration between unplanned to
planned shutdowns?
7.29 According to the specific equipment: Is external help (e. g. supplier, specialists, …)
needed in certain cases (certain failures) and which cases are those?
7.30 What is the percentage of work orders (relating to the wood yard) assigned to outside
companies (external labor, contracted service)?
7.31 What maintenance KPI related to the wood yard are available?
7.32 In which way are they utilized?
7.33 Which improvements in wood yard maintenance were initiated because of certain KPI
results?
7.34 In which way (organizational) is the wood yard considered by maintenance?
7.35 How many maintenance people (split: mechanical, electrical, automation) are re-
quired at the wood yard during normal operations?
7.36 How many maintenance people (split: mechanical, electrical, automation) are re-
quired during the annual shutdown?
7.37 What is the working schedule of maintenance personnel in this area?

Appendix II
7-79
7.38 What is the daily work process (starting time, meetings, other tasks, …) for mainten-
ance personnel (engineers, supervisors, blue collar workers, …) in this area?
7.39 Pictures of critical equipment and/ or parts?
8 Evaporation plant maintenance
8.1 What are the current key data/ design data of the evaporation plant (e. g. liquor flow
rate, dry solids content, …)?
8.2 How many operating people are necessary at the evaporation plant?
8.3 What is the maximum sustainable rate?
8.4 Are there some special reasons (operating modes, …) for the appearance (characte-
ristics) of the sustainable production level curve?
8.5 How many days are they performing the maximum production?
8.6 If the stability profile is poor, what are the main reasons (large amount of downtime,
large variations in production rate) for this trend?
8.7 What are the main reasons for downtime?
8.8 What are the main reasons for the variations in the production rate?
8.9 What do you define as key equipment (heat exchanger, pumps, …) at the evapora-
tion plant?
8.10 According to key equipment: What are the current key data/ design data (e. g. suppli-
er, capacities, feed rate, …)?
8.11 What is the technical layout of the evaporation plant?
8.12 How long is the buffer time between pulp washing and evaporation plant?
8.13 How long is the buffer time between evaporation plant and recovery boiler?
8.14 Is there a working schedule for certain equipment?
8.15 What equipment could be a bottleneck and in which cases?
8.16 Were a Failure Modes and Effects Analysis (FMEA) carried out for the plant area or
certain equipment? (If yes, pleas provide this information.)
8.17 Which equipment can be defined as “critical” according to failure frequency and fail-
ure consequence?
8.18 According to the specific equipment: What are the most common failures?

Appendix II
7-80
8.19 According to the specific equipment: How often does a certain failure occur?
8.20 According to the specific equipment: Which consequences (effects) are triggered off
by a certain failure and how are they valuated?
8.21 According to the specific equipment: How long is the downtime because of a certain
failure?
8.22 According to the specific equipment: What are the reasons for the frequent break-
downs?
8.23 According to the specific equipment: Which parts or elements (motors, bearings,
valves, …) are responsible for the breakdowns?
8.24 According to the specific equipment: Which actions were taken by the operators relat-
ing to certain failures?
8.25 According to the specific equipment: Which actions (preventive, reactive, …) were
taken by the maintenance department relating to certain failures?
8.26 According to the specific equipment: What maintenance recommendations were giv-
en by the supplier relating to certain failures?
8.27 According to the specific equipment: What are the downtime costs?
8.28 According to the specific equipment: What is the percentage of reactive maintenance
hours?
8.29 According to the specific equipment: What is the ration between unplanned to
planned shutdowns?
8.30 According to the specific equipment: Is external help (e. g. supplier, specialists, …)
needed in certain cases (certain failures) and which cases are those?
8.31 What is the percentage of work orders (relating to the evaporation plant) assigned to
outside companies (external labor, contracted service)?
8.32 Which maintenance KPI related to the evaporation plant are available?
8.33 In which way are they utilized?
8.34 Which improvements in evaporation plant maintenance were initiated because of cer-
tain KPI results?
8.35 In which way (organizational) is the evaporation plant considered by maintenance?

Appendix II
7-81
8.36 How many maintenance people (split: mechanical, electrical, automation) are re-
quired at the evaporation plant during normal operation?
8.37 How many maintenance people (split: mechanical, electrical, automation) are re-
quired during the annual shutdown?
8.38 What is the working schedule of maintenance personnel in this area?
8.39 What is the daily work process (starting time, meetings, other tasks, …) for mainten-
ance personnel (engineers, supervisors, blue collar workers, …) in this area?
8.40 Pictures of critical equipment and/ or parts?
9 Recovery boiler maintenance
9.1 What are the current key data/ design data of the recovery boiler (e. g. pressure, liq-
uor capacity, dry solid content, …)?
9.2 How many operating people are necessary for the recovery boiler?
9.3 What is the maximum sustainable rate?
9.4 Are there some special reasons (operating modes, …) for the appearance (characte-
ristics) of the sustainable production level curve?
9.5 How many days are they performing the maximum production?
9.6 If the stability profile is poor, what are the main reasons (large amount of downtime,
large variations in production rate) for this trend?
9.7 What are the main reasons for downtime?
9.8 What are the main reasons for the variations in the production rate?
9.9 What do you define as key equipment (boiler banks, steam drum, superheaters, …)
at the recovery boiler?
9.10 According to key equipment: What are the current key data/ design data? (e. g. sup-
plier, capacities, feed rate, …)
9.11 What is the technical layout of the recovery boiler?
9.12 How long is the buffer time between recovery boiler and recaustizising?
9.13 Is there a working schedule for certain equipment?
9.14 What equipment could be a bottleneck and in which cases?

Appendix II
7-82
9.15 Were a Failure Modes and Effects Analysis (FMEA) carried out for the plant area or
certain equipment? (If yes, pleas provide this information.)
9.16 Which equipment can be defined as “critical” according to failure frequency and fail-
ure consequence?
9.17 According to the specific equipment: What are the most common failures?
9.18 According to the specific equipment: How often does a certain failure occur?
9.19 According to the specific equipment: Which consequences (effects) are triggered off
by a certain failure and how are they valuated?
9.20 According to the specific equipment: How long is the downtime because of the certain
failure?
9.21 According to the specific equipment: What are the reasons for the frequent break-
downs?
9.22 According to the specific equipment: Which parts or elements (pumps, valves, …) are
responsible for the breakdowns?
9.23 According to the specific equipment: Which actions were taken by the operators relat-
ing to certain failures?
9.24 According to the specific equipment: Which actions (preventive, reactive, …) were
taken by the maintenance department relating to certain failures?
9.25 According to the specific equipment: What maintenance recommendations were giv-
en by the supplier relating to certain failures?
9.26 According to the specific equipment: What are the downtime costs?
9.27 According to the specific equipment: What is the percentage of reactive maintenance
hours?
9.28 According to the specific equipment: What is the ration between unplanned to
planned shutdowns?
9.29 According to the specific equipment: Is external help (e. g. supplier, specialists, …)
needed in certain cases (certain failures) and which are they?
9.30 What is the percentage of work orders (relating to the evaporation plant) assigned to
outside companies (external labor, contracted service)?
9.31 Which maintenance KPI related to the recovery boiler are available?

Appendix II
7-83
9.32 In which way are they utilized?
9.33 Which improvements in recovery boiler maintenance were initiated because of certain
KPI results?
9.34 In which way (organizational) is the recovery boiler considered by maintenance?
9.35 How many maintenance people (split: mechanical, electrical, automation) are re-
quired at the recovery boiler during normal operation?
9.36 How many maintenance people (split: mechanical, electrical, automation) are re-
quired during the annual shutdown?
9.37 What is the working schedule of maintenance personnel in this area?
9.38 What is the daily work process (starting time, meetings, other tasks, …) for mainten-
ance personnel (engineers, supervisors, blue collar workers, …) in this area?
9.39 Pictures of critical equipment and/ or parts?

Appendix II
7-84
7.2 Layout drawing: Woodroom

Appendix II
7-85
7.3 Layout drawing: Chip handling

Appendix II
7-86
7.4 Drawing: Reclaimer

Appendix II
7-87
7.5 Other drawings
Because of clarity, several other drawings are not displayed on hard copy and are available
on the CD-ROM enclosed.