dipartimento di scienze agronomiche agrochimiche e delle ... · wp8 dissemination. dacpa sezione...
TRANSCRIPT

Dipartimento di Scienze Agronomiche Agrochimiche e delle Produzioni Animali
Sezione Scienze Agronomiche
Università degli Studi di Catania - ITALY
Biokenaf - Biomass Production Chainand Growth Simulation Model for Kenaf
Athens 23rd-24th October 2003
Scientific Responsible
Prof. Salvatore Foti


DACPA SEZIONE SCIENZE AGRONOMICHE BIOKENAFUNCT Università degli Studi di Catania ITALY
Athens, 23th-24th October 2003
Research lines
WP2 Adaptability and Productivity FieldTrials
Task 2.2 Effect of different sowing dates and plant population on biomass yield
Task 2.3 Effect of irrigation and nitrogen fertilization on biomass yields
WP3 Development of the growth simulation model
WP8 Dissemination

DACPA SEZIONE SCIENZE AGRONOMICHE BIOKENAFUNCT Università degli Studi di Catania ITALY
Athens, 23th-24th October 2003
WP2 Adaptability and Productivity Field Trials
- Task 2.2 Effect of different sowing dates and plantpopulation on biomass yield
LocalityEnna (450 m. s. l.) – 37°21’ Lat. N, 14°16’ Long. E
Studied factorsa) two sowing date
12/6/2003; 4/7/2003;
b) two varietesTainung 2Everglades 41
c) two plant densities200.000 plants ha-1
400.000 plants ha-1

DACPA SEZIONE SCIENZE AGRONOMICHE BIOKENAFUNCT Università degli Studi di Catania ITALY
Athens, 23th-24th October 2003
Crop management
- Row distance: 50 cm;
- Fertilisation: 100 kg ha-1 of P2O5 and 100 kg ha-1 of N. Nitrogen fertilisation was distributed the first half part at sowing and the second one on the 25th July and on the 3rd September, respectively for the first and the second sowing
- Irrigation: 100% ETm
* Water irrigation volume:
• 416,67 mm for the 1st sowing (till September 1st)
• 277,78 mm for the 2nd sowing (till September 4th)

DACPA SEZIONE SCIENZE AGRONOMICHE BIOKENAFUNCT Università degli Studi di Catania ITALY
Athens, 23th-2th October 2003
Methodology
Experimental design randomised block
No. of replicates 3
single plot dimension 6 m x 8 m (48 m2)
irrigation system drip irrigation

DACPA SEZIONE SCIENZE AGRONOMICHE BIOKENAFUNCT Università degli Studi di Catania ITALY
Athens, 23th-24th October 2003
Epoche di semina12 file per parcella
1 2 3 4S1D1 S2D2 S1D2 S1D1
TAINUNG EVER. TAINUNG EVER.
8 7 6 5S2D1 S1D2 S2D1 S2D2 8 m
TAINUNG EVER. EVER. TAINUNG
6 m
9 10 11 12Nord S2D1 S1D1 S2D2 S2D1
TAINUNG EVER. EVER. EVER.
16 15 14 13S1D2 S1D1 S1D2 S2D2
EVER. TAINUNG TAINUNG TAINUNG
S1 = 1st sowing date
S2 = 2nd sowing date
D1 = 20 plants m2
D2 = 40 plants m2

DACPA SEZIONE SCIENZE AGRONOMICHE BIOKENAFUNCT Università degli Studi di Catania ITALY
Athens, 23th-24th October 2003
WP2 Adaptability and Productivity Field Trials
Task 2.3 Effect of irrigation and nitrogen fertilization on biomass yields.
LocalityEnna (450 m. s. l.) – 37°21’ Lat. N, 14°16’ Long. E

DACPA SEZIONE SCIENZE AGRONOMICHE BIOKENAFUNCT Università degli Studi di Catania ITALY
Athens, 23th-24th October 2003
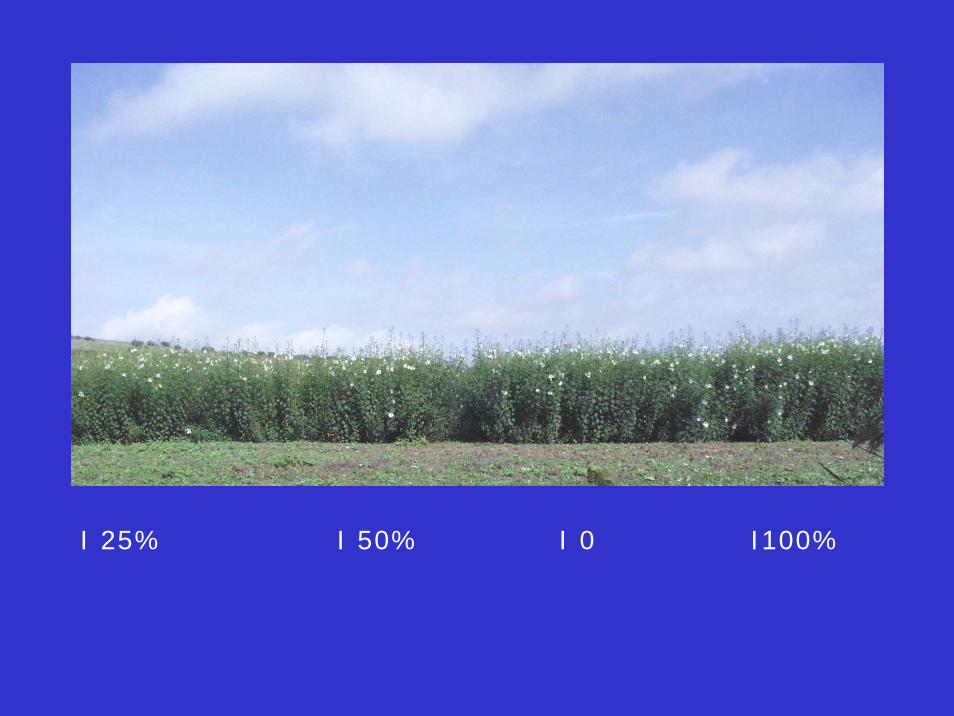
Studied factorsa) water supply
I0 = no irrigation (191,26 mm);
I1 = 25% of PET (231,26 mm);
I2 = 50% of PET (271,26 mm);
3
b) nitrogen level
N0 = 0 nitrogen fertilisation;N1 = 100 kg ha-1 of NN2 = 150 kg ha-1 of N
Nitrogen fertilisation was distributed the first half part at the sowing and second one on the 21st
August; at the moment of the sowing was distributed 100 kg ha-1 of P2O5
I = 100% of PET (351,26 mm);

DACPA SEZIONE SCIENZE AGRONOMICHE BIOKENAFUNCT Università degli Studi di Catania ITALY
Athens, 23th-24th October 2003
Crop management- Sowing: 24/6/2003;
- Row distance: 50 cm;
- Plant density: 200.000 plant ha-1;
MethodologyExperimental design: split-split-plotNo. of replicates: 3single plot dimension: 6 m x 8 m (48 m2)irrigation system: drip irrigation

DACPA SEZIONE SCIENZE AGRONOMICHE BIOKENAFUNCT Università degli Studi di Catania ITALY
Athens, 23th-24th October 2003
Measurements (on both subtask 2.2 and 2.3)
• Meteorological• Soil measurement (before sowing)• Phenology● Growth analysis
fresh and dry weight of each part of plantleaf area of all green leaves
● Agronomicat plant emergence, number of plant m-2

DACPA SEZIONE SCIENZE AGRONOMICHE BIOKENAFUNCT Università degli Studi di Catania ITALY
Athens, 23th-24th October 2003
Prova kenaf 2003varietà Tainung 2
Irrigazione e azoto
I blocco II blocco
N1 N2 N0 no irrigazione N0 N2 N1 100% dell'36 35 34 33 32 31
Nord N2 N0 N1 5% dell'Etm N2 N0 N1 no irrigazi25 26 27 28 29 30
N0 N1 N2 00% dell'Etm N1 N2 N0 50% dell'E24 23 22 21 20 19
N1 N2 N0 0% dell'Etm N2 N1 N0 25% dell'E13 14 15 16 17 18

DACPA SEZIONE SCIENZE AGRONOMICHE BIOKENAFUNCT Università degli Studi di Catania
Athens, 23th-24th October 2003
Physiological
Leaf water potential (by means of a gas pressure
chamber, Soil Moisture, USA)
Leaf transpiration, Stomatal conductance,
Photosyntesis by means of gas analyzer (by
means of LCA4 from ADC, UK)
Measurements on subtask 2.3

DACPA SEZIONE CIENZE AGRONOMICHE BIOKENAFUNCT Università degli Studi di Catania
Athens, 23th-24th October 2003
Other measurements
•ammonia volatilisation from soil
(trapping the gas soil by means of hermetic cylinders inserted in the soil and provided of a polyfoam sorption pad saturedwith H3PO4 and glycerine)

mag giu lug ago set ott 5
10
15
20
25
30
35
40
45
MAXIMUM TEMPERATUREMINIMUM TEMPERATURE
X Data
mag giu lug ago set ott 0
20
40
60
80
100
120MAXIMUM AIR HUMIDITYMINIMUM AIR HUMIDITY
(°C) (%)
X Data
mag giu lug ago set ott 0
10
20
30
40
50
60
RAINFALL
X Data
mag giu lug ago set ott 0
5
10
15
20
25
30
35
GLOBAL RADIATION(mm) (Mj /m2)

June 30th - 1st sowing date

Emergence of II sowing period plants - July 11th

July 29th -Tainung 2 S1 D2

July 29th - Everglades 41 S1 D1

29th July - Everglades 41 S1 D2

July 29th – 1st and 2nd sowing date trial

July 29th - Everglades S2 D2

Plant density (n m2)Pl
ant n
umbe
r m-2
10
15
20
25
30
35
40Tainung D1Tainung D2Everglades D1Everglades D2
10
15
20
25
30
35
40
45
50
55
60Tainung D2Tainung D1Everglades D1Everglades D2
lug ago sett ott lug ago sett o
I epoca
Plan
t num
ber m
-2
II epoca
tt

Hei
ght (
cm)
306090
120150180210240270300330360390
Tainung D1 Tainung D2 Everglades D1 Everglades D2
20
40
60
80
100
Num
ber
of n
odes
per
pla
nt
july agust sept oct
20
40
60
80
100
Hei
ght (
cm)
306090
120150180210240270300330360390
2nd sowing date july agust sept oct
july agust sept oct july agust sept oct
1st sowing date
Num
ber
of n
odes
per
pla
nt
Tainung D1 Tainung D2 Everglades D1 Everglades D2
Tainung D1 Tainung D2 Everglades D1 Everglades D2
Tainung D1 Tainung D2 Everglades D1 Everglades D2
Plant height (cm) Number of nodes per plant

0,0
1,0
2,0
3,0
4,0
5,0
6,0
7,0 Tainung D1 Tainung D2 Everglades D1 Everglades D2
july august sept oct
I sowing date
LA
I
0,0
1,0
2,0
3,0
4,0
5,0
6,0
7,0
II sowing date
july august sept oct
Tainung D1 Tainung D2 Everglades D1 Everglades D2
Leaf area index (LAI)

0
1000
2000
3000
4000
5000
6000
7000
8000
9000
10000Tainung D1 Tainung D2 Everglades D1 Everglades D2
0
500
1000
1500
2000
2500
july august sept oct
Fres
h bi
omas
s (g
m-2
)
1st sowing date
0
1000
2000
3000
4000
5000
6000
7000
8000
9000
10000
Fres
h bi
omas
s (g
m-2
)
0
500
1000
1500
2000
2500
Dry
bio
mas
s (g
m-2
)D
ry b
iom
ass (
g m
-2)
july august sept oct
july august sept oct july august sept oct
2nd sowing date
Tainung D1 Tainung D2 Everglades D1 Everglades D2
Tainung D1 Tainung D2 Everglades D1 Everglades D2
Tainung D1 Tainung D2 Everglades D1 Everglades D2
Fresh biomass (g m-2) Dry biomass (g m-2)

Lea
f fre
sh w
eigh
t (g
m-2
)
0
1000
2000
3000
4000
5000
6000
7000 Tainung D1 Tainung D2 Everglades D1 Everglades D2
0
1000
2000
3000
4000
5000
6000
7000
july august sept oct
1st sowing date
2nd sowing date
0
1000
2000
3000
4000
5000
6000
0
1000
2000
3000
4000
5000
6000
Stem
fre
sh w
eigh
t (g
m-2
)
july august sept oct
july august sept oct july august sept oct
Lea
f fre
sh w
eigh
t (g
m-2
)
Stem
fre
sh w
eigh
t (g
m-2
)
Tainung D1 Tainung D2 Everglades D1 Everglades D2
Tainung D1 Tainung D2 Everglades D1 Everglades D2
Tainung D1 Tainung D2 Everglades D1 Everglades D2
Leaf fresh weight (g m-2) Stem fresh weight (g m-2)

Lea
f dry
wei
ght (
g m
-2)
0
200
400
600
800
1000
1200
1400
1600 Tainung D1 Tainung D2 Everglades D1 Everglades D2
0
200
400
600
800
1000
1200
1400
1600
july august sept oct
Stem
dry
wei
ght (
g m
-2)
1st sowing date
0
200
400
600
800
1000
1200
1400
1600
0
200
400
600
800
1000
1200
1400
16002nd sowing date
Lea
f dry
wei
ght (
g m
-2)
Stem
dry
wei
ght (
g m
-2)
july august sept oct
july august sept oct july august sept oct
Tainung D1 Tainung D2 Everglades D1 Everglades D2
Tainung D1 Tainung D2 Everglades D1 Everglades D2
Tainung D1 Tainung D2 Everglades D1 Everglades D2
Leaf dry weight (g m-2) Stem dry weight (g m-2)
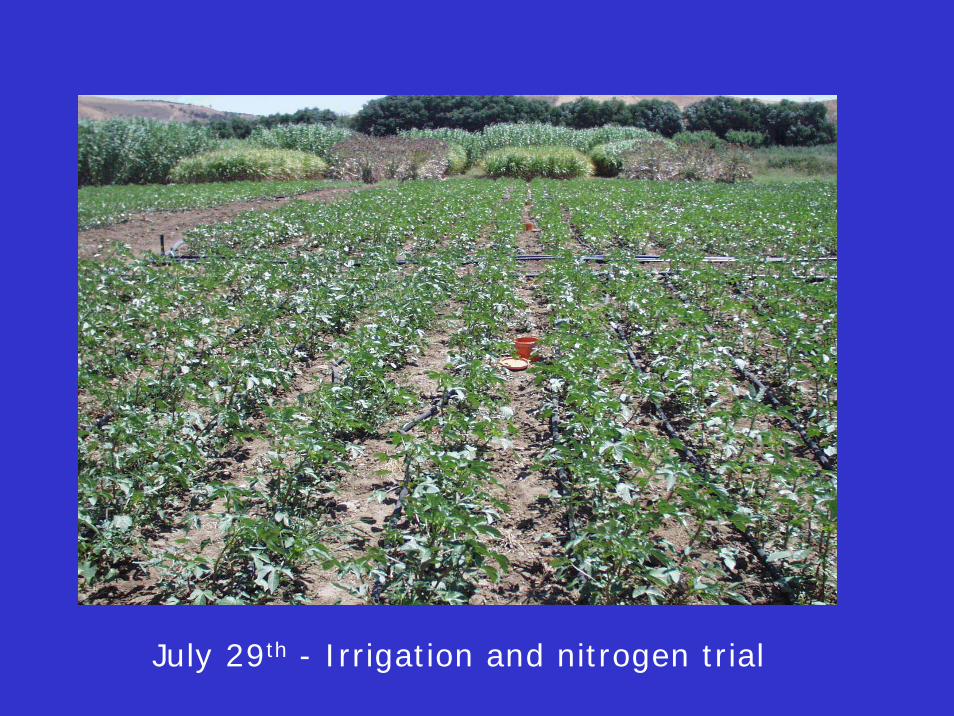
July 29th - Irrigation and nitrogen trial

50% ETM - N0

Hei
ght (
cm)
0
20
40
60
80
100
120
140
160
180
200 N2 N1 N0
July August September 0
20
40
60
80
100
120
140
160
180
200
I0 I25 50 I100
Plant height (cm)
July August September

LAI
0
1
2
3
4
N2 N1 N0
july august september 0
1
2
3
4
I0 I25 I50 I100
july august september
Leaf area index (LAI)

TOTA
L D
RY
BIO
MA
SS (g
/m2 )
0
200
400
600
800
1000
1200 N2 N1 N0
jul aug sept 0
200
400
600
800
1000
1200I0 I25 I50 I100
jul aug sept
Total above ground dry biomass (g m-2)

Abo
ve g
roun
d fr
esh
biom
ass
(g m
-2)
0500
10001500200025003000350040004500500055006000
N2 N1 N0
july august september 0
50010001500200025003000350040004500500055006000
july august september
I0I25I 50I100
Above ground fresh biomass (g m-2)

0
5
10
15
20
25
30
35
40
45
50
N2 N1 N0
jul aug sept 0
5
10
15
20
25
30
35
40
45
50
I0 I25 I50 I100
jul aug sept
Number of nodes per plant

0102030405060708090
100110120130
% leaves % stem
I0 I25 I50 I100 N0 N1 N2
Bio
mas
s dis
trib
utio
n (%
)Biomass distribution (%)

Irrigation Treatments
NH
4+ soi
l em
issi
on (k
g ha
-1)
0,0
2,0
4,0
6,0
8,0
10,0
12,0
14,0
16,0
18,0
20,0
22,0
24,0
4/7/0311/7/03
N1
N2
N0N1
N2
N2
N0N1
N2
N1
N0
Unirrigated control
I 25% of ETm I 50% ETm I 100% ETm
Ammonia soil emission (Kg ha-1)

I100% I25% I0 I 50%

I0 I50%

I 100% I 25%
I 25% I 50% I 0 I100%

I 0 I 100%


Midday leaf water potential (bars)
August-24
-22
-20
-18
-16
-14
Sept.
I 100%
I 50%
I 25%
I 0%

Predawn leaf water potential (bars)6 September 2003
Irrigation treatments
(bar
s)
-10
-9
-8
-7
-6
-5
-4
-3
-2
-1
0 I 0 I 25% I 50% I 100%

Available soil water content (%)0 20 40 60 80 100
(bar
s)
-11
-10
-9
-8
-7
-6
-5
-4
-3
Predawn leaf water potential vs. available soil water content
y = -16,09 + 11,53 (1 - e -0,06x)

Leaf transpiration (m
ols
H2O
cm
-2 s
-1)
2
4
6
8
10
12
I 100%
I 50%
I 25%
I 0
August September

Effect of Temperature onDark Respiration
Rt = R20 2(t - 20)/10
Respiration doubles each 10oC. It has a Q10 = 2


Risposta alla luce tesi I100
time0 5 10 15 20 25 30
μmol
i CO
2 m-2
s-1
0
10
20
30
40
Risposta alla luce tesi I0
time
μmol
i CO
2 m-2
s-1
-10
0
10
20
30
40
0
1000
1200 1300
1600
1680
1900
2000
0 900
2000
1600
1200
Attività fotosintetica risposta alla luce

Net
Pho
tosy
nthe
sis
(mol
s C
O2
m-2
s-1
)
5
10
15
20
25
30
35
40
45
Unirrigated controlI 25% ETmI 50% ETmI 100% ETm
August Sept.
Net Photosynthesis (mols CO2 m-2 s-1)

Net
Pho
tosy
nthe
sis
51015202530354045
°C
28 30 32 34 36 38 40 42 4405
1015202530354045
30 32 34 36 38 40 42 44
I100Pn = 55.2-0.76°C r²=0.1621
I50Pn=95.49-2.00°C r =0.72992
I0Pn = 86.77 -1.82°C r²=0.582
I25Pn = 69.13 - 1.35°C r²=0.33

Irradiance (I) (µmol m-2 s-1)
Net Phs(µmol m-2 s-1)
R0
Pmax
Pn = [Pmax+R][1 - exp(-εI/(Pmax + R))] - R
ε
Leaf Photosynthesis Response to Irradiance
0 2000
50
ε is apparent quantumEfficiency (mol mol-1)

Net
Pho
tosy
nthe
sis
-505
1015202530354045
-500 0 500 1000 1500 2000 2500-10-505
1015202530354045
PAR0 500 1000 1500 2000 2500
μmol m-2 s-1
I50Pmax=31.8852 ε=0.0446
I100Pmax=37.7497 ε=0.0583I25Pmax=29.955 ε=0.0457
I0Pmax=33.8221 ε=0.0418

-10
-5
0
5
10
15
20
25
30
35
40
45
PAR0 500 1000 1500 2000 2500
-10
-5
0
5
10
15
20
25
30
35
40
45
μmol m-2 s-1
Net
Pho
tosy
nthe
sis
I 0 Pmax=33.8221 ε=0.0418
I 100 Pmax=37.7497 ε=0.0583
I 25 Pmax=29.9558 ε=0.0457
I 50 Pmax=30.7731 ε=0.0454

Qua
ntum
Eff
icie
ncy
0.00
0.01
0.02
0.03
0.04
°C
24 26 28 30 32 34 36 38 40 42 440.00
0.01
0.02
0.03
0.04
24 26 28 30 32 34 36 38 40 42 44
I100Qeff= 0.074-0.0017°C r²=0.64
I50Qeff = 0.065 -0.0014°C r²=0.79
I25Qeff
=0.064-0.00144°C r²=0.61 I0Qeff=0.06-0.0013°C r²=0.35