dipartimento di fisica e astronomia galileo galilei...
TRANSCRIPT

UNIVERSITA DEGLI STUDI DI PADOVA
DIPARTIMENTO DI FISICA E ASTRONOMIA GALILEO GALILEI
CORSO DI LAUREA MAGISTRALE IN FISICA
BEAM PROPERTY CHARACTERIZATIONBY MEANS OF THREE BEAM DIAGNOSTICS
AT BATMAN
RELATORE: Dr. Gianluigi Serianni
CORRELATORE: Prof. Dr. Ing. Ursel Fantz
CONTRORELATORE: Prof. Marco Zanetti
LAUREANDO: Roberto Maurizio
Settembre 2015Anno Accademico 2014-2015


Abstract
ITER is the biggest international fusion experiment ever conceived and it is currently underconstruction in the south of France: its aim is to prove the technical feasibility of controllednuclear fusion on earth. It consists of a fusion reactor based on the tokamak concept of mag-netic confinement of plasmas; in order to reach the temperature required for the occurrence ofthermonuclear reactions, external heating systems are required, like a Neutral Beam Injector(NBI). The neutral beam is obtained from a Hydrogen or Deuterium negative ion beam whichis extracted and accelerated from a large RF driven ion source. The RF-driven cesiated neg-ative ion source of the BATMAN (Bavarian Test Machine for Negative ions) test facility, atIPP-Garching (Germany), is since 2007 the ITER prototype source.
The present work has been performed at the IPP-BATMAN test facility during the summersemester of the academic year 2014-2015, in the framework of the Erasmus exchange agreementbetween the University of Padua and the Ludwig-Maximilians-Universitat of Munich.
In Chapter 1 a brief introduction on the physics of nuclear fusion and the concept of a fusionreactor is provided: particular emphasis is dedicated to the energy balance in the plasma -between energy production and energy losses - and thus to the need for external heating systems.The ITER experiment is then outlined and one of its external heating systems, the Neutral BeamHeating (NBI), is introduced.
Chapter 2 thoroughly describes the features of a negative hydrogen ion beam source: the cre-ation of negative ions from a low-pressure and low-temperature plasma source (in two possibleways), the extraction and acceleration of the ions by a system of multi-aperture grids. A usefulparameter for the characterization of beam optics - the normalized perveance - is introducedand its relation with the beam divergence is discussed from a theoretical and an experimentalpoint of view.
In Chapter 3 an overview of the main parts of the BATMAN test facility is provided: the sourceregion, where the ions are created, the extraction and acceleration region, where the beam isaccelerated, and finally the drift region, where the beam propagates in vacuum and it is analyzedby several beam diagnostics. BATMAN is equipped with five horizontal lines-of-sight for BeamEmission Spectroscopy (BES), a diagnostic calorimeter made of two Carbon-Fiber-Compositetiles (mini-STRIKE ) and finally a copper calorimeter.
The first part of Chapter 4 describes the codes written for the analysis of the data from beamdiagnostics; the second part of the chapter introduces some important remarks about dataanalysis, necessary to correctly interpret the experimental results.
In Chapter 5 a characterization of the negative ion beam properties - e.g. divergence, homogene-ity and asymmetries - in di↵erent operational scenarios is given: with di↵erent magnetic filterfield setups, source parameters (e.g the RF power, source pressure, bias current, extraction andacceleration voltages) and finally with di↵erent gases. The evolution of the beam features duringsome Cs-conditioning days of the source is analyzed as well. Possible physical interpretationsfor the results are discussed, in some cases supported by numerical simulations developed adhoc.
In Chapter 6 the main results and open issues are summarized; finally possible future develop-ments of the present work are outlined.

Sommario
ITER e il piu grande esperimento internazionale sulla fusione nucleare mai concepito ed e incorso di realizzazione nel sud della Francia; il suo obiettivo e di provare la fattibilita tecnicadella fusione termonucleare controllata sulla Terra. Esso consiste in un reattore a fusione basatosulla configurazione tokamak per il confinamento magnetico di plasmi; al fine di raggiungerela temperatura richiesta dalla fusione nucleare sono necessari sistemi di riscaldamento addizio-nali del plasma, come l’iniettore di fasci di neutri (Neutral Beam Injector, NBI). Il fascio dineutri e ottenuto da un fascio di ioni negativi, Idrogeno o Deuterio, che viene estratto da unasorgente a radiofrequenza (RF) e poi accelerato. La sorgente cesiata a ioni negativi della testfacility BATMAN, presso IPP-Garching (Germania), e dal 2007 il prototipo della sorgente perITER.
Il presente lavoro e stato svolto presso la test facility BATMAN durante il semestre estivodell’anno accademico 2014-2015, nel contesto dell’accordo di scambio Erasmus tra l’Universitadegli Studi di Padova e la Ludwig-Maximilians-Universitat di Monaco di Baviera.
Nel Capitolo 1 e fornita una breve introduzione sulla fisica della fusione nucleare e il concetto diun reattore a fusione: particolare enfasi e data all’equilibrio energetico nel plasma - tra energiaprodotta e perdite - e alla necessita di sistemi di riscaldamento esterni. Viene quindi descrittol’esperimento ITER e uno dei metodi ausiliari di riscaldamento, il riscaldamento con fasci dineutri (NBI), e introdotto.
Il Capitolo 2 descrive in dettaglio le caratteristiche di una sorgente di ioni idrogeno negativi: lacreazione di ioni negativi da una sorgente di plasma a bassa pressione (con due possibili mecca-nismi), l’estrazione e l’accelerazione degli ioni tramite un sistema di griglie a molte aperture. Equindi introdotto un parametro utile per la caratterizzazione dell’ottica del fascio - la perveanzanormalizzata - e viene discussa la sua relazione con la divergenza del fascio dal punto di vistateorico e sperimentale.
Nel Capitolo 3 e presentata una panoramica della test facility BATMAN: la regione della sor-gente, dove sono creati gli ioni, la regione di estrazione ed accelerazione, dove gli ioni sono portatiad alta energia, ed infine la regione di drift, dove il fascio si propaga in vuoto e viene studiato dadiverse diagnostiche. Lo studio delle proprieta del fascio in BATMAN e eseguito mediante cinquelinee di vista orizzontali per Beam Emission Spectroscopy (BES), un calorimetro diagnostico -denominato mini-STRIKE - costituito da due tegole di un materiale composito unidirezionalein fibra di carbonio, un calorimetro in rame.
La prima parte del Capitolo 4 descrive i codici scritti per analizzare i dati forniti dalle diag-nostiche di fascio; la seconda parte introduce alcune importanti osservazioni sull’analisi dei dati,necessarie per interpretare correttamente i risultati sperimentali.
Il Capitolo 5 si concentra sullo studio delle proprieta del fascio - come divergenza, omogeneita edasimmetrie - in diversi scenari operativi: con diversi campi magnetici di filtro, diversi parametridella sorgente (come la potenza RF, la pressione della sorgente, la corrente di bias, le tensioni diestrazione ed accelerazione) e infine con diversi gas. Viene inoltre analizzata l’evoluzione dellecaratteristiche del fascio durante alcuni giorni di condizionamento della sorgente con Cesio. Pos-sibili interpretazioni fisiche dei risultati sono presentate, in alcuni casi supportate da simulazioninumeriche sviluppate ad hoc.
Nel Capitolo 6 vengono sintetizzati i principali risultati e i problemi ancora aperti; infine sonodelineati alcuni possibili sviluppi futuri del presente lavoro.


Contents
1 Introduction 11.1 Physics of nuclear fusion . . . . . . . . . . . . . . . . . . . . . . . . . . . . . . . . 11.2 Concept of a fusion reactor . . . . . . . . . . . . . . . . . . . . . . . . . . . . . . 2
1.2.1 External heating devices . . . . . . . . . . . . . . . . . . . . . . . . . . . . 41.3 The Tokamak concept and ITER . . . . . . . . . . . . . . . . . . . . . . . . . . . 51.4 Neutral Beam Heating . . . . . . . . . . . . . . . . . . . . . . . . . . . . . . . . . 6
1.4.1 Beam absorption into the plasma . . . . . . . . . . . . . . . . . . . . . . . 7
2 Negative ion source overview 92.1 Positive and negative ion sources . . . . . . . . . . . . . . . . . . . . . . . . . . . 102.2 Negative ion production . . . . . . . . . . . . . . . . . . . . . . . . . . . . . . . . 11
2.2.1 The volume source . . . . . . . . . . . . . . . . . . . . . . . . . . . . . . . 112.2.2 The surface source . . . . . . . . . . . . . . . . . . . . . . . . . . . . . . . 13
2.3 Negative ion extraction and acceleration . . . . . . . . . . . . . . . . . . . . . . . 142.4 Negative ion beam properties: beam divergence . . . . . . . . . . . . . . . . . . . 15
2.4.1 Perveance definition . . . . . . . . . . . . . . . . . . . . . . . . . . . . . . 162.4.2 Beam divergence dependence on normalized perveance . . . . . . . . . . . 18
3 ITER prototype negative ion source: BATMAN test facility 213.1 The BATMAN test facility at IPP . . . . . . . . . . . . . . . . . . . . . . . . . . 21
3.1.1 The source region . . . . . . . . . . . . . . . . . . . . . . . . . . . . . . . 223.1.2 The extraction and acceleration region . . . . . . . . . . . . . . . . . . . . 243.1.3 The drift region . . . . . . . . . . . . . . . . . . . . . . . . . . . . . . . . . 25
3.2 Beam diagnostics in BATMAN . . . . . . . . . . . . . . . . . . . . . . . . . . . . 273.2.1 Beam Emission Spectroscopy (BES) . . . . . . . . . . . . . . . . . . . . . 273.2.2 mini-STRIKE calorimeter . . . . . . . . . . . . . . . . . . . . . . . . . . . 293.2.3 Copper calorimeter . . . . . . . . . . . . . . . . . . . . . . . . . . . . . . . 32
4 Software development and introductory remarks 354.1 Software development for data analysis . . . . . . . . . . . . . . . . . . . . . . . . 35
4.1.1 Beam Emission Spectroscopy . . . . . . . . . . . . . . . . . . . . . . . . . 354.1.2 mini-STRIKE . . . . . . . . . . . . . . . . . . . . . . . . . . . . . . . . . 404.1.3 Copper calorimeter . . . . . . . . . . . . . . . . . . . . . . . . . . . . . . . 444.1.4 Simulation activity . . . . . . . . . . . . . . . . . . . . . . . . . . . . . . . 45
4.2 Introductory remarks on the experimental results . . . . . . . . . . . . . . . . . . 494.2.1 Relation between BES intensity and current density . . . . . . . . . . . . 494.2.2 Calorimetric measurements with mini-STRIKE and the copper calorimeter 514.2.3 Agreement between mini-STRIKE and BES . . . . . . . . . . . . . . . . 524.2.4 Correlation between beam and extracted current vertical profiles . . . . . 534.2.5 Definition of the beam center . . . . . . . . . . . . . . . . . . . . . . . . . 544.2.6 Agreement between BES and the copper calorimeter . . . . . . . . . . . . 55
i

5 BATMAN beam characterization 575.1 Current density dependence on source parameters . . . . . . . . . . . . . . . . . . 575.2 Influence of the Filter Field . . . . . . . . . . . . . . . . . . . . . . . . . . . . . . 605.3 Influence of the production mechanism (surface or volume) . . . . . . . . . . . . 625.4 Influence of the extracted ion current (at z = 3) . . . . . . . . . . . . . . . . . . . 64
5.4.1 Trend of integrated quantities . . . . . . . . . . . . . . . . . . . . . . . . . 645.4.2 Beam inhomogeneity and shift . . . . . . . . . . . . . . . . . . . . . . . . 68
5.5 Influence of the ion mean energy . . . . . . . . . . . . . . . . . . . . . . . . . . . 805.5.1 Trend of integrated quantities . . . . . . . . . . . . . . . . . . . . . . . . . 805.5.2 Beam inhomogeneity and shift . . . . . . . . . . . . . . . . . . . . . . . . 81
5.6 Beam characterization at fixed Uex/Uacc . . . . . . . . . . . . . . . . . . . . . . . 835.6.1 Trend of integrated quantities . . . . . . . . . . . . . . . . . . . . . . . . . 845.6.2 Beam inhomogeneity and shift . . . . . . . . . . . . . . . . . . . . . . . . 86
5.7 Influence of the ion mass (Hydrogen or Deuterium) . . . . . . . . . . . . . . . . . 86
6 Conclusions 896.1 Main results . . . . . . . . . . . . . . . . . . . . . . . . . . . . . . . . . . . . . . . 896.2 Future developments . . . . . . . . . . . . . . . . . . . . . . . . . . . . . . . . . . 90
ii

1 Introduction
Less than a century has passed since the discovery that the energy of the Sun, our main star, isreleased by thermonuclear reactions (1929): soon physicists began to wonder how to reproduceon earth what is happening on the Sun. During the Second World War the idea emerged thata fission explosion could be used to initiate a fusion process analogous to the reactions in theinterior of the stars: after the first successful thermonuclear device explosions, discussions oncontrolled fusion became of great interest. To administrators it appeared that it was possibleto put to work in a controlled and peaceful way these violent reactions; it was necessary toconvince them that achieving the controlled process is incomparably more di�cult than creatinga thermonuclear explosion and that a considerable period of research, experimentation anddevelopment must precede any practical application.
1.1 Physics of nuclear fusion
Thermonuclear fusion is a reaction where exceedingly high temperatures, of the order of 108 K,permit light nuclei, as Hydrogen isotopes, to approach each other closely enough to synthesizeheavier nuclear species : fusion of light nuclei in heavy ones liberates energy since the meanbinding energy per nucleon decreases up to Fe (see Figure 1.1).
Figure 1.1. Binding energy per nucleon as a function of mass number A.
For example in the Sun the primary reaction is between two protons, namely the fusion oftwo 1H nuclei into a nucleus of Deuterium 2
1H = D: this reaction is however so slow that isnot suitable for energy production on earth. Nevertheless practical alternatives are available:
1

the most important among them are the reactions involving Deuterium and Tritium (Hydrogenisotopes)
D +D ! T + p+ 4.0 MeV
D +D ! He3 + n+ 3.3 MeV
D + T ! He4 + n+ 17.6 MeV
Figure 1.2a shows the cross section for these reactions, as a function of the kinetic energyof the reagent particles; it is clear that, at fixed kinetic energy, the D-T fusion is the mostprobable reaction up to about 400 keV. In Figure 1.2b the product of the cross section � fora fusion reaction and the relative velocity v of the colliding particles, averaged on the Maxwelldistribution of the positive ions in the plasma, is shown: again it may be noted that D-T reactionis clearly favorable in comparison with D-D or D-He3 and for this reason it has been chosen asthe main reaction in future fusion reactors.Moreover, the released energy (17.6 MeV) is given to the products as kinetic energy. As a resultof the di↵erent mass, the energy is not equally distributed: the lighter particle is the moreenergetic
D + T ! He4(3.5 MeV ) + n(14.1 MeV )
(a). Experimentally measured cross sections for some fusionreactions as a function of deuteron kinetic energy KD
[1] (b). Velocity averaged cross section h�vi for some nuclearfusion reactions [1]
Figure 1.2
1.2 Concept of a fusion reactor
The essential condition to realize the fusion reaction in laboratory is to reach very high temper-atures; wherever such high temperatures are present we run into formidable obstacles. In thehypothesis that temperatures of the order of 108 K can be achieved, the fusion fuel (Hydrogenand Deuterium gases) would be completely ionized: it would be a very hot plasma.
The first critical obstacle is the confinement of the reaction: the plasma must not come intocontact with the walls of the reactor, because no material can resist its erosion. There are, so
2

far, two approaches for the confinement.The first is to use the fuel at relatively low density, confined by strong magnetic fields, andthereby slow down the reaction so that it can be reasonably guided: this approach is called”Magnetic confinement” and it is exploited in the ”Tokamak” reactor.The other approach is to bring the fuel to extremely high densities. Explosions similar to thoseoccurring in the hydrogen bomb can be produced, though the individual explosion will have lessthat one-millionth the energy output of an hydrogen bomb: this approach is called ”Inertialconfinement”.
The magnetic confinement has been chosen by the international community as the operationalscenario for ITER fusion reactor; the most common shape of the reactor chamber, which willcontain the burning plasma, is a torus (like a doughnut).
Another critical point, regarding the energy production from fusion, is to achieve a steady-state: a balance must be reached within the plasma between energy input and inevitable energylosses.The two main balancing e↵ects are the following: on the one hand, energy production in thethermonuclear reactions with deposition of part of this energy in the plasma - indeed the energeticand positively charged reaction products share, by collisions, their energy with the particles inthe plasma - together with external heating systems; on the other hand there is energy loss, dueto loss of plasma on the walls (di↵usive processes and convective transport) and via radiation(Bremsstrahlung radiation). This balance is described by the equation:
Sf + Sh = SB + Sk (1.1)
where Sf is the fusion power density, Sh the power density from external heating systems, SB
and Sk refer respectively to radiation and di↵usive losses.The fusion power density Sf is the product of the densities of the two colliding partners n1 andn2 (D and T) with the velocity-averaged D-T cross section h�vi and the energy released in asingle fusion reaction Ef : Sf = Efn1n2h�vi . However, since Equation 1.1 applies to the plasmaand only the alpha particles (4He nuclei) contribute to heat the plasma, Ef = E↵ (without theenergy of the neutrons) and so Sf = S↵: indeed the alpha particles, being charged, are confinedby the magnetic field within the plasma, providing a source of heat. On the contrary, neutrons,which are neutral, escape from the plasma and heat the walls of the reactor by collisions; suchheat is removed by a cooling system and it is used for electricity production.
(a). Energy balance in a steady-state fusion plasma.(b). Critical p⌧E for ignition as a function of temperature
[1].
Figure 1.3
3

Transport processes such as di↵usion, convection and charge exchange are empirically describedby the energy confinement time ⌧E ; thereby the energy balance (Eq.1.1) can be rewritten to theignition condition:
n⌧E =12kT
h�vi✏↵ � 4c1Zeff (kT )1/2(1.2)
where n is the plasma density, T the plasma temperature, ✏↵=3.5 MeV the energy of the ↵-particle, c1 the bremsstrahlung constant and Zeff the e↵ective charge of the plasma (includingall impurity species) [2]. Figure 1.3b shows the analogous quantity p⌧E , where p stands forplasma pressure: one can notice that p⌧E must exceed a certain minimum value for ignition tooccur, and that this value depends on the plasma temperature. The ignition corresponds to thecondition of steady state power balance in the plasma with no external power heating: the alphapower heating is su�ciently large to balance the radiation and di↵usive losses.The simplest ignition condition is obtained at the minimum of the curve, Tmin = 15 keV and(p⌧E)min = 8.3 atm s.
1.2.1 External heating devices
The presence of external heating systems in a fusion reactor is necessary mainly for two reasons[3].Firstly, in the contemporary fusion experiments external heating systems are required to main-tain the plasma against thermal conduction losses and achieve both high temperature and asteady-state energy situation (Eq. 1.1).Secondly, the magnetic configuration requires a toroidal current to hold the plasma in equilib-rium: such current can be e�ciently driven by external heating systems. External heating isused also for controlling plasma instabilities and reducing losses.
There are mainly three methods to externally heat the plasma: (1) Ohmic Heating, (2) RadioFrequency Heating, (3) Neutral Beam Heating (NBI) (see Figure 1.4).
Figure 1.4. Typical heating systems in a fusion reactor.
Ohmic Heating : a toroidal current, driven along the torus, heats the plasma according tothe Ohm law P = R · I2p , where R is the Ohmic resistance of the plasma, Ip the current andP the power deposition. The current in the plasma is induced by the variation in time of the
4

poloidal magnetic field generated by an external coil located at the center of the torus. Since R isinversely proportional to the temperature of the plasma, the Ohmic heating e�ciency decreasesalong the process, leading to a maximum achievable temperature far lower than the requiredtemperature.
Radio frequency heating : high frequency electromagnetic waves are injected into the plasmaand, depending on the frequency, di↵erent components and locations of the plasma are heated.The typical frequencies belong to the range of the low frequency Alfven waves (1 ÷ 10 MHz),ion cyclotron frequencies (30 ÷ 100 MHz), lower hybrid frequencies (1 ÷ 10 GHz) and electroncyclotron frequencies (50÷ 150 GHz).
Neutral beam heating : negative or positive ions, accelerated at very high energies (50 kV ÷1 MV ), are neutralized, penetrate the reactor border magnetic field and via collisions withelectrons and ions are finally ionized and trapped. They will transfer their kinetic energy to theplasma by collisions, thereby heating the plasma.
1.3 The Tokamak concept and ITER
Serious work on the Tokamak concept, that confines low-pressure fuel by strong magnetic fields,started in the early 1950s; the name ”Tokamak” derives from the Russian words for ”magnetictoroidal camera”.
In a plain toroidal magnetic field, charged-particle orbits are not localized and consequentlya finite body of plasma cannot be held in equilibrium: the remedy is the addition of a toroidallydirected plasma current. Such a current generates a poloidal magnetic field component thatlocalizes the particles and thus establishes the possibility of plasma equilibrium. When thepoloidal field is quite smaller than the basic toroidal field, the magnetic configuration is calleda Tokamak ; typical radial profiles of the toroidal (B�) and poloidal (B✓) field strength in atokamak are shown in Figure 1.5. Moreover a vertical magnetic field is added, whose aim isto control better the vertical position of the plasma.
Figure 1.5. Typical radial profiles of toroidal (B�) and poloidal (B✓) magnetic fields in a Tokamak.
In a tokamak a set of massive toroidal field coils generates the main toroidal magnetic fieldcomponent; the plasma is inside a toroidal steel vacuum chamber (”vacuum vessel”) and isprimarily heated by currents, flowing in the plasma, induced by the toroidal primary winding(sometimes an iron core can be added at the center of the tokamak to improve this coupling).
5

Typical tokamak operation consists of pulse-filling the chamber with hydrogen gas which isionized by RF heating (typically the ECRH, electron cyclotron resonance heating): as the plasmacurrent builds up, ohmic heating raises the temperature. Hence, energetic neutral beams and/orhigh frequency electromagnetic waves are injected into the plasma to achieve the temperaturerequired for fusion to occur.
ITER challenges and PRIMA site The largest fusion experiment ever conceived, named ITER,is currently under construction in the south of France and it is based on the tokamak concept ofmagnetic confinement (a cut-out section is shown in Figure 1.6). The primary mission of ITER isto produce a stable, well-conditioned, Q = 10 plasma lasting for only 400 s in the inductive quasi-steady-state scenario and to produce a Q = 5 plasma for non-inductive steady-state scenarios (Qis the ratio of the output power to the input power in the plasma, namely the gain) [1].
Figure 1.6. Cut section of ITER fusion reactor.
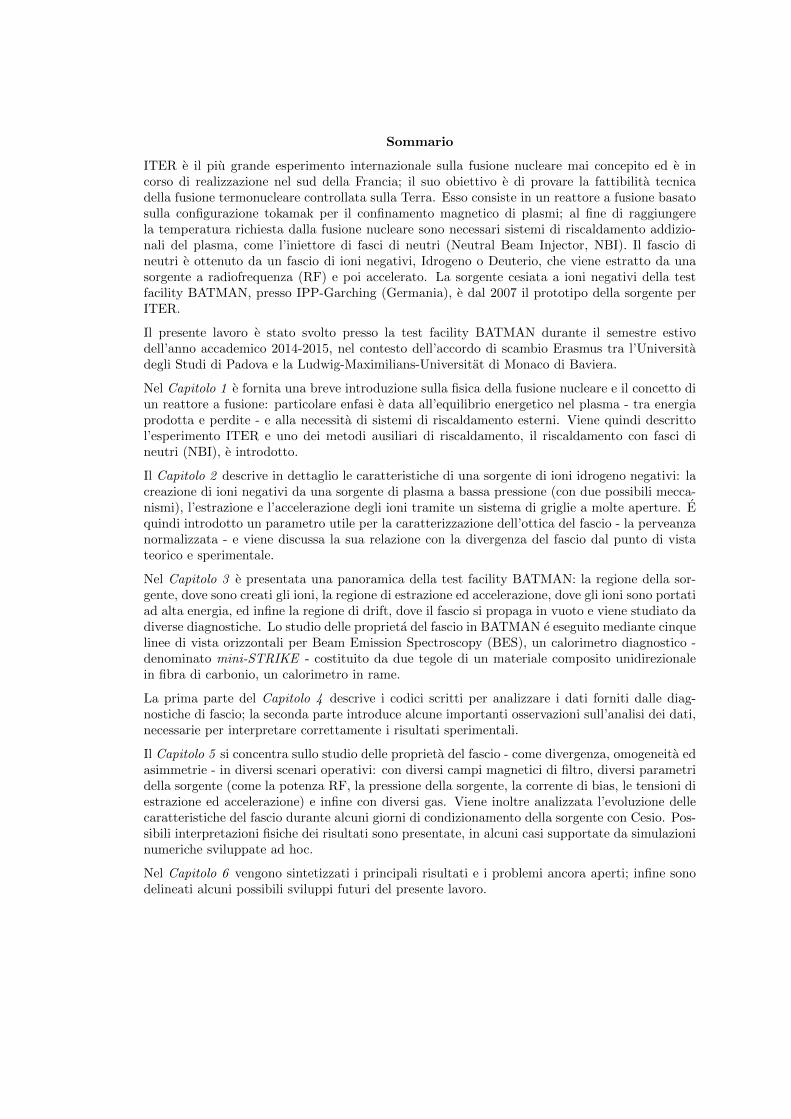
As shown in Figure 1.6, ITER requires neutral beam injection: as it will be explained in thenext chapter, the beam comes from a negative ion source. Negative ion beam sources are arelatively young and challenging area of research; to study and characterize the properties of theITER-like negative ion beam, a test facility is currently under construction in Padova (Italy),PRIMA (Padova Research on ITER Megavolt Accelerator) [8].The facility includes a full-size negative ion source, SPIDER (Source for Production of Ion ofDeuterium Extracted from RF plasma) and a prototype of the whole ITER injector, namedMITICA (Megavolt ITER Injector and Concept Advancement), shown in Figure 1.7.
1.4 Neutral Beam Heating
In order to get a high-energy neutral beam, it is necessary to accelerate ions in a first step. Acharged beam would never penetrate the plasma because it would be deflected out by the strongconfining magnetic fields: the charged beam must then be neutralized before injection into thereactor. The beam is composed by the same species as the fusion fuel, H or D: in this way the
6
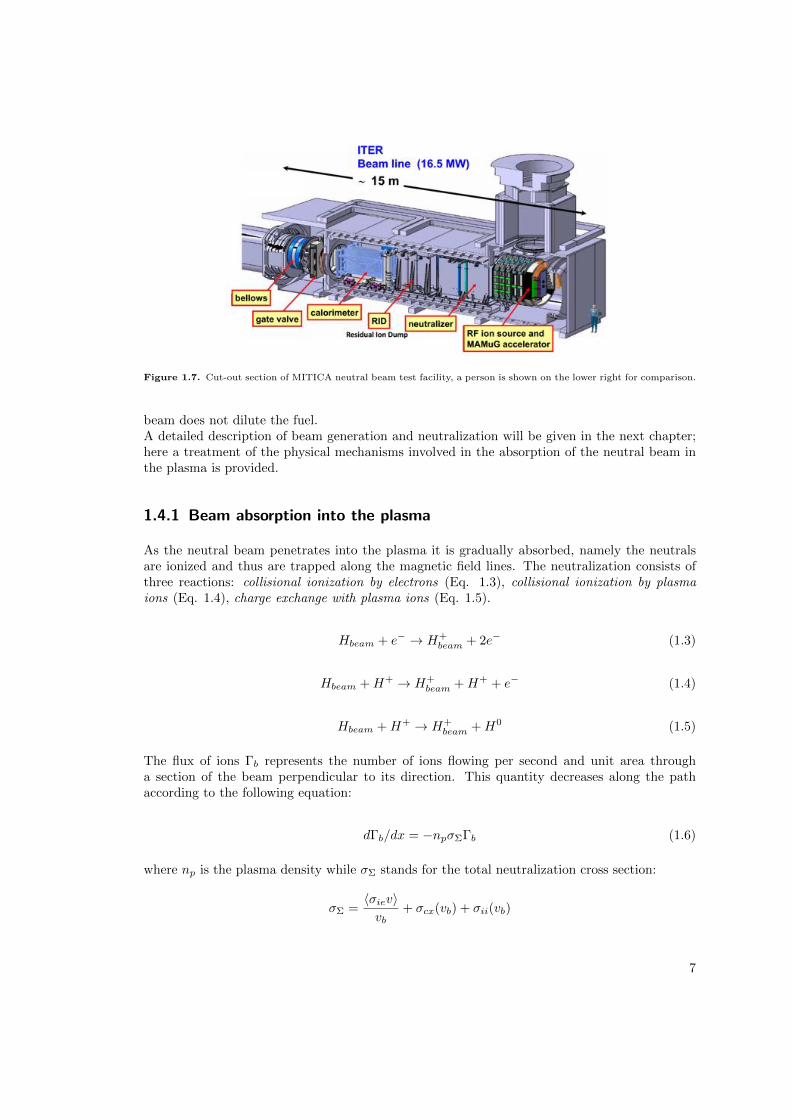
Figure 1.7. Cut-out section of MITICA neutral beam test facility, a person is shown on the lower right for comparison.
beam does not dilute the fuel.A detailed description of beam generation and neutralization will be given in the next chapter;here a treatment of the physical mechanisms involved in the absorption of the neutral beam inthe plasma is provided.
1.4.1 Beam absorption into the plasma
As the neutral beam penetrates into the plasma it is gradually absorbed, namely the neutralsare ionized and thus are trapped along the magnetic field lines. The neutralization consists ofthree reactions: collisional ionization by electrons (Eq. 1.3), collisional ionization by plasmaions (Eq. 1.4), charge exchange with plasma ions (Eq. 1.5).
Hbeam + e� ! H+beam + 2e� (1.3)
Hbeam +H+ ! H+beam +H+ + e� (1.4)
Hbeam +H+ ! H+beam +H0 (1.5)
The flux of ions �b represents the number of ions flowing per second and unit area througha section of the beam perpendicular to its direction. This quantity decreases along the pathaccording to the following equation:
d�b/dx = �np�⌃�b (1.6)
where np is the plasma density while �⌃ stands for the total neutralization cross section:
�⌃ =h�ievivb
+ �cx(vb) + �ii(vb)
7

where �ie, �ii and �cx are the cross sections for the reactions of Eq. 1.3, Eq. 1.4 and Eq. 1.5respectively.The cross section of each neutralization process and the total cross section �⌃ depend on therelative velocity of the colliding partners vb, which is proportional to the energy of the beam.The total cross section is found to decrease steadily with the energy of the beam (⇠ 1/E), asshown in Figure 1.8.
Figure 1.8. Ionization cross sections for collisional ionization by electrons �ie, collisional ionization by plasma ions �ii
and charge exchange with plasma ions �cx [3].
The solution of Eq. 1.6 is an exponential with a decay length (Eq. 1.7) depending strongly onthe beam energy via the total cross section: the more energetic is the beam, the lower is �⌃, thehigher is the penetration length of the beam in the plasma (i.e. the distance after which beamflux is reduced by a factor 1/e).
� =1
np�⌃(E)(1.7)
Hence, changing the beam energy allows to regulate the penetration length of the beam.A short decay length is undesirable since most of the energy is deposited on the outside of theplasma; a long decay length leads to a high deposition in the center but can also results inthe escape of the not ionized portion of the beam from the plasma. The optimal decay lengthdepends on the dimensions and characteristics of the reactor; for instance in ITER the optimaldecay length corresponds to a beam energy of 1 MeV. Such an energy implies, as it willbe explained in the next chapter, the use of a negative ion source: this is a relatively young,challenging and demanding technology and constitutes an intense field of research.
8

2 Negative ion source overview
The main parts of a neutral beam source are schematically illustrated in Figure 2.1, which isdedicated to:
1. Beam generation
2. Beam neutralization
3. Beam transport
Figure 2.1. Schematic view of a neutral beam heating system [3].
The purpose of the first stage is to generate an accelerated charged beam: this task is accom-plished by a positive or negative ion source.The second stage consists in the neutralization of the beam. The neutralizer is usually a water-cooled drift tube filled with hydrogen gas: the charged particles collide with the gas and a certainfraction of them, depending on beam energy and charge, is neutralized by charge-exchange pro-cesses.In the last stage the charged component of the beam is deflected out by a strong magnetic (orelectric) field into an ion dump: the remaining neutral beam is injected into the plasma.
This chapter concentrates on the description of the first step, namely the generation of a chargebeam.
9

2.1 Positive and negative ion sources
Two possible types of hydrogen ion source are possible: positive ion source, producing a H+
beam, or negative ion source, producing a H� beam.
In a positive ion source, the H+ or D+ can be easily created by standard techniques: theions are produced as positively charged species of a low-temperature plasma, then extracted andaccelerated to the required energy. One challenge that has been successfully addressed is theminimization of the number of molecular H+
2 and H+3 ions with respect to the number of H+
ions: the molecular ions, because of their higher mass, ultimately produce less energetic neutralsthan those produced by atomic hydrogen, leading to a low penetration into the plasma and anundesirable heating of plasma edges. This kind of source is commonly used in all the majorrunning tokamaks nowadays.
A negative ion source is on the contrary more challenging, since negative ions are much moredi�cult to produce.The physical concept is in principle simple: in a partially-ionized hydrogen (or Deuterium)plasma an electron attaches to a neutral hydrogen atom producing H�, which is ultimatelyextracted and accelerated. Nevertheless the hydrogen atom has a crucial property: the bindingenergy of the electron is very low (0.75 eV), therefore the electron can be relatively easily strippedaway by collisions with gas or plasma. This e↵ect limits the amount of ion current extractedand accelerated.
Figure 2.2. Neutralization e�ciency for positive and negative hydrogen ions versus beam energy per nucleon [3].
The neutralization e�ciency for a positive or negative hydrogen ion beam as a function of beamenergy per nucleon is shown in Figure 2.2: the e�ciency of positive ion neutralization decreasessteadily with beam energy, while it saturates at about 60% for negative ions. This basicallymeans that a high-energy positive ion beam, for istance at 1 MeV (as required by ITER), canbe neutralized with very low e�ciency and thus cannot be injected into the plasma: the ITERneutral beam must come from a negative ion source.
The development of a negative-ion beam source for ITER is an important area of current fusiontechnology research; it started in the early 90s in Japan (NBI of experiments LHD and JT-60U)and in the end of 90s at IPP Garching-Germany (experiments MANITU, RADI, BATMAN and,more recently, ELISE). In July 2007 the IPP RF source was chosen by the ITER board as thereference design for the source of ITER negative-ion neutral beam injectors.
10

2.2 Negative ion production
There are basically two mechanisms to create negative ions in a plasma source, volume productionand surface production: these processes are here briefly treated.
2.2.1 The volume source
The aim of volume source is to maximize the production of negative ions by dissociative attach-ment of electrons on high vibrational states of hydrogen molecules ([4]): the process is made upof two steps and it takes place in the so-called ”tandem-source” (Figure 2.3).A tandem source comprises two regions, the driver or source chamber and the expansion cham-ber, separated by a magnetic field. The driver contains some permanent magnets, to create amulti-cusp configuration for plasma confinement, and either heated filaments in arc dischargesources or the radio-frequency (RF) antenna in RF sources. A description of a typical RF sourceis here provided.
Figure 2.3. Two-step volume production of negative ions in a tandem source [5].
Firstly, the H2 molecules are excited to high vibrational levels by collisions with fast electrons(Te about 5÷ 10 eV) in the driver region:
efast +H2 ! e0
fast +H⇤2 (2.1)
The electrons belong to the plasma created by the RF coil; the rate of the process can in principlebe enhanced by increasing the source pressure or RF power.
Secondly, the excited H⇤2 molecules drift to the expansion chamber. Via dissociative attachment
reactions with ”cold” electrons (Te < 2 eV) negative ions H� are finally created:
H⇤2 + 2e� ! H +H� + e� (2.2)
Unfortunately, the hydrogen negative ions can be easily destroyed mainly by three processes:
� the electron stripping:H� + e� ! H + 2e�
which is very e↵ective for Te > 2 eV
11

� the mutual neutralization:
H� +H+ ! 2H
which depends slightly on ion temperature
� the associative detachment:
H� +H ! H2 + e�
which depends slightly on ion temperature too
The predominant destruction process is the electron stripping ; in order to minimize it, a magneticfield filters the ”hot electrons” (Te > 2 eV) out of the expansion chamber (the details are givenin the next paragraph). Consequently, the dissociative attachment reaction rate is enhanced andthe destruction of H� by hot electrons is minimized.
Filter Field physics In the presence of a magnetic field, a particle with mass m and charge qwill spiral around one magnetic line of force. Its velocity along the line is arbitrary, since themotion along the line of force is not influenced by the field; on the contrary, the motion on theplane perpendicular to the line of force is circular, on a gyroradius (known as Larmor radius)
r =mcv?|q|B (2.3)
where v? is the particle velocity on such plane and B the magnetic field intensity. If in vacuum,the particle (for instance one electron) would just spin in its Larmor orbit and move freely alongthe field line of force. In the presence of a gas and a density gradient rn of the particle species,when the particle collides with another charge or a neutral, its guiding center can get shifted andthere can be a cross-field di↵usion along the density gradient rn (Figure 2.4). In an ion sourcean electric field is moreover present: it stems from the potential drop between the plasma and ametallic grid - known as plasma grid, PG - which faces directly the plasma and extracts negativecharges. The electron can thereby move towards the plasma grid, where it is co-extracted withnegative ions H�.
Figure 2.4. Di↵usion of an electron across a (horizontal) magnetic field due to collisions.
12
The cross-field di↵usion of the electron, however, depends on its velocity. Indeed the velocity ofthe electron a↵ects considerably its capability to interact with the gas via Coulomb scattering:the collision frequency with other particles is inversely proportional to the third power of theelectron velocity [6]:
⌫e = ne�C(Te)ve ⇠ v�3e ⇠ T�3/2
e (2.4)
Therefore hot electrons are much less collisional than cold electrons: the former di↵use moreslowly and are trapped by the filter field, while the latter are able to reach the plasma grid.
2.2.2 The surface source
Figure 2.5. Chamfered holes at the plasma grid (PG) increase the extraction probability of surface generated H�.
The ”surface e↵ect” consists in the conversion of neutral or positive hydrogen ions to negativeions after they collide with a material surface (the plasma grid, PG), due to the capture of oneelectron: the probability of electron capture depends strongly on the work function � of thesurface [7]. This dependence can be easily quantified with the negative ion yield per H impacton the wall [3]:
Y (H�/H,H+) = exp(���A
C · v?) (2.5)
where C is a constant, v? is the perpendicular velocity of the escaping ion, A the a�nityof the electron (0.75 eV for negative hydrogen ions) and � the work function of the surface.Minimization of the di↵erence � � A enhances the electron capture probability: this is usuallyobtained by lowering the PG-surface work function with Cesium coverage of the grid surface.The optimal amount of Cesium is about 0.6 monolayers ([3]), which allows up to 0.67 H� perincident atom or ion to escape, depending on its energy.In all the current ion sources the typical value of the negative ion yield for impacting H or H+
is always in the range 10�2 ÷ 10�1. In order to enhance the e↵ective area for production ofnegative ions and facilitate the extraction, chamfered apertures instead of flat apertures can beused in the plasma grid (see Figure 2.5).
13

2.3 Negative ion extraction and acceleration
The extraction and acceleration system of a negative ion source is generally made of three grids:the plasma grid (PG), the extraction grid (EG) and the grounded grid (GG). The extractionphase takes place in the first gap, the acceleration phase in the second gap. The accelerationphase can be divided in several high voltage steps: for example the ITER accelerator will havefive grids for five acceleration stages of 200 keV each (MAMuG accelerator) [8].
Figure 2.6. Typical extraction and acceleration system for a negative ion source, made up of three multi-aperture gridsand two gaps (setup of BATMAN test facility, IPP); in this case Uex = 5 kV, Uacc = 15 kV.
In the extraction phase it is necessary to minimize the co-extracted electrons before the accel-eration gap: strong permanent magnets, embedded in the second grid, bend the electrons andforce them to hit the extraction grid (Figure 2.6).
Stripping losses in the accelerator Inside and after the first acceleration gap, part of the H� ofthe beam are converted into fast neutrals by collision with neutral background gas H2 (strippingof the electron):
H�f +H2 ! H0
f +H2 + e (2.6)
Such neutrals, known also as stripped particles, cannot be accelerated any further: they makeup a low-energy component of the beam. The rate of the process is proportional to the pres-sure of the source (density of H2); as a consequence, ITER requires a low source pressure, 0.3 Pa.
At 0.3 Pa and in volume production the extracted current density jex is far lower than ITERrequirement : few mA instead of 32.9 mA/cm2 for hydrogen. This happens because the volumeproduction means a lot of co-extracted electrons: the limit of the electron-load on the EG inturn limits the H� extracted. The only way to achieve ITER requirement is working in surfaceproduction mode.
14

2.4 Negative ion beam properties: beam divergence
One of the most important properties of a charged beam is the beam divergence , measuredin degrees (�). This quantity basically describes the angular spread of the particle trajectoriesaround the beam axis: a well-focused beam is characterized by a low divergence, a bad-focusedbeam by a high divergence.If we consider a beamlet which exits from an aperture of the grounded grid and drifts in thevacuum vessel, its size will increase due to space-charge repulsion and the particle trajectorieswill deviate from the beamlet axis. The distribution of the angle between each trajectory andthe beamlet axis is generally assumed to be Gaussian, centered in zero; the beamlet divergenceis by definition the e-folding half-width of such Gaussian,
p2� (� is the standard deviation).
In the case of a multi-aperture extraction and acceleration grid system, as the LAG in BATMANion source, the beam is the superimposition of many beamlets.
The divergence is an optical property of the beam and it therefore depends strongly on the ge-ometry of the extraction and acceleration system. The grids constitute indeed a system of elec-trostatic lenses ([9]), and a strong analogy between charged and light beams is usually adopted:as a light beam can be focused or de-focused by the lenses, similarly a charged beam can befocused or de-focused by the electric or magnetic fields between the grids.
Figure 2.7. Lines of constant electrostatic potential between the plasma grid, the extraction grid and the groundedgrid. The optical e↵ect on the beamlet for each grid aperture is also indicated: a convex lens is focusing,a de-convex lens is de-focusing.
The distortion of equipotential lines near one aperture of each grid is shown in Figure 2.7, whileFigure 2.8 shows the equivalent system of electrostatic lenses. The optical properties of eachgrid aperture, like the focal length, depend mainly on the electric field on both sides of the gridaperture.The electric field present in the extraction gap penetrates both the PG aperture, forming afocusing lens (often known as meniscus), and the EG aperture, forming a de-focusing lens; themeniscus is also the plasma boundary during extraction and starting point of H�. Similarlythe electric field of the acceleration gap enters the EG, creating a focusing lens, and the GG,creating a de-focusing lens.As a result, the PG aperture acts always as a focusing lens and the GG aperture as a de-focusinglens (see Figure 2.8). On the contrary the optical properties of the EG are not straightforward.
15

Figure 2.8. The grid system for beam extraction and acceleration can be conceived as a system of electrostatic lenses.
Indeed the EG aperture consists of a (1) de-focusing lens on the left side, a (2) focusing lenson the right side and a (3) potential-free region between them (the EG is rather thick due tothe embedded magnets): an incoming beamlet is therefore de-focused by (1), expands becauseof space charge repulsion within the potential free region (3) and finally is focused by (2). Con-sequently the EG can be focusing or de-focusing, depending on the extraction and accelerationvoltages.
A useful parameter in the characterization of the beam optics, as it will be shown in the nextsection, is the perveance: this quantity is strongly correlated to the optical properties of theextraction and acceleration grids.
2.4.1 Perveance definition
The perveance of a charged beam is defined as the ratio of the beam current Iex to the three-halves power of the extraction voltage Uex [10]:
⇧ =Iex
U3/2ex
(2.7)
The maximum possible extracted current Imaxex for a radially symmetric ion beamlet is limited
by the space charge of the beamlet and is given by the Child-Langmuir Law:
Imax =4
9⇡✏0
r2e
m
⇣ rd
⌘2U3/2ex (2.8)
This equation is obtained for a beamlet of electrons extracted between two electrodes but it isvalid also for beamlet of negative ions. The electrodes have radius r and relative distance d anda voltage di↵erence is applied between them; the electric field accelerates the electrons emittedby the surface of the first electrode due to Thermoionic e↵ect (the electrode is heated) towardsthe second surface. The continuous flux of charges between the plates constitutes a space chargewhich alters the potential distribution (Figure 2.9): as the current is increased, the potential
16

develops a concavity. The current cannot increase beyond the point where the potential curvebecomes horizontal at P, because any further increase in current would make the potential curveslope at P downwards and the negative particles would be unable to overcome the potentialwell.
Figure 2.9. Concept of the Child-Langmuir Law.
The maximum perveance can thereby be computed:
⇧0 =Imaxex
U3/2ex
=4
9⇡✏0
r2e
m
⇣ rd
⌘2(2.9)
and the normalized perveance is by definition the ratio ⇧/⇧0.
17

2.4.2 Beam divergence dependence on normalized perveance
The normalized perveance ⇧/⇧0 includes all the optical features of the grid system and thusdetermines the optical properties of the accelerated beam, namely the position of the focus pointand the beam divergence.
Figure 2.10. Theoretical relation between the maximum opening angle of a charged beamlet and its normalized per-veance, here as P/P0, as in [11].
A simple theoretical treatment of the relation between the normalized perveance of a beamletand its final divergence can be found in [11]: Figure 2.10 shows the maximum opening angleof the beamlet as a function of the normalized perveance of the beamlet. The optimum of theperveance is defined as the value which corresponds to the minimum of the divergence; moreover,as the real extraction geometry is far more complicated than the one adopted in the model of[11], it is reasonable to expect that the data will not completely agree with this rule.
Figure 2.11. Beam divergence as a function of normalized perveance, measured with beam emission spectroscopy atBATMAN.
In Figure 2.11 the experimental beam divergence measured at BATMAN as a function of nor-malized perveance is shown; the divergence is estimated with spectroscopy (BES) approximately
18

0.7 m downstream of the last grid (GG). The experimental trend departs from the theoreticalone presented above: the points can be fitted by a parabola rather than by a straight line.The left branch of the parabola, where the divergence decreases with increasing perveance, isknown as underperveant region; the right branch, here not present and seldom explored in BAT-MAN (since it corresponds to very high accelerated currents), is known as overperveant region.If the acceleration voltage Uacc is changed, the parabola shifts vertically: in Figure 2.11 a higheracceleration voltage helps the beam to focus and thereby the divergence is lower.
Figure 2.12. Schematic drawing of the beamlet shape in three situation: underperveant beamlet (blue), at the optimumof the perveance (green), overperveant beamlet (red).
If the beam is underperveant, the focus point of the first lens (the meniscus at the PG aperture) islocated between the PG and the EG (Figure 2.12). As the perveance is increased, the curvatureof the meniscus reduces and consequently the focus point moves towards the EG: the beamdivergence gradually reduces, reaching its minimum when the focus is on the entrance of the EG(optimum of the perveance). Finally, if the perveance is further increased, the focus point shiftstowards the GG and the beam divergence increases: the beam is overperveant (right branch ofthe divergence-to-perveance parabola). The dependence of the BES divergence for one of thevertical BES line-of-sight of ELISE test facility (at IPP-Garching) on the normalized perveanceis shown in Figure 2.13; the minimum of the divergence, corresponding to the optimum of theperveance, is visible.
Figure 2.13. Line-of-sight averaged beamlet divergence as a function of normalized perveance, for one of the verticalBES of ELISE [12].
19


3 ITER prototype negative ion source:BATMAN test facility
The IPP (Max-Planck Institute fur Plasma Physics, Garching, Germany) RF driven cesiatednegative hydrogen ion source is since 2007 the ITER NBI reference source [13]; the developmentof this source aims to meet the ITER-relevant ion source parameters (see Table 3.1). The workis carried out in di↵erent test facilities: one of them is the test bed ”BATMAN” (BAvarian TestMAchine for Negative ions) at IPP.
Parameter Deuterium Hydrogen
Current extracted 57 A 66 AEnergy at the accelerator exit 1 MeV 870 keVPower at the accelerator exit 40 MW 40 MWCurrent accelerated 40 A 46 AExtraction area 0.2 m2 0.2 m2
jacc 200 A/m2 230 A/m2
jex 286 A/m2 329 A/m2
Power after neutralization 17 MW 17 MWSource pressure 0.3 Pa 0.3 PaElectron content (je/jH�) <1 <0.5Pulse length 3600 s 1000 sUniformity ±10% ±10%
Table 3.1. ITER requirements for its NBI negative ion source [14], [15].
3.1 The BATMAN test facility at IPP
The main aim of BATMAN is the optimization of the RF source with respect to the extractedcurrent density in hydrogen and deuterium, operating at low pressure (0.3 Pa) and electron-to-ion ratio (< 1), with a small extraction area (< 0.01 m2) and short pulses (< 6 s); theextraction area of BATMAN is limited by the low pumping speed and capacity of the titaniumsublimation pumps, while the short pulse length is limited by the characteristics of the highvoltage power supply.
The BATMAN test facility is made up of three sections: (1) the source region (driver and expan-sion region), where the plasma is ignited and expands into the source body; (2) the extractionand acceleration region, where the ion current is accelerated up to 25 kV and the co-extractedelectrons are deflected out of the beam; (3) the drift region, a vacuum chamber where the beamdrifts and get analyzed by several diagnostics.
21

Figure 3.1. Schematic view of the IPP RF source in BATMAN.
3.1.1 The source region
RF driver The RF driver consists of a 150 mm long alumina cylinder with an inner diameterof 245 mm and a water-cooled RF coil connected to a 1 MHz oscillator; an internal edge-cooledcopper Faraday screen protects the alumina cylinder from the plasma. In order to reduce thesputtering by the plasma, the plasma side of the Faraday screen is covered with a thin layer oftungsten. A starter filament together with a gas pu↵ of a few 100 ms are required to ignite theplasma, which is then heated inductively by the RF coil.
Source body The source body consists of a 6 mm thick water-cooled stainless steel wall, and itsinner side is covered with an electro-deposited 1 mm thick Cu layer for better heat distribution;the area of the source body section (0.32 x 0.59 m2) is roughly one-eighth of the ITER sourceand its depth is 0.23 m. The source body is not equipped externally with any magnets for plasmaconfinement and in turn reduction of plasma losses at the source side walls. The magnetic filterfield, described in the next paragraph, can be generated by internal fixed magnets or externalmovable magnets: the latter has the advantage of an easy change of the magnetic configuration,without moreover the necessity to open the source.
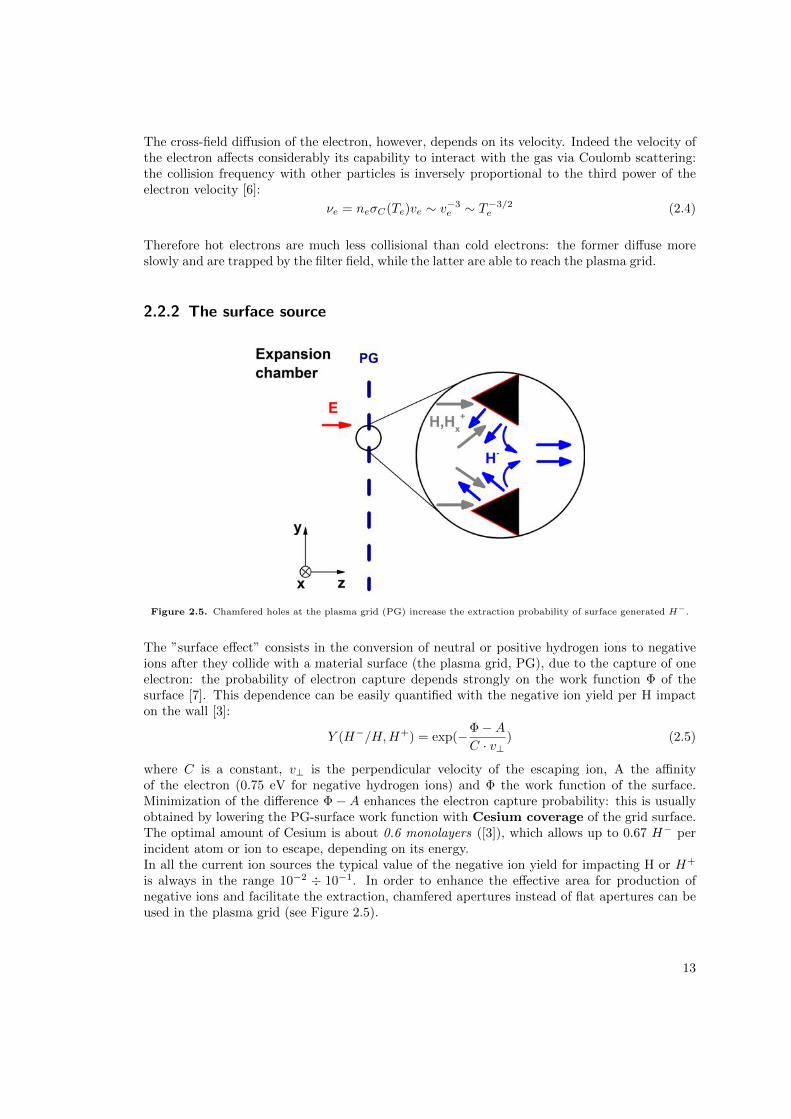
Filter field setups A magnetic filter field is located in the expansion region and, as previouslyexplained, it filters out the hot electrons (Te > 2 eV) from the plasma that flows towards thegrids; several magnetic setups can be explored.Figure 3.2 shows the mutually exclusive magnetic filter field setups in BATMAN: the standardconfiguration, with internal magnets embedded in the diagnostic flange, or the external andmovable magnetic frame. The frame can be moved continuously along the source body from thediagnostic flange to the driver exit; it consists mainly of a support structure surrounding thesource body with up to 2 x 4 magnets in CoSm (9 x 13 x 50 mm3).
In Figure 3.3 the horizontal component of the magnetic filter field strength (Bx) in the center ofthe source for some configurations is shown. Each configuration is labeled with the distance of
22
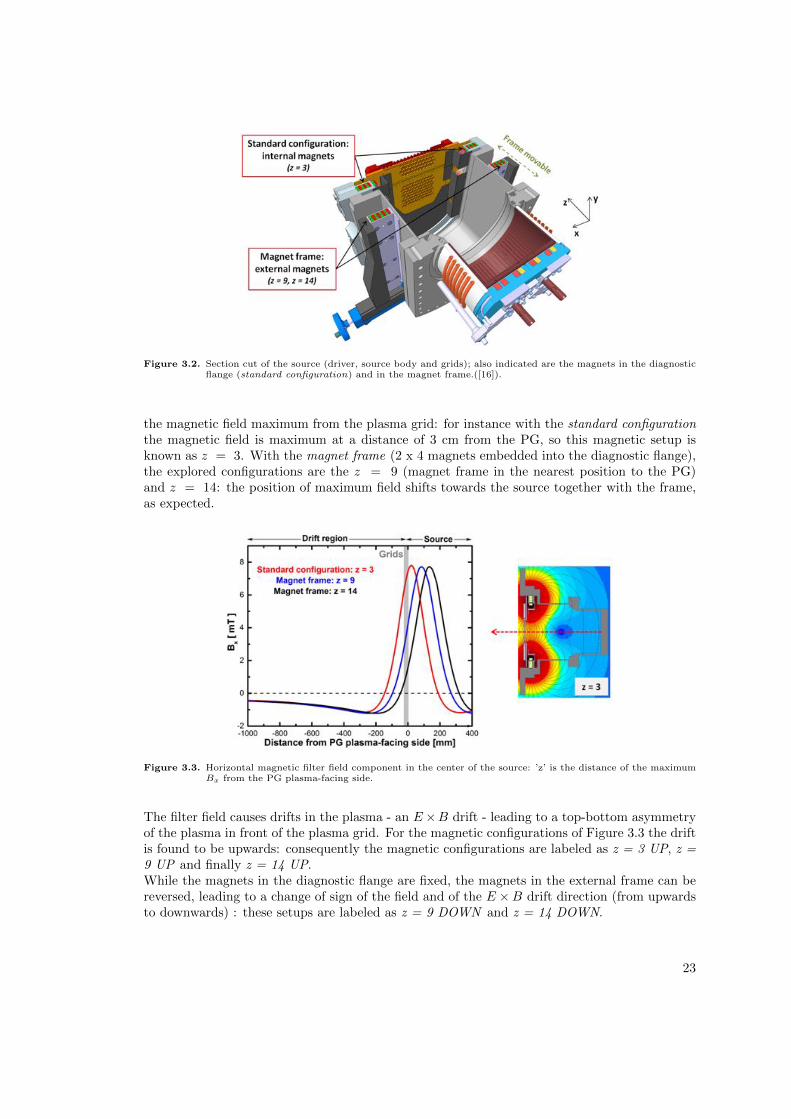
Figure 3.2. Section cut of the source (driver, source body and grids); also indicated are the magnets in the diagnosticflange (standard configuration) and in the magnet frame.([16]).
the magnetic field maximum from the plasma grid: for instance with the standard configurationthe magnetic field is maximum at a distance of 3 cm from the PG, so this magnetic setup isknown as z = 3. With the magnet frame (2 x 4 magnets embedded into the diagnostic flange),the explored configurations are the z = 9 (magnet frame in the nearest position to the PG)and z = 14: the position of maximum field shifts towards the source together with the frame,as expected.
Figure 3.3. Horizontal magnetic filter field component in the center of the source: ’z’ is the distance of the maximumBx from the PG plasma-facing side.
The filter field causes drifts in the plasma - an E⇥B drift - leading to a top-bottom asymmetryof the plasma in front of the plasma grid. For the magnetic configurations of Figure 3.3 the driftis found to be upwards: consequently the magnetic configurations are labeled as z = 3 UP, z =9 UP and finally z = 14 UP.While the magnets in the diagnostic flange are fixed, the magnets in the external frame can bereversed, leading to a change of sign of the field and of the E ⇥B drift direction (from upwardsto downwards) : these setups are labeled as z = 9 DOWN and z = 14 DOWN.
23

Cs oven Caesium is delivered by an oven on the top of the source back-plate (see Figure 3.4):it is introduced into the source continuously, during the vacuum phase and the plasma pulses,and it can build up reservoirs on the walls.The caesium is stored in glass capsules that are broken under vacuum by deforming a thin-walledsteel tube enclosing the capsule; Cs atoms then move towards the oven nozzle and are dispensedinto the source.The evaporation rate is controlled by the temperature of five di↵erent locations of the oven(labeled as T1, T2, T3, T4 and T5 in Figure 3.4); this allows great accuracy in the regulation ofthe evaporation rate, which is typically around 10 mg/h and is measured by a surface ionizationdetector (SID) located near the nozzle [17].
Figure 3.4. Section view of the Cs oven installed in BATMAN: it is possible to regulate the temperature of five locationsindependently.
3.1.2 The extraction and acceleration region
The typical voltage of the first gap - between the plasma grid and the extraction grid - is up to10 kV (usually 5 kV), and up to 15 kV for the second gap - between the extraction grid and thegrounded grid. The high voltage is delivered to the grids via a voltage divider with a resistanceof about 1 k⌦: this voltage divider is the main limit of the pulse length in BATMAN, with amaximum of about 5 s [18].
The current geometry of the grids is known as LAG (Large Area Grid) and it is shown in Figure3.5. The LAG is made of two identical halves with 63 apertures each; the apertures are arrangedin six rows with alternating 11 or 10 apertures with 11.6 mm distance in the horizontal and 11.9mm in the vertical direction.
The plasma grid is made of 4 mm thick molybdenum and the holes have a chamfered shape,in order to increase the area for conversion of neutral and positive ions to negative ions (surfaceproduction). The grid faces directly the plasma and can be biased positively against the sourcebody (+ 5 V): the bias voltage has been found to reduce the amount of co-extracted electrons.This biasing is provided by the addition of a so-called bias plate (shown in Figure 3.5), whichin BATMAN is electrically connected to the source potential [18]. The current collected at theplasma grid is known as ”bias current”.
24

Figure 3.5. View of the LAG from the plasma side; is also shown a section of the three grids (grounded, extractionand plasma grid).
The extraction grid is made of copper and it is quite thick because it houses permanentmagnets: such magnets create a ”deflection field”, which aims to deflect (horizontally) the co-extracted electrons on the EG, preventing them from being accelerated with the rest of the ionbeam. Since the electrons deposit a large amount of power on the grid, this has to be activelycooled; to avoid overheating and melting of the grid, the power from co-extracted electronscannot exceed a fixed value and this limits the total H� extracted current.The deflection field, mainly in the vertical (y) direction, is quite strong in the EG (see Figure3.6) while quickly decays out of the grid (unlike the filter field, which penetrates also the driftregion): the horizontal deviation induced to the ion beam is expected to be small .
Figure 3.6. Calculated deflection field strength By relative to the PG position for three di↵erent extraction systems(the current is LAG, blue line) [19]
Finally, the two halves of the grounded grid are inclined (”tilted”) by 0.9� for beam focusing;the total extraction area is 63 cm2.
3.1.3 The drift region
Once extracted and accelerated, the negative ion beam enters the drift region (Figure 3.7); hereit is observed by several diagnostics. A deep and detailed description of the beam diagnostics
25

available in BATMAN will be provided in the next chapter; they consist of:
� five vertically-aligned optical telescopes for Beam Emission Spectroscopy (BES), about0.7 m downstream of the GG;
� a small diagnostic calorimeter, named mini-STRIKE , located 1 m after the grids;
� a bigger copper calorimeter, located near the end of the drift chamber, namely 1.7 mdownstream of the GG.
Figure 3.7. Location of the beam diagnostics in BATMAN (top view).
The current densities quoted in this work - the current density of extracted negative ions jexand of co-extracted electrons je - are electrically and individually measured:
� The electron current density , je ([mA/cm2]), is derived from the electrical currentflowing onto the extraction grid (EG) [16]. Depending on the ion optics, some ions canhit the EG and some electrons can be accelerated with the beam; however, there is someevidence that the EG current matches the co-extracted current quite well [18].
� The electrically measured ion current density , jex ([mA/cm2]), is the sum of thecurrent at the GG (IGG) and the currents from the vacuum vessel (walls and all thediagnostics). This current is almost entirely (> 95 %) made up of negative ions [18];hence, jex is a measurement of the negative ions that are extracted from the ion source.
26

3.2 Beam diagnostics in BATMAN
The three beam diagnostics available at BATMAN are shown in Figures 3.7 and 3.8: they consistof a vertical array of five telescopes for spectroscopy (Beam Emission Spectroscopy, BES), adiagnostic calorimeter made up of two Carbon-Fiber-Composite tiles (named mini-STRIKE )and finally a copper calorimeter.A brief description for each diagnostic is here provided.
Figure 3.8. Beam diagnostics in BATMAN.
3.2.1 Beam Emission Spectroscopy (BES)
Beam emission spectroscopy, known also as H↵ emission spectroscopy, is generally used to esti-mate the divergence and the stripping losses of the beam; this is performed with the evaluationof the light-spectrum produced by the interaction between the beam and the background gas inthe drift region.The emitted light is collected along five horizontal lines-of-sight (LOS), as shown in Figure 3.8;each telescope has a mean angle, with respect to the beam axis, of 52� and the vertical distancebetween two LOS is 40 mm. The light is then analyzed by a spectrometer in the wavelengthrange around the H↵ line (the first line of the Balmer series for Hydrogen); it is important topoint up that every information provided by BES on the beam is by definition a mean along theLOS of the telescope.A typical BES spectrum is shown in Figure 3.9.
27

Figure 3.9. Typical BES spectrum, with three lines visible: the H↵ unshifted line (on the right), the H↵ Doppler-shifted line (on the left) and in the center a broad stripping peak.
Three peaks can be detected: the unshifted H↵ peak (at about 656.3 nm), the Doppler-shiftedpeak (at about 654.5 nm) and finally, between them, the stripping peak .
Unshifted H↵ It is the line emission caused by the dissociation and excitation of the backgroundgas (the same gas of the plasma, usually H2) induced by collisions with high-energy neutrals:
H0f +H2 ! H0
f +H0s (n = 3) +H0
s (n = 3) (3.1)
The indices s and f stand respectively for slow (background) and fast (beam) particles; the H0s
created are in the excited state n = 3 and spontaneously decade to the lower state n = 2. Thisleads to the emission of photons with wavelength �0 = 656.3 nm (first line of the Balmer series,H↵).
Doppler shifted H↵ Some fully-accelerated beam particlesH�f undergo the electron detachment
process:H�
f +H2 ! H0f (n = 3) +H2 + e� (3.2)
The fast neutral can thus decay from the excited state n = 3 to n = 2, emitting a photon at�0 = 656.3 nm. However, due to the motion of the neutral with respect to the laboratory frame,the emitted light is Doppler-shifted of �� :
�� = ��0v
ccos✓ (3.3)
where �0 is the proper wavelength (in the particle frame), ✓ is the viewing angle of the telescopewith respect to the beam axis, v is the velocity of the particle and c the speed of light in vacuum[20].The entity of the Doppler shift is proportional to the total energy of the particle (�� ⇠ v ⇠
28

pUex + Uacc). Moreover, line broadening will occur as a result of a distribution of ✓ (natural
divergence of the beam) and a distribution of the beam particles energy around the mean valuee · (Uex + Uacc).
Stripping Part of the negative ions are neutralized between the PG and the GG via the reaction:
H�f +H2 ! H0
f +H2 + e� (3.4)
This process is called stripping ; the fast neutrals produced are then excited by collisions with thebackground gas of the tank to the level n = 3 (as in Eq. 3.1) and subsequently relax to n = 2.The light emitted is partially Doppler-shifted: indeed the stripped particles do not have the fullbeam energy (Uex + Uacc), but usually only the energy of the extraction gap (vstrip ⇠
pUex).
The stripping peak is located very close to the shifted peak and partial overlap is present, asshown in Figure 3.9; its shape is not clear and thus a stable evaluation of its area, proportionalto the amount of stripped particles, is an open issue.
BES spectra evaluation is a powerful method to estimate the line-integrated beam divergence andthe stripping losses in the accelerator. The line-integrated beam divergence, namely the spreadof beam particle trajectories around beam axis, can be measured starting with an estimate of the(1/e)�width (e-folding width) of the Doppler-shifted line; then some corrections shall be appliedin order to consider undesirable phenomena that a↵ect the line width. A detailed description ofthe code for evaluating these spectra is provided in the next chapter.
3.2.2 mini-STRIKE calorimeter
As introduced in section 1.3, an ITER full-size plasma source of negative hydrogen ions is beingbuilt in Italy (Padua), named SPIDER ([21]). A section view of the experiment is shown inFigure 3.10: it consists mainly of a the negative ion source, a diagnostic calorimeter namedSTRIKE (Short-Time Retractable Instrumented Kalorimeter Experiment) to study the beam,and finally the ion dump, to absorb the beam.
The main aim of STRIKE is to characterize the beam in terms of beam uniformity and divergenceduring short operations (several seconds) [22] [23]. The instrumented calorimeter STRIKE ismade of 16 1D Carbon-Fibre-Composite (CFC) tiles and it is able to intercept the whole ionbeam; the footprint pattern will be observed from the rear side (to avoid plasma light) by infraredcameras.
A small-scale version of the such instrument, named mini-STRIKE , has been built by Con-sorzio RFX (Italy): mini-STRIKE consists of only 2 CFC tiles (120 x 90 x 20 mm3) which areobserved in the rear side (the side not exposed directly to the beam) by a thermal camera.In the last few years mini-STRIKE has been used as a diagnostic in test facilities equippedwith negative ion source: BATMAN test facility (IPP-Garching, Germany, [24] [25]) and thetest stand of the negative-ion-driven neutral beams for the LHD stellarator (NIFS-Toki, Japan,[26]). This work studies, among other things, the most recent results obtained at BATMANwith mini-STRIKE (February 2014 - May 2015).
29

Figure 3.10. Cut-out view of SPIDER experiment; the STRIKE calorimeter is made of 16 CFC tiles as the one shownon the right.
Experimental setup at BATMAN
The experimental setup of mini-STRIKE at BATMAN is shown in Figure 3.11a.The two CFC tiles are vertically arranged and housed in a dedicated frame which is connectedto a supporting arm attached to the large BATMAN vacuum flange: both tiles are verticallyexposed to the beam at a position 1 m downstream with respect to the extraction system, inorder to avoid any carbon contamination of the source [24].
At that location, the beamlets are expected to superimpose (due to their divergence), leading toa quite flat (”bell-shaped”) beam profile. To re-create a beamlet pattern on mini-STRIKE , acopper mask (actively cooled) with several holes is positioned just in front of the tiles: thebeam is intercepted by the mask and consequently filtered, so that a beamlet pattern (SPIDER-like) hits the calorimeter.The copper mask is 10 mm thick and one thermocouple monitors its temperature. The cooling-water flow is constant before and during beam extraction; the flow is measured together with thetemperature of the input and output water, so that calorimetric measurement can be performed.The current hole-geometry on the mask (since May 2014) is shown in Figure 3.11b: 24 holes with7 mm diameter and 28 mm pitch each. In the very first experimental campaign of mini-STRIKEin BATMAN (autumn 2012), the pattern was much simpler: only 8 holes, with 10 mm diameterand 30 mm pitch each, arranged as a ”C”.
Figure 3.12 shows the view cone of the thermal camera that observesmini-STRIKE . During eachpulse a IR-camera video is recorded; the start is externally triggered 3.2 s before the extractionof the beam and the sampling time is 20 s at 25 frames per second.
30

(a) (b)
Figure 3.11. mini-STRIKE setup at BATMAN test facility: rear side (a) and beam side (b) of the calorimeter.
Figure 3.12. mini-STRIKE setup at BATMAN test facility: view-cone of the thermal camera which observes the rearside of the calorimeter (horizontal section of the vacuum chamber).
31

3.2.3 Copper calorimeter
The BATMAN test facility is equipped also with a copper calorimeter that intercepts the beam atthe end of the vacuum vessel, approximately 1.7 m downstream of the grounded grid (see Figure3.12) [18]. In Figure 3.13 the side of the calorimeter exposed directly to the beam is shown: itconsists of a water-cooled copper panel (60⇥ 60 cm2) with specially-designed thermally-isolatedareas where thermocouples are embedded. 29 thermocouples are arranged as a cross and thedistance between two consecutive thermocouples is 4 cm; during the beam phase, the temperaturetime trace of each thermocouple is recorded and then the temperature �T between the start andthe end of the beam is computed. Since each thermocouple is thermally isolated from the rest ofthe calorimeter, the local beam power density can be calculated from the measured �T .
Figure 3.13. BATMAN copper calorimeter, side exposed directly to the beam. The dashed lines correspond to thecentral vertical and horizontal planes of BATMAN.
Typical vertical and horizontal power density profiles measured by the calorimeter are shown inFigures 3.14a and 3.14b: evaluation of the profiles, performed up to now with a simple Gaussianfitting, leads to an estimate of both the beam divergence at the calorimeter position and thetotal beam power impinging on the plate. The details of the fitting procedure are provided inthe next chapter.
32

(a)
(b)
Figure 3.14. Typical beam profiles, along the vertical and horizontal direction, on the copper calorimeter; the magneticsetup is z = 9 UP. Another example can be found in [19]
33


4 Software development and introductoryremarks
The first part of the chapter provides a detailed description of the analysis of beam diagnostics:the (1) BES spectra, the (2) mini-STRIKE thermal videos and finally (3) the thermocouplessignals of the copper calorimeter. For diagnostics (1) and (3) a new code has been written,following the major steps of existing old programs; for diagnostic (2), several improvements andmodifications were applied to more recent code (2014). A Graphical User Interface (GUI) wasfurthermore developed: its aim is to make the user able to handle and access easily the resultsof all the beam diagnostics simultaneously.The second part of the chapter introduces some important remarks about data analysis, necessaryto understand and interpret correctly the results reported in the following.
4.1 Software development for data analysis
4.1.1 Beam Emission Spectroscopy
Each BES spectrum collected at BATMAN is normally evaluated by a Fortran-code in real time,so that the main outcomes of the fits are available online right after the end of the beam. Thiscode has however a disadvantage: the user is given only the final results of the fits and all theintermediate steps and interpolations are not accessible.In order to better understand the functioning of the code and eventually to introduce some mod-ifications and improvements, a software in IDL (Interactive Data Language) has been developedas part of the thesis work: it basically follows the major steps of an existing Fortran-code (theso-called standard evaluation of BES spectrum) but it permits a better control on the entirefitting procedure.The code is organized in three steps: (1) background subtraction from the spectrum, (2) ap-proximation of the H↵ Doppler-shifted line (test of di↵erent fitting functions) and finally (3)derivation of beam divergence from the width of the line.
Step 1 - Background subtraction Early studies on the spectra from Beam Emission Spec-troscopy ([20]) showed that, superimposed on spectra lines, there is a background which is byno means constant throughout the spectrum: it was found to be structured. The origin of thebackground is not fully clarified but it is likely the sum of several di↵erent phenomena, as forinstance H↵-light reflection on the walls of the vacuum tank.Hence, a simple polynomial fit is performed on the peak-free zones of the spectrum: the resultis an almost flat profile, a straight line with negligible slope. Such line is then subtracted fromthe spectrum.
35

Step 2 - Approximation of the Doppler line: choice of the function The most natural choiceto fit the Doppler-shifted bell-shaped line is a Gaussian.
However, early experimental results ([20]) showed that a Gaussian fit to the peak is much betterif not a single Gaussian is used but a sum of a narrow Gaussian and a second one with half theintensity and width 2.5-times the width of the first one: this fact suggests that there is a beamhalo created by the edge region of the extraction holes. Even if this way gives a better fit ofthe peak, it contains too much arbitrariness both in the fit and in the evaluation of fit results:indeed the beam divergence, in principle, could be evaluated either from the e-folding width ofthe narrower line or from a sort of ”weighted sum” of the e-folding widths of both.
Another possible function for the Doppler-shifted peak approximation is the so-called Pseudo-Voigt, a linear combination between a Lorentzian L(x) ([27]) and a Gaussian G(x) ([28]):
V (x) = ⌘ · L(x;x0,!) + � ·G(x;x0,!) (4.1)
where the two functions are
L(x) =1
⇡!
1
1 +�x�x0!
�2 (4.2)
and
G(x) =
rln2
⇡
1
!exp
(�ln2
✓x� x0
!
◆2)
(4.3)
while !, x0, ⌘ and � are free parameters.As part of the thesis work, three di↵erent fitting alternatives have been explored, with the aimof finding the best choice:
1. Gaussian fit with symmetric thresholds (30% on the left and 30% on the right), thatis considering solely the portion of the peak exceeding 30 % of its maximum, in order toavoid background fluctuations. This is the choice made in the o�cial code used at IPP-BATMAN (known as standard evaluation). In some experimental situations the strippingpeak, located on the right of the Doppler-shifted line, can contaminate the right-half ofsuch a line: the 30% threshold can be not enough to exclude this contamination from thefitting range, which leads to a worsening of the fit quality (usually a slight over-estimateof the line width).
2. Gaussian fit with asymmetric threshold (30% on the left and 60% on the right) inorder to exclude the zone of the peak contaminated by the stripping events.
3. Pseudo-Voigt interpolation with asymmetric thresholds (10% on the left and 30%on the right): this function is usually more precise than the Gaussian in interpolating theshifted peak. Moreover, the fit is very stable since the outcomes remain basically invariantif the thresholds for the fitting range are lowered or increased.
Figure 4.1 shows in detail the H↵ shifted peak (measured by BES 4, the second telescope fromthe top) interpolated by a Gaussian with symmetric threshold (30% - 30%) and a Pseudo-Voigt.The two function are quite superimposed in the central region (above the 30% of the peak),while along the tails the Pseudo-Voigt approximation is better; these considerations are validfor the majority of the beam pulses.
In Figure 4.2 the BES divergence (for all the five LOS) from method (2) and (3) is plottedagainst the divergence from the standard evaluation (method 1); data refer to a typical day of
36

Figure 4.1. Comparison between two interpolating functions for the H↵ Doppler-shifted peak: the Gaussian withsymmetric thresholds 30% - 30% (green line) and the Pseudo-Voigt with thresholds 10% - 30% (red line).
Cs conditioning in Hydrogen. If the Gaussian with asymmetric thresholds or the Pseudo-Voigtis chosen as fitting function, the divergence is slightly lower than with the standard evaluationand a better agreement with data exists along the tails of the peak (Figure 4.1).The di↵erence in divergence between method (2) or (3) and method (1) is however very smalland uniform along the range [5 ÷ 8]� : the value from method (1) is basically compatible withthose from (2) and (3) within the error bars. Furthermore no significant variations are found inthe BES intensity if the fitting function is changed.
As a consequence of these observations, the Gaussian with symmetric thresholds (30%- 30%) has been chosen as the interpolating function for the H↵ Doppler-shifted peak, inagreement with the IPP-BATMAN standard evaluation.
Step 3 - Derivation of the divergence from the line e-folding width As already set out inthe previous chapter, the H↵ line is Doppler shifted by a quantity �� [20]:
�� = ��0v
ccos ✓
where �0 is the wavelength of the radiation in the frame of the emitter particle (energetic H0)moving with speed v with respect to the laboratory frame, while ✓ stands for the viewing angleof the BES telescope with respect to the beam axis. Both v and ✓ have a distribution and letbe v0 and ✓0 the mean values; they correspond to the mean Doppler-shift ��0:
��0 = ��0v0ccos ✓0
.The di↵erential deviations dvk and dv? = v0d✓ will thus result into a deviation from the meanshift of ([20])
� ⌘ d(��) = ��0
✓dvk
v0+ tan ✓0d✓
◆(4.4)
37

Figure 4.2. BES divergence (LOS 1 to 5) from Pseudo-Voigt fit (red points) or Gaussian fit with asymmetric thresholds(blue points), plotted against the divergence obtained with the standard evaluation. Data refer to a Cs-conditioning day in Hydrogen.
which can be simplified considering all the particles at the same energy:
� = ��0 tan ✓0d✓ ⌘ �app (4.5)
The quantity �app is known as apparent e-folding-width of the Doppler-shifted H↵ line.The experimental e-folding-width of the line, �fit, is always greater than �app: indeed othere↵ects induce a further broadening of the line, and they are schematized in Figure 4.3.
Figure 4.3. Contributions to the e-folding-width of the Doppler-shifted H↵ line.
These contributions are caused (a) by the fact that the two halves of the GG are tilted (�f ), (b) bythe light-collection system (�coll) and finally (c) by the spectrometer itself (�instr). Consequently
38

the experimental width is the convolution:
�fit =q
�2f + �2coll + �2instr + �2app (4.6)
The next paragraphs provide a brief description of each of these e↵ects.
(a) Line broadening by beam focusing The LAG (see Figure 3.5) can be roughly approximatedas a circular source with diameter 2R and focal length f ; then the half-angle of the beam becomes✏f = R/f (see Figure 4.4). If ✓0 is the angle between the viewing direction and the beam axis,then the viewing angles will spread from ✓0 � ✏f to ✓0 + ✏f . The correspondent spread of theDoppler shifted line can be easily computed ([11]) as
�f = ✏f��0 tan ✓0 (4.7)
The aforementioned focusing is, in BATMAN, provided by using tilted grids; the tilt angle is bydefinition the total angle of the beam (namely 2✏f ) and its value is 1.75�. A simple conceptualscheme is shown in Figure 4.4.
Figure 4.4. Conceptual scheme of the line broadening due to beam focussing (tilted grids).
(b) Line broadening by the light-collection system Any light-collecting system needs a finitecross-section and angular range to work: thereby the viewing angle has an unavoidable spread.Let ✏coll be the angle in the plane of the beam axis and viewing axis (horizontal plane): this willlead to a line spread of
�coll = ✏coll��0 tan ✓0 (4.8)
For the BES telescopes installed in BATMAN, the exact value is ✏coll = 0.22 rad.
(c) Line broadening by the spectrometer A line broadening is caused finally by the instrumentitself; the spectrometer used in BATMAN, an Andor (Oxford Instruments), introduces a linebroadening of �instr = 0.126 nm.
Finally, the apparent width �app is computed using Eq. 4.6 and then the beam divergence d✓ iscalculated with Eq.4.5.
39

4.1.2 mini-STRIKE
An automatic analysis procedure has been set up to analyze the videos recorded by the thermalcamera that watches mini-STRIKE : the code is written in IDL (Interactive Data Language)and it has been amply improved during the thesis work. In the following, the features of thetemperature 2D-profile on the masked tiles will be improperly referred to as the ”beam pattern”.Each thermal video is decomposed in 500 frames (FPF images), which constitute the input ofthe code: the algorithm performs a complete parametrization of the beam as it is seen in therear side of the tiles, and a list of significant ”beam parameters” is provided as output.
A short overview of the most important procedure steps is here set out; a more detailed descrip-tion can be found in [29].
� Step 1 - Background subtraction and perspective correction Firstly the programestimates the background image by averaging the first 25 frames of the video (when nobeam is still extracted from the source): the background is then subtracted from all theremaining frames.It has been observed that when the beam starts, the tile temperature increase - on thefront side - can be seen thanks to a reflection on the rear side of the copper mask (lowerpart of the thermal image): this frame is identified as the starting frame. The end of thebeam takes place usually 4 s after its start; on the third frame before the end of the beamall the interpolations are performed. Figure 4.5a shows a typical thermal image used asinput to the program.Moreover a perspective correction is applied to the image because of the viewing angle ofthe thermal camera.
� Step 2 - Approximation of the 2D thermal pattern The fitting phase is articulatedin three steps.(1) To begin with, on each of the 36 beamlets a 2D-Gaussian fit is performed: the 2D-location of the 36 centers is the input of the next step ( (xi, yi) with i = 1...36 ).(2) A user-defined function, the superimposition of 36 Mod-Hubbert functions (Eq. 4.9),is used to approximate the entire thermal pattern of both tiles simultaneously.
f(x, y) =36X
i=1
ai ·cosh
✓q[� · (x� xc,i)]
2 + [� · (y � yc,i)]2◆��q
(4.9)
Both � and q are related to the width of the single beamlet and they are supposed tobe the same for all the beamlets: indeed the 36 holes of the mask are identical and thethermal properties of the tiles are spatially homogeneous [29].
(3) Finally an asymmetric function (Eq 4.13) is adopted to interpolate the 36 amplitudesa1...a36 : it is simply the product of a parabola in the horizontal direction (Eq. 4.10) anda skewed Gaussian in the vertical direction (Eq. 4.11, see [29]), namely a Gaussian withnon-zero skewness.
p(y) = ay2 + by + c (4.10)
g(x) = exp
(�1
2
✓x� x0
!
◆2)
·1 + erf
✓↵x� x0p
2!
◆�(4.11)
40

(a) (b)
Figure 4.5. (a): Thermal image of mini-STRIKE , input of the code. (b): Parametrization of the beam behind thetiles (output of the code); the vertical section of the beam fitting function is also shown.
erf(x) =2p⇡
Z x
0e�t2dt (4.12)
h(x, y) = g(x) · p(y) (4.13)
This choice was driven by the empirical observation that the vertical profile of the beamwas slightly asymmetric ([29]); the observation is confirmed by the most recent resultscontained in this dissertation. Such function has been chosen because it describes quitewell the 2D temperature map of the beam on the rear side of the tiles; it does not have aspecific theoretical meaning.
Results retrieval: development of a GUI software
A Graphical User Interface (GUI), in IDL, has been developed in order to access easily andquickly the huge amount of results of beam diagnostics, in particular of mini-STRIKE ; morethan a thousand beam pulses have been analyzed.
Figure 4.6 shows the main interface of the GUI software.The user must select an experimental scan and two parameters, an x-parameter and a y-parameter; then the software automatically searches for the database, retrieves data and finallyplots the results in a graphic window. Typical quantities plotted as y-parameters are source pa-rameters (the source pressure, the acceleration and extraction voltages, the bias current, etc...),calorimetric parameters (from mini-STRIKE , like the vertical position of the maximum heat-flux, or from the copper calorimeter, like the beam divergence or the vertical position of the
41
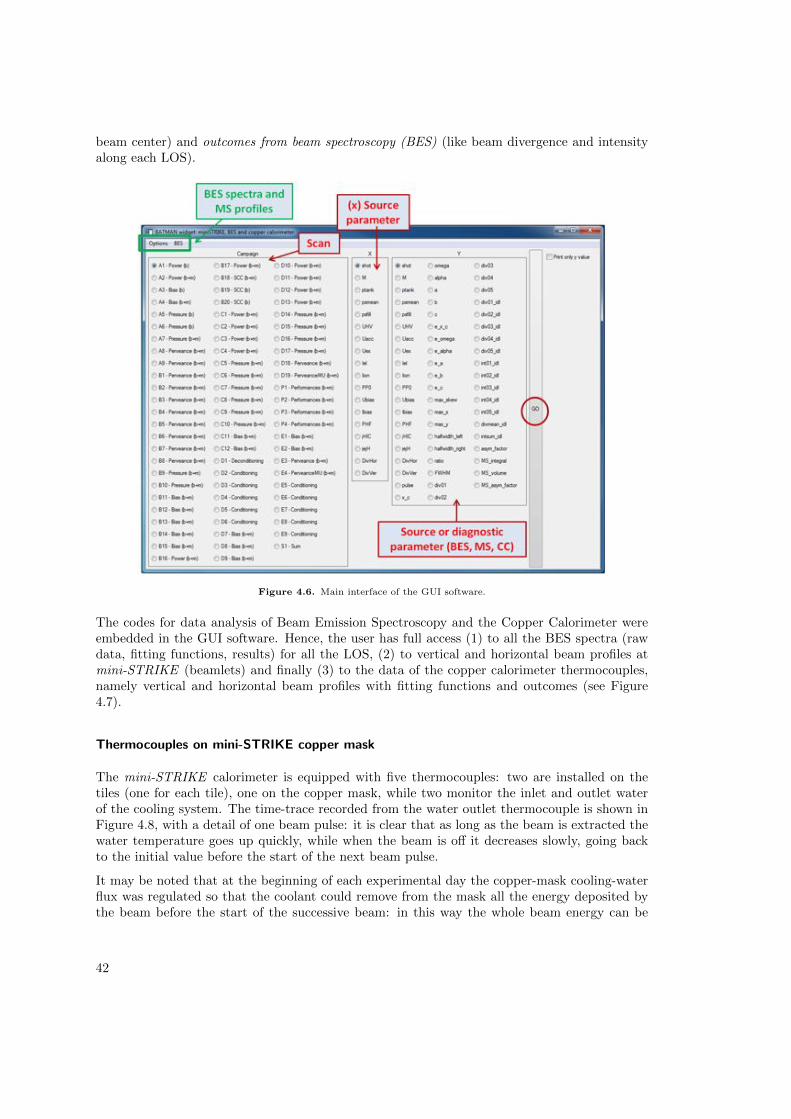
beam center) and outcomes from beam spectroscopy (BES) (like beam divergence and intensityalong each LOS).
Figure 4.6. Main interface of the GUI software.
The codes for data analysis of Beam Emission Spectroscopy and the Copper Calorimeter wereembedded in the GUI software. Hence, the user has full access (1) to all the BES spectra (rawdata, fitting functions, results) for all the LOS, (2) to vertical and horizontal beam profiles atmini-STRIKE (beamlets) and finally (3) to the data of the copper calorimeter thermocouples,namely vertical and horizontal beam profiles with fitting functions and outcomes (see Figure4.7).
Thermocouples on mini-STRIKE copper mask
The mini-STRIKE calorimeter is equipped with five thermocouples: two are installed on thetiles (one for each tile), one on the copper mask, while two monitor the inlet and outlet waterof the cooling system. The time-trace recorded from the water outlet thermocouple is shown inFigure 4.8, with a detail of one beam pulse: it is clear that as long as the beam is extracted thewater temperature goes up quickly, while when the beam is o↵ it decreases slowly, going backto the initial value before the start of the next beam pulse.
It may be noted that at the beginning of each experimental day the copper-mask cooling-waterflux was regulated so that the coolant could remove from the mask all the energy deposited bythe beam before the start of the successive beam: in this way the whole beam energy can be
42

Figure 4.7. GUI secondary windows, with mini-STRIKE 1D-profiles and BES spectra.
reconstructed from the temperature time-trace with calorimetric calculations.In order to study some basic correlations between the �T of the outlet cooling water and thebeam properties, namely the beam current or divergence, an IDL software has been developed: ittakes as input the time-trace of the thermocouple and gives as output the di↵erence in tempera-ture �T between the begin and the end of each steep rise. The results of this study are howevernot presented in this dissertation since they are not relevant to the topic of the dissertation,namely beam property characterization.
Figure 4.8. Temperature time-trace for the cooling water coming from the mini-STRIKE copper mask; a detail of asingle beam pulse is also shown.
43

4.1.3 Copper calorimeter
The analysis of the copper calorimeter thermocouple signals is in BATMAN performed by aFortran code. A similar software in IDL has been developed, with the aim of understandingbetter and more deeply all the steps of the code and in case introduce some improvements.
The program takes as input the temperature increase �T due to the beam measured by each ofthe 29 thermocouples: Figures 3.14a and 3.14b show such values (red points), which are simplyinterpolated with two 1-D Gaussian. Finally, from the temperature increase one can evaluatethe power density (W/m2) for each thermocouple.The relation between the width of each Gaussian (the standard deviation, �) and the divergenceof the beam is not straightforward, since the beam is the superimposition of many beamlets;the divergence of the beam is estimated by a comparison of the measured beam profile with ageometrical beam model using the IPP-DENSB code . This code assumes that each beamletemitted by the grounded grid has a Gaussian profile where the width of the Gaussian is given bythe assumed beamlet divergence: the calibration relation between the beam divergence (namelyof each beamlet) at the grounded grid (GG) and the beam standard deviation � at the coppercalorimeter is plotted in Figure 4.9.A much simpler but wrong approach would be to consider the divergence as the angle underwhich the e-folding half-width of the beam profile at the calorimeter is seen from the GG (reddashed line in Figure 4.9); moreover this choice would lead to a general overestimation of theactual divergence.
Figure 4.9. Calibration between the beam standard deviation at the copper calorimeter and the corresponding beamdivergence at the GG (from IPP-DENSB code).
In the original Fortran code a 2D-Gaussian fit, instead of two 1D-Gaussian interpolations, wasperformed; however, with the latter choice the residuals from experimental data are found tobe lower and the data-fit agreement is in general much better. Anyway the fit results obtainedwith the two methods, namely the vertical and horizontal standard deviations, positions of thecenter, amplitudes etc.. are usually compatible within the error bars.
44
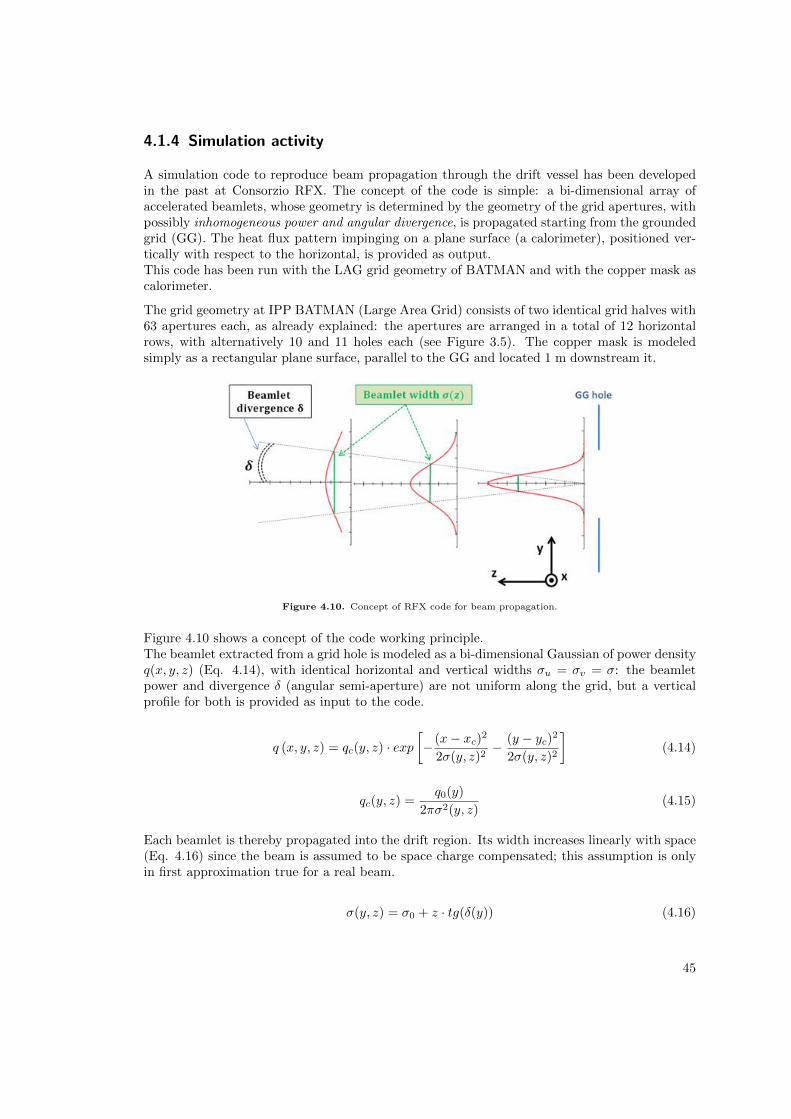
4.1.4 Simulation activity
A simulation code to reproduce beam propagation through the drift vessel has been developedin the past at Consorzio RFX. The concept of the code is simple: a bi-dimensional array ofaccelerated beamlets, whose geometry is determined by the geometry of the grid apertures, withpossibly inhomogeneous power and angular divergence, is propagated starting from the groundedgrid (GG). The heat flux pattern impinging on a plane surface (a calorimeter), positioned ver-tically with respect to the horizontal, is provided as output.This code has been run with the LAG grid geometry of BATMAN and with the copper mask ascalorimeter.
The grid geometry at IPP BATMAN (Large Area Grid) consists of two identical grid halves with63 apertures each, as already explained: the apertures are arranged in a total of 12 horizontalrows, with alternatively 10 and 11 holes each (see Figure 3.5). The copper mask is modeledsimply as a rectangular plane surface, parallel to the GG and located 1 m downstream it.
Figure 4.10. Concept of RFX code for beam propagation.
Figure 4.10 shows a concept of the code working principle.The beamlet extracted from a grid hole is modeled as a bi-dimensional Gaussian of power densityq(x, y, z) (Eq. 4.14), with identical horizontal and vertical widths �u = �v = �: the beamletpower and divergence � (angular semi-aperture) are not uniform along the grid, but a verticalprofile for both is provided as input to the code.
q (x, y, z) = qc(y, z) · exp� (x� xc)2
2�(y, z)2� (y � yc)2
2�(y, z)2
�(4.14)
qc(y, z) =q0(y)
2⇡�2(y, z)(4.15)
Each beamlet is thereby propagated into the drift region. Its width increases linearly with space(Eq. 4.16) since the beam is assumed to be space charge compensated; this assumption is onlyin first approximation true for a real beam.
�(y, z) = �0 + z · tg(�(y)) (4.16)
45

As a consequence, the beamlet power density profile is smoothed and it broadens during thepropagation (see Figure 4.10 and Eq.4.16).Finally, a vertical deflection angle (↵FF ) can be set for the whole beam, in order to roughlyreproduce the vertical deflection caused by the magnetic filter field.
Figure 4.11. Typical 2D-pattern of the beam power flux [W/m2] at the copper mask of mini-STRIKE .
The output of the code is the beam power density 2D-pattern impinging on the copper mask ata given distance from the grid, due to the superimposition of all the 126 beamlets. Figure 4.11shows a typical power flux pattern provided by the code, looking in the beam direction: the bluelines indicate the edges of the two CFC tiles, located behind the copper mask. For this example,the beam is provided with an inclination of ↵FF = 3.0� and both divergence and power profilesare uniform: the beam divergence (namely the divergence of the beamlets) is 3.6� and the poweris 100 Watt for all the grid apertures.
Sensitivity tests In order to check the reliability of the code and the influence of each parameter(deviation angle, divergence and power profiles,...) on the final beam (vertical) profile, severalsensitivity tests have been performed. A vertical inhomogeneity in the divergence or beamletpower has been usually introduced: this inhomogeneity is quantified in percentage. When theinhomogeneity is for example 20%, then the divergence of the top row of beamlets is 20% biggerthan the value at the center of the grid (at y=0) and similarly the divergence of the bottom rowof beamlets is 20% lower than that; the opposite happens with a -20% inhomogeneity.
Figures 4.12 and 4.13 show the results of the sensitivity tests.The vertical position of maximum heat flux (the ”beam center”, as it will be explained in thefollowing) has a deviation from the center of the calorimeter proportional to the deviation angle↵FF , as expected; the shift is upwards if ↵FF is positive, downwards if ↵FF is negative (seeFigure 4.12a). In the case that no inhomogeneities are introduced and the beamlet divergence isgradually lowered, for values below 3.0� the beamlets are so well-focused that the contributionsof the two half grids are distinguishable (two peaks): indeed the beamlets of the lower grid andthose of the upper grid get only marginally superimposed (Figure 4.12b).When the divergence inhomogeneity is increased, the beam center moves towards the region of
46

lower divergence: upwards, if the inhomogeneity is more and more negative, or downwards, if itis more and more positive. Consequently, the vertical beam profile becomes very steep on oneside (Figure 4.13b): the same tendency happens whether the power inhomogeneity is changed,but the impact on the beam vertical shape is less significant (Figure 4.13a).
(a) (b)
Figure 4.12. Sensitivity tests on the RFX code for beam propagation: study of the e↵ect of ↵ (left) and beamletdivergence (right).
(a) (b)
Figure 4.13. Sensitivity tests on the RFX code for beam propagation: study of the e↵ect of beamlet power disuniformity(left) and divergence disuniformity (right).
Finally it is important to point out that, from a physical point of view, the local variation ofthe beamlet power is always accompanied by a variation of the beamlet divergence: indeed thepower and divergence profiles at the GG are strongly correlated due to the Child-Langmuir law(see section 2.4.2).
47
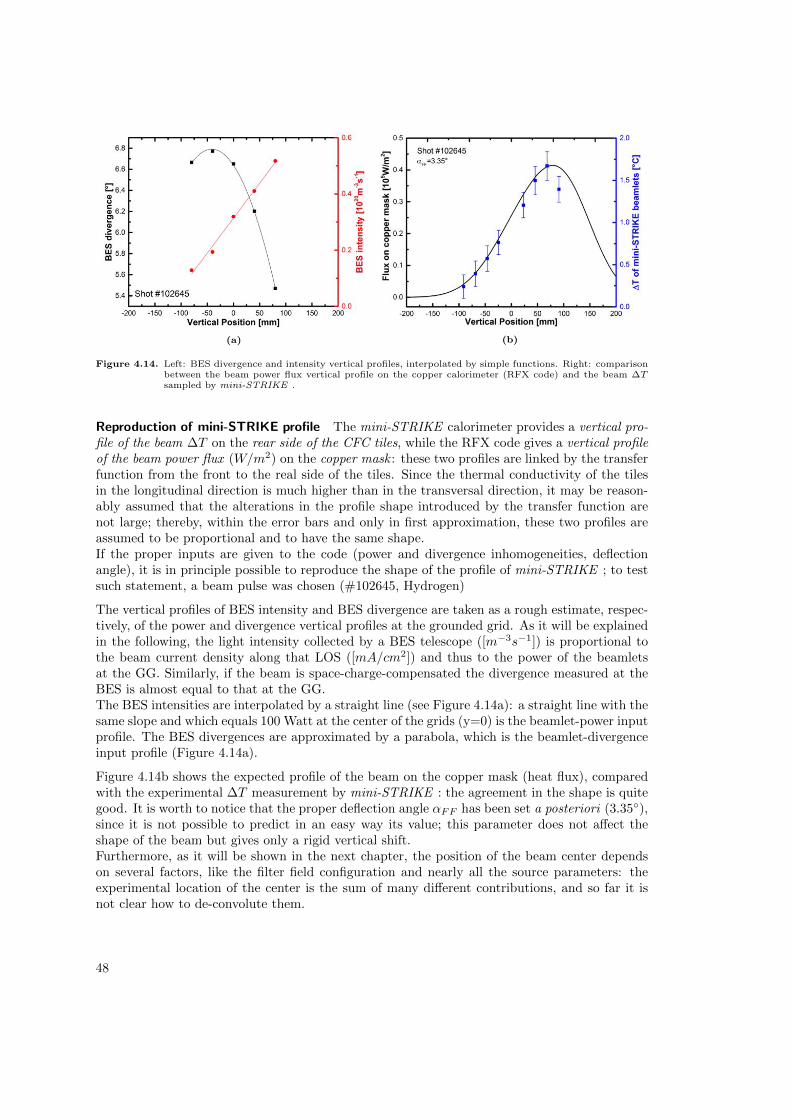
(a) (b)
Figure 4.14. Left: BES divergence and intensity vertical profiles, interpolated by simple functions. Right: comparisonbetween the beam power flux vertical profile on the copper calorimeter (RFX code) and the beam �Tsampled by mini-STRIKE .
Reproduction of mini-STRIKE profile The mini-STRIKE calorimeter provides a vertical pro-file of the beam �T on the rear side of the CFC tiles, while the RFX code gives a vertical profileof the beam power flux (W/m2) on the copper mask : these two profiles are linked by the transferfunction from the front to the real side of the tiles. Since the thermal conductivity of the tilesin the longitudinal direction is much higher than in the transversal direction, it may be reason-ably assumed that the alterations in the profile shape introduced by the transfer function arenot large; thereby, within the error bars and only in first approximation, these two profiles areassumed to be proportional and to have the same shape.If the proper inputs are given to the code (power and divergence inhomogeneities, deflectionangle), it is in principle possible to reproduce the shape of the profile of mini-STRIKE ; to testsuch statement, a beam pulse was chosen (#102645, Hydrogen)
The vertical profiles of BES intensity and BES divergence are taken as a rough estimate, respec-tively, of the power and divergence vertical profiles at the grounded grid. As it will be explainedin the following, the light intensity collected by a BES telescope ([m�3s�1]) is proportional tothe beam current density along that LOS ([mA/cm2]) and thus to the power of the beamletsat the GG. Similarly, if the beam is space-charge-compensated the divergence measured at theBES is almost equal to that at the GG.The BES intensities are interpolated by a straight line (see Figure 4.14a): a straight line with thesame slope and which equals 100 Watt at the center of the grids (y=0) is the beamlet-power inputprofile. The BES divergences are approximated by a parabola, which is the beamlet-divergenceinput profile (Figure 4.14a).
Figure 4.14b shows the expected profile of the beam on the copper mask (heat flux), comparedwith the experimental �T measurement by mini-STRIKE : the agreement in the shape is quitegood. It is worth to notice that the proper deflection angle ↵FF has been set a posteriori (3.35�),since it is not possible to predict in an easy way its value; this parameter does not a↵ect theshape of the beam but gives only a rigid vertical shift.Furthermore, as it will be shown in the next chapter, the position of the beam center dependson several factors, like the filter field configuration and nearly all the source parameters: theexperimental location of the center is the sum of many di↵erent contributions, and so far it isnot clear how to de-convolute them.
48

4.2 Introductory remarks on the experimental results
4.2.1 Relation between BES intensity and current density
This section explains in detail how the beam interacts with the background gas, describing alsothe relation between the electrically measured extracted ion current density jex, the total lightemitted by the beam and the total light collected by the BES: here and in the following the term”light” (or ”light emitted by the beam”) will refer to the Doppler-shifted H↵ light only.The main conclusions that will be discussed in detail are as follows:
� The light emitted by the beam is linearly proportional to the electrically measured ioncurrent density jex.
� The light collected by the five Beam Emission Spectroscopy telescopes is linearly propor-tional to the ion current density only within short current intervals: indeed the dependenceis globally parabolic.
To begin with, a brief theoretical description of the light emission mechanism is given.
Light emission mechanism: H↵ Balmer line The H↵ emission is a two step process: firstlya negative ion of the beam loses its electron by collision with an atom of the background gas(electron detachment, Eq. 3.1), ending in an excited state (n = 3). It consequently decays to thelower state n = 2 by emission of one photon: such spectral line, usually known as H↵ Balmerline, is Doppler-shifted because of the motion of the atom.The rate of electron detachment with final excited state n = 3 is:
� = n�beam · vb · �det,3s(E) · n0
bk (4.17)
where n�beam and n0
bk stand respectively for the mean beam density and the density of backgroundgas, vb is the mean velocity of a beam ion while �det,3s(E) is the electron detachment cross sectionwith final state n = 3. This cross section is in principle a function of the energy of the beamparticle.
Figure 4.15. Cross section of electron detachment of H� colliding with H or H2, as a function of H� energy [30].
49

Figure 4.15 shows the cross section of the general process
H� +X ! H(n, l) +X(⌃) + e (4.18)
namely the electron detachment of H� colliding with H or H2 (X = H or X = H2; ⌃ denotesall final and bound states of the target), as a function of H� energy: both the total cross sectionfor Balmer-↵ emission (�1,B↵) and for electron detachment with final state n = 3 (�1,3s(H2)) areflat in the typical ion energy range at BATMAN ([10÷ 22] keV excluding the stripped particles,which are less energetic).Apart from pressure scans, in a typical experimental scan the pressure in the tank is main-tained constant by the vacuum-pumps system: hence the background gas density n0
bk is constanttoo.
As a result of these observations, the rate � at which the H↵ photons are emitted depends,during a typical scan, solely on the product n�
beam · vb and thus on the extracted ion currentdensity jex = n�
beam · e · vb : the intensity of emitted H↵ light is then expected to be linearlyproportional to the extracted ion current density jex.
Light collection mechanism: BES telescopes BATMAN test facility is equipped with fiveBES telescopes, arranged vertically as shown previously in Figure 3.8. Each telescope collectsthe light along its line of sight, which is roughly a cone, for an integration time of 1 s.At fixed extraction and acceleration voltages, the amount of Doppler-shifted H↵ light collectedby the telescope is proportional to the integral of the Doppler-shifted H↵ line in the spectrum or,equivalently, to the height of such line; the integral and the height of the line contain essentiallythe same piece of information. The height of the Doppler-shifted H↵ line was chosen asthe quantity to be studied, and it is conventionally referred to as BES intensity.
Figure 4.16. Sum of the five BES intensities as a function of the electrically measured ion current density: the depen-dence is found to be parabolic.
50

It is important to point out that the total amount of beam light collected by the five BES(proportional to the sum of the five BES intensities) is proportional but not equal to the totalamount of light emitted by the beam (namely � of Eq. 4.17), since each telescope has a finiteand fixed cone-of-view. The fraction of collected light depends on the optical properties of thebeam, namely on its divergence: the more focused the beam, the higher the fraction of beam”seen” by each BES channel along its cone-of-sight and thus the higher the fraction of collectedlight.
Figure 4.16 shows the sum of the five BES intensities as a function of the electrically measuredion current density, for a series of scans performed at the same tank pressure (Ptank = 2.0 · 10�4
mbar): the departure from a linear dependence is explained exactly with the mechanism hereexposed.
If the current is increased, and the voltages are kept constant, the normalized perveance ⇧/⇧0
will increase, leading to a more and more focused beam in accordance with the parabolic relationbetween beam divergence and normalized perveance of Figure 2.11.Consequently, as the current increases, the global amount of light emitted by the beam mustincrease linearly with the current (Eq. 4.17) but, since the beam is more and more focused, thetotal amount of light collected by the BES increases faster (the dependence is by no means linear,but rather parabolic). The parabolic shape is not an accident, but stems from the parabolicrelationship between divergence and normalized perveance.
Finally, it may be noticed that since in a typical scan the explored range of current is not broad(usually not more than 10 mA/cm2), the dependence of the total light collected by the BESon the extracted current density appears linear (the details are given in the next chapter): thecurve in Figure 4.16 can indeed be locally approximated with a straight line.
4.2.2 Calorimetric measurements with mini-STRIKE and the coppercalorimeter
A calorimeter is, in general, a diagnostic tool that intercepts the beam and measures the localtemperature increase �T , due to the beam power, on various positions of its surface.The signal from a calorimeter is proportional to the energy flux of the beam, which is bydefinition the product between the beam current density jex and the total voltage of the extractionand acceleration system UHV = Uex + Uacc (proportional to the mean energy per ion).
The local �T bi-dimensional pattern is usually interpolated by a proper 2D function, a verticalskewed-Gaussian multiplied by a horizontal parabola in mini-STRIKE (as explained above) anda 2D-Gaussian for the copper calorimeter. The volume of the fitting function is measured in[�C · m2]. This can be calibrated to Watt and thus it becomes a rough estimate of the beampower; since the power divided by the extraction area equals the beam energy flux at the GG(jex · UHV ), then it is clear that the volume of the fitting function must be proportional to theextracted current density jex as long as the total grid voltage UHV is constant.
This relation should be true both for mini-STRIKE and the copper calorimeter; the volume ofthe skewed-Gaussian of the former (V olMS) and the volume of the 2D-Gaussian of the latter areexpected to increase roughly linearly with the electrically measured extracted ion current density
51

(Eq.4.19 and Eq.4.20). A detailed study of this topic is carried out in the next chapter.
V olMS ⇠ jex · UHV ⇠ jex (4.19)
V olCC ⇠ jex · UHV ⇠ jex (4.20)
4.2.3 Agreement between mini-STRIKE and BES
As explained in Section 4.2.1, the light emitted by the beam and collected along the line-of-sight of one BES telescope is proportional to the local ion current density (Eq. 4.17); similarly,the local temperature increase given by mini-STRIKE is proportional to the local energy fluxand therefore (at fixed UHV ) to the local current density. As a result, a linear proportionalityis expected between the vertical temperature profile on mini-STRIKE and the vertical BESintensity profile.
Figure 4.17 shows the vertical temperature profile given by mini-STRIKE and the vertical BESintensity profile for some beam pulses of a Cs-conditioning day. The agreement between thediagnostics is very good; moreover, it has been verified widely in several other experimentalconditions.
Figure 4.17. Beam vertical profile on mini-STRIKE and BES intensities for four beam pulses during a Cs-conditioningday in Hydrogen.
Figure 4.17 shows also the typical horizontal and vertical error bars. A relative error of 10 % istaken as uncertainty on the BES intensity, while the error on the vertical position comes fromgeometrical reasonings. Each telescope is indeed characterized by a cone-of-sight interceptingthe beam, with angular aperture of 0.6� : the diameter of the cone is 20 mm at the telescopeentrance (the diameter of the lens), while it is approximately 30 mm at the center of the beam
52

(about 50 cm from the lens). Then a ± 15 mm uncertainty is taken for the vertical position ofeach BES telescope.
4.2.4 Correlation between beam and extracted current vertical profiles
Figure 4.18 shows a schematic view of the extraction and acceleration system and of the BES-telescopes vertical array; it suggests that a correlation can be expected between the extractedcurrent distribution at the PG (a), the accelerated current distribution at the GG (b) and finallythe BES intensity (vertical) distribution at the telescopes location (c).The aim of this section is just to provide some basic observations and reasonings that bear outsuch hypothesis; a rigorous proof, indeed, can only be given by a complete simulation of beambehavior between the grids and then in the drift region.
Figure 4.18. Conceptual scheme of the correlation between the vertical profiles of the beam at di↵erent locations alongthe beam-line.
Figure 2.12 shows in detail the passage from (a) ! (b), namely the transmission of the ionsfrom the plasma source to the vacuum chamber. The ions, as previously described, enter a PGaperture and get accelerated in two steps; they form a beamlet, which has optical properties.In the hypothesis that the ion losses between the grids are small (low stripping) the amount ofions exiting the GG is similar to the current entering the PG: this reasoning suggests that thevertical profile of accelerated current density (GG) is similar in shape to that of the extractedcurrent density (PG).
Once in the vacuum, the repulsion between the beamlet charges induces an expansion of thebeamlet perpendicularly to its axis: the divergence � = �(z) increases. At the same time thecharges collide with the background gas (H2) and they create positive ions H+. At a certainlocation downstream of the GG, the positive space charge of the background compensates forthe negative space charge of the beamlet: the beamlet is said to be space charge compensated
53

and the divergence no longer increases. The same reasoning is valid for the beam, since it is thesuperimposition of many small beamlets.As a consequence of such dynamics, the divergence at the GG �(z = 0 m) and at the BEStelescope location �(z = 0.6 m) are functionally correlated; the same is true for the local currentdensity, which is a function of the beam divergence. Section 4.2.1 showed that the local currentdensity and BES intensity are proportional; therefore the beam accelerated current density profileat the GG (z = 0 m) is somehow correlated to the BES intensity vertical profile at the telescopeposition (approximately z = 0.6 m).
Putting together these considerations, the Doppler-shifted H↵ intensity distribution at the BESlocation reflects the distribution of the extracted current density at the PG : if a beam inhomo-geneity is observed by the BES, then a similar inhomogeneity is expected to existat the PG, namely the H� are extracted dis-uniformly along the grid. This is a crucial point,because every variation of the vertical beam inhomogeneity, namely a variation in the shape ofthe vertical beam profile, can be interpreted as a modification of the ion extraction conditionsat the PG.
Finally, it is worth to notice that horizontally, namely along the x-direction, no shift of the beamis expected: thereby all the following studies concern solely the behavior and the characterizationof the beam in the vertical (y) direction.
4.2.5 Definition of the beam center
The beam center is the spatial location of the maximum ion flux of the beam; it corresponds tothe position of maximum �T in the temperature pattern given by mini-STRIKE or, similarly,by the copper calorimeter.As a consequence of such definition, the position of the beam center depends primarily on twofactors:
� the inclination of the ion trajectories (v ⇥ B interaction between the beam particlesand the Filter Field)
� the vertical distribution of the current at the Plasma Grid
The inclination of the ion trajectories is basically due to a v ⇥ B force: the filter field indeedpenetrates the vacuum chamber and it induces a vertical shift on the ions, as it will be thoroughlydescribed in the next chapter. The deviation of the ion trajectory can be modified by changingthe filter field strength in the vacuum region: several filter field configurations are available inBATMAN (see Figure 3.3), and the net shift can be upwards or downwards.Furthermore, the ion trajectory inclination can be altered also using more massive ions (eg:Deuterium instead of Hydrogen): a higher mass will result into a higher Larmor radius (rL ⇠ m),thus leading to a lower vertical deviation of the particle.
The vertical distribution of the ion current at the PG is experimentally found to depend, atz = 3, on many source parameters such as the RF power, the bias current and the amountof Cs in the source, while at z = 9 such dependencies are not found; in the next chapter adetailed and in-depth analysis of these trends is carried out and some possible interpretationsare provided.
It is also important to point up that the shift due to the magnetic filter field is a first ordere↵ect, while the movements due to change in the vertical current distribution are a second ordere↵ect.
54

Figure 4.19. Vertical beam profiles on mini-STRIKE at fixed source parameters but opposite filter field polarity: thecurves are symmetric with respect to the zero of BATMAN, namely the vertical position of the horizontalplane of symmetry of the source.
Figure 4.19 shows the beam vertical profile on mini-STRIKE for two pulses with fixed sourceparameters and opposite filter field polarity (z=9 UP and z=9 DOWN). The profiles are clearlysymmetric with respect to the zero of BATMAN, namely the vertical position of the horizontalplane of symmetry of BATMAN source. Such symmetry implies that the zero of the beam center,which would be the vertical location of the beam center if no filter field were applied, essentiallycoincides with the zero of BATMAN source.
4.2.6 Agreement between BES and the copper calorimeter
The aim of this section is to compare the shape and the position of the center of the beam verticalprofile at two di↵erent locations: approximately 0.7 m and 1.7 m downstream the grounded grid,as provided by the BES telescopes and the copper calorimeter respectively. The comparison hasbeen made for the z = 3 UP and z = 9 UP filter field setups.The beam center position is expected to depend, as previously outlined, on two elements: (1)the inclination of the ions trajectories and (2) the vertical distribution of the current. Bothcontributions are in principle present.For the considered ”UP” filter field setups, the particle trajectories are inclined slightly upwards;as a result of e↵ect (1) only, the beam center is expected to move upwards as the distance fromthe grounded grid increases.The influence of e↵ect (2), namely the vertical current distribution, on the beam center ismore complicated. Experimental measurements, thoroughly discussed in the following chapter,show that in the beam a vertical asymmetry and inhomogeneity exists. This inhomogeneity isexpected to reduce gradually as the beam propagates: indeed the beamlets overlap because oftheir divergence, leading to a smoothing of the vertical beam profile and a movement of the beamcenter towards the zero, namely downwards. Such behavior is confirmed by some simulationsperformed with the RFX code previously described for an inhomogeneous beam: as the distancefrom the GG is increased, the beam vertical profile smooths (Figure 4.20a) and the position of
55
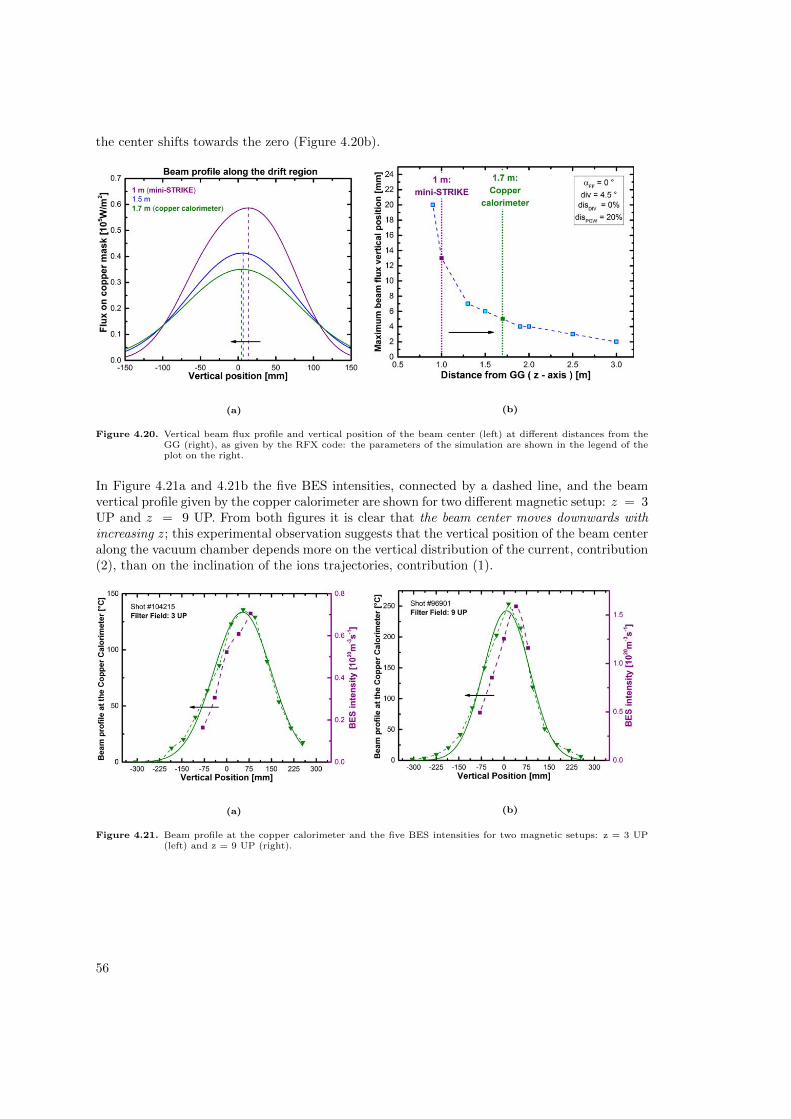
the center shifts towards the zero (Figure 4.20b).
(a) (b)
Figure 4.20. Vertical beam flux profile and vertical position of the beam center (left) at di↵erent distances from theGG (right), as given by the RFX code: the parameters of the simulation are shown in the legend of theplot on the right.
In Figure 4.21a and 4.21b the five BES intensities, connected by a dashed line, and the beamvertical profile given by the copper calorimeter are shown for two di↵erent magnetic setup: z = 3UP and z = 9 UP. From both figures it is clear that the beam center moves downwards withincreasing z ; this experimental observation suggests that the vertical position of the beam centeralong the vacuum chamber depends more on the vertical distribution of the current, contribution(2), than on the inclination of the ions trajectories, contribution (1).
(a) (b)
Figure 4.21. Beam profile at the copper calorimeter and the five BES intensities for two magnetic setups: z = 3 UP(left) and z = 9 UP (right).
56

5 BATMAN beam characterization
The present chapter concentrates on the study of the negative ion beam properties - e.g. diver-gence, homogeneity and asymmetries - in di↵erent operational scenarios: with di↵erent magneticfilter field configurations, source parameters and with di↵erent gases. Possible physical interpre-tations for the results are discussed, in some cases supported by numerical simulations developedad hoc.
Figure 5.1 shows six operational parameters that in principle a↵ect the amount of ions extractedfrom the source: the power supplied to the RF-driver, the pressure of the source-filling gas,the quantity of cesium present in the source volume, the bias current collected at the plasmagrid, the extraction voltage and finally the filter field.
Figure 5.1. Operational parameters of BATMAN that in principe can a↵ect the electrically measured ion currentdensity jex.
Another important operational parameter is the acceleration voltage, namely the voltage dropbetween the extraction grid and the grounded grid: such voltage determines the energy of thebeam but does not a↵ect the amount of extracted ion current.
For the majority of these parameters a dedicated scan has been performed, in order to study andcomprehend the influence of each parameter on the properties of the beam.
5.1 Current density dependence on source parameters
The source of BATMAN is usually operated in surface production, namely almost the wholebeam current is composed of negative ions created at the plasma grid (PG). Neutral or positivelycharged hydrogen atoms coming from the plasma hit the PG surface, capture respectively oneor two electrons and thus become H�: the electron capture probability is enhanced by loweringthe work function of the surface with Cs layers (see section 2.2.2).
57

The intensity of the negative ion production and, consequently, the amount of extracted H�
current depend on the parameters outlined in Figure 5.1; the e↵ect that each parameter has onthe electrically measured ion current density jex is shown in Figures 5.2a, 5.2b, 5.3a and 5.3b.The definition of the ion current density jex has been given at the end of section 3.1.3.
(a) (b)
Figure 5.2. Electrically measured ion current density jex and extracted electron-to-ion ratio je/jex as a function ofRF power (left) and source pressure (right). The other source parameters are P = 0.6 Pa, IBIAS = 5 A,Uex = 5 kV , Uacc = 15 kV (left) and PHF = 40 kW , IBIAS = 1 A, Uex = 5 kV , Uacc = 15 kV (right).
A higher RF power will result in a higher dissociation rate of the gas in the driver, a higheramount of plasma in the source and thus a higher flux of H0 and H+ towards the PG: thenegative ion creation rate and consequently the extracted current density will increase (Figure5.2a). The flux of particles onto the plasma grid can in principle be enhanced also by a higherpressure, since the source pressure determines the collision rate between the plasma and theneutral gas (H2): however, the experimental dependency of the ion current density on the sourcepressure is quite flat (Figure 5.2b).
The amount of Cesium in the source - on lateral walls, on the plasma grid and dispersed inthe volume - deeply a↵ects the work function of the PG surface and thus the extracted ioncurrent. The intensity of the Cs de-excitation line at 852 nm is a useful indicator of the amountof neutral Cs, proportional to the total amount of Cs (neutral or charged), in the source: suchline is observed along a vertical line-of-sight (y direction) in front of the plasma grid, henceproviding a LOS-integrated information. Figure 5.3a clearly shows that the extracted currentdensity steadily increases with Cs evaporation in the source: the data refer to a typical cesiumconditioning day in Hydrogen starting with a ”clean-source” (Cs-free).The role that the bias current - sometimes abbreviated simply as ”bias” - has on the extractedion current density is less clear and is a topic under investigation. From an experimental pointof view, a strong correlation exists between the bias current and the properties of the beam: ahigher bias leads usually to a lower current density jex and a much lower co-extracted electroncurrent je up to IBIAS ⇠ 13 A, so that the extracted electron-to-ion ratio je/jex is very small(red points in Fig. 5.3b).
In the previous figures the extracted electron-to-ion ratio je/jex dependency from sourceparameters is also shown (in red); such ratio must be < 0.5 in Hydrogen and < 1.0 in Deuteriumin order to meet ITER requirements (see Table 3.1).It is worth to analyze the trend of je/jex during a Cs-conditioning day in Hydrogen (Figure
58

(a) (b)
Figure 5.3. Electrically measured ion current density jex and extracted electron-to-ion ratio je/jex as a functionof the intensity of Cs line at 852 nm (left) and bias current (right). The other source parameters arePHF = 60 kW , P = 0.3 Pa, IBIAS = 6 A, Uex = 5 kV , Uacc = 10 kV (left) and PHF = 40 kW ,P = 0.6 Pa , Uex = 5 kV , Uacc = 15 kV (right).
5.3a). At the beginning of the day almost no Cs is present (intensity of Cs line below 1.00) andthe source works in volume production: the extracted ion current is low ( < 3 mA/cm2) andthe extracted electron-to-ion ratio - around 25 - is very far from ITER requirements. When Csis evaporated into the source, a transition from volume to source production takes place andje/jex decreases; after some days of conditioning in Hydrogen it is usually possible to achieveITER parameter je/jex < 0.5.
59

5.2 Influence of the Filter Field
The source of BATMAN is equipped, as previously described, with a magnetic filter field inthe expansion region: its aim is to filter out the hot electrons (Te > 2 eV) from the plasmawhich flows toward the grids. The filter field is mainly in the horizontal direction (Bx) and itpenetrates the drift region (Figure 3.3): here a v⇥B interaction between the field and the beamtakes place and a vertical shift of the beam is expected. Figure 5.4 shows schematically theinteraction between the beam, moving with mean velocity v in the z direction (from the gridsinto the vacuum chamber), and the filter field Bx: the resulting Lorentz force FL = q · (v ⇥Bx)is upwards (the charge q is negative).Several di↵erent filter field setups are available in BATMAN (see Figure 3.2); the results herepresented have been obtained with the ”UP” configurations, leading to a drift upwards of thebeam, but similar reasonings can be done if the field polarity is reversed (”DOWN”).
Figure 5.4. The interaction between the beam particle mean velocity v and the filter field Bx results into a v⇥B shiftin the vertical direction (y - axis).
Figure 5.5a shows the experimental influence of the filter field on the beam vertical profile; thestronger the field in the drift region - namely passing from z = 14 to z = 9 and then z = 3 -the higher the vertical shift of the beam. This trend is in complete agreement with theoreticalexpectations: when the mean B field in the vacuum chamber increases, the Larmor radius of thebeam particles decreases (rL ⇠ 1/B) and thus the vertical deviation increases. Figures 5.6a and5.6b show the e↵ect of the filter field strength for a power scan and a bias scan respectively: itis again clear that a stronger filter field in the drift region provokes a higher deflection of thebeam.
60

(a) (b)
Figure 5.5. E↵ect of filter field strength on beam vertical profile as seen by mini-STRIKE (left) and the coppercalorimeter (right). The field strength |Bx| at the PG for each magnetic setup (left plot) and the totalion current density jex (right plot) are also indicated: the di↵erent current densities are a consequence ofdi↵erent conditioning of the source. The grid voltages are fixed at Uex = 5 kV and Uacc = 15 kV for bothplots.
(a) (b)
Figure 5.6. E↵ect of filter field strength on beam vertical profile, as seen by mini-STRIKE , for a power scan (left)and a bias scan (right). The other source parameters are: P = 0.6 Pa, IBIAS = 10 A (at z = 9) and5 A (at z = 3), Uex = 5 kV , Uacc = 10 kV (left plot); PHF = 50 kW (at z = 9) and 40 kW (at z = 3),P = 0.6 Pa , Uex = 5 kV , Uacc = 15 kV (right plot).
61

5.3 Influence of the production mechanism (surface or volume)
The influence of the production mechanism (surface or volume) on beam properties is hereinvestigated by comparing di↵erent types of scan - pressure, power and bias scans - performedwithout Cs (open symbols) and with Cs (full symbols). The main observations that will bediscussed in more detail in the next paragraphs are as follows:
� In a Cs-Free source the achieved extracted ion current densities are much lower than in acesiated source (low source performance).
� In a Cs-Free source the beam divergence is much higher than in a cesiated source (badbeam optics).
Current density Figures 5.7a and 5.7b show the electrically-measured ion current density jexfor a typical power and bias scan, with and without Cesium. The maximum current densitynever exceeds 4 mA/cm2 in volume production, while it achieves up to 22 mA/cm2 in a Cesiatedsource; furthermore it can be observed that the dependence of the ion current density on pressureis visible only during the Cs-Free operation (Figures 5.7a and 5.7b).
(a) (b)
Figure 5.7. Electrically measured ion current density jex for power scans (left) and bias scans (right) performed withand without Cs, with pressure P = 0.3, 0.6 Pa and bias current IBIAS = 1, 5 A. The grids voltages areUex = 5 kV , Uacc = 10 kV for both plots; the RF power of the bias scans is PHF = 40 kW .
Beam divergence The divergence of the beam is strongly influenced by the beam current:the current density indeed defines the normalized perveance (Eq. 2.9), which determines - atfixed extraction and acceleration voltages - the beam divergence (see section 2.4.2 for a detaileddescription). Moreover, the divergence-to-normalized perveance relation is experimentally ap-proximated by a parabola (see Figure 2.11).Since in Cs-free operation the current is much lower than in a cesiated source, the divergenceis expected to be higher: this expectation is fully confirmed by Figure 5.8a and Figure 5.8b,showing the BES mean divergence - mathematical average of the divergences from the five BEStelescopes - as a function of the RF power and the source pressure.
62
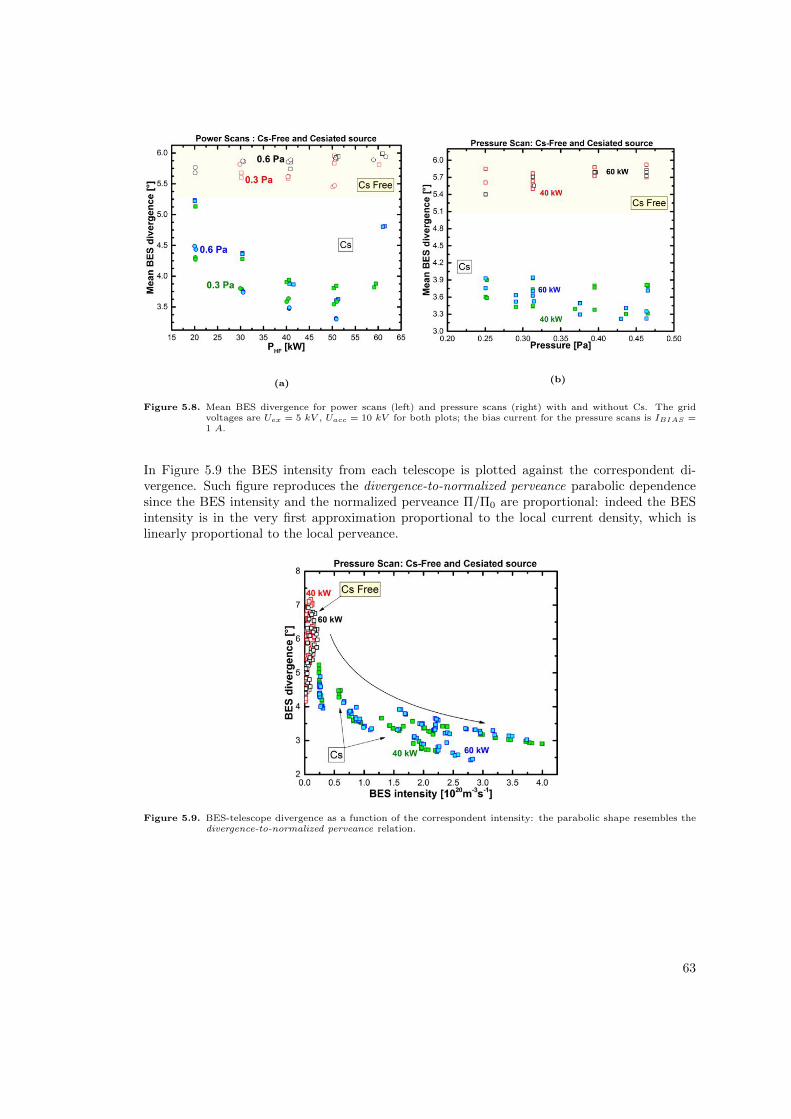
(a) (b)
Figure 5.8. Mean BES divergence for power scans (left) and pressure scans (right) with and without Cs. The gridvoltages are Uex = 5 kV , Uacc = 10 kV for both plots; the bias current for the pressure scans is IBIAS =1 A.
In Figure 5.9 the BES intensity from each telescope is plotted against the correspondent di-vergence. Such figure reproduces the divergence-to-normalized perveance parabolic dependencesince the BES intensity and the normalized perveance ⇧/⇧0 are proportional: indeed the BESintensity is in the very first approximation proportional to the local current density, which islinearly proportional to the local perveance.
Figure 5.9. BES-telescope divergence as a function of the correspondent intensity: the parabolic shape resembles thedivergence-to-normalized perveance relation.
63

5.4 Influence of the extracted ion current (at z = 3)
In the first part of this section a consistency check between the three beam diagnostic (BES,mini-STRIKE and the copper calorimeter) and the electrically measured ion current density ofthe beam (jex) is carried out: this is performed by studying the integrated quantities providedby each diagnostic.In the last part of the section the influence of the ion current on the beam vertical inhomo-geneity is discussed for multiple experimental situations: several power scans, pressure scans,bias scans and some Cs-conditioning days are thoroughly analyzed. A new analytic indicator ofthe vertical inhomogeneity of the beam is introduced; the results, presented as statements, areaccompanied by possible physical interpretations.
5.4.1 Trend of integrated quantities
In order to understand whether there is a general consistency between the three beam diagnos-tics and the electrically measured current of BATMAN, a comparison between the integratedquantities provided by each diagnostic (BES, mini-STRIKE and the copper calorimeter) andthe electrically measured ion current density jex is carried out. The integrated quantity of eachdiagnostic and its physical meaning is here briefly discussed:
� (1) the sum of the five BES intensities: this value is expected to be proportional tothe total amount of light emitted in the interaction between the beam and the backgroundgas, which is in first order proportional to the ion current density jex (Eq. 4.17).
� (2) the volume of the beam-fitting-function at mini-STRIKE , which is expectedto be proportional to the total power and thus to the ion current density jex (Eq. 4.19).
� (3) the volume of the beam-fitting-function at the Copper Calorimeter, whichsimilarly should be proportional to the beam power and therefore to the ion current densityjex (Eq 4.20).
Consequently the general expectations are the following:
� Expectation 1 The three integrated quantities (1), (2) and (3) are linearly proportionalto the ion current density jex; this statement is true for quantity (1) only for small currentdensity intervals, as explained in section 4.2.1.
� Expectation 2 The three integrated quantities (1), (2) and (3) are proportional to eachother during every scan.
The data that will be presented belongs to various experimental scans - varying the RF power,the source pressure or the bias current - and to some Cs-conditioning days in Hydrogen, primarilyperformed with the z = 3 UP magnetic filter field setup.
Expectation 1
In Figure 5.10 the volume of the beam-fitting function at mini-STRIKE (integrated quantity(2)) and the integral of the vertical beam profile at mini-STRIKE as a function of jex are shown:both quantities depend linearly on the current at fixed acceleration voltage (Uacc = 10 kV orUacc = 15 kV ).Two further remarks can be made on Figures 5.10a and 5.10b: (a) both the integral and the
64

volume are zero at very low - but not null - ion current density (below 2 mA/cm2) and (b) forhigh ion current (jex > 18 mA/cm2) the volume, unlike the integral in the vertical direction, isno more linear with respect to jex. The first observation is easily explained: since a low currentresults into a high beam divergence - due to the parabolic relationship between divergence andnormalized perveance - the beam optics is really bad when jex < 2 mA/cm2 , the ions interceptthe grounded grid and therefore cannot reach the calorimeter. For the second observation, theparting from linearity is presumably due to a failure of the 2D fit of mini-STRIKE ; since theproblem does not a↵ect the integral, the fit is wrong solely in the horizontal direction (see section4.1.2 for more details about the fit procedure).
(a) (b)
Figure 5.10. Integral of the beam vertical profile (left) and volume of the beam-fitting-curve (right) at mini-STRIKE
as a function of the electrically measured ion current density jex.
Figure 5.11. Volume of the beam-fitting-curve at the copper calorimeter as a function of the electrically measured ioncurrent density (jex) or of the ion current density by water calorimetry (jcal); the other source parametersare PHF = 66 kW , P = 0.5 Pa, IBIAS = 2 A, Uex = 10 kV and Uacc = 11 kV .
Figure 5.11 shows the volume of the beam-fitting-curve at the copper calorimeter - integrated
65

quantity (3) - plotted against jex and the ion current density by water calorimetry jcal; thevolume decreases linearly with both the currents. According to the trend of the data - thedashed line - for jex < 10 mA/cm2, corresponding to jcal < 8 mA/cm2 approximately, thesignal on the copper plate is almost absent: again this may happen because the beam is lostbetween the grids as a result of bad optics. The di↵erence existing between the two measuredcurrents (jex > jcal) bears out this interpretation: it clearly indicates that part of the extractedcurrent jex does not reach the copper calorimeter, hence is lost on the grounded grid or onto thewalls of the vacuum chamber.
Expectation 2
Figures 5.12a, 5.12b, 5.13a and finally 5.13b clearly show that the sum of the BES intensities(integrated quantity (1)) and the volume of beam-fitting-curve at mini-STRIKE (integratedquantity (2)) are proportional during each scan. Other results, here not shown, indicate that thesame proportionality exists with the volume of the beam-fitting-curve at the copper calorimeter(integrated quantity (3)).
(a) (b)
Figure 5.12. Sum of all the BES intensities and volume of the beam-fitting-curve at mini-STRIKE for a power scan(left) and a pressure scan (right). The other operational parameters are listed in the caption of Figure5.2a and Figure 5.2b respectively.
To conclude, a physical interpretation of the trend of Figure 5.12a is provided; this plot wasindeed quite unexpected since it is quite in contrast with previous measurements at BATMAN.As explained at the beginning of this chapter, an increase in the RF power is theoreticallyexpected to result into an increase of the ion current density, leading consequently to an increaseof all the integrated quantities; however, this plot shows a decrease of the integrated quantities(1) and (2) when passing from 50 kW to 60 kW.
The explanation of such behavior is given by Figure 5.14: the electrically measured ion andelectron currents and the H� density in front of the PG from Cavity Ring Emission Spectroscopy(CRDS) are plotted as a function of the RF power. When passing from 50 kW to 60 kW, theamount of ions in front of the PG increases (green points) but the extracted ions - namely thosewho exit the extraction grid - are constant (black points). It can be deduced that the missingions hit the EG together with the co-extracted electrons (red points) because of very bad beamoptics (high divergence); for the same reason part of the jex can be expected to intercept the
66

(a) (b)
Figure 5.13. Sum of all the BES intensities and volume of the beam-fitting-curve at mini-STRIKE for a Cs-conditioning day (left) and a bias scan (right). The other operational parameters are listed in the captionof Figure 5.3a and Figure 5.3b respectively.
Figure 5.14. Electrically measured ion and electron currents and H� density in front of the PG (provided by laserabsorption), as a function of the RF power.
GG, leading to a decrease of the current arriving to the beam diagnostics and thus of integratedquantities (1) and (2). A considerable increase in the beam mean divergence when passing from50 kW to 60 kW, experimentally measured, bears out this explanation.
67

5.4.2 Beam inhomogeneity and shift
In this section a detailed characterization of the beam is carried out by means of the three beamdiagnostics available at BATMAN. The discussion focuses on two aspects tightly correlated: thevertical beam inhomogeneity and the displacement of the beam center.
A new indicator - named asymmetry factor - is introduced to ”measure” the level of beamvertical inhomogeneity ; it is defined as a proper combination of the five BES-telescope intensitiesI1...I5:
⌫ :=(I4 + I5 + 0.5 · I3)� (I1 + I2 + 0.5 · I3)
(I1 + I2 + I3 + I4 + I5)=
(I4 + I5)� (I1 + I2)
ITOT(5.1)
Following this definition, a perfectly symmetric beam has an asymmetry factor of zero; ⌫ is pos-itive for a shifted-up beam, negative for a shifted-down beam and the greater its absolute value,the higher the beam inhomogeneity. Figure 5.15 shows three di↵erent BES-intensity verticalprofiles of the beam: a beam shifted upwards corresponds to positive ⌫, downwards to negative⌫.
Figure 5.15. Comparison of three di↵erent BES-intensity vertical profiles; the position of each BES telescope is alsoshown.
If for example the amount of light in the upper half (I4 + I5 + 0.5 · I3) were 2-times/3-timesthe light in the lower part (I1 + I2 + 0.5 · I3), then the coe�cient would be ⌫ = 0.3 / ⌫ = 0.5respectively.
The asymmetry factor ⌫ is strictly correlated with the position of the beam center. This intuitivestatement is well confirmed by experimental observations: a movement upwards of the beamprofile, given by mini-STRIKE or by the copper calorimeter, results always in an increase ofthe asymmetry factor and viceversa a decrease of ⌫ corresponds to a movement downwards ofthe beam center. This proves again the good agreement between the BES and mini-STRIKEdiscussed in 4.2.3.
68

The general observations regarding the asymmetry factor ⌫ and the beam inhomogeneity - with”UP” filter field setups - are summarized here and discussed in the following.
� Statement 1 The asymmetry factor increases during Cs-conditioning (beam center driftsupwards), decreases during Cs-deconditioning (beam center drifts downwards) at z = 3.
� Statement 2 The asymmetry factor is lower for a higher RF power (beam center driftsdownwards) at z = 3, no dependance is found at z = 9.
� Statement 3 The asymmetry factor increases with the bias current (beam center driftsupwards) both at z = 3 and z = 9.
� Statement 4 The asymmetry factor does not depend on the source pressure both at z =3 and z = 9.
69
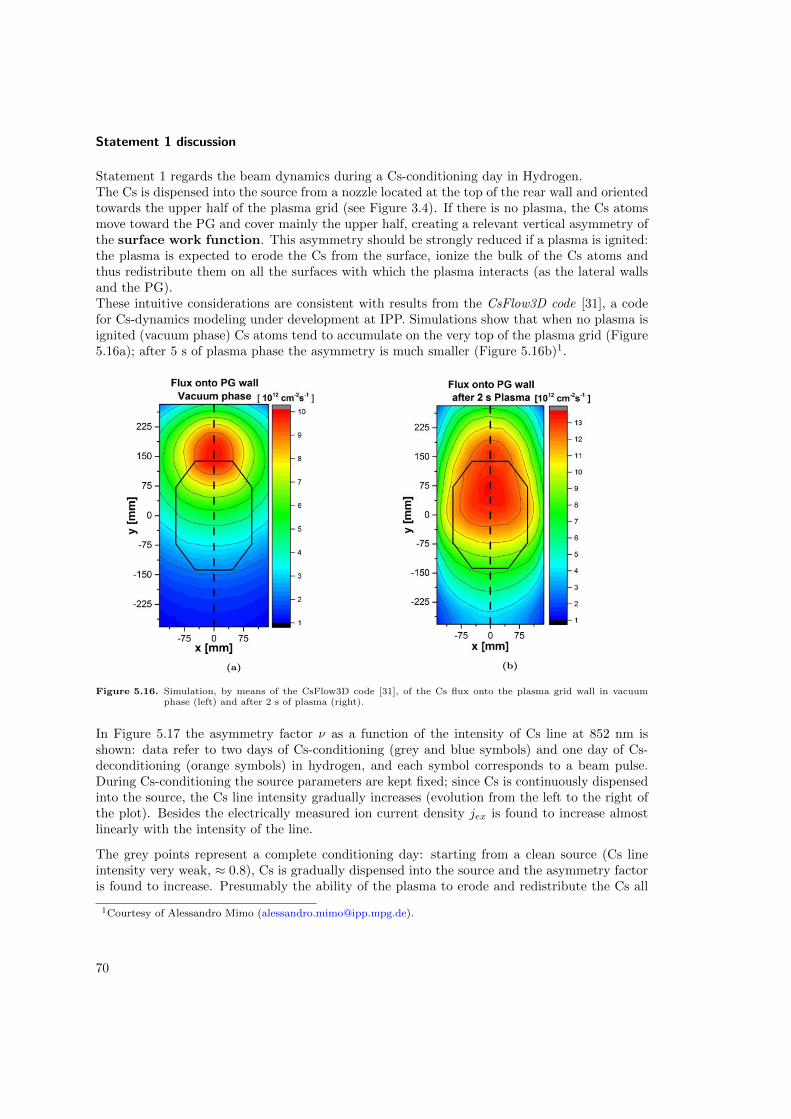
Statement 1 discussion
Statement 1 regards the beam dynamics during a Cs-conditioning day in Hydrogen.The Cs is dispensed into the source from a nozzle located at the top of the rear wall and orientedtowards the upper half of the plasma grid (see Figure 3.4). If there is no plasma, the Cs atomsmove toward the PG and cover mainly the upper half, creating a relevant vertical asymmetry ofthe surface work function. This asymmetry should be strongly reduced if a plasma is ignited:the plasma is expected to erode the Cs from the surface, ionize the bulk of the Cs atoms andthus redistribute them on all the surfaces with which the plasma interacts (as the lateral wallsand the PG).These intuitive considerations are consistent with results from the CsFlow3D code [31], a codefor Cs-dynamics modeling under development at IPP. Simulations show that when no plasma isignited (vacuum phase) Cs atoms tend to accumulate on the very top of the plasma grid (Figure5.16a); after 5 s of plasma phase the asymmetry is much smaller (Figure 5.16b)1.
(a) (b)
Figure 5.16. Simulation, by means of the CsFlow3D code [31], of the Cs flux onto the plasma grid wall in vacuumphase (left) and after 2 s of plasma (right).
In Figure 5.17 the asymmetry factor ⌫ as a function of the intensity of Cs line at 852 nm isshown: data refer to two days of Cs-conditioning (grey and blue symbols) and one day of Cs-deconditioning (orange symbols) in hydrogen, and each symbol corresponds to a beam pulse.During Cs-conditioning the source parameters are kept fixed; since Cs is continuously dispensedinto the source, the Cs line intensity gradually increases (evolution from the left to the right ofthe plot). Besides the electrically measured ion current density jex is found to increase almostlinearly with the intensity of the line.
The grey points represent a complete conditioning day: starting from a clean source (Cs lineintensity very weak, ⇡ 0.8), Cs is gradually dispensed into the source and the asymmetry factoris found to increase. Presumably the ability of the plasma to erode and redistribute the Cs all
1Courtesy of Alessandro Mimo ([email protected]).
70
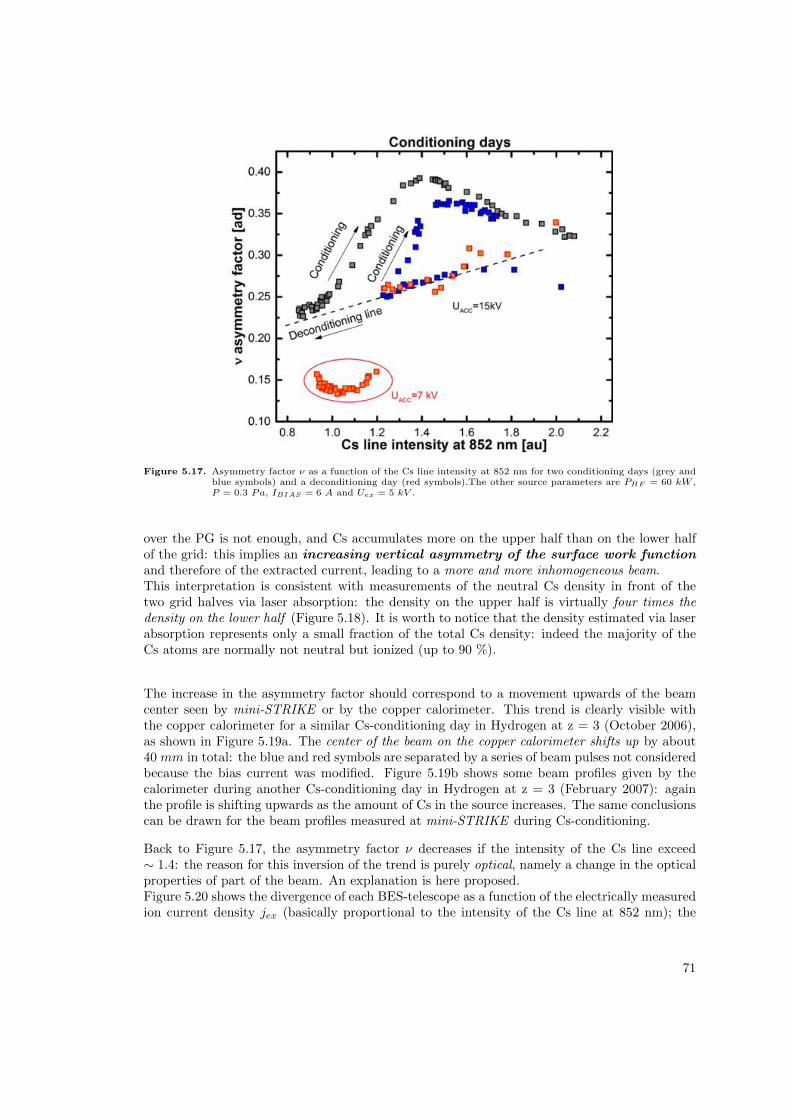
Figure 5.17. Asymmetry factor ⌫ as a function of the Cs line intensity at 852 nm for two conditioning days (grey andblue symbols) and a deconditioning day (red symbols).The other source parameters are PHF = 60 kW ,P = 0.3 Pa, IBIAS = 6 A and Uex = 5 kV .
over the PG is not enough, and Cs accumulates more on the upper half than on the lower halfof the grid: this implies an increasing vertical asymmetry of the surface work functionand therefore of the extracted current, leading to a more and more inhomogeneous beam.This interpretation is consistent with measurements of the neutral Cs density in front of thetwo grid halves via laser absorption: the density on the upper half is virtually four times thedensity on the lower half (Figure 5.18). It is worth to notice that the density estimated via laserabsorption represents only a small fraction of the total Cs density: indeed the majority of theCs atoms are normally not neutral but ionized (up to 90 %).
The increase in the asymmetry factor should correspond to a movement upwards of the beamcenter seen by mini-STRIKE or by the copper calorimeter. This trend is clearly visible withthe copper calorimeter for a similar Cs-conditioning day in Hydrogen at z = 3 (October 2006),as shown in Figure 5.19a. The center of the beam on the copper calorimeter shifts up by about40 mm in total: the blue and red symbols are separated by a series of beam pulses not consideredbecause the bias current was modified. Figure 5.19b shows some beam profiles given by thecalorimeter during another Cs-conditioning day in Hydrogen at z = 3 (February 2007): againthe profile is shifting upwards as the amount of Cs in the source increases. The same conclusionscan be drawn for the beam profiles measured at mini-STRIKE during Cs-conditioning.
Back to Figure 5.17, the asymmetry factor ⌫ decreases if the intensity of the Cs line exceed⇠ 1.4: the reason for this inversion of the trend is purely optical, namely a change in the opticalproperties of part of the beam. An explanation is here proposed.Figure 5.20 shows the divergence of each BES-telescope as a function of the electrically measuredion current density jex (basically proportional to the intensity of the Cs line at 852 nm); the
71
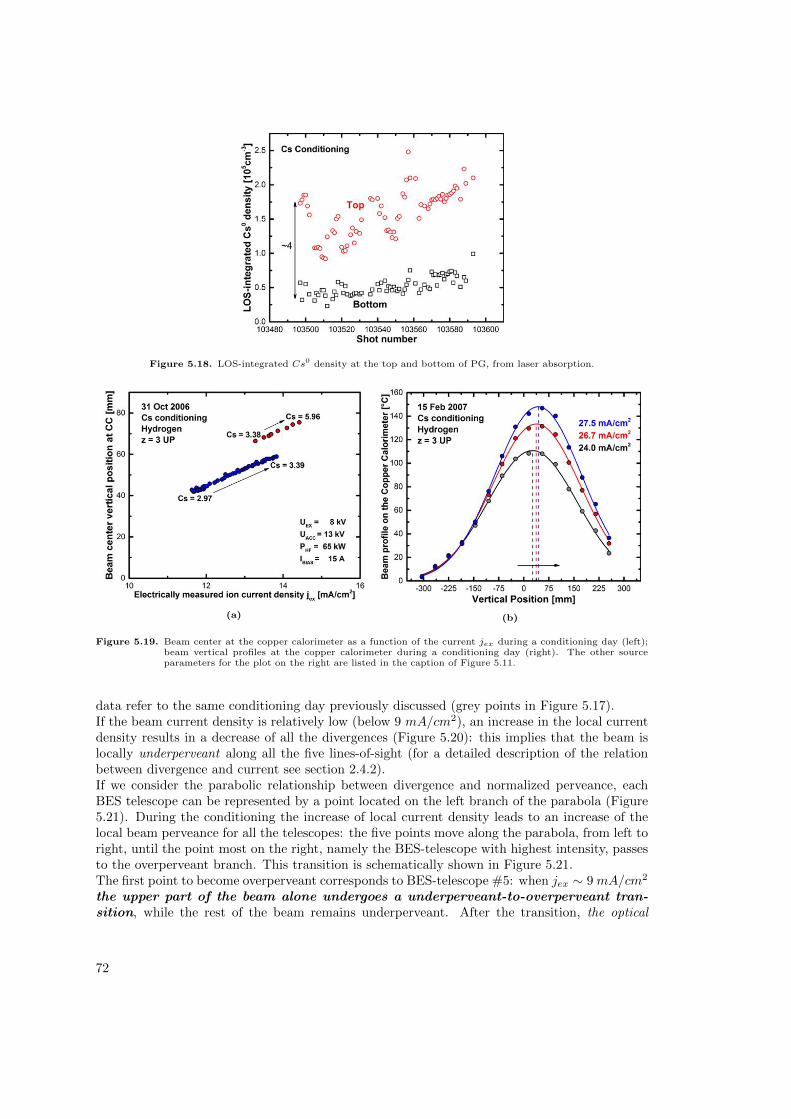
Figure 5.18. LOS-integrated Cs0 density at the top and bottom of PG, from laser absorption.
(a) (b)
Figure 5.19. Beam center at the copper calorimeter as a function of the current jex during a conditioning day (left);beam vertical profiles at the copper calorimeter during a conditioning day (right). The other sourceparameters for the plot on the right are listed in the caption of Figure 5.11.
data refer to the same conditioning day previously discussed (grey points in Figure 5.17).If the beam current density is relatively low (below 9 mA/cm2), an increase in the local currentdensity results in a decrease of all the divergences (Figure 5.20): this implies that the beam islocally underperveant along all the five lines-of-sight (for a detailed description of the relationbetween divergence and current see section 2.4.2).If we consider the parabolic relationship between divergence and normalized perveance, eachBES telescope can be represented by a point located on the left branch of the parabola (Figure5.21). During the conditioning the increase of local current density leads to an increase of thelocal beam perveance for all the telescopes: the five points move along the parabola, from left toright, until the point most on the right, namely the BES-telescope with highest intensity, passesto the overperveant branch. This transition is schematically shown in Figure 5.21.The first point to become overperveant corresponds to BES-telescope #5: when jex ⇠ 9mA/cm2
the upper part of the beam alone undergoes a underperveant-to-overperveant tran-sition, while the rest of the beam remains underperveant. After the transition, the optical
72

Figure 5.20. BES divergences as a function of the electrically measured ion current density jex: for BES-telescope#5 the transition from underperveant to overperveant is visible. The fixed operational parameters are:Uex = 4.5 kV , Uacc = 10.3 kV , PHF = 61 kW and IBIAS = 5.6 A.
properties of the beam are no more uniform: the asymmetry coe�cient ⌫ continues to describethe beam inhomogeneity but it is no longer correlated with the vertical current distribution atthe PG. A further increase in the ion current density results in a de-focalization of the upperpart of the beam (overperveant) and in a focalization of the central and lower parts.
Figure 5.22 shows the movement of the beam center as seen by mini-STRIKE .Before the underperveant-to-overperveant transition of the beam portion seen by BES-telescope# 5, the center drifts upwards with increasing ion current, namely with Cs-conditioning: this isin full agreement with the observations from the copper calorimeter for other conditioning days(Figure 5.19a and 5.19b).After such transition the beam center is expected to leave the overperveant part of the beam,which is de-focusing, and to move towards the underperveant regions, which are focusing; sincethe center is initially in the upper region, it drifts downwards (Figure 5.22).
73

Figure 5.21. Schematic evolution of the five BES divergences during a conditioning day.
Figure 5.22. Divergence of the BES-telescope # 5 and beam center, as measured by mini-STRIKE , as a functionof the electrically measured ion current density for a Cs-conditioning day in Hydrogen; the other sourceparameters are listed in the caption of Figure 5.20.
74

Statement 2 discussion
Figure 5.23a shows the e↵ect of the RF power on the asymmetry factor ⌫ for three di↵erentmagnetic filter field setups: z = 9 UP and DOWN and z = 3 UP. The results, as it will beexplained in the following, suggest that with z =3 UP a vertical asymmetry of the Cs distributionon the PG surface exists: hence statement 2 is consistent with statement 1.
In the z = 3 configuration (UP), a slight decrease of vertical inhomogeneity with increasingpower is visible. Since previous considerations indicate the likely existence of a inhomogeneousCs distribution on the PG, a higher RF power could result in a plasma more and more ableto erode the Cs from the top half of the PG and re-distribute it on the entire grid : this re-distribution would indeed lead to a reduction of the vertical inhomogeneity of the surface workfunction, of the extracted current and consequently of the asymmetry coe�cient ⌫.The decrease of ⌫ should correspond to a shift downwards of the beam center: this is confirmedby measurements done with mini-STRIKE calorimeter (see Figure 5.23b).
(a)(b)
Figure 5.23. Asymmetry factor nu as a function of the RF power for di↵erent magnetic setups (left); evolution ofthe beam vertical profile - as given by mini-STRIKE - with increasing power (right). The other sourceparameters are listed in the caption of Figure 5.2a.
In the z = 9 case, on the contrary, ⌫ does not depend on the RF power (Figure 5.23a, bluesymbols) both in the UP and DOWN magnetic setups; this lack of dependency can be explainedif we suppose that at z = 9 the Cs asymmetry on the PG is much less important than at z =3, namely the Cs is almost homogeneously distributed on the grid surface. A major argumentin favor of this interpretation is that UP and DOWN cases are, within the error bars, virtuallysymmetric with respect to ⌫ = 0 (Figure 5.23a).
The hypothesis that at z = 9 Cs coverage of the PG is more homogeneous than at z = 3 canbe explained by physical considerations; a possible interpretation is discussed in the followingparagraph.
Cs inhomogeneity and filter field strength The basic idea is that the Cs vertical distributionon the plasma grid depends, in the very first approximation, mainly on (1) the position of theCs-oven nozzle and (2) the plasma inhomogeneity on the grid; the reality is far more complicated
75

due to the complexity of the plasma dynamics in front of the PG, which is still not completelyclear.
Dependency (1) has already been discussed, see ”Statement 1”. Dependency (2) is due to thevertical E ⇥ B drift of the plasma in front of the PG: the magnetic filter field B along thehorizontal direction (x - axis) interacts with an electric field E normal to the grid, which stemsfrom the potential drop between the plasma potential and the PG potential. The amount of thevertical deviation depends experimentally ([16]) on the strength of the filter field in front of theplasma grid : with z = 3 the plasma has been found to be more inhomogeneous than with z = 9.When the plasma impinges on the PG it erodes the Cs on the surface and redistributes it: theeroded region position and shape depend on the plasma vertical drift, namely on the plasmainhomogeneity. Consequently it is reasonable to expect that the plasma vertical inhomogeneitysomehow influences the Cs vertical inhomogeneity ; with z = 3 the Cs vertical distribution ismaybe more inhomogeneous than with z = 9.
To sum up, the filter field strength influences the plasma inhomogeneity which, in principle,can influence the Cs inhomogeneity and thus the vertical asymmetry of the PG surface workfunction. At z = 9 the E ⇥ B drift is smaller than at z = 3, the plasma is more homogeneousand it leads perhaps to a more homogeneous vertical Cs distribution.
76

Statement 3 discussion
Figures 5.24a and 5.24b show the modifications in the beam vertical profile at mini-STRIKEwhen the bias current is varied: the data refer to beam pulses with the z = 3 UP filter fieldsetup and with Hydrogen or Deuterium.The beam center shifts upwards, namely in the direction of the v⇥B drift, if the bias current isincreased. Such trend is more visible in Deuterium operation than in Hydrogen operation: indeedin the latter case the beam center is nearly at the edge of the upper tile, where the resolution ofmini-STRIKE in determining the position of maximum heat flux is not good.
(a) (b)
Figure 5.24. Beam vertical profiles at mini-STRIKE for a bias scan in Hydrogen (left) and Deuterium (right). Theother source parameters are for both scans: PHF = 40 kW , P = 0.6 Pa, Uex = 5 kV and Uacc = 15 kV .
The influence of the bias current on the beam inhomogeneity is still not completely understood,but some physical hypotheses have been proposed to try to interpret the experimental trends;the role of the bias current is an open issue and further investigations will be carried out in thenext experimental campaigns.The current idea is that the bias current may modify the plasma asymmetry in front of the PGand thereby the vertical distribution of the H+ flux impinging on the grid: since the H+ playa role in creating the H� of the beam (even though their contribution is much lower than theH0), a change of the plasma asymmetry can in principle result into a slight change of the beamvertical homogeneity.
In front of the PG there is an electric field E generated by the voltage drop Vp � Ub betweenthe plasma (Vp, plasma potential) and the plasma grid (Ub, bias voltage): this electric field isresponsible for a E ⇥B drift of the plasma, leading to a plasma vertical asymmetry on the PG.A change of the bias current can induce a change of the bias voltage, which will result in amodification of the electric field strength: this leads to a vertical movement of the plasma. Sinceby increasing the bias current the beam experimentally shifts up, it is reasonable to think thatthe plasma on the PG is moving upwards (see Figure 5.25).
In Figure 5.26 the asymmetry factor ⌫ as a function of the bias current, for di↵erent magneticconfigurations and at fixed source parameters, is shown; several important observations can bedrawn from this plot.Firstly it indicates that the stronger the magnetic filter field - passing from z = 14 (black sym-
77

Figure 5.25. Schematic view of one possible explanation of the beam movements during a bias scan: the bias influencesthe plasma drift in front of the PG, which is possibly correlated to the beam center shift seen by mini-
STRIKE .
bols) to z = 9 (blue symbols) and then z = 3 (red symbols) - the higher the asymmetry factor inabsolute value: this indicates that a stronger filter field results in a higher beam deviation fromthe horizontal. It may also be noted that at z = 14 the filter field is so weak that no asymmetry isvisible. Secondly, the trends at z = 9 UP and DOWN are symmetric with respect to the (dashed)line ⌫ = 0: this suggests (1) that no remarkable vertical Cs-inhomogeneity at the PG exists withz = 9 - otherwise a positive o↵set would be observed - and (2) that the influence of the biascurrent on the beam center position is connected to the polarity of the magnetic field. Observa-tion (2) is consistent with the interpretation of the e↵ect of the bias on the beam discussed above.
Figure 5.26. Asymmetry factor ⌫ as a function of the bias current for di↵erent magnetic filter field setups, working inHydrogen.
78

Statement 4 discussion
Figure 5.27 shows the beam asymmetry factor ⌫ as a function of source pressure for di↵erentmagnetic filter field setups.It may be pointed out that all trends are flat within the error bars, namely the pressure of thegas in the source does not influence the vertical asymmetry of the beam. The position of eachgroup of points - z = 3 UP, z = 9 UP or DOWN, z = 14 UP - is consistent with the strengthor polarity of the filter field; furthermore, the symmetry of the z = 9 UP and DOWN caseswith respect to the (dashed) line ⌫ = 0 bears out the hypothesis that at z = 9 the Cs verticalasymmetry on the plasma grid is much lower that at z = 3.The pressure of the source and of the vacuum tank are correlated, namely the tank pressurechanges during a source pressure scan. At z = 9 the range explored is (2.2÷ 5.5) 10�4 mbar, atz = 3 is (0.9÷ 1.5) 10�4 mbar.
Figure 5.27. Asymmetry factor ⌫ as a function of the source pressure for di↵erent magnetic filter field setups, workingin Hydrogen. The other source parameters are listed in the caption of Figure 5.2b.
79

5.5 Influence of the ion mean energy
This section studies the influence of the ion mean energy on the properties of the beam.The experimental scans analyzed here have been performed at fixed source parameters, fixedextraction voltage (Uex = 5 kV ) and variable acceleration voltage: Uacc ranges from 6 kV to15 kV . The electrically measured ion current density jex is constant (⇠ 22 mA/cm2) whilst themean energy per ion, proportional to the total voltage of the grid system UHV = Uex + Uacc,goes from 11 keV to 20 keV.
5.5.1 Trend of integrated quantities
Figure 5.28 shows the sum of the five BES intensities and the volume of the beam-fitting-curveat mini-STRIKE as a function of the acceleration voltage Uacc and total voltage UHV ; both thequantities increase with Uacc, but the reasons are di↵erent.
Figure 5.28. Sum of the five BES intensities and volume of the beam-fitting-curve at mini-STRIKE as a function of theacceleration voltage Uacc or of the total voltage UHV . The other source parameters are PHF = 50 kW ,P = 0.5 Pa, IBIAS = 1 A and Uex = 5 kV .
The dependence between Uacc and the sum of the BES-telescope intensities is optical. Theacceleration voltage influences beam divergence and at the same time the BES-telescope intensitydepends on the beam optics (see 2.4.2): a higher voltage results into a more focused beam, leadingto a higher sum of the BES-telescope intensities.The increase of the volume of the beam-fitting-curve at mini-STRIKE shows more directly thevariation of the beam energy; indeed the beam current is fixed and the volume of the beam-fitting-curve on mini-STRIKE is, in first approximation, proportional to the total energy of thebeam UHV (Eq. 4.19).
80

5.5.2 Beam inhomogeneity and shift
The mean energy per particle influences in principle the vertical beam inhomogeneity becausechanges the intensity of the v ⇥ B deflection of the beam due to the filter field B in the driftregion: this e↵ect, already discussed, is schematically sketched in Figure 5.4.A change of the acceleration voltage Uacc implies a change of the mean velocity v of the ions,which is proportional to the square root of the total voltage (v ⇠
pUex + Uacc); as a consequence
the Larmor radius rL of the particles changes (rL ⇠ v). When Uacc is increased both the velocityv and the Larmor radius will increase, resulting into a decrease of the vertical v⇥B shift of thebeam.This simple reasoning states that with increasing beam energy the beam center vertical position- and similarly the asymmetry factor ⌫ - are expected to approximate the zero from positivevalues if the field polarity is UP, from negative values if the field polarity is DOWN.
However, the experimental results go against these statements: for every explored magneticconfiguration (z = 3 UP, z = 9 UP and DOWN, z = 14 UP) the beam center gets away from thezero with increasing acceleration voltage (Figure 5.29a); the absolute value of the asymmetryfactor ⌫ increases as well, namely the beam is more and more inhomogeneous (Figure 5.29b). Suchtrend is visible also with the copper calorimeter: Figure 5.30 compares two beam vertical profiles,at fixed source parameters, with di↵erent Uacc: even though the increase of the accelerationvoltage is small (from 11 keV to 13 keV), the profile clearly shifts up by ⇠ 30 mm.
(a) (b)
Figure 5.29. Asymmetry factor ⌫ (left) and beam center given by mini-STRIKE (right) as a function of accelerationvoltage for di↵erent magnetic setups. The other source parameters are PHF = 50 kW , P = 0.5 Pa,Uex = 5 kV and IBIAS = 1 A (for z =3 UP) or 10 A (for z = 9 and z = 14).
Such behavior is completely unexpected and it is still an open issue. In the following a possibleinterpretation is presented; the interpretation is based on a simple single-particle code whichdoes not take into account the beam dynamics or other physical phenomena happening in theextraction, acceleration and propagation of the beam. This code was written not with theaim of explaining exhaustively the issue, but just to provide some interesting hints for futureinvestigations.
The idea is to observe how an ion trajectory in the vacuum chamber is a↵ected by the filter field:the filter field is shown in Figure 3.3 and it can be noticed that it changes polarity in the driftregion.
81

Figure 5.30. Movement upwards of the beam profile, as seen by the copper calorimeter, if - at fixed source parameters -the acceleration voltage is increased from 11 kV to 13 kV; the other source parameters are PHF = 66 kW ,P = 0.5 Pa, IBIAS = 2 A and Uex = 10 kV .
The magnetic filter field along the beam axis and the grid voltages are given as input to thecode. The vertical position (y - axis) and velocity of the ion are computed iteratively every60 nm along the z - axis; an estimate of the ion trajectory, namely the vertical position of theparticle along the beam direction, is given as output.
Figure 5.31a shows the trajectory of a H� ion along the vacuum chamber for two accelerationvoltages, 5 kV (green line) and 15 kV (red line); the filter field profile is also drawn with apink-dashed line (z = 3 UP setup). Given the simplicity of the code, the absolute value of theion vertical deviation is not meaningful; however, the shape of the trajectory and its dependenceon Uacc provide important hints.
(a) (b)
Figure 5.31. Left: vertical position of a H� ion along the drift chamber for two di↵erent acceleration voltages andprofile of the filter field strength. Right: vertical deviation of the ion at a distance of 1 m from the GG(empty symbols) and beam center at mini-STRIKE (full symbols) as a function of Uacc.
82

Figure 5.31a indicates that if the energy of the particle is increased (Uacc = 5 kV ! Uacc =15 kV ), in the first zone of the drift chamber the net vertical shift lowers: this is in agreementwith the simple physical considerations discussed previously, namely that the Larmor radiusincreases with the ion velocity and thus the vertical shift decreases.The opposite happens in the zone where the BES and mini-STRIKE are located (approximately0.7 - 1 m downstream the GG): the vertical deviation of the ion is higher for a higher energy,in accordance with the experimental data. Figure 5.31b shows the beam center (from mini-STRIKE ) and the vertical deviation of the ion at a distance of 1 m from the GG (estimated bythe code) plotted against the acceleration voltage: the experimental (full symbols) and simulated(open symbols) trends are similar for both magnetic setups.
5.6 Beam characterization at fixed Uex/Uacc
This section discusses the beam properties during a so-called ”µ-scan”: in this type of scan theextraction voltage Uex and acceleration voltage Uacc are both changed from pulse to pulse, butthe ratio µ := Uex/Uacc is kept constant (see Figure 5.32a) at the value µ = 0.6.The study and interpretation of this scan is usually more complicated than the others becausetwo parameters, and not one, are varying at the same time.
(a) (b)
Figure 5.32. Extraction and acceleration voltages during a typical µ-scan (left); electrically measured ion currentdensity jex as a function of Uex for µ-scans with di↵erent magnetic setups. The other source parametersare PHF = 50 kW , P = 0.5 Pa and IBIAS = 1 A (for z = 3 UP) or 10 A (for z = 9).
In Figure 5.32b the electrically measured ion current density is plotted as a function of theextraction voltage for di↵erent filter field setups: a higher Uex results into a higher amount ofions extracted from the plasma, leading to a higher ion current density.A linear dependence between the extraction voltage and the extracted current is observed atz = 9: a simple explanation would be that with larger extraction voltage the depth of themeniscus - located at each PG aperture - increases, hence the surface area for ion extractionincreases [19]. However this topic is still part of the ongoing investigations.
83

5.6.1 Trend of integrated quantities
Figure 5.33a and 5.33b show the volume of the beam-fitting-curve at mini-STRIKE and thesum of the five BES intensities as functions of the electrically measured ion current density jex:moving from left to right both the extraction and acceleration voltage increase.The general expectations, in accordance with what stated in the previous sections, are:
� Expectation 1. The volume of the beam-fitting function at mini-STRIKE increases withthe electrically measured ion current density jex.
� Expectation 2. The sum of the five BES intensities increases with the electrically mea-sured ion current density jex.
(a) (b)
Figure 5.33. Volume of beam-fitting-curve at mini-STRIKE (left) and sum of all the BES intensities (right) as afunction of the electrically measured ion current density jex; the extraction and acceleration voltages forthe start and the end of each µ-scan are also indicated. The other source parameters are listed in thecaption of Figure 5.32b.
The first expectation is confirmed by Figure 5.33a: the volume of the beam-fitting curve atmini-STRIKE increases together with the extracted current jex for all the magnetic setupsexplored.
On the contrary, the second expectation is not fully supported by data: as shown in Figure5.33b, the amount of light collected by the BES slightly increases with the jex at z = 3 but itdecreases with the current at z = 9.The reason for this decrease is that the beam at z = 9 ismore and more de-focused with increasingvoltages (see Figure 5.34a): the total amount of emitted light increases proportionally with jexbut, due to the de-focusing, the amount of collected light by the BES-telescopes, which is highlysensitive to the optics of the beam, can in principle decrease (Figure 5.33b) .A more detailed description of how the extraction and acceleration voltages influence togetherthe beam optics is given in the next paragraph.
Influence of extraction and acceleration voltage on the beam optics The two voltages havea strong influence on the optics of the beam, namely its divergence: for the data here analyzed,
84
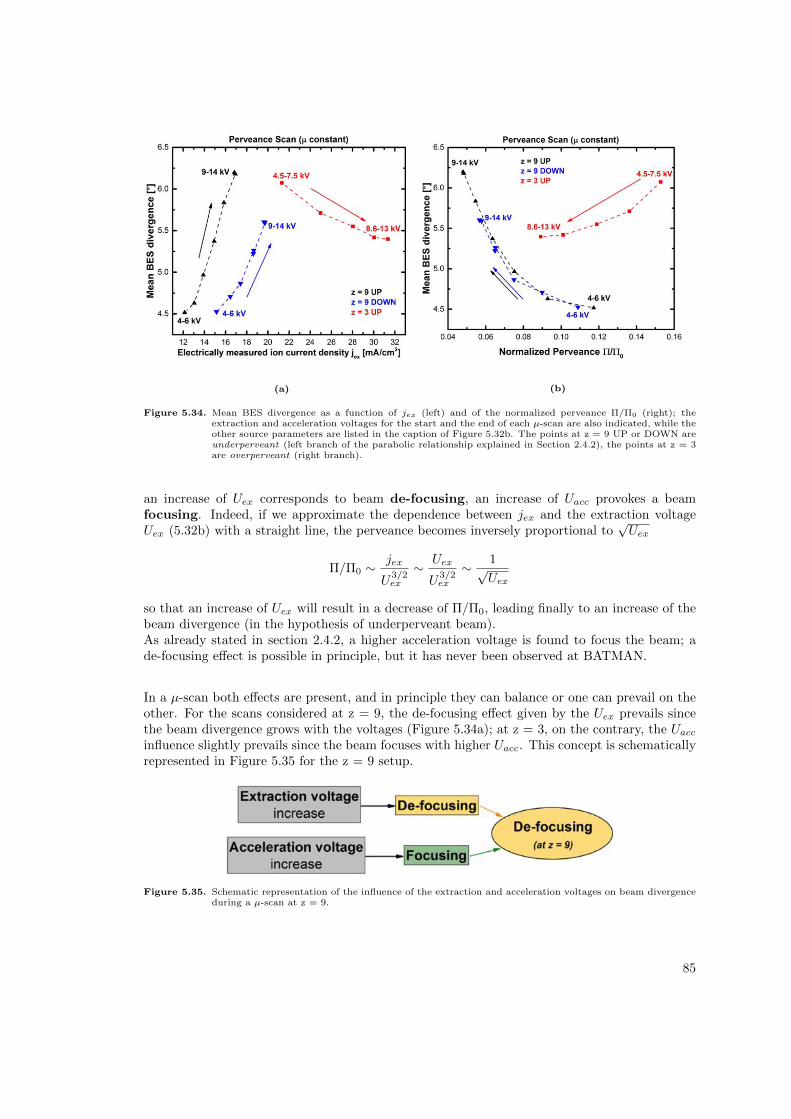
(a) (b)
Figure 5.34. Mean BES divergence as a function of jex (left) and of the normalized perveance ⇧/⇧0 (right); theextraction and acceleration voltages for the start and the end of each µ-scan are also indicated, while theother source parameters are listed in the caption of Figure 5.32b. The points at z = 9 UP or DOWN areunderperveant (left branch of the parabolic relationship explained in Section 2.4.2), the points at z = 3are overperveant (right branch).
an increase of Uex corresponds to beam de-focusing, an increase of Uacc provokes a beamfocusing. Indeed, if we approximate the dependence between jex and the extraction voltageUex (5.32b) with a straight line, the perveance becomes inversely proportional to
pUex
⇧/⇧0 ⇠ jex
U3/2ex
⇠ Uex
U3/2ex
⇠ 1pUex
so that an increase of Uex will result in a decrease of ⇧/⇧0, leading finally to an increase of thebeam divergence (in the hypothesis of underperveant beam).As already stated in section 2.4.2, a higher acceleration voltage is found to focus the beam; ade-focusing e↵ect is possible in principle, but it has never been observed at BATMAN.
In a µ-scan both e↵ects are present, and in principle they can balance or one can prevail on theother. For the scans considered at z = 9, the de-focusing e↵ect given by the Uex prevails sincethe beam divergence grows with the voltages (Figure 5.34a); at z = 3, on the contrary, the Uacc
influence slightly prevails since the beam focuses with higher Uacc. This concept is schematicallyrepresented in Figure 5.35 for the z = 9 setup.
Figure 5.35. Schematic representation of the influence of the extraction and acceleration voltages on beam divergenceduring a µ-scan at z = 9.
85

5.6.2 Beam inhomogeneity and shift
As explained previously, the acceleration voltage influences the mean energy per ion of thebeam: a more energetic particle is less vertically deviated by the magnetic filter field because itsLarmor radius rL is higher. The same is true for the extraction voltage since the velocity v ofeach ion of the beam is a function of the total voltage UHV = Uex + Uacc applied to the grids:v ⇠
pUex + Uacc.
(a) (b)
Figure 5.36. Asymmetry factor ⌫ (left) and beam center given by mini-STRIKE (right) as a function of the extractionvoltage for µ-scans performed with di↵erent magnetic setups; the other source parameters are listed inthe caption of Figure 5.32b.
Figure 5.36a and 5.36b show the asymmetry factor ⌫ and the vertical position of the beam center(from mini-STRIKE ) during a µ-scan, for di↵erent magnetic setups.The experimental trends agree with the theoretical expectations. As the energy per particleincreases (with Uex and Uacc) the beam shifts towards the zero (central plane of symmetry ofBATMAN); the beam center moves downwards for z = 3 UP and z = 9 UP, upwards for z = 9DOWN.
5.7 Influence of the ion mass (Hydrogen or Deuterium)
This section compares the results obtained when operating the source with Deuterium (D) orHydrogen (H); the most important conclusions that are discussed in detail in the next paragraphsare as follows.
� There is no major di↵erence in the electrically measured ion current density (jex) fordi↵erent gases (H or D) at fixed operational parameters; on the contrary, the extractedelectron-to-ion ratio je/jex is higher in Deuterium that in Hydrogen.
� The beam vertical inhomogeneity is much less important in Deuterium operation, namelya Deuterium beam is more homogeneous than a Hydrogen beam.
86

(a) (b)
Figure 5.37. Electrically measured ion current density (left) and extracted electron-to-ion ratio (right) as a functionof the bias current; Hydrogen (black symbols) or Deuterium (blue symbols) was used as plasma gas. Theother source parameters are: PHF = 40 kW , P = 0.6 Pa, Uex = 5 kV and Uacc = 15 kV .
Figures 5.37a and 5.37b show a comparison of the electrically measured ion current density jexand the extracted electron-to-ion ratio je/jex for Hydrogen and Deuterium operation; the databelong to some bias scans.At fixed source parameters, in Deuterium operation the amount of extracted negative ions isthe same as in Hydrogen but much more electrons are co-extracted: the electron-to-ion ratio isbigger by a factor 2 ÷ 3. This feature, probably a mass e↵ect, has been widely observed alsoin the past ([18]) but an exhaustive explanation does not exist yet. In Figure 5.37b the ITERrequirements for Hydrogen (je/jex < 0.5) and Deuterium (je/jex < 1) are also shown.
On the other hand, Deuterium results into a quite favorable e↵ect, namely a more homogeneousbeam: Figure 5.38 shows the vertical profile of the beam as seen by mini-STRIKE in Hydrogenand Deuterium operation at fixed source parameters and ion current density.This feature is likely to be linked to the higher mass of Deuterium: a higher mass results intoa larger Larmor radius of the beam ions (rL ⇠ m), leading to a lower v ⇥ B deflection fromthe horizontal. Furthermore, experimental measurements of the plasma density in front of thePG have shown that a Deuterium plasma is more homogenous that a Hydrogen plasma: a morehomogenous plasma is expected to produce a more homogenous beam.
87

Figure 5.38. Comparison of the beam vertical profile at mini-STRIKE with Hydrogen and Deuterium: the sourceparameters, as well as the ion current, are fixed.
88

6 Conclusions
The ITER fusion experimental reactor will need a neutral beam system to heat the plasma at thetemperature required for nuclear fusion to occur. The neutral beam is obtained from a negativeion beam (Hydrogen or Deuterium), which is extracted from a large RF-driven ion source.The RF-driven cesiated negative ion source of BATMAN (BAvarian Test MAchine for Negativeions) test facility, located at IPP (Max-Planck Institute, Garching, Germany), is since 2007 theITER prototype source.
The aim of this work has been to characterize the negative ion beam of BATMAN in di↵erentexperimental conditions: with di↵erent gases (Hydrogen or Deuterium), with di↵erent magneticfilter field configurations (type, position and polarity of the permanent magnets), with di↵erentsource parameters (e.g. RF power, source pressure, bias current, extraction and accelerationvoltages). The beam diagnostics available are both calorimetric (the diagnostic calorimetermini-STRIKE and a copper calorimeter) and spectroscopic (5 lines-of-sight for Beam EmissionSpectroscopy, BES).Existing codes for data analysis have been updated or completely re-written during the the-sis; physical interpretations for the results, in some cases supported by numerical simulationsdeveloped ad hoc, have been discussed. The software developed for the data analysis of mini-STRIKE , in particular, will be the core of the future program for the measurements of theSTRIKE calorimeter.
6.1 Main results
The main results are here briefly summarized; a detailed treatment can be found in the secondpart of Chapter 4 and in Chapter 5.
� General agreement between the three beam diagnostics at BATMAN. A goodproportionality between the integrated quantities of the beam diagnostic and the ion cur-rent density jex has been found (Section 5.4.1): this indicates a general consistency betweenthe beam diagnostics and the electrically measured ion current.Also a clear correlation exists between the asymmetry factor ⌫, introduced for the firsttime in this work and computed from the five BES intensities (Eq. 5.1), the beam centergiven by mini-STRIKE and the beam center of the copper calorimeter : these quantitieshave been used in multiple experimental situations to characterize the beam in terms ofvertical inhomogeneity and asymmetry.Finally the vertical temperature profile given by mini-STRIKE was found to agree verywell with the five BES intensities (Figure 4.17 and Section 4.2.3).
� Source performance with and without Cs. If the source is operated at 0.3 Pa withoutCs - namely in volume production - the electron-to-ion ratio je/jex is much higher thanwith Cs, the amount of ion current is lower and consequently the beam divergence is higher
89
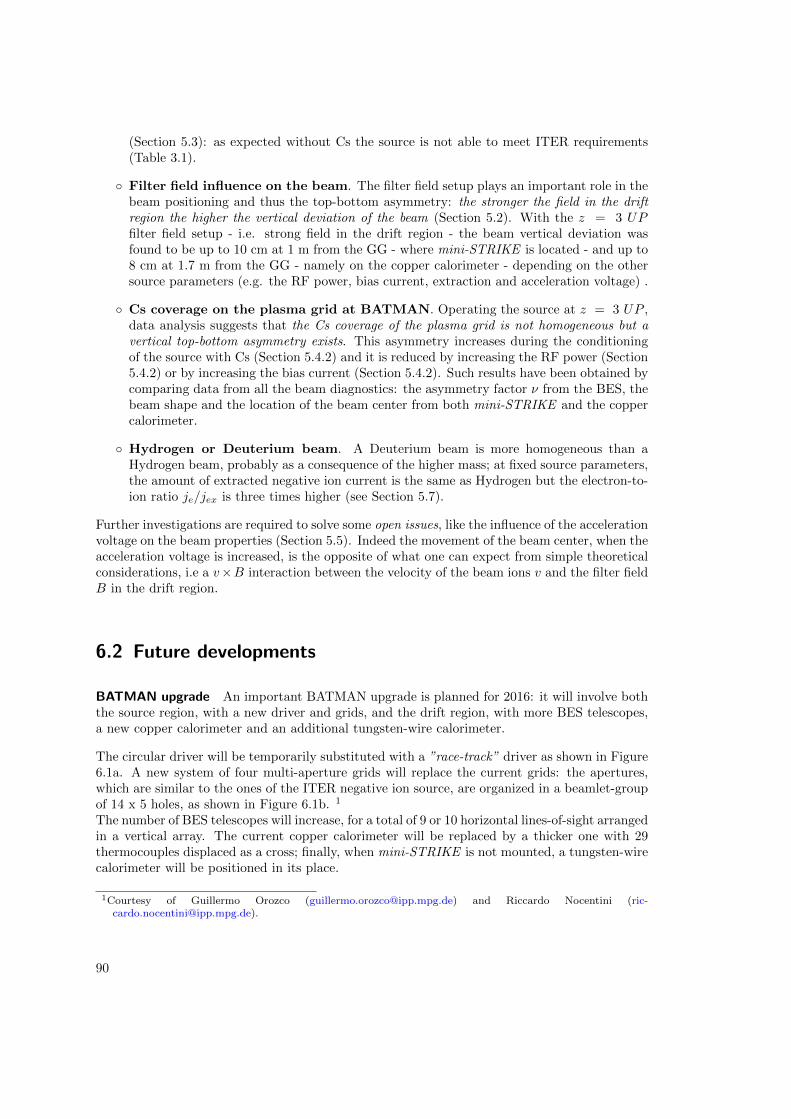
(Section 5.3): as expected without Cs the source is not able to meet ITER requirements(Table 3.1).
� Filter field influence on the beam. The filter field setup plays an important role in thebeam positioning and thus the top-bottom asymmetry: the stronger the field in the driftregion the higher the vertical deviation of the beam (Section 5.2). With the z = 3 UPfilter field setup - i.e. strong field in the drift region - the beam vertical deviation wasfound to be up to 10 cm at 1 m from the GG - where mini-STRIKE is located - and up to8 cm at 1.7 m from the GG - namely on the copper calorimeter - depending on the othersource parameters (e.g. the RF power, bias current, extraction and acceleration voltage) .
� Cs coverage on the plasma grid at BATMAN. Operating the source at z = 3 UP ,data analysis suggests that the Cs coverage of the plasma grid is not homogeneous but avertical top-bottom asymmetry exists. This asymmetry increases during the conditioningof the source with Cs (Section 5.4.2) and it is reduced by increasing the RF power (Section5.4.2) or by increasing the bias current (Section 5.4.2). Such results have been obtained bycomparing data from all the beam diagnostics: the asymmetry factor ⌫ from the BES, thebeam shape and the location of the beam center from both mini-STRIKE and the coppercalorimeter.
� Hydrogen or Deuterium beam. A Deuterium beam is more homogeneous than aHydrogen beam, probably as a consequence of the higher mass; at fixed source parameters,the amount of extracted negative ion current is the same as Hydrogen but the electron-to-ion ratio je/jex is three times higher (see Section 5.7).
Further investigations are required to solve some open issues, like the influence of the accelerationvoltage on the beam properties (Section 5.5). Indeed the movement of the beam center, when theacceleration voltage is increased, is the opposite of what one can expect from simple theoreticalconsiderations, i.e a v⇥B interaction between the velocity of the beam ions v and the filter fieldB in the drift region.
6.2 Future developments
BATMAN upgrade An important BATMAN upgrade is planned for 2016: it will involve boththe source region, with a new driver and grids, and the drift region, with more BES telescopes,a new copper calorimeter and an additional tungsten-wire calorimeter.
The circular driver will be temporarily substituted with a ”race-track” driver as shown in Figure6.1a. A new system of four multi-aperture grids will replace the current grids: the apertures,which are similar to the ones of the ITER negative ion source, are organized in a beamlet-groupof 14 x 5 holes, as shown in Figure 6.1b. 1
The number of BES telescopes will increase, for a total of 9 or 10 horizontal lines-of-sight arrangedin a vertical array. The current copper calorimeter will be replaced by a thicker one with 29thermocouples displaced as a cross; finally, when mini-STRIKE is not mounted, a tungsten-wirecalorimeter will be positioned in its place.
1Courtesy of Guillermo Orozco ([email protected]) and Riccardo Nocentini ([email protected]).
90

(a) (b)
Figure 6.1. Upgrade of BATMAN test facility planned for 2016: section view of the new race-track driver (left) andthe new four-grids extraction and acceleration system (right).
Quantitative characterization of the beam The beam property characterization given in thecurrent dissertation is primarily qualitative: the next natural step is to study the beam ofBATMAN quantitatively.In order to do so it is necessary to develop and improve the codes, already used at IPP, foradvanced beam simulation: KOBRA 3D, which simulates the beam between the grids, BBC-NI(Bavarian Beam Code for Negative Ions), which simulates the beam from the plasma grid tothe copper calorimeter and the BES spectra as well, and finally ONIX (Orsay Negative IonseXtraction), which simulates the formation and extraction of negative hydrogen ions in a cesiatedsource as well as the amount of co-extracted electrons. The large number of beam diagnosticswhich will be available at BATMAN after the upgrade will permit a systematic comparison ofsimulation outcomes with experimental results and thus a rigorous benchmark of the codes anda detailed interpretation of the experimental data.
91


Bibliography
[1] J. Freidberg, Plasma Physics and Fusion Energy, ch. 3, pp. 50–51. Cambridge UniversityPress, 2007.
[2] H. Bosch, “Basic nuclear fusion,” in Script of IPP Summer University on Plasma Physicsand Fusion Research (R.Bilato and R.Kleiber, eds.), pp. 35–50, 2014. Unpublished.
[3] C. Hopf et al., “Plasma Heating: Neutral Beam Injection,” in Script of IPP Summer Uni-versity on Plasma Physics and Fusion Research, pp. 1–20, 2014. Unpublished.
[4] M. Bacal and M. Wada, “Negative hydrogen ion production mechanisms,” Applied PhysicsReviews, vol. 2, no. 021305, 2015. doi: 10.1063/1.4921298.
[5] U. Fantz et al., “Plasma heating: Neutral beam injection.” Script of IPP Summer Universityon Plasma Physics and Fusion Research, 2007.
[6] J. D. Callen, Fundamentals of Plasma Physics, ch. 2, p. 8. University of Wisconsin, Madison,2006. Unpublished.
[7] Y. Belchenko et al., “A powerful injector of neutrals with a surface-plasma source of negativeions,” Nuclear Fusion, vol. 14, no. 113, 1974. doi: 10.1088/0029-5515/14/1/017.
[8] P. Sonato et al., “Status of PRIMA, the test facility for ITER neutral beam injectors,” AIPConference Proceedings, vol. 1515, no. 549, 2013. doi: 10.1063/1.4792827.
[9] S.Humphries, Charged Particle Beams, ch. 7. Department of Electrical and ComputerEngineering, University of New Mexico, 1990.
[10] J. D. Lawson, “Perveance and the Bennett Pinch Relation in Partially Neutralized Elec-tron Beams,” Journal of Electronics and Control, vol. 5, no. 2, pp. 146–151, 1958. doi:10.1080/00207215808953898.
[11] W. Ott and F. Penningsfeld, “Beam Divergence and Ion Current in Multiaperture IonSources,” laboratory report ipp 4/252, Max Planck Institute Fur Plasmaphysik, 1992.
[12] P. Franzen et al., “Progress of the ELISE test facility: results of caesium operation with lowRF power,” Nuclear Fusion, vol. 55, no. 053005, 2015. doi: 10.1088/0029-5515/55/5/053005.
[13] R. Hemsworth et al., “Status of the ITER neutral beam injection system,” Review ScientificInstruments, vol. 79, no. 02C109, 2008. doi: 10.1063/1.2814248.
[14] R. Hemsworth et al., “Status of the ITER heating neutral beam system,” Nuclear Fusion,vol. 49, no. 045006, 2009. doi: 10.1088/0029-5515/49/4/045006.
[15] V. Toigo et al., “Progress in the realization of the PRIMA neutral beam test facility,”Nuclear Fusion, vol. 55, no. 083025, 2015. doi: 10.1088/0029-5515/55/8/083025.
[16] P. Franzen et al., “Magnetic filter field dependence of the performance of the RF drivenIPP prototype source for negative hydrogen ions,” Plasma Physics and Controlled Fusion,vol. 53, no. 115006, 2011. doi: 10.1088/0741-3335/53/11/115006.
93
[17] M. Froeschle et al., “Recent developments at IPP on evaporation and control of caesiumin negative ion sources,” Fusion Engineering and Design, vol. 84, pp. 788–792, 2009. doi:10.1016/j.fusengdes.2008.12.063.
[18] E. Speth et al., “Overview of the RF source development programme at IPP Garching,”Nuclear Fusion, vol. 46, pp. 220–238, 2006.
[19] P. Franzen et al., “Performance of multi-aperture grid extraction systems for an ITER-relevant RF-driven negative hydrogen ion source,” Nuclear Fusion, vol. 51, no. 073035,2011. doi: 10.1088/0029-5515/51/7/073035.
[20] W. Ott and F. Penningsfeld, “Spectroscopic Determination of Species and Divergence ofHydrogen Beams in the W7AS Neutral Beam Injectors,” laboratory Report IPP 4/258,Max Planck Institute Fur Plasmaphysik, 1993.
[21] P. Sonato et al., “The ITER full size plasma source device design,” Fusion Engineering andDesign, vol. 84, pp. 269–274, 2009. doi: 10.1016/j.fusengdes.2008.11.095.
[22] A. Rizzolo et al., “Design and analyses of a one-dimensional CFC calorimeter for SPIDERbeam characterization,” Fusion Engineering and Design, vol. 85, pp. 2268–2273, 2010. doi:10.1016/j.fusengdes.2010.09.003.
[23] M. D. Palma et al., “Numerical Assessment of the Diagnostic Capabilities of the In-strumented Calorimeter for SPIDER (STRIKE),” AIP Conference Proceedings, vol. 584,no. 1390, 2011. doi: 10.1063/1.3637430.
[24] G. Serianni et al., “First negative ion beam measurements by the Short-Time RetractableInstruments Kalorimeter Experiment (STRIKE),” Review of Scientific Instruments, vol. 85,no. 02A736, 2014. doi: 10.1063/1.4861391.
[25] G. Serianni et al., “Negative ion beam characterisation in BATMAN by mini-STRIKE: Im-proved design and new measurements,” AIP Conference Proceedings, vol. 060007, no. 1665,2015. doi: 10.1063/1.4916476.
[26] V. Antoni et al., “Design, installation, commissioning and operation of a beamlet monitorin the negative ion beam test stand at NIFS,” AIP Conference Proceedings, vol. 060005,no. 1655, 2015. doi: 10.1063/1.4916474.
[27] “Lorentz distribution - Wikipedia.” http://en.wikipedia.org/wiki/Cauchy_
distribution.
[28] “Gaussian distribution - Wikipedia.” http://en.wikipedia.org/wiki/Normal_
distribution.
[29] S.Cristofaro, “Characterisation of the BATMAN beam properties by H↵-Doppler shift spec-troscopy and mini-STRIKE calorimeter,” Master’s thesis, Physics and Astronomy Depart-ment - University of Padua, 2014.
[30] J. Geddes et al., “Formation of excited hydrogen atoms in electron detachment collisions by3-25 keV H� ions,” Journal of Physics B, Atomic and Molecular Physics, vol. 14, pp. 4837–4846, 1981. doi: 10.1088/0022-3700/14/24/018.
[31] S.Gutser, Experiments and Simulations for the Dynamics of Cesium in Negative HydrogenIon Sources for ITER N-NBI. PhD thesis, Physics Department - University of Augsburg,2010.
94