dip fundamentals
DESCRIPTION
DIP basic fundamentalsTRANSCRIPT
What is Digital Image Processing?
• An image is defined as a two-dimensional function, f(x,y), where x and y are spatial (plane) coordinates, and the amplitude of f at any pair of coordinates (x,y) is called the intensity of the image at that point.
• When x, y and the amplitude of f are all finite, discrete quantities, we call the image a digital image.
• The field of digital image processing refers to processing digital images by using computers.
• A digital image consists of a finite number of elements, each of which has a particular location and value.
• The elements are referred as picture elements, image elements, pels and pixels.

Machines vs humans
• Among the five senses, vision is considered to be vital one for a human being.
• But a human being can perceive only visible part of the electromagnetic spectrum.
• But machines can span the entire range of electromagnetic spectrum from gamma to radio waves.

Image vision vs Image analysis
• Image processing is a branch in which both the input and output of a process are images.
• The goal of computer vision is to use computers to emulate human vision, including learning, making inferences and taking actions.
• The area of image analysis is in between image processing and computer vision.
Types of Processes in Image Processing
• There are 3 types of computerized processes. • They are : low, mid and high level processes. • Low-level processes involve primitive operations such as
image preprocessing to reduce noise, contrast enhancement and image sharpening.
• Here both the input and output are images. • Mid-level processing involves segmentation (partitioning
image into regions), description of objects to reduce them to a form so that a computer can process and classification (recognition) of objects.
• Here inputs are images but outputs are attributes extracted from images.
• In high-level processing, we ‘make sense’ of a collection of recognized objects.

Example of dip and image analysis
• The process of acquiring an image of a text, processing it, extracting (segmenting) individual characters, describing characters suitable for computer processing and recognizing those individual characters are in the scope of digital image processing.
• Making sense of the content of the page (text) is viewed as the domain of image analysis and computer vision.
Categorizing Images
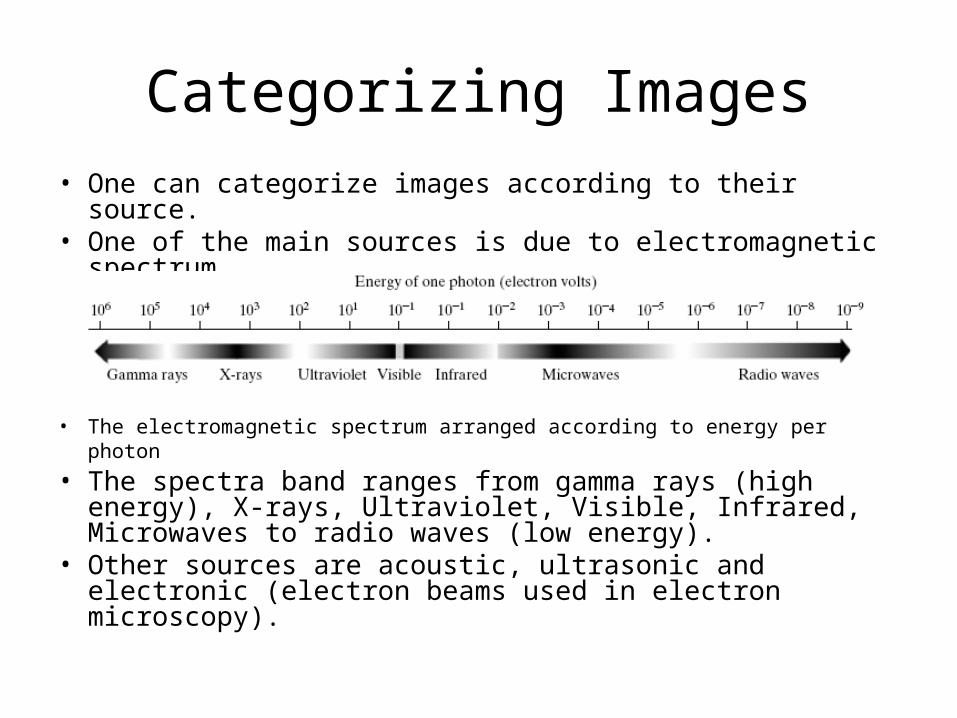
• One can categorize images according to their source. • One of the main sources is due to electromagnetic
spectrum.
• The electromagnetic spectrum arranged according to energy per photon • The spectra band ranges from gamma rays (high
energy), X-rays, Ultraviolet, Visible, Infrared, Microwaves to radio waves (low energy).
• Other sources are acoustic, ultrasonic and electronic (electron beams used in electron microscopy).

Gamma Ray Imaging
• These are used in nuclear medicine and astronomical observations.
• In medicine, it is used for complete bone scan. • The nuclear imaging is also used in positron
emission tomography (PET). • It can render the 3-D image of patients. • It can detect tumors in the brain and lungs. • The images of stars which exploded about
15000 years ago, can be captured using gamma rays.

Examples of Gamma Ray Images(Bone scan and PET images)

X-ray Imaging
• It is also used in medicine and astronomy. • We can get images of blood vessels in
angiography. • It is also used in Computerized Axial
Tomography (CAT) to generate 3-D rendition of a patient.
• High energy X-ray images are used in industrial processes (electronic circuit board).
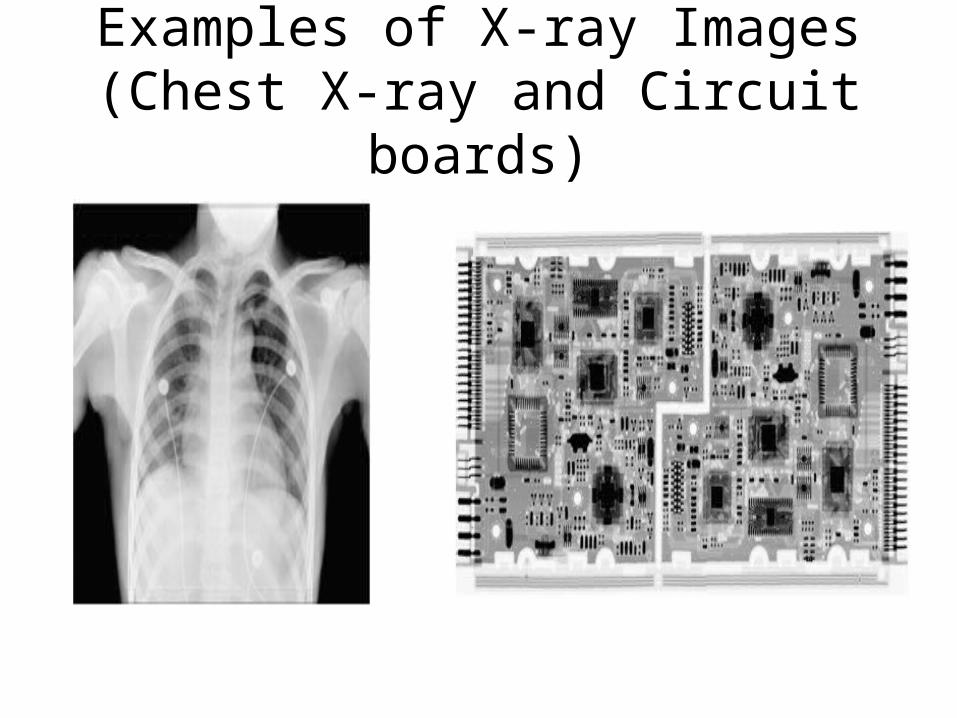
Examples of X-ray Images(Chest X-ray and Circuit boards)

Ultraviolet Imaging
• It is used in lithography, industrial inspection, microscopy, lasers, biological imaging and astronomical observations.
• Corn, cereals, onions caused by parasitic fungi can be identified using this imaging technique.

Examples of Ultraviolet Images(Normal corn vs Smut corn)

Visible and Infrared Images
• It is used in light microscopy, astronomy, remote sensing, industry and law enforcement.
• It is mainly used in weather observation and prediction.
• Visual inspection of manufactured goods use visible spectrum.
• Automated counting, license plate reading, tracking and identifying bills, etc belong to visible images.
• Infrared images are used for night vision systems.

Examples of visible and infrared images (Microprocessor and surface of an audio CD)
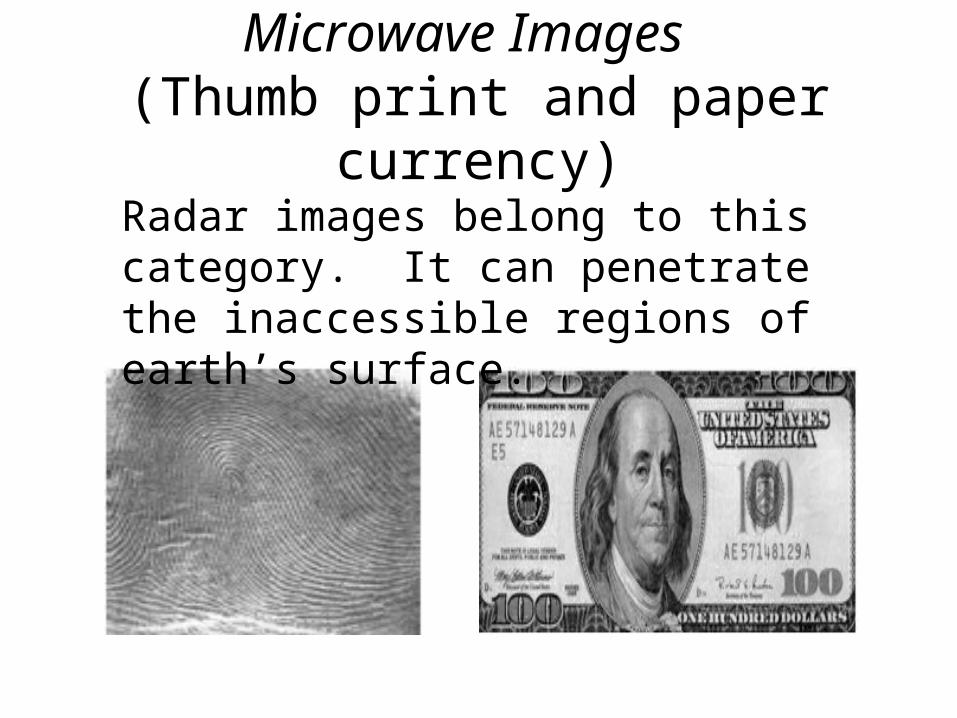
Microwave Images (Thumb print and paper currency)
Radar images belong to this category. It can penetrate the inaccessible regions of earth’s surface.

Radio Images(MRI of human knee and spine)
It is used in Magnetic Resonance Imaging (MRI).

Acoustic imaging
• The images use sound energy.
• They are used in geological exploration, industry and medicine.
• It is also used in mineral and oil exploration.
• Ultrasonic images are used in obstetrics to determine the health of unborn babies and determining the sex of the baby.

Cross-sectional image of a seismic model
The arrow points to a hydrocarbon (oil and/or gas) trap.

Fundamental steps in Digital Image Processing
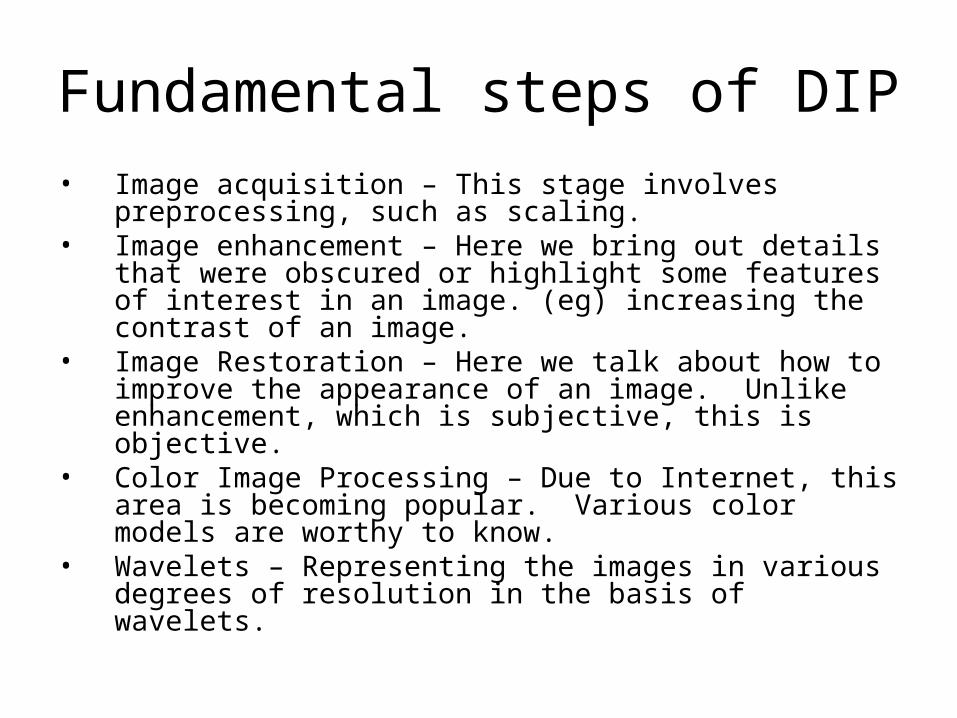
Fundamental steps of DIP
• Image acquisition – This stage involves preprocessing, such as scaling.
• Image enhancement – Here we bring out details that were obscured or highlight some features of interest in an image. (eg) increasing the contrast of an image.
• Image Restoration – Here we talk about how to improve the appearance of an image. Unlike enhancement, which is subjective, this is objective.
• Color Image Processing – Due to Internet, this area is becoming popular. Various color models are worthy to know.
• Wavelets – Representing the images in various degrees of resolution in the basis of wavelets.

Fundamental steps of DIP• Compression – It is a technique for reducing the storage required
to save an image or bandwidth needed to transmit.• Morphological Processing – It deals with tools for extracting
image components that are useful in the representation and description of shape.
• Segmentation – These procedures partition an image into its constituent parts or objects.
• Representation and description – It follows the output of a segmentation stage.
• It uses either the boundary of a region or all the points in the region itself.
• Description ( also called feature selection) deals with extracting attributes or are basic for differentiating one class of objects from another.
• Recognition – It is the process that assigns a label (eg. Vehicle) to an object based on its descriptors.

Components of an Image Processing System

Basic components of a general-purpose system
used for digital image processing • Image sensors – Two elements are needed to
acquire digital images. • First one is the physical device that is sensitive to
energy radiated by the object that we want to image.
• The second one, called the digitizer, is a device for converting the output of the physical sensing device into digital form.
• (eg) in a digital video camera, the sensors produce an electrical output proportional to light intensity.
• The digitizer converts these outputs to digital data.

Basic components of a general-purpose system used for digital image processing
• Specialized Image Processing Hardware - • It consists of digitizer plus hardware that performs
other primitive operations such as an arithmetic logic unit (ALU), which performs arithmetic and logical operations on entire image.
• This type of hardware is also called as front-end subsystem and its characteristic is speed.
• This unit does things that require fast data throughputs which main computer cannot handle.
• Computer – In an image processing system it is a general-purpose computer.
• Software – It consists of specialized modules that does specific tasks (eg. matlab)
Basic components of a general-purpose system used for digital image processing
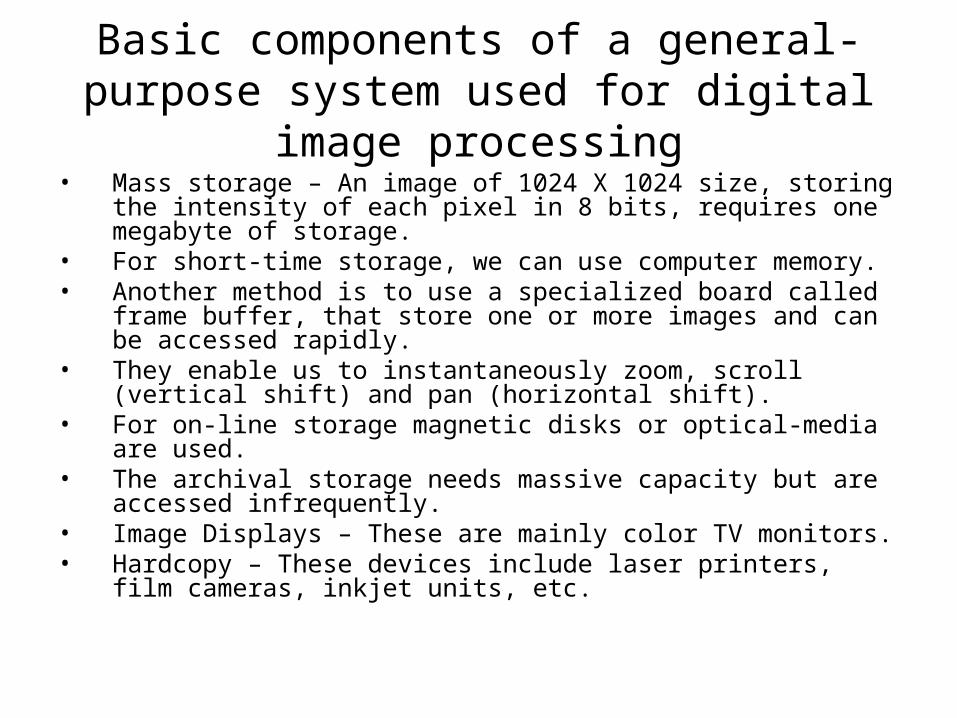
• Mass storage – An image of 1024 X 1024 size, storing the intensity of each pixel in 8 bits, requires one megabyte of storage.
• For short-time storage, we can use computer memory. • Another method is to use a specialized board called frame
buffer, that store one or more images and can be accessed rapidly.
• They enable us to instantaneously zoom, scroll (vertical shift) and pan (horizontal shift).
• For on-line storage magnetic disks or optical-media are used. • The archival storage needs massive capacity but are
accessed infrequently.• Image Displays – These are mainly color TV monitors.• Hardcopy – These devices include laser printers, film
cameras, inkjet units, etc.

Brightness Adaptation
• There are 2 phenomena which clearly demonstrate that the perceived brightness is not a simple function of intensity.
• The visual system tends to undershoot or overshoot around the boundary of regions of different intensities.
• These scalloped bands near the boundaries are called Mach bands.

Image Formation Model

Image Formation Model
• When an image is generated from a physical process, its values are proportional to energy radiated by a physical source (em waves).
• Hence f(x,y) must be nonzero and finite. That is
• The function f(x,y) is characterized by 2 components. • 1) The amount of source illumination incident on the
scene being viewed called illumination component denoted as i(x,y)
• 2) The amount of illumination reflected by the objects in the scene called reflectance component denoted as r(x,y).
),(0 yxf

Image Formation Model
• where
• and
• When r(x,y) is zero, we have total absorption and when it is 1, we have total reflectance.
• The nature of i(x,y) is determined by the illumination source and r(x,y) is determined by the characteristics of the imaged objects.
• If the images are formed via transmission of illumination through a medium such as a chest X-ray, we use transmissivity instead of reflectivity function.
),(),(),( yxryxiyxf ),(0 yxf
1),(0 yxr

Illumination values of objects
• On a clear day, sun produces about 90000 lm/m2 of illumination on the surface of the Earth. It is about 10000 lm/ m2 on a cloudy day.
• On a clear evening, a full moon gives about 0.1 lm/ m2 of illumination.
• The typical illumination of an office is about 1000 lm/m2.
• The typical values of r(x,y) are: 0.01 for black velvet, 0.65 for stainless steel, 0.8 for white wall paint, 0.90 for silver plated metal and 0.93 for snow.

Image Sampling
• The output of many sensors is continuous voltage.
• To get a digital image, we need to convert this voltage into digital form.
• But this involves 2 processes, namely sampling and quantization.
• An image is continuous with respect to x and y coordinates and in amplitude.
• Digitizing the coordinates is called sampling. • Digitizing the amplitude is called quantization.

Sampling and Quantization
• Let us consider a gray scale image. • We can take intensity values along a particular line. • Subsequently, we consider few equally spaced points
(discrete locations) along this line and mark the intensity values at these points called sampling points.
• But the values of amplitude are continuous in nature. • The gray level values can also be converted (quantized)
into discrete quantities. • This is called quantization. • We have converted the gray level ranges into 4 levels. • For this we assign one of the 4 discrete gray levels
(closest one) to each sample.

Image to be sampled and quantized along a scan line

The intensity variation sampled at regular intervals along the scan line
0 10 20 30 40 50 60 70 80 90 10050
100
150
200
250
300

Four level intensity quantization of sampled scan line
0 10 20 30 40 50 60 70 80 90 10060
80
100
120
140
160
180
200
220
240
260
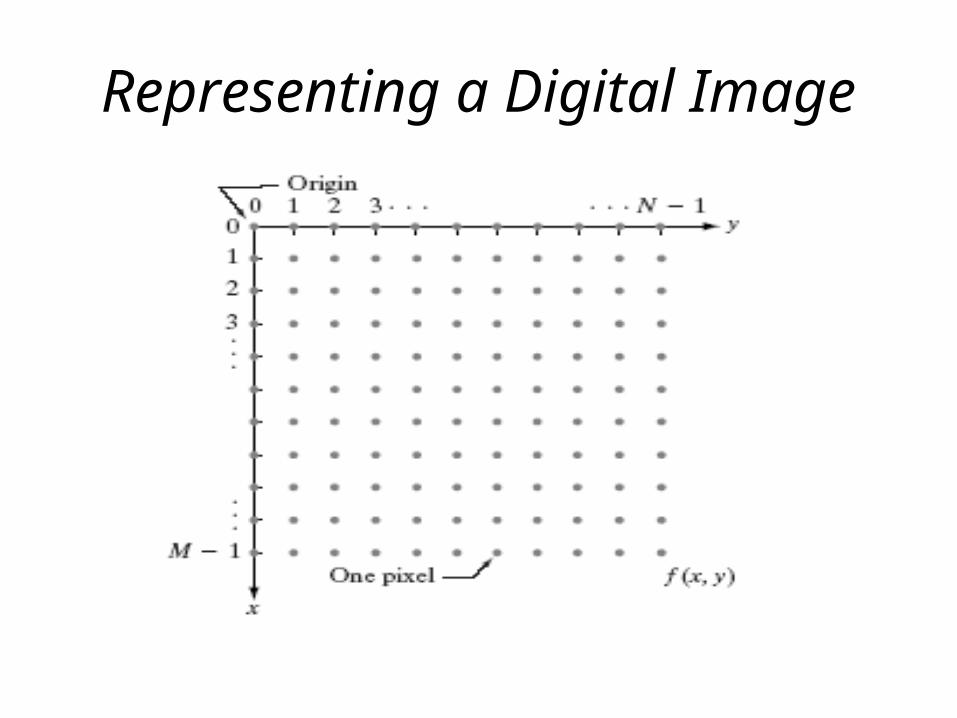
Representing a Digital Image

Representing an image as a Matrix
• The result of sampling and quantization is a matrix of real numbers.
• Thus a sampled digital image has M rows and N columns.
• The values of the coordinates (x,y) also has become discrete due to quantization.
• Thus we can write a M X N digital image as:• f(0,0) f(0,1) … f(0,N-1)• f(1,0) f(1,1) … f(1,N-1)• f(x,y) = . . .• : : :• f(M-1,0) f(M-1,1) …f(M-1,N-1)

Dynamic range of an image• The range of values spanned by the gray scale
is called dynamic range of an image. • An image with high dynamic range is said to be
a high contrast image. • An image with low dynamic range leads to a dull,
washed out look. • The number of bits required to store a digitized
image is •
• When M = N, b = N^k• For example, a 256 X 256 image represented
with 8 bits takes 5,24,288 bits.
kNMb

Dynamic Range of Images

Spatial and Gray-Level Resolution
• Sampling determines the spatial resolution of an image.
• Resolution is the smallest number of discernible line pairs per unit distance.
• Gray-level resolution is the smallest discernible change in gray level.
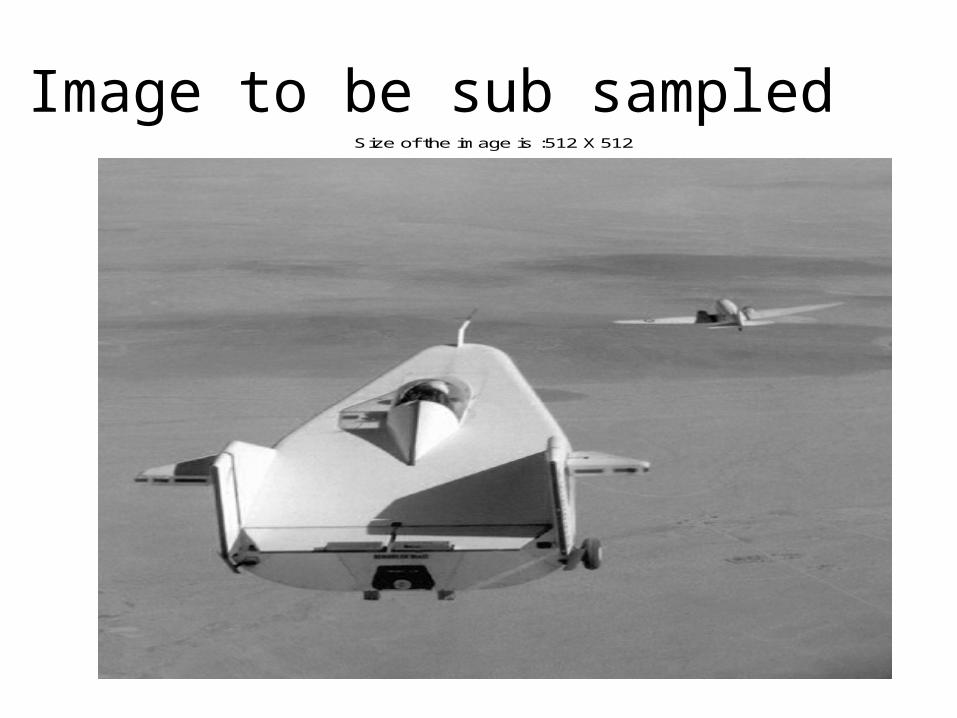
Image to be sub sampledSize of the image is :512 X 512
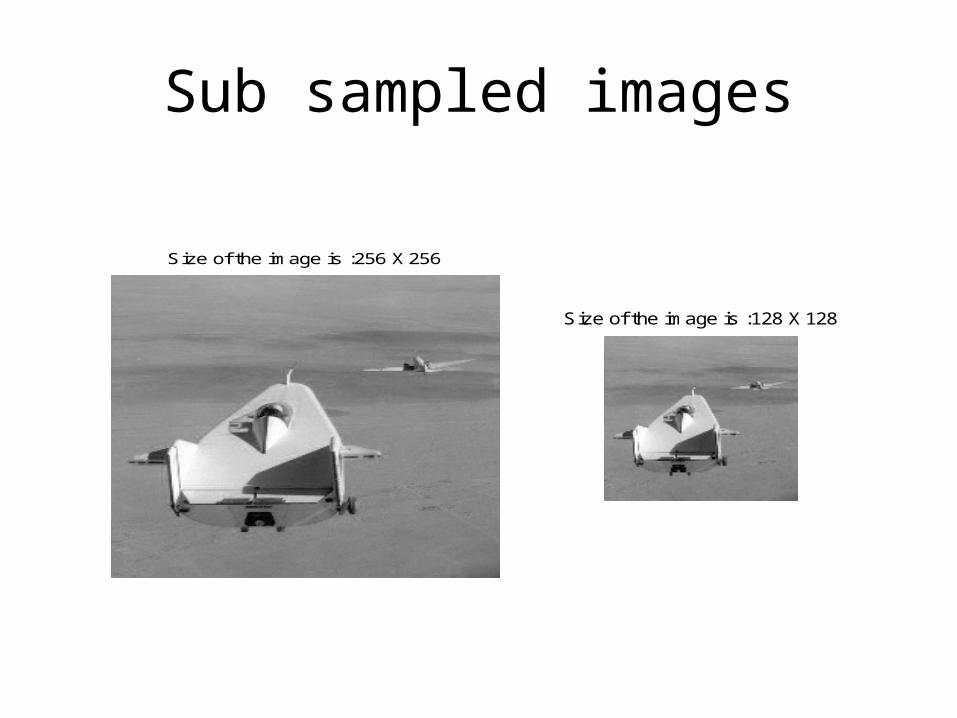
Sub sampled images
Size of the image is :256 X 256
Size of the image is :128 X 128

Subsampling
• The subsampling is achieved by deleting appropriate number of rows and columns from the original image.
• For example, we can get a 256 X 256 image by deleting the every other row and column from the 512 X 512 image.
• In order to see the effect of subsampling, we can replicate appropriate rows and columns of 256 X 256 to bring it to 512 X 512 size.
• We notice the checkboard pattern.

Size of the image is :512 X 512
Size of the image is :512 X 512
Size of the image is :512 X 512

Zooming and Shrinking Digital Images• Zooming is viewed as oversampling and shrinking is
viewed as under sampling. • Zooming is a 2 step process: the creation of new pixel
locations and assignment of gray levels to those new locations.
• For example, say we want to zoom an image of size 500 X 500 to 750 X 750.
• We can use nearest neighbor interpolation for zooming. • Pixel replication is the special case of nearest neighbor
interpolation. • Pixel replication is used to zoom the image by an integer
number of times. • Here new locations are exact duplicates of old locations. • It is very fast but produces check board effect and hence
is undesirable for larger magnification.

Bilinear interpolation
• The best way is to use bilinear interpolation using four nearest neighbors of a point.
• Let (x’,y’) denote the coordinates of a point in the zoomed image and let v(x’,y’) denote the gray level assigned to it.
• The assigned gray level is given by• v(x’,y’) = ax’ + by’ + cx’y’ + d• Here the four coefficients are determined from
the 4 equations in four unknowns that can be written using the 4 nearest neighbors of point (x’,y’). (Assignment)

Shrinking an image
• For shrinking an image by one-half, we delete every other row and column.
• In order to shrink an image by non integer factor, we expand the grid to fit over the original image, do gray-level nearest neighbor or bilinear interpolation, and then shrink the grid back to its original specified size. (Assignment).
• It is good to blur an image slightly before shrinking it.
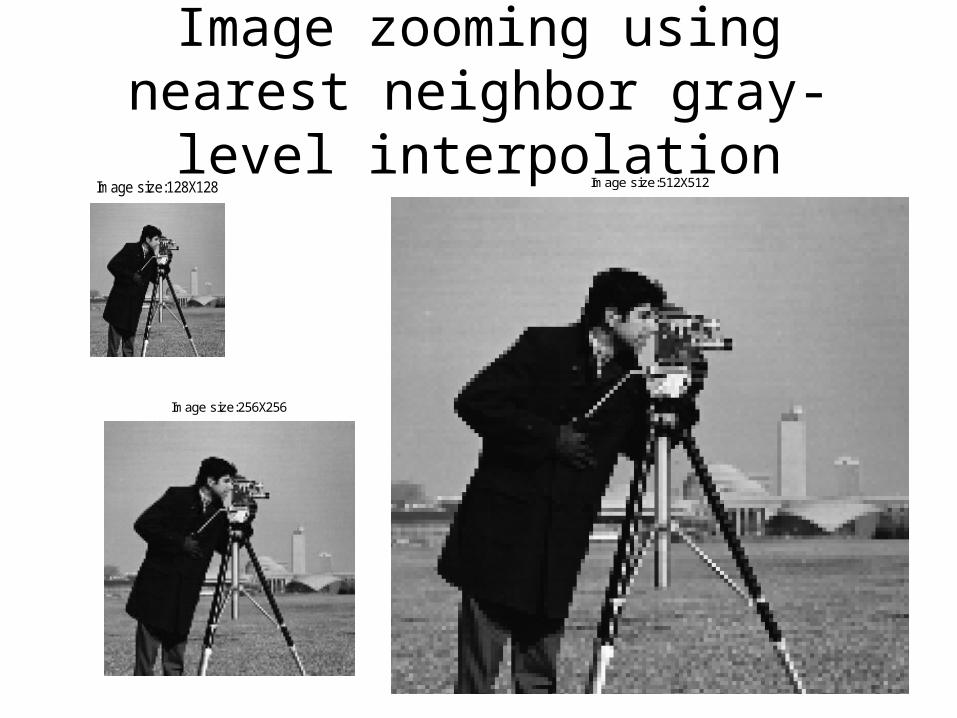
Image zooming using nearest neighbor gray-level interpolation
Image size:128X128
Image size:256X256
Image size:512X512

Image Zooming using bilinear interpolation
Image size:128X128
Image size:256X256
Image size:512X512
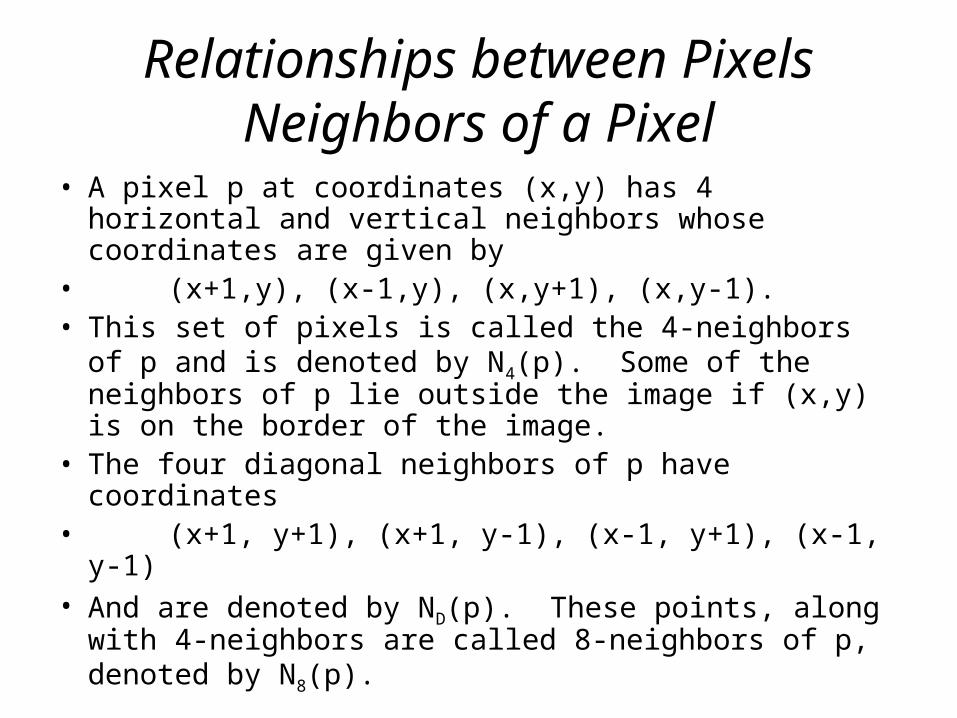
Relationships between PixelsNeighbors of a Pixel
• A pixel p at coordinates (x,y) has 4 horizontal and vertical neighbors whose coordinates are given by
• (x+1,y), (x-1,y), (x,y+1), (x,y-1).• This set of pixels is called the 4-neighbors of p and
is denoted by N4(p). Some of the neighbors of p lie outside the image if (x,y) is on the border of the image.
• The four diagonal neighbors of p have coordinates• (x+1, y+1), (x+1, y-1), (x-1, y+1), (x-1, y-1)• And are denoted by ND(p). These points, along with
4-neighbors are called 8-neighbors of p, denoted by N8(p).
Adjacency and Connectivity
• To establish if 2 pixels are connected, it must be determined if they are neighbors and if their gray levels satisfy a specified criterion of similarity.
• (eg) in a binary image, 2 pixels may be 4 neighbors but they are said to be connected only if they have the same value.
• In a gray scale image, we consider any subset of allowed gray level values for connectivity.

3 types of adjacency
• 4-adjacency: Two pixels p and q with values from V are 4 adjacent if q is in the set N4(q).
• 8-adjacenty: Two pixels p and q with values from V are 8-adjacent if q is in the set N8(q).
• m-adjacency: Two pixels p and q with values from V are m-adjacent if
– q is in N4(p), or
– q is in ND(p) and set N4(p) ∩ N4(q) has no pixels whose values are from V.

Digital Path
Arrangement of pixels pixels that are 8-adjacecnt (dashed)
A (digital) path (or curve) from pixel p with coordinates (x,y) to pixel q with coordinates (s,t) is a sequence of distinct pixels with coordinates
(x0 , y0), (x1 , y1 ), …,(xn , yn )Here n is the length of the path. If (x0 , y0) = (xn , yn ), the path is a closed path.

Distance Measures
• For pixels p, q and z with coordinates (x,y), (s,t) and (v,w) respectively, D is a distance function or metric if
• D(p,q) ≥ 0 (D(p,q) = 0 iff p = q)• D(p,q) = D(q,p) and• D(p,z) ≤ D(p,q) + D(q,z)• The Euclidean distance between p and q is defined as• De(p,q) = [(x – s)2 + (y – t)2]1/2• Here the pixels having a distance less than or equal to
some value r from (x,y) are the points contained in a disk of radius r centered at (x,y)

D4 distance
• The D4 distance (called city-block distance) between p and q is defined as
• D4(p,q) = | x – s| + | y – t|.• Here the pixels have a D4 distance from (x,y) less than or
equal to some value r form a diamond centered at (x,y). • (eg) the pixels with D4 distance ≤ 2 from (x,y) (the center
point) form the following contours of constant distance:• 2• 2 1 2• 2 1 0 1 2• 2 1 2• 2• The pixels with D4 = 1 are the 4-neighbors of (x,y).

D8 distance• The D8 distance (called chessboard distance) between p
and q is defined as• D8(p,q) = max(| x – s|, |y – t|).• The pixels with D8 distance from (x,y) less than or equal
to some value r form a square centered at (x,y). • (eg) the pixels with D8 distance ≤ 2 from (x,y) (center
point) form the following contours of constant distance:• 2 2 2 2 2• 2 1 1 1 2• 2 1 0 1 2• 2 1 1 1 2• 2 2 2 2 2• The pixels with D8 = 1 are the 8-neighbors of (x,y).