dimo - diesel & motor engineering plc - slimpy the …...31st march 2012 were prepared in...
TRANSCRIPT

D I E S E L & M O T O R E N G I N E E R I N G P L C
A N N U A L R E P O RT 2 0 1 2 / 1 3
Slimpy the BeSt
D I E S E L & M O T O R E N G I N E E R I N G P L C
A N N U A L R E P O RT 2 0 1 2 / 1 3 Because


BecauseDiesel & Motor Engineering PLC
Annual Report 2012/13

ContextBriefs the approach to this annual report and
circumstances that surrounded the year and the way forward
07
Management ReportDetails how value is delivered to and derived
from the stakeholders in the context of the eight strategic imperatives
18
StewardshipExplains the governance structure, extent of
compliance with the requirements and approach to risk management
52
Financial ReportsDetails the results of operations, financial
position, movement in equity and cash flows along with explanatory notes
77
AppendicesProvides supplementary information on
Directors, Group structure, past ten years, shares etc.
121

Our Third Integrated Annual ReportOur first, in 2010/11, turned out to be the first for Asia as well. As our business is guided and shaped by our eight strategic imperatives, the discussions and disclosures in our Annual Report too once again pivot around them. As such, Highlights of the Year, Management Report, Enterprise Governance Report and Risk Management Report illustrate and discuss our position and response in holding true to these eight strategic imperatives. As much as this is a Report about Dimo’s duties of responsible trusteeship, faithful stewardship and uncompromising accountability, it is also a Report of Dimo’s drivers of value; or as we call it a Report of Dimo’s financial capital and non financial capital.
As in the past, this year too, we have published our Annual Report in a web friendly HTML format. However, this year, we have made an important change. The Report in your hands has been presented in a manner that highlights the most important discussions and disclosures without diluting them in too much detail. Full details, for those who require them, are contained in the web version. In the same token, we have recognised the growing popularity of mobile devices and have presented a highly abridged version for those accessing our Annual Report from a smart phone.
Dimo Abridged Annual Report
Dimo Annual Report
Dimo Detailed Annual Report
We have also produced a short video of this Annual Report plus a video of the Chairman's Letter. These can be accessed on your smart phone. Download one of the free QR code scanner applications to your phone and simply point your phone camera to the respective QR code. This will take you directly to the respective video.
You could access the web and mobile HTML versions of this Annual Report with video content through http://dimo2012-13.annualreports.lk.


5
We exist because we(1) Refine the portfolio mix of our business continuously
(2) Create financial value (3) Earn the trust of customers
and they keep coming back (4) Nurture people and they
find it enjoyable and rewarding to work with us
(5) Have great relationships with best-of-breed business
partners (6) Play by the rules (7) Serve the community
(8) Are friendly towards the environment.
And these constitute our eight strategic imperatives.

6
D I E S E L & M O T O R E N G I N E E R I N G P L C
A N N U A L R E P O RT 2 0 1 2 / 1 3
A 360-Degree View of Highlights of the Year
Key Performance Area Metric 2012/13 2011/12 2010/11 2009/10
Refining the Portfolio Mix of Our Business ContinuouslyPortfolio diversification Non-auto segment as a percentage of total turnover 17.00 12.40 19.47 35.16
Creating Financial ValueWealth creation Economic value added (Rs. mn) (547) 1,905 1,762 55
Market value added (Rs. mn) (3,149) 1,253 8,719 1,495Net asset value per share (Rs.) 860 841 473 253Market capitalisation (Rs. mn) 4,483 8,718 12,920 3,696
Shareholder return Return on equity (%) 6.06 36.13 50.51 11.20Earnings per share (Rs.) 52.06 303.87 239.03 27.97Price earnings ratio (times) 9.7 3.2 6.2 15.2Dividend per share (Rs.) 10 40 61 7Shareholders’ funds (Rs. mn) - at the year end 7,631 7,465 4,201 2,200
Earning the Trust of Customers So That They Keep Coming BackCustomer convenience No. of customer interaction points 52 40 25 19Customer satisfaction Average customer satisfaction index (%) 85.50 89.20 85.60 82.60
Nurturing People So That They Find It Enjoyable and Rewarding to Work with UsEmployee satisfaction Employee satisfaction index (%) 53.46 62.70 54.00 54.00
Employee turnover ratio (%) 21.81 21.10 19.30 14.20No. of employees in service for over 5 years 489 428 386 372
Knowledge and skills development Total no. of training hours 24,336 18,106 11,107 8,936
Having Great Relationships with Best-of-Breed Business PartnersRelationship with principals No. of principals 81 78 72 63
Length of the longest relationship (years) 74 73 72 71
Playing by the RulesContribution to exchequer Tax paid to Government (Rs. mn) 2,972 6,062 5,571 1,520
Serving the CommunityInvesting in community Community development investments (Rs. mn) 50.8 51.1 30.0 5.9
Community investments as percentage of turnover (%) 0.19 0.14 0.10 0.10Development of youth No. of vocational trainees enrolled 154 168 148 N/A
Being Friendly Towards the EnvironmentCombating climate change Total carbon footprint (Tons) 6,312 6,779 3,192 2,604
Carbon footprint tCO2 e per Rs. 1 mn of Group net turnover 0.2292 0.1674 0.1064 0.2472
A 360-Degree View of Highlights of the Year
Report Approach…Setting Tone and Tenor
Chairman’s LetterChief Executive Officer’s Review
Context

7
Context
OverviewWe continue with the trend of integrated reporting as we have done in our last two Annual Reports. The value that the Company delivers to its constituent stakeholders and the value of those stakeholders to the Company in driving its future earnings are considered to be two sides of the same coin. While the former is the sustainability part of the story, the latter becomes the capital formation part of the story. Both financial capital and non-financial capital formation are considered along with their relationship to each other. Non-financial capital is referred to as intellectual capital and encompasses our customers, human resources, business partners, institutional integrity, community and environment.
Report Scope and BoundariesThe information contained in this report, as in the past, is in compliance with all applicable laws and regulations.
Following convergence with the International Financial Reporting Standards, Dimo adopted the new Sri Lanka Accounting Standards (known as SLFRSs and LKASs) from 1st April 2012. Financial Statements up to 31st March 2012 were prepared in accordance with Sri Lanka Accounting Standards which were in effect up to that date. Accordingly, the Financial Statements for the previous year has been restated as per the new SLASs.
Further, we are in compliance with the laws and regulations of the Companies Act No. 07 of 2007 and subsequent amendments and the Listing Rules of the Colombo Stock Exchange (CSE). We continue to follow requirements of the Code of Best Practice on Corporate Governance issued jointly by The Institute of Chartered Accountants of Sri Lanka (ICASL) and the Securities and Exchange Commission of Sri Lanka (SEC). The Detailed Annual Report in our website provides the extent and manner in which we have complied with the code. The Detailed Annual Report also contains a Communication on Progress (COP) for United Nations Global Compacts’ ten principles. As before, the various metrics regarding our performance on sustainability are aligned with the Global Reporting Initiative (GRI) G3.1 guidelines at an application level of ‘A+’. We have used the Greenhouse Gas Protocol Corporate Standard to measure and report on our carbon footprint.
This Annual Report pertains to activities of Diesel and Motor Engineering PLC and its subsidiaries, collectively referred to as the Dimo Group, spanning a 12-month period ended 31st March 2013. There have been no changes in reporting scope and/or boundaries from the previous year. Non-financial information in this report pertaining to the previous year has not been restated, unless otherwise stated.
Dimo is one of the 85 organisations participating in a Pilot Programme of the International Integrated Reporting Council (IIRC) that seeks to develop an international integrated reporting framework.
The Independent Auditors’ opinion on the Financial Statements is available on page 80.
Report Approach…Setting Tone and Tenor
GRI Content Index

8
D I E S E L & M O T O R E N G I N E E R I N G P L C
A N N U A L R E P O RT 2 0 1 2 / 1 3
Stakeholder Identification and Engagement We begin our mapping process in the context of our eight strategic imperatives. Then, we map identified stakeholders against the characteristics shown in the diagram.
Stakeholder Identification Mechanism for Engagement
Persons or a body of persons who are
affected by operations of Dimo
Persons or a body of persons who have legal, financial,
operational responsibilities towards Dimo
Persons or a body of persons who are likely to influence Dimo’s performance
A
CE
F
G
H
D
B
Plotting the results as above allows us to home in on an order of priority, as detailed below, which prepares the ground for stakeholder engagement.
• Those who exhibited all three of the identified characteristics are regarded as the most important for engagement (A)
• Those who exhibited any two of the identified characteristics are regarded as the next most important for engagement (B, C and D)
• Those who exhibited only one or none of the identified characteristics are not, as a rule, considered for engagement (E, F, G, and H)
The stakeholders we identify for engagement generally fall within the categories of - shareholders, employees, customers, business partners and suppliers, the community and regulatory and government agencies.
Arising from our stakeholder engagement process, the issues raised were rated and prioritised.
Report Approach…Setting Tone and Tenor
A 360-Degree View of Highlights of the YearReport Approach…Setting Tone and Tenor
Chairman’s LetterChief Executive Officer’s Review
Context
Identified stakeholder groups and process & frequency of
engagement

9
1. Emissions, effluents & waste
2. Technical education for youth
3. Customer health & safety
4. Economic performance
5. Employee training & education
6. Occupational health & safety
7. Labour/management relations
8. Compliance
9. Raw material consumption
10. Corruption
11. Diversity & equal opportunity
12. Investment and procurement practices for local suppliers
13. Anti-competitive behaviour
14. Customer privacy
15. Ethical marketing communications
16. Local communities
17. Carbon footprint
18. Mutually beneficial relationships with suppliers
19. Energy consumption
20. Employee benefits
21. Product & service labeling
Report Approach…Setting Tone and Tenor
Context
Materiality of Stakeholder Issues
Issues indicated in this area are of high significance and impact both stakeholders and the organisation. All indicators shown in this area are fully discussed in the Detailed Annual Report.
Issues indicated in this area have a relatively moderate impact on our business. They too were addressed during the reporting period and are fully or partially reported in the Detailed Annual Report.
Issues found in this area of the grid have only a minor impact thus may not be reported on.
21
Level of Stakeholder Priority
Current or potential impact on the Group
13
11
319 6
9 10
4
15
12 14
16 818 21
17
12 20 5 7
H - High M - Medium L - Low
H
M
L
L M H

10
D I E S E L & M O T O R E N G I N E E R I N G P L C
A N N U A L R E P O RT 2 0 1 2 / 1 3
Out of a total of 111 responses received through the engagement process, 75 were positive and 36 were negative. We have brought the materiality analysis up to date by adding key inputs and replacing outdated information based on feedback from stakeholders.
The said analysis traces the issues raised, their materiality status (whether increased, decreased, unchanged from previous year, or newly identified in current year), reasons for shift of status and the Company’s response.
Status of Material Issues - 2012 vs 2013
SN Material Issue Status of Material Issues
Possible Reason for the Shift Response
1. Emissions, Effluents and Waste * Our Environment Management System is
constantly working towards minimising emission levels.
2. Technical Education for Youth * We will continue to facilitate external
trainees to receive on the job training at no cost.
3. Customer Health and Safety * We will continue to leverage the
specifications and inbuilt health and safety aspects of our blue-chip product portfolio along with our own initiatives to reinforce this aspect.
4. Economic Performance * Strategic initiatives taken on capacity
building and management development.
5. Employee Training and Education
Continuous training and development programmes conducted for the employees.
Training hours have increased by 34% from the previous year.
6. Occupational Health and Safety * Gap Analysis for Occupational
Health and Safety Standard (OHSAS) completed. OHSAS 18001 to be obtained during the FY 2013/14.
7. Labour/Management Relations
Employees are more satisfied with opportunities for dialogue with management.
As a further improvement, a whistle-blower policy was published.
8. Compliance * Compliance Register and review system being compiled by Legal Division to facilitate compliance with regulations.
9. Raw Material Consumption * Optimising the use raw of material and
continuous monitoring.
10. Corruption * Employee Code of Conduct in place.
11. Diversity and Equal Opportunity
Employees and other stakeholders increasingly believe that the Company is an equal opportunity provider.
Equal opportunity ethos is enshrined at the core of the Company.
Report Approach…Setting Tone and Tenor
A 360-Degree View of Highlights of the YearReport Approach…Setting Tone and Tenor
Chairman’s LetterChief Executive Officer’s Review
Context
Materiality of issues increased Materiality of issues decreased * Materiality of issues remains same New Issues identified

11
SN Material Issue Status of Material Issues
Possible Reason for the Shift Response
12 Investment and Procurement Practices for Local Suppliers
Suppliers are not aware of the content of supplier code prepared by the Company.
Will be conducting awareness programmes for suppliers during the year.
13 Anti-Competitive Behaviour
* Company policy shuns anti-competitive behaviour.
14 Customer Privacy * A secure database management system meeting requirements of Daimler AG is in place to ensure customer data security.
15 Ethical Marketing Communications
No hindrance to society in terms of ethical marketing practices.
Company communication policy ensures strict compliance with regulations and codes concerning ethical marketing practices.
16 Local Communities * A process of assessment to measure community impact precedes all relevant Company activity.
17 Carbon Footprint * During the year, total carbon footprint has decreased due to the drop in turnover and efficient use of fuel.
18 Mutually Beneficial Relationships with Suppliers
* Constant contact and sharing of information continues. Principals’ reports will address expectations of Principals.
19 Energy Consumption * Energy saving measures are implemented across the organisation. New initiatives will be taken during FY 2013/14.
20 Employee Benefits Increasing confidence and trust of Employees reposed in Dimo.
Dimo seeks to exceed industry levels wherever possible in delivering benefits to employees.
21 Product and Service Labelling
Sufficient information about products/services not provided to the customer. New concern raised through the customer survey.
We have conducted many training sessions on product knowledge to ensure sales staff have adequate knowledge of the products we offer.
Materiality of issues increased Materiality of issues decreased * Materiality of issues remains same New Issues identified
Report Approach…Setting Tone and Tenor
Context

12
D I E S E L & M O T O R E N G I N E E R I N G P L C
A N N U A L R E P O RT 2 0 1 2 / 1 3

13
Chairman’s LetterDear Friends,
The great thing about entrepreneurship is that you get to embrace challenge and opportunity with equal relish. I often feel that opportunity is also a challenge - challenging one to make the best use of it. But perhaps I digress.
The degree of relish with which one meets challenge and opportunity is in direct proportion to how switched on one is.
Over 74 years of enterprise, Dimo has striven to build a business ethos which embodies every aspect of a switched on company and people. How successful we’ve been is to be seen in our performance as chronicled in the many publications of the Company. Over the years’ efforts of the past generations of the Dimo family, our own Dimo Tribe, have built a business edifice that we are proud of.
A key attribute of switched on entities is that they learn to ride the rollercoaster-like vagaries of business, consistently staying on track, identifying the negatives, whilst prudently leveraging the positives. They accomplish this while always safeguarding the interests of the customer and progress of the employee alike.
Without condescension, I have to say that this is what the year in review has been about, for Dimo. In fact, this is what it’s been about, throughout the history of Dimo.
As I predicted in my letter to you last year, 2012 truly tested our mettle. Our business emphasis remaining predominantly vested in the automobile industry presented us with many challenges. Key among them was the reversal to a high import duty regime on new vehicles beginning April 2012. This challenge was exacerbated by our inability to offer a luxury vehicle within the prescribed CIF limit of the permit regime. As a result, we did not benefit from the large number of luxury vehicles that were imported under this scheme.
All in all, the climate that prevailed in the year under review for our vehicles business was in sharp contrast to that of the preceding two years. The Government’s decision to rationalise tariffs on imports, particularly those of passenger cars, at the time, saw a dramatic bounce back of new motor vehicle registrations. This together with the low interest rate regime that prevailed made motor vehicles affordable like never seen in recent times before.
With this climate reversal, Dimo’s Group revenue contracted by 30% to Rs. 27.7 bn from Rs. 39.9 bn in 2011/12 whilst Group Profit After Tax too reduced by 83% to Rs. 462 mn. If there’s a silver lining, it is that we have done better than the 10 year compound annual growth rates (CAGR) recorded prior to 2010/11.
However, from the national perspective, development and growth is indicated in many areas - amongst them the infrastructure development, construction & technology and health & medical services sectors. The Group has significant interests in these areas and is geared to seize the opportunities that present themselves. Hence, Dimo remains highly optimistic of the future.
Succinctly put, the country is poised to grow and Dimo has an important role to play in this growth.
Among our core strategies, Dimo espouses the ‘Employee First’ approach. In an era which has enshrined a customer-first approach, this may seem a radical departure from the norm. Not so. Our premise is that a contented, motivated, empowered and rightly skilled workforce WILL place the customer first, ensuring that they deliver exemplary service and do justice to the premium products of our Principals. In so doing, Dimo will also serve its Principals well.
Scan to view the Chairman’s Letter
We are switched on...
Whilst all the signs are that we are poised for
sustained growth, it will pay us well to remain
a fully switched on enterprise.
Context

14
D I E S E L & M O T O R E N G I N E E R I N G P L C
A N N U A L R E P O RT 2 0 1 2 / 1 3
The growth of our customer and employee capital, together with other parameters of performance described throughout this report, serve as proof that this approach delivers the desired outcome. In this regard, a fact of which we are particularly proud is that Dimo has been ranked among the top 15 ‘Great Places to Work’ in Sri Lanka, in a recent survey conducted.
Looking ahead, whilst our portfolio lies predominantly in the automobile sector, our non-auto sectors are developing apace which will see the growth of the Group for all the right reasons.
As always, Dimo grows a triple bottom line - which is to say that sustainability is integrated into our business strategy and effort. We account and will always account for value generation and addition across economic, social and environmental parameters. Dimo is a signatory to the UN Global Compact and continues to be guided by its precepts.
A word now about the fundaments that govern Dimo.
Stewardship, trusteeship and accountability form the nucleus of the governance philosophy of Dimo and are embedded in our eight Strategic Imperatives. The Strategic Imperatives in turn provide the path to enterprise governance. In following this ethos, we deliver and derive stakeholder value with equal enthusiasm as detailed throughout this report.
I am happy to report that the Board has recommended that we reward our shareholders with a final dividend of Rs 10/- per share.
I am always grateful for the enduring loyalty and trust our customers place in us. Dimo greatly values these relationships and is committed to nurturing and developing them further for many years to come. I thank every member of the Dimo Tribe whose unreserved effort and commitment lies at the heart of our enterprise and achievements. Dimo honours for yet another year, our Principals whose faith and confidence in us we treasure. I am grateful for the significant guidance and counsel extended by my colleagues on the Board of Directors. Together, I believe we have charted a course of optimal success for the Group. My colleague, Mr. Gladwin Peiris retires from the Board at the forthcoming AGM, after a very long association with the Company. I thank him on behalf of you all, for his yeomen service and valued contribution to the affairs of Dimo.
I am looking forward to the year ahead. Whilst all the signs are that we are poised for sustained growth, it will pay us well to remain a fully switched on enterprise.
A.R. PandithageChairman/Managing Director
Colombo21st May 2013
Chairman’s Letter
A 360-Degree View of Highlights of the YearReport Approach…Setting Tone and Tenor
Chairman’s Letter
Chief Executive Officer’s Review
Context

15
Dimo kept to strategy - we could look back on
2012/13 as a year of consolidation, during
which we continued to invest in capacity
development and property, plant and
equipment.
Chief Executive Officer’s Review
My first full year as CEO was a challenging one. Yet it also vividly demonstrated the strength of the Dimo Group.The economic climate in Sri Lanka over the year in review proved unfavourable for our vehicles segment, as fiscal and tariff policies in force led to a decrease in vehicle imports and reducing market size. There was a decline in demand for construction machinery too.
Our other business segments performed well. Nevertheless, as our portfolio is heavily weighted towards the automobile industry, downturn in the fortunes of the vehicles segment proved to be the single greatest contributor to a corresponding downturn in turnover and profit.
Group turnover for the year in review was Rs. 27.7 bn, down 30% when compared to Rs. 39.9 bn achieved the previous year. However, turnover in the after sales area of the vehicles segment and the electro mechanical, biomedical engineering and marine solutions segment grew by 31.6% and 34.2% respectively.
The Group’s gross profit margin reduced from 18.2% to 15.2% for the year in review.
Overall though, Dimo kept to strategy - we could look back on 2012/13 as a year of consolidation, during which we continued to invest in capacity development and property, plant and equipment.
We focussed much attention on enhancing capabilities and capacities of our staff - particularly the management team, to help drive business plans and objectives more aggressively.
In terms of infrastructure, work was completed on our auto workshop in Trincomalee, whilst work is ongoing on our proposed workshop in Jaffna and the new Mercedes Benz Centre. The latter is going to be a state of the art service centre for Mercedes Benz vehicles and has been designed with technical assistance from our principal Daimler AG. It will be one of the most modern and well-appointed facilities to be found anywhere in the world and certainly a trendsetter here in Sri Lanka. It is due to commence operations later in 2013.
Context

16
D I E S E L & M O T O R E N G I N E E R I N G P L C
A N N U A L R E P O RT 2 0 1 2 / 1 3
We have plans to also increase the capacity of our workshop in Matara.
Looking to the future, we will continue to widen our footprint and service to customers, by increasing our network of customer contact points and increasing the after sales facilities we offer.
We see substantial potential, both in the short and long term, for our Agri equipment business, which will remain an area of special focus. Whilst Dimo’s pre-eminent focus remains firmly in the auto industry, the consistent growth witnessed in our electro mechanical, biomedical engineering and marine solutions business segment will figure largely in the continuing refinement of our portfolio mix.
It is good to note that our constant efforts to refine processes and nurture and enhance our intellectual capital are paying dividends. Dimo is a regular recipient of awards and accolades - among many received during the year in review were - The Best Sustainability Report - (awards from both The Institute of Chartered Accountants of Sri Lanka and Association of Chartered Certified Accountants), one of the Top Ten Best Corporate Citizens awarded by the Ceylon Chamber of Commerce and one of the Top Ten companies for Best Practices in HR - Awarded by the HR Professional’s Association
I am confident that Dimo has the correct strategies in place for the coming years. The capacity building and investment that have distinguished our enterprise this year will hold us in good stead for the opportunities to come in the future.
A.G. PandithageDirector/Chief Executive Officer
Colombo21st May 2013
Chief Executive Officer’s Review
Complete list of awards received during the year
A 360-Degree View of Highlights of the YearReport Approach…Setting Tone and Tenor
Chairman’s LetterChief Executive Officer’s Review
Context

17
We have made it an art to grow our reach…build our own service
competencies…offer responsible care and manage relationships
optimally…we continue to exist.

18
D I E S E L & M O T O R E N G I N E E R I N G P L C
A N N U A L R E P O RT 2 0 1 2 / 1 3
In formulating this commentary we drew on material from several external sources.
The Global Economy...a Tough Haul AheadThis has to be one of the most written about subjects in the world today - but it needs repeating, if we are to set the tone for the rest of this report.
A noticeable slowdown in the emerging markets and developing economies characterised 2012. GDP growth in these economies which stood at 4% in 2011 slowed to 3.2% in 2012. Key influential factors were a sharp deceleration in demand from several advanced economies as well as tightening of domestic policy and the end of investment booms in some of the major emerging market economies.
Global prospects have improved again but the road to recovery in the advanced economies will remain bumpy. World output growth is forecast to reach 3.25% in 2013 and 4% in 2014.
The World’s Auto Industry...Still a Growth SectorAuto sales growth in China, the world’s largest car market, fell short of expectations last year, as the economy slowed. Sales grew by 4.3% YoY in 2012, well below the forecast of 8%.
In the USA, the year 2012 signalled a welcome recovery for the auto industry. Sales increased by 13% over 2011.
Japanese manufacturers too had a good year with sales up by 20% over the previous year and in the process, shaking off the doldrums of post tsunami inventory shortages that prevailed last year.
Despite a revival in the US and strong sales in Japan, the global automobile industry is not expected to repeat its success. According to various estimates, the global auto industry is likely to record a growth of just over 2% in 2013, compared to the growth of 5% achieved in 2012. This is attributable to the sluggish progress of the economies of countries in Europe and Brazil, Russia, India and China (BRIC).
In summary, the auto industry is expected to remain a growth sector, though not at the same high level as in past years.
Sri Lanka’s Economy records Modest GrowthThe economy grew by a modest 6.4% in 2012. Inflation was maintained in ‘single digit territory’, at 9.2% for the fourth consecutive year despite several global and domestic areas of challenge.
The relative ‘boom’ we saw in 2010 and 2011, with GDP growth reaching and exceeding 8%, largely evaporated in the year under review.
High credit, monetary expansion and a widening trade deficit fuelled by high import demand led the Central Bank to adopt a comprehensive policy package in early 2012, involving monetary, exchange rate and fiscal elements as well as adjustments to administratively determined prices. This ushered in a regime of raised policy interest rates and a ceiling being imposed on rupee lending by licensed banks to moderate credit growth, although the latter was relaxed from the beginning of 2013.
The Operating Environment...and Trends
Ranjith PandithageChairman/Managing Director
Country Report
The Operating Environment...and Trends
Refining our Portfolio…and Reinventing our FutureFinancial Value Creation
Delivering Value to Customers...and their Value to UsWorking at Dimo…Enjoyable and Rewarding
Our Business Partners…A Symbiotic RelationshipRegulatory Authorities…Playing by the Rules
Our Community…Live and Let LiveThe Environment…Now and for Generations Yet Unborn
Sustainability Performance Objectives in 2012-2013
Management Report

19
Interest rates which followed an upward trend during the first three quarters, slightly eased in the fourth quarter, coinciding with the removal of the ceiling placed on credit growth of banks in 2012. The AWPLR, to which most of the Company’s borrowings are linked, increased from 12.65% as at 01st April 2012 to 13.77% as at 31st March 2013. The Sri Lankan Rupee appreciated by 2.41% against the US Dollar during the year and stood at Rs. 126.89 at the year end, compared to Rs. 129.95 at the beginning of the year.
Let us now look at individual economic sector performances. These are pertinent, as Dimo has substantial interests in these areas through its diversified portfolio.
In the Transportation sub-sector, the Government’s Tariff/Fiscal policies led to a sharp fall in sale and registration of motor vehicles. The number of new vehicles registered during 2012 decreased by 24% to 397,295 compared to an increase of 46% in the previous year. As over 75% of the Group’s business revolves around the vehicle segment, this information needs to be ‘digested’ and addressed.
Registration of Vehicles in Sri Lanka
Class of vehicles 2012 2011 2010 2009 2008
Motor cars 31,546 57,886 23,072 5,762 20,237Three-wheelers 98,815 138,426 85,648 37,364 44,804Motor cycles 192,284 253,331 204,811 135,421 155,952Buses 3,095 4,248 2,491 739 1,180Dual purpose vehicles 37,397 33,518 11,712 1,280 2,856Goods transport vehicles 12,266 14,818 11,845 8,225 14,038Land vehicles 21,892 23,194 19,664 15,284 26,132
Total 397,295 525,421 359,243 204,075 265,199
Source: Department of Motor Traffic
The Agriculture and Fishing Sector grew by 5.8% for the year under review as against 1.4% in 2011 whilst contributing 11.2% to total GDP growth, fuelled by favourable weather conditions in early 2012.
The performance of the Industry Sector was driven by substantial forward momentum in the Construction sub-sector, which recorded an impressive growth of 21.6% compared to 14.2% in 2011. This is the highest growth registered by the sub sector in the past ten years. Overall, the Industry sector, which accounts for approximately 30.4% of GDP, grew by 10.3% in 2012, contributing substantially to the expansion of the economy.
Growth in the Services Sector, which is the largest sector of the economy, accounting for 58.5% of GDP moderated to 4.6% in 2012 from 8.6% in 2011.
Pertinent Aspects of Sri Lanka’s Economic and Social InfrastructurePowerElectricity generation in 2012 increased moderately by 2.4% to 11,800 GWh compared to 11,528 GWh in 2011. The share of power generated by Ceylon Electricity Board, in relation to total power generation decreased to 52% in 2012 from 57% in 2011, reflecting the increase in the share of power produced by the private sector from 43% to 48%. Ceylon Electricity Board is a key target customer for Power Engineering Solutions Business.
The Operating Environment...and Trends
Management Report

20
D I E S E L & M O T O R E N G I N E E R I N G P L C
A N N U A L R E P O RT 2 0 1 2 / 1 3
Water Supply & IrrigationThe demand for pipe borne water has increased significantly in line with rapid expansion in commercial and industrial activities and urbanisation. The National Water Supply & Drainage Board provided 137,874 new water connections in 2012. Thereby the total number of connections managed by them reached 1.6 mn, reflecting a 9.5% increase. Water supply and irrigation is a key target segment for the Fluid Management Business of the Group.
Health In recent times, there has been a surge in Non-Communicable Diseases (NCD), such as heart diseases, diabetes and cancer. While NCDs have beaten communicable diseases as the leading cause of death in the country, the trend is expected to continue in the context of an increasingly aging population.
It is expected that the growing per capita income will entail significant changes to lifestyles, adding major risk factors for developing chronic NCDs. The target sector of the Bio Medical Engineering Business is the health sector.
What the Local Economy holds in Store...This is about - ambition, alignment and attainment - the alliterative 3 ‘a’s!
Sri Lanka has set its sights on developing into a USD 100 bn economy by 2016 - Ambition. The achievement of this goal would demand significant improvement of all public utilities from their current levels. Alignment.
Sri Lanka’s labour market needs to be re-oriented to face the challenges of achieving sustainable high economic growth. The unemployment rate, which has remained below 5% since 2010, reached a historic low of 4% in 2012. Although such low rates of unemployment could give rise to wage pressures, low labour force participation rates and possible underemployment in some sectors, indications are that there is still room for the supply of labour to improve.
The challenge of an ageing population caused by the slow population growth needs to be addressed with a long-term focus through strengthening retirement benefit schemes and reforming the health sector.
Sri Lanka’s achievements in reducing absolute poverty, even while facing an internal conflict, are well documented, but focused policies to eradicate poverty and reduce income inequality need to continue.
It is essential to strengthen the framework for sustained economic growth based on the strategy of 5 hubs (aviation, maritime, energy, commercial and knowledge) plus tourism to diversify the economy and improve the resilience of the economy to external and internal shocks.
The implementation of required structural adjustments including tax reforms and exchange control liberalisation, strengthening of institutions, and the continuation of the fiscal consolidation process are desirable for Sri Lanka to sustain this high growth momentum.
Attainment is an ongoing journey...read us next year; there’s bound to be progress...a great deal of it!
In this environment, our next step was to look closely at key elements of our business.
The Operating Environment...and Trends
The Operating Environment...and Trends
Refining our Portfolio…and Reinventing our Future
Financial Value CreationDelivering Value to Customers...and their Value to Us
Working at Dimo…Enjoyable and RewardingOur Business Partners…A Symbiotic Relationship
Regulatory Authorities…Playing by the RulesOur Community…Live and Let Live
The Environment…Now and for Generations Yet UnbornSustainability Performance Objectives in 2012-2013
Management Report
Gahanath PandithageDirector/Chief Executive Officer

21
Guiding PhilosophyManaging an investment portfolio is essentially about diversification, with the strategic objective of selecting a mix of investment assets that collectively has a lower risk than any individual asset. This is possible as different types of assets often change in value in opposite ways; and so by combining different assets whose returns are not perfectly positively correlated one may reduce the overall risk of the portfolio.
The Dimo portfolio is skewed towards the vehicles segment, which contributed to more than half of Group gross profit, followed by vehicle parts & service, machinery for construction, agriculture and materials handling, lighting & power tools and electro-mechanical & biomedical engineering.
The concentration on vehicles reflects our origins, as well as our core competencies. We have stuck to our knitting in this important sector of the economy, but have greatly grown our product and service offerings within the sector, in terms of breadth and depth. One may call it an intra-sectoral diversification that further strengthens our position in the sector.
The diversity of our portfolio is an undeniable strength.
We strive each day to optimally manage our portfolio with some obvious benefits to Company and stakeholder alike. In fine tuning and refining the portfolio, Dimo seeks continuous improvement in its financial positioning; in our book, value derived must be accompanied by value delivered. This is how we seek to maximise shareholder value.
Managing the portfolio mix to derive optimal results and returns is a continuous process.
Dimo constantly revisits its portfolio and pursues a pro-active path of differentiation; we look at upgrades to plant and equipment, new product models and constantly developing our service regimes.
We’re also exploring more diversification in areas such as building and construction technologies, power solutions, medical equipment, consultancy and advisory services, training academies and marine repairs among others.
Refining our Portfolio…and Reinventing our Future
A Forward Looking NoteContinuous refinement of the portfolio
and the resulting improvement in gradually reducing dependence on the auto segment from a risk management perspective will stabilise performance.
Management Report

22
D I E S E L & M O T O R E N G I N E E R I N G P L C
A N N U A L R E P O RT 2 0 1 2 / 1 3
Guiding PhilosophyDimo perceives that financial value creation is the mechanism that converts financial and non-financial inputs to certain outputs that are measured as financial performance. The corporate philosophy strongly subscribes to the view that financial performance is largely dependent on quality, availability and effective management of the ‘capitals’. Therefore, financial performance is considered to be the ‘barometer’ of efficiency in managing the capitals. Financial results and financial position reflect the financial performance of the Company.
Building Financial Capital
CustomerCapital
Environmental Capital
CommunityCapital
InstitutionalIntegrity Capital
Business Partner Capital
Portfolio Mix Employee
Capital
FinancialCapital
Whilst non-financial capitals are dealt with in other parts of the Management Report, this section focuses on the second strategic imperative, which is creating financial value.
Key Performance Area Metric 2012/13 2011/12 2010/11 2009/10
Profitability Sales (Rs. mn) 27,711 39,863 29,357 10,530Gross profit ratio (%) 15.21 18.23 20.30 22.70Net profit ratio (%) 1.70 6.81 7.20 2.40
Working capital management Current ratio (times)-at the year end 1.71 1.60 1.27 1.28Quick Assets Ratio (times)-at the year end 0.72 0.36 0.84 0.78
Fixed Assets Turnover (times) 4.98 8.55 9.59 4.92
Asset Utilization Capital expenditure as percentage of total assets (%) 8.50 6.20 9.90 7.00
Capital structure Debt/Equity (%) - at year end 10.10 13.40 9.80 30.20
Interest cover (times) 2.24 15.67 17.35 2.12
A Forward Looking NoteWe are focused on improving
profitability through gross profit margin, greater efficiencies, higher value
addition and productivity improvements. We will continue to diversify the
revenue sources and reduce high dependence on the motor segment.
Overall, the budgets for 2013/14 projects a significantly improved
performance compared to 2012/13.
Financial Value Creation
The Operating Environment...and TrendsRefining our Portfolio…and Reinventing our Future
Financial Value Creation
Delivering Value to Customers...and their Value to UsWorking at Dimo…Enjoyable and Rewarding
Our Business Partners…A Symbiotic RelationshipRegulatory Authorities…Playing by the Rules
Our Community…Live and Let LiveThe Environment…Now and for Generations Yet Unborn
Sustainability Performance Objectives in 2012-2013
Management Report

23
This review of financial value creation encompasses two aspects. They are;
1. Management of financial capital and
2. Review of financial performance
Whilst the former attempts to focus on managing financial capital as an input, the latter focuses on the output generated through the interaction of all forms of capitals.
Management of Financial CapitalThis entails the entire gamut of activities involved in the process of obtaining, allocating and using ‘finance’ effectively and efficiently so as to achieve the organisation’s objectives.
Economic environment has a bearing on the way financial capital is so managed. Hence, this has to be read in the context of the economic environment detailed in ‘The Operating Environment’ on pages 18 and 19.
Capital ExpenditureThe Company continued with the planned investments to expand capacity. An amount of Rs. 1,094.4 mn. (Rs. 947.4 mn in 2011/12) was invested in property, plant & equipment (PP&E) during the year. Of this, Rs. 443.9 mn was spent on the construction of the Mercedes Centre, the single largest investment planned. Other items include acquisition of a workshop on a 147 perch block of land in Moratuwa for Tata Passenger Vehicles, refurbishing of the Moratuwa workshop and construction of the Jaffna workshop.
Working CapitalThe working capital requirement substantially reduced as a result of reduced sales of vehicles, tractors and construction machinery. Value of the inventory and the number of units in stock saw significant reductions. However, receivables as at the year-end rose to Rs. 2,086 mn compared to Rs. 1,809 mn as at the beginning of the year.
FinancingLong-term debt was sought mainly to finance investments in PP&E. The outstanding balance as at 31st March 2013 was Rs. 770.2 mn (2011/12 - Rs. 1,000.1 mn), details of which are given in Note 29 to the Financial Statements. Short-term loans were obtained to finance working capital. The outstanding balance as at 31st March 2013 was Rs. 2,647.5 mn (2011/12 - Rs. 4,045.6 mn). Consequently, a total of Rs. 3,417.8 mn (2011/12 - Rs. 5,045.8 mn) was outstanding on account of short and long-term borrowings as at 31st March 2013. Interest rates on overdrafts are reviewed periodically while rates charged on short term/import loans are determined based on market rates.
Treasury ManagementThe Group operates a central treasury function. It controls decisions in respect of cash management, utilisation of borrowing facilities, banking relationships, interest rate risk and foreign currency exposure management. Further, it facilitates effective cross utilisation of funds between business units.
Cash FlowFunds generated from operating activities increased to Rs. 4,111.3 mn (Cash out flow of Rs. 55.6 mn - 2011/12) despite a significantly lower operating profit. This was possible due to the reduction in working capital requirements consequent to a reduction in inventory. This helped the Company to generate a net increase in cash and cash equivalents of Rs. 1,763.1 mn (a net decrease of Rs. 2,941 mn - 2011/12) after cash outflows on investing and
Financial Value Creation
Management Report
10 11 12 13
Rs. mn
Growth in Property, Plant& Equipment
09
0
1,200
2,400
3,600
4,800
6,000
-50
-25
0
25
50
75
Growth (%)
Property, Plant & Equipment (Rs. mn)
%
0
1,600
3,200
4,800
6,400
8,000
Rs. mn
Capital Structure
09 10 11 12 13
Borrowings Shareholders

24
D I E S E L & M O T O R E N G I N E E R I N G P L C
A N N U A L R E P O RT 2 0 1 2 / 1 3
financing activities. Improvement in funds generated from operating activities enabled the Company to have a positive free cash flow (defined as cash flow from operating activities less capital expenditure) of Rs. 3,016.9 as against a negative free cash flow of Rs. 1,002.9 in 2011/12.
Financial PrioritiesPlans to enhance workshop capacity and the dip in profitability have given rise to the need to raise funds at competitive costs to support investment plans, prudent management of costs and efficient management of working capital.
These concerns are integrated with the identified long-term financial priorities that are strongly pursued in formulating corporate strategy. Given below are the financial priorities that drive the Group’s financial strategy:
• Financial investment in capacity building in order to drive growth.
• Striking a balance between growth and immediate profitability in allocating financial resources.
• Optimising profitability through efficient utilisation of resources particularly through prudent working capital management.
• Maintaining a healthy Balance Sheet.
Financial Performance
OverviewThe overall performance during the year was below expectations. The profit before tax reduced by 87 % to Rs. 490 mn from Rs. 3,724.5 mn in 2011/12. Lower turnover and gross profit margins were two key factors that affected the profit before tax. Increase in administrative expenses and net finance cost too created an adverse impact on profits.
As a result of the turnover of the vehicles, construction & material handling equipment, commercial vehicles and passenger vehicles segments dropping, Group turnover reduced by 30% to Rs. 27.7 bn from Rs. 39.9 bn the previous year. The reduction in vehicles segment turnover is mainly attributed to the reduction in the market size or the number of vehicles imported into the country. The statistics pertaining to vehicle imports are given on page 19. The demand for the construction machinery did not correspond to the growth in the construction sector. On the other hand, turnover of vehicles after-sales segment & electro-mechanical, biomedical engineering and marine solutions segment increased by 31.6% and 34.2% respectively.
ProfitabilityThe gross profit margin reduced from 18.2% to 15.2%. This is primarily attributed to the lower margins in the vehicle related businesses. The vehicle permit regime under which a large number of passenger vehicles were imported on concessionary tariff and the lower demand for vehicles created pressure on gross profit margins.
On the other hand, administration expenses and distribution expenses taken together increased by 4%. The reduction in the distribution expenses is due to the decrease in the provision for impairment of receivables as a result of the change in the provisioning policy in order to be in line with adoption of LKAS 39. The impact due to the change in policy is given in Note 38 to the Financial Statements.
In the backdrop of increased borrowing rates, a higher level of borrowings during the first half of the year, the net finance cost increased to Rs. 395.5 mn from Rs. 253.9 mn in the previous year.
Financial Value Creation
The Operating Environment...and TrendsRefining our Portfolio…and Reinventing our Future
Financial Value Creation
Delivering Value to Customers...and their Value to UsWorking at Dimo…Enjoyable and Rewarding
Our Business Partners…A Symbiotic RelationshipRegulatory Authorities…Playing by the Rules
Our Community…Live and Let LiveThe Environment…Now and for Generations Yet Unborn
Sustainability Performance Objectives in 2012-2013
Management Report
Composition of GrossProfit by Segment2012/13
43%
30%
10%
7%
10%
Vehicles Sales
Vehicles After Sales Services
Marketing & Distribution
Construction & Material Handling
Equipment & After Services
Electro Mechanical & Bio Medical
Engineering & Marine Solutions
[5%]*[5%]*
[7%]*
[16%]*
[67%]*
* Comparative figures are in brackets
Cost and Expenses2012/13
2%
11% 1% [1%]*[7%]*
[2%]*
86% [90%]*
Cost of Sales
Distribution
Administrative
Financing Cost
* Comparative figures are in brackets

25
TaxationThe rate of income tax applicable to the Company and subsidiaries was 28%, whilst the rate of income tax applicable for exports was a concessionary rate of 12%. The qualifying payment arising under Section 34 (C) of the Inland Revenue Act No. 10 of 2006 and amendments thereto, on account of the investment in the Mercedes Benz Centre enabled the Group to lower its tax charge for the year. Details of income tax charge for the year are available in Note 12 to the Financial Statements. The tax expense includes a tax reversal of Rs. 42.7 mn on account of deferred tax (Rs. 29.8 mn in the last financial year). A summarised computation of deferred tax is given in Note 28 to the Financial Statements.
EarningsEarnings before interest and tax (EBIT) for the year reduced to Rs. 885.5 mn from Rs. 3,978.4 mn the previous year while net profit after tax reduced to Rs. 462 mn from Rs. 2,701.7 mn. Following suit, earnings per share (EPS) reduced to Rs. 52.06 from Rs. 304.36. The computation of EPS is given in Note 13 to the Financial Statements.
Stakeholder Financial Implications As shown in the Statement of Value Added below, the Group generated a value addition of Rs. 5,794 mn during the year as against Rs. 10,932 mn in 2011/12 which was shared with the various stakeholders and a portion was retained within the Company. Reflecting lower earnings, Economic Value Added (EVA) too turned negative for the year. However, it is noteworthy that the EVA for the financial years 2011/12 and 2010/11 was a positive Rs. 1,904 bn and Rs. 1,762 bn respectively.
Statement of Value Added and DistributedGroup Company
For the period of 2012/13 2011/12 2012/13 2011/12
% Rs. ’000 % Rs. ’000 % Rs. ’000 % Rs. ’000
Gross turnover 27,711,604 39,862,943 26,496,949 38,877,422Other income 40,321 49,846 38,305 43,968Less: Cost of materials and services bought in (21,957,333) (28,980,946) (21,111,205) (28,355,619)
5,794,592 10,931,843 5,424,049 10,565,771
Distribution of Value Added
Employees 29 1,657,099 13 1,372,494 27 1,480,637 11 1,211,045Government 51 2,971,592 55 6,062,532 54 2,901,017 57 5,977,377Lenders 07 395,480 02 253,890 07 389,620 03 267,900Community investment 00 52,122 00 51,055 00 51,522 00 50,526Shareholders 02 88,764 03 355,057 02 88,764 03 355,057Retained in the business 11 629,535 26 2,836,815 09 512,489 26 2,703,866Depreciation set aside 03 167,385 01 135,164 03 160,665 01 129,965Profit retained 08 462,150 25 2,701,651 06 351,824 24 2,573,901
100 5,794,592 100 10,931,843 100 5,424,049 100 10,565,771
Financial Value Creation
Management Report
Rs. mn
Earnings
09 10 11 12 13
0
1,000
2,000
3,000
4,000
5,000
Profit Before TaxEBITDA* EBIT**
* Earnings Before Interest, Tax, Depreciation
and Amortisation
** Earnings Before Interest and Tax
Ajith AlgamaExecutive Director

26
D I E S E L & M O T O R E N G I N E E R I N G P L C
A N N U A L R E P O RT 2 0 1 2 / 1 3
ShareholdersTotal shareholder return (TSR) computed taking into account the movement in share price at the beginning and end of the year and the dividends declared turned a negative 47.5% due to the drop in the share price and the lower dividend. Value of a Rs. 1,000/- invested in 2004 appreciated to Rs. 11,879/- as at current year end although it is one third of the value as at 31st March 2011 when it reached a peak of Rs. 34,238/-. Reflecting lower earnings, return on assets too came down to 6.6% from 19.3% last year.
Financial PositionPrimarily due to the drastic drop in inventory, the total assets contracted from Rs. 15.3 bn a year ago to Rs. 12.9 bn as at 31st March 2013. However, with Rs. 7,631.1 mn in equity and borrowings at Rs. 770.2 mn, Dimo had a debt to equity ratio of 0.10 : 1 signifying a strong financial position with a relatively low level of gearing. Lower business volumes and the resulting drop in the working capital requirement improved liquidity. The current ratio as at 31st March 2013 was 1.71 : 1 (2011/12 - 1.60 : 1) while the quick assets ratio was 0.72 : 1 (2011/12 - 0.36 : 1).
SolvencyAs required by Section 56 of the Companies Act No. 07 of 2007, the Company carried out solvency tests prior to the payment of the final dividend. The Company Auditors certified that the Company has the ability to pay its debts as they become due in the normal course of business and that the value of the Company’s assets is greater than the value of its liabilities and the Company’s stated capital.
Financial Outlook 2013/14Removal of regulatory restrictions on credit growth of commercial banks with effect from 1st January 2013 is expected to increase the supply of credit encouraging investment. Permission given to the private sector to secure borrowings from foreign sources, albeit with limitations, is expected to further facilitate investment. Dimo, being a company that is involved in supplying capital goods would stand to gain in a scenario of expanding investments. Expansion of credit supply also brings the possibility of lower rates of interest that could lower financing costs. Overall, the budgets prepared for the financial year 2013/14 projects a significantly improved performance compared to the year 2012/13.
What follows is an account of our ‘non-financial’ enterprise, the social and environmental dimensions of our business.
%
Total Shareholders’ Return
09 10 11 12 13
-200
0
200
400
600
800
Financial Value Creation
The Operating Environment...and TrendsRefining our Portfolio…and Reinventing our Future
Financial Value Creation
Delivering Value to Customers...and their Value to UsWorking at Dimo…Enjoyable and Rewarding
Our Business Partners…A Symbiotic RelationshipRegulatory Authorities…Playing by the Rules
Our Community…Live and Let LiveThe Environment…Now and for Generations Yet Unborn
Sustainability Performance Objectives in 2012-2013
Management Report
12/13 11/12 12/13
%
Balance Sheeet Structure
11/12
Assets
0
20
40
60
80
100
Property, Plant & Equipment
Investments & Other Current Assets
Trade Debtors
Inventories
Assets
Liabilities & Equity
Liabilities and Equity
Other Current Liabilities
Trade Creditors
Short-Term Borrowings
Long-Term Borrowings
Shareholders’ Funds

27
We have made an art of having a vibrant engagement regime…with
training, development empowerment and reward in tandem…we continue
to exist.

28
D I E S E L & M O T O R E N G I N E E R I N G P L C
A N N U A L R E P O RT 2 0 1 2 / 1 3
Guiding PhilosophyA customer centric business culture has always prevailed at Dimo and been passed down from one generation to the next. Tradition leads Dimo tribe members, in treating customers with respect. We are all of one mind - that the customer is indispensable to the success and sustainability of our business. We are well aware that we cannot create value without our customers.
Our constant goal is to reach that critical point where our customers come to regard Dimo as their trusted solution provider. In doing so and among other areas of initiative realised, we build customer capital.
Our customers have transacted business to the value of Rs. 27.7 bn (Rs. 39.9 bn in FY 2011/12) during the financial year under review.
There are many initiatives we take in building customer capital. They include growing our customer reach, building our own competencies to serve the customer, offering responsible customer care and a comprehensive customer relationship management regime.
Our ultimate objective is to offer customers a pleasurable experience every time, which will lead them back to us many times over.
Delivering Value to Customers...and their Value to Us
A Forward Looking NoteWe will continue to invest in people,
systems, processes and facilities to better serve our customers’ ever
evolving needs. The resultant growth and enhancement derived will ensure
that our customer capital is maintained at a consistently high level.
Key Performance Area Metric 2012/13 2011/12 2010/11 2009/10
Customer service No. of CRM personnel 35 42 4 3Customer convenience No. of Customer Interaction Points 52 40 25 19
No. of business locations in the North and the East 8 4 – –Customer satisfaction Average Customer Satisfaction Index (%) 85.50 89.20 85.60 86.00
Our handshake is warm…a seal of the trust we share
Dimo - Customers
The Operating Environment...and TrendsRefining our Portfolio…and Reinventing our Future
Financial Value CreationDelivering Value to Customers...and their Value to Us
Working at Dimo…Enjoyable and RewardingOur Business Partners…A Symbiotic Relationship
Regulatory Authorities…Playing by the RulesOur Community…Live and Let Live
The Environment…Now and for Generations Yet UnbornSustainability Performance Objectives in 2012-2013
Management Report

29
Building Customer Capital Profiling the Customer
Reaching the Customer
Responsible Customer Care
Building Competencies
to Serve the Customer
Customer Relationship Management
Engaging the Customer
Nurturing Relationships
Customer Capital
Staying in TouchIn reaching and fulfilling the expectations of customers, our approach is simple - it relies on gaining as complete an understanding of our customers as we can achieve and then fulfilling their personalised requirements to the best of our ability. To deliver this, we have in place several channels of contact, interaction and engagement with our customers.
Customer PortalsThe Company has made significant investments over the years to bring the multi-faceted product and service portfolios of Dimo as close as possible to the customer.
During the year under review, Dimo operated a network of 52 (40 in 2011/12) Customer Interaction Points comprising a mixture of Branches, Customer Contact Points and Display Points - all geared to reach and serve the customer.
The concept of ‘Customer Contact Points’ has proved to be an efficient way of reaching potential customers. Currently 25 such points are in operation. Many of these avenues which started life as customer contact points have now been transformed into branches.
Our strategic alliances with top banks, leasing and finance companies enable us to offer our customers special rates of interest and tailor-made schemes to go with specific products.
Delivering Value to Customers...and their Value to Us
Management Report
Dimo Branch Network

30
D I E S E L & M O T O R E N G I N E E R I N G P L C
A N N U A L R E P O RT 2 0 1 2 / 1 3
In addition, Dimo has other channels such as ‘Riyaharasara’ and concepts such as Village to Village (Gamin Gamata) which localise the customer reach and support market penetration and customer awareness.
The Dimo web site www.dimolanka.com whilst providing information on a range of products and services also facilitates customer contact.
We also offered a special concessionary scheme to support small scale entrepreneurs registered under the Government’s Samurdhi scheme.
Call CentreA call centre was launched in May 2012 where all inquiries and complaints can be managed in a more structured manner. This also facilitates recording of content whilst ensuring immediate action is taken on all customer inquiries and grievances.
Building Capacities and Competencies to Serve Customers Matching the blues...it’s an apt description of what it takes; blue-chip brands require blue-chip...everything. The best must be served by the best. In other words Dimo, if we are to serve the customer well, must raise capacities and competencies to match a blue-chip portfolio of brands.
This is a constant pursuit that spans every facet of enterprise - most visibly in upgrading of infrastructure, service offerings and training. Exemplars are - the soon to be opened state-of-the-art Mercedes Benz service complex with its 300 seat auditorium, Benz museum and cafe, the new equally state-of-the-art Bosch Diesel and Car Service Centre, the accredited Lighting Solutions Division to carry out energy audits, energy saving solutions and turnkey solutions on sophisticated lighting systems for specialised applications (e.g., lighting for sports stadiums etc.), industry and staff training and so much more.
Customer Care...A Responsible ApproachResponsible enough to care…caring enough to be responsible - two sides of the same coin? Where our customer is concerned, it doesn’t matter how you put it. What is important to us is looking beyond ‘business as usual’ to the comfort, safety and well-being of our customers as they use our products and experience our service.
Product and Service Labelling, User ManualsCompany’s products are adequately labelled. Catalogue referenced and user manuals made available, where applicable. Labelling also conforms to statutory requirements in respect of providing diagrams and pictographs, expiry dates, standardisation code numbers and information on possible environmental impact where relevant. The requisite quality certification stamps are also carried.
All products marketed by us incorporate the highest levels of safety. Dimo follows principals’ guidelines and globally accepted best practices to ensure that in the process of after sales care, the highest levels of safety are afforded to our customers. In addition, all health and safety measures as per ISO accredited guidelines are employed.
Brand specific investments of
Rs. 1,540 Mn on Mercedes Benz
Centre, BOSCH Service & Diesel
Centre and TATA workshops
in Jaffna, Trincomalee and
Moratuwa
Delivering Value to Customers...and their Value to Us
The Operating Environment...and TrendsRefining our Portfolio…and Reinventing our Future
Financial Value CreationDelivering Value to Customers...and their Value to Us
Working at Dimo…Enjoyable and RewardingOur Business Partners…A Symbiotic Relationship
Regulatory Authorities…Playing by the RulesOur Community…Live and Let Live
The Environment…Now and for Generations Yet UnbornSustainability Performance Objectives in 2012-2013
Management Report
Sarath AlgamaExecutive Director

31
Management Report
Ethical CommunicationsDimo’s marketing communications are founded on transparency, honesty, ethical standards and conformity with statutory requirements.
There were no instances of non-compliance with any regulation on marketing communications during the year.
Product ResponsibilityOur principals, representing leading global brands, market some of the most responsible products in their respective categories. Hence, every product offered by Dimo is often a leader in the area of product responsibility. Dimo, on its part, is committed to keeping abreast of developments and offering the latest products and innovations of its principals to the Sri Lankan market.
Let’s take a few brief examples:
Our Osram lighting products offer up to 90% energy savings compared to conventional incandescent and halogen lamps and have a service life of up to 45,000 hours; they also incorporate mercury-free production.
The Dimo Lighting Solutions Division has a world class product range that permits customers to score well in the rating of LEED’s (Leadership in Energy and Environmental Designs) standards. Further, we are a member of the US Green Building Council and are in position to consult/evaluate construction projects and issue rating reports as per LEED’s standards.
All Bosch Power Tools are eco-friendly and recyclable. They also come fully insulated to guard the user against any hazard such as electrocution.
Mercedes Benz ‘Blue Efficiency’ models are up to Euro 5 environmental norms (a European environmental standard). The new S class automobile will be marketed from December 2013 and will incorporate a hybrid engine - a ‘First’ for Mercedes and Dimo in Sri Lanka.
The medical equipment we retail is globally approved by FDA and CE standards and also CDDA of Sri Lanka in terms of safety.
Customer Information ProtectionDimo respects customer privacy and is wholly committed to protecting customer data. We have in place systems that allow us to contact our database of customers - but only with their explicit permission and in the channel of their choice.
No complaints pertaining to breaches of customer privacy or loss of customer data were received in the year under review. Further, there were no incidents during the past year relating to transgression of health and safety, product labelling, advertising or customer confidentiality.
The Features of Managed Relationships All of us at Dimo and particularly our Customer Relationship Management Division have developed a ‘good ear’...we pick up even the faintest whisper from our customers and run it through our systems and processes in the cause of delivering a superior experience.
Delivering Value to Customers...and their Value to Us
Dr. Harsha CabralIndependent Non-Executive Director

32
D I E S E L & M O T O R E N G I N E E R I N G P L C
A N N U A L R E P O RT 2 0 1 2 / 1 3
The CRM Division conducts a series of activities to maintain regular contact with customers and is well positioned to capture effective and candid feedback.
The CRM Division currently provides a monthly data analysis service to the vehicle segment, which is subsequently circulated to all business segments. All other business segments analyse their data on a quarterly basis in consultation with senior management. This data is invaluable to the Company as it seeks constantly to enhance problem solving and product and process refinement.
The role of CRM can be displayed in three main aspects as in Profiling the Customer, Engaging the Customer and Nurturing Customer Relationships.
Our Customers’ FeaturesTo us Dimo customers are not of mere names...never lines on a graph. They’re very real...and we know them well!
Currently, Dimo enjoys the patronage of 42,000 direct customers - individuals, businesses and Government - as well as a large differentiated dealer network.
Our dealers in turn serve several hundreds of thousands of consumers of our products.
During the year under review, many customer campaigns and customer profiling surveys were conducted within the Vehicle Sales and After Sales Division. Approximately 24,000 customers were reached through these surveys. A key objective of these surveys, among others, was to identify prospective customer segments with potential to generate further business opportunities for the Company. It is an interesting and important feature of our business that many of our customers are exposed to and served by more than one of our business segments. This indicates the efficacy of the ‘One Dimo’ concept at work, as customers are introduced to the total Dimo product and service offering.
EngagementWe engage with our customers on a variety of issues in order to understand them well. During the year under review, we conducted several one to one surveys to identify customer concerns. These concerns were then addressed in accordance with their materiality and importance.
The most material concerns identified during the survey this year was the issue of product information not being shared adequately with the customers.
This was addressed by conducting training sessions on product knowledge to ensure sales staff have adequate knowledge of the products we offer. During 2012/13, 118 such programmes were conducted for 802 members of the sales team. In addition to the customer engagement described; we also have several industry as well as socially specific initiatives that provide excellent opportunities for close contact.
Delivering Value to Customers...and their Value to Us
The Operating Environment...and TrendsRefining our Portfolio…and Reinventing our Future
Financial Value CreationDelivering Value to Customers...and their Value to Us
Working at Dimo…Enjoyable and RewardingOur Business Partners…A Symbiotic Relationship
Regulatory Authorities…Playing by the RulesOur Community…Live and Let Live
The Environment…Now and for Generations Yet UnbornSustainability Performance Objectives in 2012-2013
Management Report
Suresh GooneratneExecutive Director

33
Initiatives such as the Mercedes Benz Club of Sri Lanka, (now in its 23rd year of existence and the oldest club of its kind in Sri Lanka) and the TATA Fleet Owners’ Club offer a full calendar of customer interaction on both industry and social level.
When Things Don’t Go Quite Right...Our CRM process has been streamlined and developed in order to ensure speedy response to customer complaints. As a result, during the year under review, we were able to identify and record our customer complaints more methodically and to provide appropriate solutions.
During the year under review, Dimo received 896 (261 in FY 2011/12) customer complaints. Of these, 574 (128 in FY 2011/12) were resolved within the stipulated 3-day time frame. All other complaints were also eventually solved.
Likewise, we received 47,000 (30,000 in FY 2011/12) customer inquiries, of which about one-third were floor inquiries related to vehicle purchase, repair, usage and the like.
A High Proportion of Satisfied CustomersOur Customer Satisfaction Index revealed the following levels, by segment, for the year 2012/13 - Vehicle Sales - 91%; Vehicle After Sales - 77%; Marketing and Distribution - 87%; Construction and Materials Handling - 86% and Electro Mechanical, Bio-Medical Engineering and Marine Solutions - 88%.
Let’s shift focus now to another important stakeholder group…the Dimo Tribe…our employees!
Delivering Value to Customers...and their Value to Us
Management Report
Prof. Uditha LiyanageIndependent Non-Executive Director
Customer engagement activities

34
D I E S E L & M O T O R E N G I N E E R I N G P L C
A N N U A L R E P O RT 2 0 1 2 / 1 3
Guiding PhilosophyIt is the shared philosophy of Dimo that our tribe...our employees...have to be at their best to deliver value to our customers. We firmly believe that employee engagement is crucial to delivering value. In a way it is an ‘Employee First’ policy that we advocate. That is why we have ‘making work enjoyable and rewarding’ as our Employee Value Proposition (EVP). Building employee capital is the key to building other forms of capital.
Working at Dimo…Enjoyable and Rewarding
A Forward Looking NoteA key area of focus remains that of
increasing the percentage of female employees in the Company. More
initiative will be needed in this area if we are to achieve our target of increasing
the percentage of female employees as envisaged in our sustainability
objectives appearing on pages 50 and 51 We will strive to remain ahead
of target, as at present, in regard to training of our employees.
Key Performance Area Metric 2012/13 2011/12 2010/11 2009/10
Team strength No. of employees 1,521 1,339 1019 864Gender distribution Female employees as a percentage of total employees 10 11 10 9Age distribution Percentage of employees below 40 years of age 79 81 76 72Employee satisfaction Employee Satisfaction Index (%) 53.46 62.70 54.00 54.00Knowledge and skills development Average training hours per employee 16.00 13.52 10.90 10.34
No. of employees trained on HR policy and procedure with regard to Human Rights as a total training hours (%) 39.00 42.00 53.00 11.60
Employee health & safety Injuries ratio (%) 1.20 1.60 2.50 0.70
“Recognised among the Top Ten
business entities with HR Best
Practices by the Association of
Human Resource Professionals;
Ranked among the top 15 ‘Great
Places to Work’ in Sri Lanka.”
Mutuality…of care…rewards all
Dimo - Employees
The Operating Environment...and TrendsRefining our Portfolio…and Reinventing our Future
Financial Value CreationDelivering Value to Customers...and their Value to Us
Working at Dimo…Enjoyable and Rewarding
Our Business Partners…A Symbiotic RelationshipRegulatory Authorities…Playing by the Rules
Our Community…Live and Let LiveThe Environment…Now and for Generations Yet Unborn
Sustainability Performance Objectives in 2012-2013
Management Report

35
Building Employee Capital
Employer Branding
Recruitment & Selection
Training & Development
Employee Relationship Management
Performance Management
Employee Satisfaction
Compliance Leadership Development
Special Rewards & Recognition
Employee Capital
Employee Health & Safety
Some Key NumbersAlthough it is our experience that numbers, by themselves, cannot ‘tell the whole story’ particularly when it comes to dealing with people, their effort, commitment, emotions and more, they are useful in mapping what has been accomplished and vice versa.
Here then, are some of the key numbers for the year under review.
In 2012, the Dimo Group spent Rs. 1,657 mn (2011/12 - Rs. 1,372 mn) on salaries and wages, defined contribution plan costs (EPF, ETF), medical, retirement benefit costs (retiring gratuity) and training expenses.
The total workforce strength as at 31st March 2013 stood at 1,521, an increase of 13.5% over the 1,339 employees who were in our cadre the previous year.
Diversity amongst our workforce is encouraged.
Recruiting and Retaining the Best
It is right and proper, we feel, that all worthwhile endeavour should spring from our conviction. In this case, it may best be summed-up in the words ‘the best’. Our portfolio consists of the best brands in the world and we seek the best people to care for them.
A transparent recruitment process is in place at Dimo. It is also free of any type of bias. We do give priority to organic growth. If the expected qualifications and competencies are matched, preference is given to existing staff to fill the vacancies that arise. This allows internal candidates every opportunity to advance in their careers.
Working at Dimo…Enjoyable and Rewarding
Management Report
Analysis of Dimo Tribe
Mohan PandithageNon-Executive Director

36
D I E S E L & M O T O R E N G I N E E R I N G P L C
A N N U A L R E P O RT 2 0 1 2 / 1 3
Where we need to recruit externally, the Company takes several strategic measures. These include participating at trade and youth fairs where we have opportunity to ‘head hunt’ required talent, doing the same with talented young engineering professionals who attend our Career Guidance Days at the Universities of Moratuwa and Peradeniya. Also, course followers at DATS (Dimo Auto Training School), NAITA (National Apprentice and Industrial Training Authority) and other vocational trainees who undergo training with us have an opportunity to join our permanent cadre dependent on our recruitment needs.
We are an equal opportunity employer. To date we have recruited 10 female employees who work at our automobile workshop - a hitherto ‘male bastion’.
An important aspect of retaining staff with the Company is training and development.
Employee training and development needs are mapped according to job and career advancement potential in relation to the Company’s own development and progress. This is an inclusive process that makes full use of the performance evaluation system.
A training calendar is formulated and all training imparted is assessed for effectiveness through participants’ feedback as well as the Company’s own evaluation process. Training opportunities are provided both locally (from internal and external sources) and overseas.
Dimo fosters the learning habit. Job-related educational expenses and subscriptions for membership in professional bodies are reimbursed by the Company in a bid to promote knowledge acquisition and personal development.
For the year in review, 233 employees underwent external (local) training whilst, 94 underwent overseas training, all of which was funded by the Company.
Facilitating Great Employee RelationshipsGreat relationships are built on trust and openness amongst other factors. At Dimo, it matters not if you spend the majority of your day in jacket or overalls...in the Board room or the shop floor. There’s a lot of listening, meeting, discussing, analysing and more that goes on across the many channels of communication that Dimo has in place across the Group.
Several channels of communication are open, two ways, to facilitate and nurture great employee relationships.
Once a month, the Employees’ Council meets - this is an open forum where employees discuss their concerns with top management - including the Chairman/MD, CEO of the Company. All Executive Directors, General Managers, Business Unit Managers and a representative from each business unit participate at these meetings. Minutes of the meetings are posted on the Company’s intranet and can be viewed by any employee.
A unique programme, Working @ Dimo, provides an opportunity for employees to express their views, experiences and feelings for/of the Company. Each week an employee is given the opportunity to publish his/her work-related experience on the intranet.
Working at Dimo…Enjoyable and Rewarding
The Operating Environment...and TrendsRefining our Portfolio…and Reinventing our Future
Financial Value CreationDelivering Value to Customers...and their Value to Us
Working at Dimo…Enjoyable and Rewarding
Our Business Partners…A Symbiotic RelationshipRegulatory Authorities…Playing by the Rules
Our Community…Live and Let LiveThe Environment…Now and for Generations Yet Unborn
Sustainability Performance Objectives in 2012-2013
Management Report
Gladwin PeirisExecutive Director

37
HR Clinics is a scheme where HR personnel visit staff at their location of work to initiate dialogue on any issue/concern that needs speedy resolution. During the year, 10 (9 - 2011/12) HR clinics were conducted.
This same climate envelops our grievance handling system. Once lodged, the Company ensures that a response is given to the employee within a period of 10 working days. A total of 26 issues were lodged during the year under review.
Review and Reward...Among the BestFairness and honesty are qualities we employ generously, when we set about performance reviews, remuneration and other benefits for staff.
Review systems are properly constituted and conducted whilst remuneration packages are consistently maintained at least on par with industry standards, if not above them. In fact Dimo offers much more than the minimum salary levels prescribed by law.
Performance based incentive schemes are in place and super performers are duly rewarded.
Longevity of service is given special recognition and treated as a milestone for the employee concerned.
In terms of benefits, the Dimo Tribe is entitled to a comprehensive medical scheme and an equally comprehensive welfare regime.
How Satisfied Are Employees at Dimo?It’s a critical question and one whose response we map diligently. We take great pains to ensure employees have a great experience working at Dimo and we are acutely aware of our responsibilities in this regard.
The Company commissions independent third party surveys to ascertain employees’ views on a gamut of subjects.
The survey carried out for the year under review, attracted a response rate of 90.86%. The overall satisfaction index achieved was 53.46%, which was lower than the previous year’s figure of 62.69%.
Of course, there would be no enterprise if not for our next focus group...
The ‘Employee of the Year’ or
the ‘Dimo Star’ was rewarded
with a TATA Nano.
Working at Dimo…Enjoyable and Rewarding
Management Report
Ranjan SeevaratnamIndependent Non-Executive Director

38
D I E S E L & M O T O R E N G I N E E R I N G P L C
A N N U A L R E P O RT 2 0 1 2 / 1 3We have made an art of building lasting relationships with business partners…founded on shared principles… always delivering on expectations…we continue to exist.

39
Guiding PhilosophyOur business partner capital comprises the win-win relationships we enjoy with our partners, which we have nurtured over the years. The business partner network comprises principals of brands that we represent, and local suppliers who feed the local value chain. Delivering highest quality and value to customers require a harmonised and consistent effort by us, our principals, suppliers, our distributors and dealers.
As a standard setter in many of the market segments that we serve, Dimo believes in partnering with the world’s best. In order to sustain such partnerships, we stretch ourselves to the highest standards that our principals expect of us, without compromising on quality, ethics and trust.
Our Business Partners…A Symbiotic Relationship
Key Performance Area Metric 2012/13 2011/12 2010/11 2009/10
Relationship with Principals No. of principals 81 78 72 63No. of relationships above 50 years 6 6 6 4No. of relationships between 25 to 50 years 10 9 9 8No. of relationships between 01 to 25 years 58 55 41 35No. of new relationships commenced during the year 7 8 16 16
Relationship with local suppliers Payments to local suppliers (Rs. bn) 4.7 4.5 3.9 1.8
A Forward Looking NoteOur focus will remain on nurturing the
relationships with our existing Principals while seeking new relationships that
represent a strategic fit.
The closest of relationships…we are what we are because of them
Dimo - Partners
The longest relationship with a
Principal is 74 years.
Management Report

40
D I E S E L & M O T O R E N G I N E E R I N G P L C
A N N U A L R E P O RT 2 0 1 2 / 1 3
Building Business Partner Capital
Delivery of Expectation
Conflict Resolution
Relationship Building
Expectation of Business
Partner
Strategic Fit
Business Partner
Evaluation
Self- Evaluation
Business Partner
Feedback
Business Partner Capital
Getting to be Great PartnersSome of the relationships with our principals are as long lived as Dimo’s own existence. At the same time, we constantly seek new business avenues based on emerging opportunities and our core competencies. As a consequence, we have been growing our portfolio, adding principals who represent a strategic fit.
In the beginning, it was all about like mindedness - blue-chip principals with blue-chip products, systems and processes and Dimo who share the same mindset and standards forming lasting partnerships. This is still how it is today!
We recognise our partners’ expectations. At the top of the tree, these expectations become relentless - like the need for constant investment in people, facilities and inventories in both good times and bad.
Keeping the product available at all times with easy access to the customer is a major concern suppliers have. Meeting sales targets, maintaining superior after sales service, attracting new customers whilst retaining the existing ones and introducing new products are also concerns suppliers have.
And whilst all of this is being accomplished, we need to retain and grow our market share in a sustainable manner.
And for Our Part…We understand our partners’ expectations.
During the year under review, we continued to invest substantially on establishing state-of-the-art product display points around the country and also upgraded our service facilities to the standards set by our principals.
Similar attention and investments were made in training and development of our employees, to bring them on par with international standards. We ensured also, that our technical and support staff were constantly updated on technological developments.
Knowing whether you are where you want to be is a key factor in benchmarking ourselves. To this end we conduct research, surveys and face to face interviews with stakeholders from time to time. We have entrusted this activity to specialist third party organisations. The valuable insights we gain help us to initiate further improvements to the products and services we offer. We share these findings and our response with our principals.
Setting the bar this high has paid dividends. Dimo is a market leader in many of the market segments it serves and, over the year in review, we have been able to grow market share. Retaining our market positioning will require unrelenting improvement and innovation.
And as in every facet of life it is important to play by the rules…every time!
The Operating Environment...and TrendsRefining our Portfolio…and Reinventing our Future
Financial Value CreationDelivering Value to Customers...and their Value to Us
Working at Dimo…Enjoyable and RewardingOur Business Partners…A Symbiotic Relationship
Regulatory Authorities…Playing by the Rules
Our Community…Live and Let LiveThe Environment…Now and for Generations Yet Unborn
Sustainability Performance Objectives in 2012-2013
Management Report
Channa WeerawardaneExecutive Director
A list of key Principals and the length of relationships

41
Guiding PhilosophyAt the core of the corporate strategy of Dimo is our commitment to play by the rules - in other words, to comply with all statutory and regulatory requirements. Going beyond, the Company seeks best practices to be adopted on a voluntary basis. We believe that institutional integrity is a key component of non-financial capital and is vitally important for the sustainability of our business.
Building Institutional Integrity Capital
Adoption of
Best Practices
Compliance
with Statutory Requirements
Compliance
with Regulatory Requirements
Institutional Integrity Capital
Regulatory Authorities…Playing by the Rules
A Forward Looking NoteSubstantial amounts of duties/taxes
will be paid.
Key Performance Area Metric 2012/13 2011/12 2010/11 2009/10
Contribution to Exchequer Tax paid to government (Rs. mn) 2,972 6,062 5,571 1,520
Defined…the boundaries of ethical enterprise
Regulatory Authorities
Management Report

42
D I E S E L & M O T O R E N G I N E E R I N G P L C
A N N U A L R E P O RT 2 0 1 2 / 1 3
We Work Well TogetherDimo maintains excellent relationships and works closely with all relevant authorities including those from central and Local Government.
The closeness of these relationships allows Dimo to contribute towards legislation and policy formulation which ultimately can have an impact on our customers, employees and business.
For example, we contribute towards the formulation of tax policies through our membership and participation in relevant professional and industry bodies.
We make sure that all employees of the Group are promptly updated on regulatory changes that apply to us. Specialised training on subjects such as taxation, import procedures, changes in Local Government regulations and changes in tariff structures are provided as needed.
We acknowledge that changes to regulatory frameworks can have a significant impact on our performance. We have given due consideration to this fact within our risk management regime, which is discussed on page 70 of this Annual Report.
Dimo maintains an exemplary record of compliance.
10 11 12 13
Rs. mn
Group Revenue to Government
09
0
1,500
3,000
4,500
6,000
7,500
Regulatory Authorities…Playing by the Rules
The Operating Environment...and TrendsRefining our Portfolio…and Reinventing our Future
Financial Value CreationDelivering Value to Customers...and their Value to Us
Working at Dimo…Enjoyable and RewardingOur Business Partners…A Symbiotic Relationship
Regulatory Authorities…Playing by the Rules
Our Community…Live and Let Live
The Environment…Now and for Generations Yet UnbornSustainability Performance Objectives in 2012-2013
Management Report
Vijitha BandaraGeneral Manager - Sales and After Services - Commercial Vehicles
Member - Group Management Committee

43
Guiding PhilosophyDimo is conscious of the fact that it is positioned within and is part of a larger community. In fact, so are our customers and employees. We seek the acceptance of our community as a responsible corporate. That is why we consider the community to be one of our stakeholders.
As much as our personal values and beliefs dictate that we be considerate towards others, collectively we have resolved that these values and beliefs be put into practice. We consider it our duty to listen to what the community expects from us and meet them within the bounds of economic reality.
The stakeholder engagement surveys that have been carried out helped us to identify the areas that we should involve ourselves in, to help and develop our community.
1. Supporting technical and vocational education of youth.
2. Developing the social and physical infrastructure of the community.
3. Enhancing the quality of life of the local community.
Our Community…Live and Let Live
A Forward Looking NoteOur focus will remain on youth
education and development
Key Performance Area Metric 2012/13 2011/12 2010/11 2009/10
Investing in community Community investments as percentage of turnover (%) 0.19 0.14 0.10 0.10Development of youth No. of vocational training students as a percentage of
full-time employees (%) 10.50 14.24 14.52 N/A
Rs. 90 mn invested in soon to
be opened driving school in
Sooriyawewa
World class…trainers…training…trainees
Community
Management Report

44
D I E S E L & M O T O R E N G I N E E R I N G P L C
A N N U A L R E P O RT 2 0 1 2 / 1 3
Building Community Capital
Defining the Scope for Service to the Community
Supporting Technical and Vocational Education of Youth
Enhancing the Quality of Life of the Local Community
Expectation of the Community
Economic
Reality
Community Capital
Developing the Social and Physical Infrastructure of the Community
Whilst our engagement with the community is across many fronts, we have focussed on the identified areas as already mentioned, as being the ‘needs of the hour’.
Supporting Youth EducationThe Dimo Automobile Training School (DATS) is our flagship venture playing a significant role in providing youth of our country a premium educational opportunity.
DATS is a state-of-the-art training facility set up in 1990 at our workshop in Siyambalape.
The first school was joined in 2010 by a second, set up in Jaffna. Each school enrols every year, a batch of 16 students, selected via an entrance examination, to follow a two year world class comprehensive diploma course that covers all aspects of the automobile industry.
During their studies, the students are exposed to premier world brands such as Mercedes Benz, TATA and Bosch and some have the added benefit of spending time with our principals in Germany, where they are exposed to first hand training in a high-tech environment.
During the training period, students receive subsidised meals, uniforms and footwear at Dimo’s cost.
The DATS certificate is well recognised by both Sri Lankan and foreign engineering industries.
Depending on the availability of vacancies, graduates of DATS are offered positions at Dimo. However, there is no obligation whatsoever, for them to accept these positions - they are free to make their career choices as they desire.
In total, DATS has produced 322 diploma holders.
Our Community…Live and Let Live
The Operating Environment...and TrendsRefining our Portfolio…and Reinventing our Future
Financial Value CreationDelivering Value to Customers...and their Value to Us
Working at Dimo…Enjoyable and RewardingOur Business Partners…A Symbiotic Relationship
Regulatory Authorities…Playing by the RulesOur Community…Live and Let Live
The Environment…Now and for Generations Yet UnbornSustainability Performance Objectives in 2012-2013
Management Report
Anuradha DiasGeneral Manager - Tyres
Member - Group Management Committee

45
In addition, Dimo provides practical training at its own facilities for aspiring engineering graduates from a wide cross section of institutions such as Universities and Technical Training bodies.
During 2012/13, 154 students were provided with such vocational training compared with 101 students in 2011/12.
Sinahawa(Smile) is a scholarship programme launched by the Tyre Division of Dimo targeting underprivileged GCE Advanced Level students. The programme was initiated in 2009 and ran for a period of 24 months and was completed in August 2012. It supported the needs of 100 students selected from all parts of the country.
The programme was a remarkable success when you consider that 89% of the students passed GCE (A/L) and 52% became eligible for University entrance (against the response rate).
Dimo Batta Lassana Hetak was an educational project launched by the Company’s TATA Commercial Vehicles Division on Children’s Day, October 2010. It was a scheme to teach and improve the command of the English Language to students who have no access to such instruction. The project was targeted at students from Grades 1 to 11.
Initially, not having the expertise in-house, we sought the help of the British Council, Colombo who magnanimously helped by conducting a preliminary needs assessment, then selected and trained a group of teachers for the project, developed an additional language curriculum for the school and developed the course materials.
Helping to Put Infrastructure in PlaceHere again, our initiatives are many.From several schemes to enhance educational/career prospects of soon to be adults, to the planned commissioning of a state of the art driving and technical training school, the Dimo Technical Institute at Sooriyawewa, the Group is active across the country...making a difference!
Enhancing the Quality of Community LifeFrom water supply projects, provision of subsidised light commercial vehicles to the self employed small scale entrepreneur, making available our light trucks for the transport of coconuts under the Government’s Kapruka Purawara programme, to many other projects in the field of community health and the socio-cultural sector, Dimo is one of the most active corporates making a meaningful contribution to community life in Sri Lanka.
Every enterprise has its origins on planet earth...we need now, more than ever, to befriend it...
Dimo was ranked among the Top
Ten Corporate Citizens by the
Ceylon Chamber of Commerce of
Sri Lanka
Our Community…Live and Let Live
Management Report
Chandena KodituwakkuGeneral Manager - Finance & Controlling
Member - Group Management Committee
Community Development Projects

46
D I E S E L & M O T O R E N G I N E E R I N G P L C
A N N U A L R E P O RT 2 0 1 2 / 1 3We have made it an art to optimally maintain profitability…deliver shareholder returns… create and distribute wealth….we continue to exist.

47
Guiding PhilosophyThe inescapable fact which we must all accept is that business impacts the environment. Being resolute of will, we have resolved to go the extra mile to manage this very important factor of our enterprise. Dimo has put in place an environmental management system accredited with ISO 14001:2004 standard certification. Our Sustainability Committee, with appropriate representations within the Company, provides the forum to discuss matters relating to environmental sustainability.
In order to manage the environmental impact effectively, the Company focuses on six strategic areas as depicted in the following diagram.
The Environment…Now and for Generations Yet Unborn
Key Performance Area Metric 2012/13 2011/12 2010/11 2009/10
Combating climate change Carbon footprint tCO2 e per Rs. 1 mn of Group net turnover 0.2292 0.1674 0.1064 0.2472Total energy consumption (1,000 GJ) 60,547 78,184 32,264 26,210Energy consumption (Giga joules) per employee (on average) 42 58 31 30Total water consumption (m3) 101,984 75,640 46,408 37,572Ground water recycled and reused as a percentage of total water consumption (%) 21.00 15.00 24.00 34.00Total hazardous waste sent for recycling/reusingKg 132,364 65,989 37,002 N/ALitres 105,506 94,267 80,295 N/ANos. 37,065 22,091 24,379 N/A
A Forward Looking NoteWe are intent on reducing our
greenhouse gas emissions for every Rs. 1 mn of Group net turnover by 5% and improving our ground water reuse
percentage by 1% per annum.
The turtle conservation project
implemented during the year
helped protect 11,000 sea turtle
eggs along the coastline of
Sri Lanka.
Caring for the environment…as precious as a close friendship
Dimo - Environment
Management Report

48
D I E S E L & M O T O R E N G I N E E R I N G P L C
A N N U A L R E P O RT 2 0 1 2 / 1 3
Building Environmental Capital
Management of Atmospheric Emissions and
Climate Change
Materials Management
Noise Management
Waste Management
Water Management
Energy & Fuel Management
Environmental Capital
Our Group Management Committee and Sustainability Committee oversee our Environmental Management System (EMS) and steer the enactment of EMS strategies across the Group.
The EMS is guided by the Triple ‘R’ concept - Reduce, Reuse and Recycle.
As depicted in our diagram appearing above, Dimo has identified six strategic areas in respect of the management of environmental issues.
On the subject of atmospheric emissions, the correlation between greenhouse gas emissions and climate change is irrefutable today. Steeped as our business is in the automobile trade, we constantly strive to manage such harmful emissions and by implication, our carbon footprint.
This is the fifth consecutive year in which we have calculated and reported on our carbon footprint.
Direct GHG emissions from diesel for vehicles, vehicle delivery and service processes amounted to 2,914 tCO2e (3,972 tCO2e in 2011/12), which comprised 47% (59% last year) of our total carbon footprint.
Due mainly to the reductions we have been able to effect in diesel fuel consumption for vehicle delivery and service processes, our overall carbon footprint reduced by 5%.
Dimo employs a number of measures to control and manage the emission factor.
The Environment…Now and for Generations Yet Unborn
Dilrukshi KurukulasuriyaGeneral Manager - Human Resources
Member - Group Management Committee
Environmental initiatives
The Operating Environment...and TrendsRefining our Portfolio…and Reinventing our Future
Financial Value CreationDelivering Value to Customers...and their Value to Us
Working at Dimo…Enjoyable and RewardingOur Business Partners…A Symbiotic Relationship
Regulatory Authorities…Playing by the RulesOur Community…Live and Let Live
The Environment…Now and for Generations Yet Unborn
Sustainability Performance Objectives in 2012-2013
Management Report

49
Some of these include - compliance with strict emission controls for all vehicles, whether Company owned or hired; the operation of exhaust gas and dust extractors in vulnerable areas; installation of filtration systems in paint booths; operation of fresh air validation systems in Engine Repair facility; use of CFC free gases and the increasing usage of tele- and video-conferencing as a means to curtail air travel.
Dimo meticulously manages its fuel and energy consumption. For the year under review, The Group has been able to reduce its overall energy consumption by 33%.
Some measures we adopted in the cause of energy efficiency and conservation were - the constant conduct of energy audits which led to the use of capacitor banks for power factor correction, replacement of incandescent lighting with CFL and LED technology (almost all areas of the Group have been converted), programming all computers to revert to standby mode within a 5 minute idling period, setting air conditioning units at a constant minimum of 24oC or over and inculcating a culture amongst the staff of ‘switching it off’ - turning off lights and computers when not in use.
Our energy saving solutions bought many savings to our customers. During the year under review, energy audits were conducted and upon implementing its findings, an annual saving of 52,032 kWh was realised. Through sales of Electronic Control equipment, a total annual energy saving of 314,475 kWh was achieved during the period in review.
As a substantial consumer, water management is a prime area of focus.
Dimo’s requirements of water are sourced mainly from the national supply. Ground water sources have also been tapped in certain locations - at Siyambalape and Anuradhapura Workshop, Weliweriya Logistics Centre and Colombo.
The Group uses water mainly for vehicle repairs and servicing and for domestic purposes as well.
The Group’s total water usage from all sources was 101,984 M3 of which 10% or 10,069 M3 was recycled and re-used. Total water usage has risen this year due to increase in the workshop throughput.
Reuse and recycle are the watchwords in our waste management regime.
Waste water from all our workshops pass through oil separators and are monitored to ascertain their pH levels, to ensure compliance with legal limits. The Company operates biological water treatment and recycling plants at TATA Commercial workshop/Construction machinery workshop at Siyambalape and Dimo Logistic centre - Weliveriya. Water treatment plants are also available at the Mercedes Benz passenger car workshop and TATA passenger car workshops at Colombo, Branches of TATA commercial workshop at Ratnapura, Anuradhapura, Matara, Kurunegala, Kandy and Trincomalee.
Water recycled is used for industrial purposes and not for domestic purposes.
Hazardous and non hazardous waste material is disposed of responsibly, to reputed third parties certified by the Central Environmental Authority, at an expense to the Company.
In like vein, Dimo operates well within responsible boundaries in respect of both materials as well as noise management.
The expenditure incurred on environmental sustainability for the period is Rs. 8.3 mn (Rs. 3.06 mn in 2001/12).
The Environment…Now and for Generations Yet Unborn
Ananda MapalagamaGeneral Manager - Infrastructure Development
Member - Group Management Committee
Icon to indicate that more information is on web
Management Report

50
D I E S E L & M O T O R E N G I N E E R I N G P L C
A N N U A L R E P O RT 2 0 1 2 / 1 3
Strategic imperatives Term Objective Achievement Remarks
2012/13 2011/12
Create financial value Long/Short
ROE to be more than Annual AWDR+3%
Not achieved
Achieved The AWDR+3% as at year end was 13.69% The ROE for the period was 6.1%. The ROE for 2011/12 was 37.5% against the target of 13.94%.
Long/Short
EVA To be positive Not achieved
Achieved EVA created during 2012/13 was a negative value of Rs. 643 mn and in 2011/12 it was a positive value of Rs. 1,865 mn
Long/Short
Value Added to increase every year at a rate more than the rate of inflation +5%
Not achieved
Achieved The Value Added has decreased by 47% in 2012/13 over the previous year, thereby not achieving the objective of 11.1%.
The increase in value added in 2011/12 over the previous year was 21% against an objective of 10.9%.
Refine the portfolio mix of our business continuously
Long Reduce dependence on vehicle business by increasing the turnover & segment result of Non-vehicle business at least by 15% per annum.
Partially achieved
Not achieved
Non-vehicle segment turnover and segment result decreased by 6.4% and 15% respectively in 2012/13 compared with the previous year.
Earn the trust of customers and they keep coming back
Long To ensure continuity of a customer centric Quality Management system with suitable accreditation
Achieved Achieved The Group has a quality Management system accredited with ISO 9001:2008
Short Number of training hour for sales personnel to increase by - 10% from previous year.
Achieved Achieved There was a 36% increase during the period under review.
Short Increase customer interaction points by at least 3 locations per annum
Achieved Achieved During the year under review a total of 12 Branches,Vehicle display point & customer contact points were established.
Short To achieve a Weighted Average Customer Satisfaction Index score of more than 85%
Achieved Achieved During the year under review the Weighted Average Customer Satisfaction Index score was 85.5%. In 2011/12 this was 89.2%
Short Each branch to have a customer interaction event each quarter
Achieved Not Applicable
The branches together organised 59 customer interaction events during the year under review
Nurture people and they find it enjoyable and rewarding to work with us
Short To achieve a employee satisfaction index score of more than 60%
Not achieved
Achieved The employee satisfaction index score has decreased from 62% (2011/12) to 53.46% in 2012/13.
Short Average training hours per employee to be more than 10 hours
Achieved Achieved Average Training hours per employee was 16.00 hours in 2012/13. The corresponding figure for 2011/12 was 13.52 Hours
Long To improve the ratio of female to male employees, excluding workshops and field sales to 15%.*
Achieved Not achieved
The increase in the ratio of female to male employees was 20% in 2012/13.
*This objective was amended from the last year’s objective in order to make it more realistic.
The Operating Environment...and TrendsRefining our Portfolio…and Reinventing our Future
Financial Value CreationDelivering Value to Customers...and their Value to Us
Working at Dimo…Enjoyable and RewardingOur Business Partners…A Symbiotic Relationship
Regulatory Authorities…Playing by the RulesOur Community…Live and Let Live
The Environment…Now and for Generations Yet UnbornSustainability Performance Objectives in 2012-2013
Management Report
Sustainability Performance Objectives in 2012-2013

51
Strategic imperatives Term Objective Achievement Remarks
2012/13 2011/12
Have great relationships with best-of-breed business partners
Short To carry out a performance evaluation of twenty foreign Principals at least once a year
Achieved Achieved The Annual Principal performance evaluation process made this possible.
Short To obtain declarations from at least 50% of the current major local suppliers that they will abide by the DIMO supplier code.
Achieved Achieved Declarations from 74% of the current major local suppliers have been obtained. The comparative ratio for 2010/11 was 65%.
Play by the rules Short 100% compliance with Laws & Government regulations
Achieved Achieved The Company’s Code of Business Ethics require compliance with laws and regulation at all times. No non-compliances were reported during the year.
Serving the community Short Invest at least .05% of turnover on community development activities
Achieved Achieved In 2012/13 Dimo has invested 0.19% of the turnover on community development activities. In 2011/12 this was 0.14%. During the year under review expenditure on community development activities was Rs. 50.8 mn (Rs. 51 mn in 2011/12)
Long/Short
To provide vocational training for trainees numbering more than 5% of the number of employee
Achieved Achieved The number of vocational trainees who registered for training in 2012/13 was 10.76% of the average number of employees for that year. This was 14.24% in 2011/12.
Being Friendly towards the environment
Long To re-cycle and re-use at least 20% of the ground water usage.
Achieved Not Achieved
We were able to achieve our target of 21% in 2012/13 due to expansion of the water recycling capacity. The correspondents figure for 2011/12 was 15%.
Short Waste is segregated and handed over to selected third parties for recycling/reuse to be more than 90% of total solid waste.
Achieved Achieved In 2012/13 the Company signed agreements with 3rd parties who were approved by the Central Environmental Authority. These parties were capable of providing a total solution for waste management.
Short Carbon Foot Print for every Rs. 1.0 mn of turnover to reduce by 5%
Not Achieved
Not Achieved
Carbon footprint for every Rs. 1 mn of turnover in 2012/13 was 0.2292 tC02e. The corresponding figure for 2011/12 was 0.01674 tCO2e. However, the total carbon footprint reduced from 6,779 tCO2 to 6,312 tCO2
Sustainability Performance Objectives in 2012-2013
Management Report

52
D I E S E L & M O T O R E N G I N E E R I N G P L C
A N N U A L R E P O RT 2 0 1 2 / 1 3
Senior Independent Director’s StatementCode of Best Practices on Corporate Governance’ (The Code) issued jointly by the Securities and Exchange Commission of Sri Lanka and The Institute of Chartered Accountants of Sri Lanka recommends that a Senior Independent Director (SID) be appointed in the event of the Chairman heading the executive function of the Company.
The presence of the SID provides a workable mechanism to review the role played by the Chairman. Whilst the role of the Chairman entails providing leadership in observing best practices of corporate governance, my role as the SID calls for a review of the Board’s effectiveness. The presence of the SID also provides emphasis to transparency in matters relating to governance.
Dimo is committed to principles of good governance and always strives to live by the Code of Best Practices on Corporate Governance. The governance culture of the Company is strongly embraced by the Board of Directors. The Company follows a policy of strict compliance with laws, regulatory requirements and the Code of Ethics.
A Director is permitted to obtain independent professional advice that may be required in discharging his responsibilities, at the Company’s expense.
As the SID, which role I have played since May 2009, I am consulted by Chairman on major strategic and governance issues. As the SID, I make myself available to any Director to have any confidential discussions on the affairs of the Company, should the need arise. By virtue of being the Chairman of the Audit Committee, I also meet Independent Auditors and Internal Auditors and obtain their views on any matters of concern.
R. SeevaratnamSenior Independent Director
Colombo21st May 2013
Enterprise Governance
Enterprise Governance
Risk ManagementReport of the Audit Committee
Remuneration Committee ReportNomination Committee Report
Responsibility Statement of Chairman/Managing Director and Chief Executive Officer and Chief Financial Officer
Stewardship

53
PhilosophyEnterprise governance is in the core of the corporate philosophy of Dimo. It perceives good governance as an uncompromising pursuit that provides the platform for growth in a sustainable manner; not as a set of controls that stifles growth.
Governance Policy Dimo is committed to a policy of transparent, accountable and responsible governance. In doing so, the Board accepts the position of trusteeship, stewardship and accountability that is placed upon it. The Board’s objective is to deliver superior returns to all stakeholders and it is done in conformity with the eight strategic imperatives.
Governance ModelThe Board identifies the scope of enterprise governance through its eight strategic imperatives. This signifies that the conformance and performance aspects of governance should be identified through the strategic imperatives. Duties of responsible trusteeship, faithful stewardship and uncompromising accountability underpin the manner in which Dimo is committed to good governance through its eight strategic imperatives, in its pursuit of creating value and accumulating financial and non-financial wealth for its stakeholders. Conformance and performance requirements demand a robust enterprise governance framework.
Governance FrameworkThe ultimate responsibility for good governance rests with the Board of Directors. In order to effectively fulfil this responsibility, the Board has in place a governance structure and a process to monitor its effectiveness. The Audit Committee, Remuneration Committee and the Nomination Committee together with the Group Management Committee play a leading role in ensuring effective enterprise governance.
The governance framework is designed taking into consideration the demands placed by the aspects of conformance and performance along with legislative and regulatory requirements and best practices of enterprise governance. It consists of a governance structure, regulation framework and assurance and certification sources.
Enterprise Governance
Stewardship
Nishantha MudannayakeGroup IT Manager
Member - Group Management Committee

54
D I E S E L & M O T O R E N G I N E E R I N G P L C
A N N U A L R E P O RT 2 0 1 2 / 1 3
Governance Framework
Articles of Association
Quality Management System (QMS)
Environment Management System (EMS)
Code of Business Ethics
Internal Control System
Risk Management
Code of Best Practice on Corporate Governance issued jointly by SEC and ICASL
Corporate Governance Rules published by the CSE
Companies Act No. 07 of 2007
GRI Guidelines on Sustainability
External Regulation
REGULATION FRAMEWORK ASSURANCE & CERTIFICATION
Independent Audit
Independent Review
Internal Audit
Assurance of Financial Information
Internal Regulation
Board of Directors
Management Committees
Sustainability Committee
Group Management Committee
GOVERNANCE STRUCTURE
Employees’ Councils
Head of Business Units
Board Committees
Nomination Committee
Remuneration Committee
Audit Committee
Independent Certification
QMS Audit & Certification
EMS Audit & Certification
Assurance ofNon-Financial
Information
Enterprise Governance
Enterprise Governance
Risk ManagementReport of the Audit Committee
Remuneration Committee ReportNomination Committee Report
Responsibility Statement of Chairman/Managing Director and Chief Executive Officer and Chief Financial Officer
Stewardship
Conformance and PerformanceThe driving force of conformance and performance is the onus that is placed upon the Board by the expectations of trusteeship, stewardship and accountability although there are many laws, regulations, best practices and expectations that shape these two dimensions of governance. Arising from the responsibilities placed upon it, the Board endeavours to meet the demands through the structures and the processes that are in place.
The following table illustrates key conformance and performance aspects arising from each strategic imperative and the point of reference through which they are addressed, regulated and reported. The point of reference is the source that provides guidance for conformance or performance. A point of reference could be a code of best practice, guideline, standard, system, process or even a body of persons that could provide guidance and direction in conformance and performance.

55
Conformance & Performance Aspects based on Strategic Imperatives
Strategic Imperative Key Conformance Aspects Point of Reference Key Performance Aspects Point of Reference
01. Refine the portfolio mix of our business continuously
Meet Regulatory standards with regard to product and services and its delivery.
Quality Management System Managing the product and service portfolio
Quality Management System
Code of Business Ethics
Product Responsibility Quality Management System
02. Create financial value Internal Control Audit Committee Business Strategy Formulation
Strategic Imperatives
Group Management CommitteeInternal Audit Audit Committee Operational Excellence Group Management
CommitteeQuality Management System
Uncertainty Management Risk Management Environmental Management System
Assurance Audit CommitteeIndependent Auditors
03 Earn the trust of customers and they keep coming back
Meeting Customer Expectations Quality Management System Customer satisfaction Quality Management System
Customer Health and Safety Quality Management System Customer Relationship Management
Quality Management System
Customer Privacy Quality Management System Customer Complaint Handling
Quality Management System
Product responsibility Quality Management System Customer satisfaction Quality Management System
04. Nurture people and they find it enjoyable and rewarding to work with us
Employee Safety Quality Management System Employee satisfaction HR ScorecardEmployee Rights UN Global Compact Principles Training & development HR Scorecard
Code of Business Ethics Retention HR Scorecard
Equal Opportunities UN Global Compact Principles Employee Engagement HR ScorecardReducing gender inequality Sustainability Objectives
Comply with legislation and regulations relating to employees
Code of Business Ethics
05. Have great relationships with best-of-breed business partners
Compliance with Principals’ requirements of ethical practices
Quality Management System Expectation Management Quality Management System
Honour Agreements with Principals Quality Management System
Enterprise Governance
Stewardship

56
D I E S E L & M O T O R E N G I N E E R I N G P L C
A N N U A L R E P O RT 2 0 1 2 / 1 3
Strategic Imperative Key Conformance Aspects Point of Reference Key Performance Aspects Point of Reference
06. Play by the rules Meet the requirements of the Legislative enactments applicable to the Group
Code of Business Ethics Not applicable
Meet the requirements of the Code of Best Practice on Corporate Governance issued jointly by The Securities and Exchange Commission of Sri Lanka (SEC) and The Institute of Chartered Accountants of Sri Lanka (ICASL)
Code of Best Practice on Corporate Governance jointly issued by SEC and ICASL
Comply with all regulatory requirements of the Colombo Stock Exchange
CSE Listing Rules
Comply with Articles of Association Articles of AssociationTo publicly report on matters relating to Sustainability on a voluntary basis
GRI G3.1 Guidelines
07. Serve the community Anti-corruption Code of Business Ethics Benevolence and Philanthropy
Sustainability Committee
UN Global Compact Principles Social development Sustainability Committee
08. Be friendly towards the environment
Comply with all requirements of the Environment Management System
Environmental Management System
Carbon foot-print Management
Environmental Management System
Meet Legal and Regulatory requirements regarding Environment
Environmental Management System
Energy and Fuel Management
Environmental Management System
UN Global Compact Principles Water Management Environmental Management System
Code of Business Ethics Waste Management Environmental Management System
Material Usage Environmental Management System
Noise and Air Emissions Environmental Management System
Recycle and Reuse Environmental Management System
Enterprise Governance
Enterprise Governance
Risk ManagementReport of the Audit Committee
Remuneration Committee ReportNomination Committee Report
Responsibility Statement of Chairman/Managing Director and Chief Executive Officer and Chief Financial Officer
Stewardship

57
Level of Compliance and Adherence
Point of Reference Aspect of Regulation Status
The Code of Best Practices on Corporate Governance jointly issued by The Securities and Exchange Commission of Sri Lanka and The Institute of Chartered Accountants of Sri Lanka (The Code)
Best practices of Corporate Governance Every single requirement by the code and the compliance level is given on the table laid out in the Dimo Detailed Annual Report
Listing Rules of the Colombo Stock Exchange Listing rules to be followed by listed companies in Sri Lanka including on Corporate Governance relating to:
• Non-Executive Directors
• Independent Directors
• Disclosures relating to Directors
• Remuneration Committee
• Audit Committee
Complied. The Compliance level is given in the table laid out from pages 60 to 62
Legislative enactments applicable to the Group Legal requirements that the Group is subject to The Code of Business Ethics specifically requires that all employees comply with all applicable laws. Employees sign a declaration to the effect that they will follow Code of Business Ethics
Articles of Association Requirements prescribed by the Articles of Association Complied
Code of Business Ethics Compliance requirements applicable to all employees All employees signed declarations to the effect that all requirements in the Code will be complied with
Global Reporting Initiative (GRI) guidelines on Sustainability Reporting
To report on sustainability related performance in a complete generally-accepted manner as specified by GRI G3.1 guidelines
Complied. GRI index at an A+ is available in the Detailed Annual Report. The Report on the Independent Assurance obtained on Non-Financial Reporting is available from pages 123 to 124.
Environment Management System (EMS) Meet the requirements of the Group’s Environmental Management System accredited by ISO 14001:2004 Standard
Complied. The Group’s Environmental Management System is accredited with ISO 14001:2004 with accreditation provided by Det Norske Veritas AS (DNV)
Quality Management System (QMS) Meet the requirements of the Group’s Quality Management System accredited by ISO 9001:2008 Standard
Complied. The Group’s QMS is accredited with ISO 9001:2008, accreditation provided by Det Norske Veritas AS (DNV)
UN Global Compact Ten Principles To comply with the requirements of the declaration made on UN Global Compact Ten Principles covering Human Rights, Labour, Environment and Anti-Corruption
Communication on progress is available in the Detailed Annual Report
HR Scorecard Specifies the KPIs to be attained with regard to HR related objectives that includes objectives relating to Employee Satisfaction, Training and Development, Retention and Engagement
HR scorecard is compiled every month and actual KPIs are compared with targets
Enterprise Governance
Stewardship

58
D I E S E L & M O T O R E N G I N E E R I N G P L C
A N N U A L R E P O RT 2 0 1 2 / 1 3
Point of Reference Aspect of Regulation Status
Audit Committee Among other responsibilities, to review effectiveness of Internal Control, Internal Audit and Independent Assurance
Effectiveness of internal controls is reviewed with Internal Auditors and Independent Auditors. Performance of Internal Auditors and Independent Auditors is also reviewed by the Audit Committee
Where necessary, members of the Group Management Committee is called upon to explain matters relating to internal controls
Group Management Committee Among other responsibilities, to install and review effectiveness of internal controls and to work towards operational excellence
Effectiveness of internal controls is reviewed by the Group Management Committee from the feed - back received internally and from internal audit findings
Performance standards are set through KPIs and Objectives set for Business Units and Support Service Units and performance levels are reviewed periodically
Sustainability Committee To carry out the Groups’ sustainability efforts as per its terms of reference
Initiatives are planned and progress is reviewed by the Sustainability Committee. Key sustainability initiatives are reported in the Annual Report
Risk Management To manage risks that the Group is exposed to during its operations and interactions with Stakeholders
Please refer the Risk Management Report on pages 64 to 71
AdherenceThe governance practices of the Company are conceived out of the corporate philosophy of achieving sustainable growth through good governance. Whilst, being fully compliant with demands of the laws and regulations relating to corporate governance, the Company recognises that best practices provide a robust framework for sustainable growth and meeting stakeholder expectations.
Enterprise governance requires high levels of commitment across the organisation and it is essential that an enabling governance culture is created. This envisages creation of awareness at all levels. All employees are expected to respect the strategic imperatives in achieving their own objectives set by the management and in achieving the objectives of the Company. Financial value creation is not encouraged at the cost of other strategic imperatives. The sustenance of enterprise governance principles is facilitated by aligning the strategic imperatives into its value adding process, and making a conscious effort to continually improve the governance framework and processes.
ComplianceCompliance is monitored through the monitoring of the point of reference/s. In the event of the point of reference being a code of best practice, guideline, legislation or a rule, the compliance is monitored through ascertainment of compliance with the point of reference. On the other hand where the point of reference is a body of persons such as a Management Committee, the compliance is monitored by comparing the stated expectations or goals with the actual status.
Assurance and ComfortIndependent assurance, independent review, oversight and independent certification are key sources of assurance and comfort with regard to integrity and due functioning of the enterprise governance framework. This is depicted in the governance framework appearing on page 54. The Three Lines of Defence approach, which is described later, provides comfort on the effectiveness of internal controls and risk management.
Enterprise Governance
Enterprise Governance
Risk ManagementReport of the Audit Committee
Remuneration Committee ReportNomination Committee Report
Responsibility Statement of Chairman/Managing Director and Chief Executive Officer and Chief Financial Officer
Stewardship

59
Lines of DefenceThe comfort level derived from assurance is reliant upon on the internal controls that are in place. Whilst the internal controls focus on the current operations and decisions, the risk and management focuses on the uncertainties that the Group is exposed to. The ‘Three Lines of Defence’ model given below depicts the approach followed in ensuring effectiveness of the internal controls and risk management:
Group ManagementCommittee
Audit Committee
Independent Auditor
Independent Assurance
Oversight of Internal
Controls & Risk Management
Internal Controls
Line of Defence
Owner
First Line of Defence
Second Line of Defence
Third Line of Defence
Heads of Business Units
Internal ControlsThe Board has delegated the oversight function of the internal controls to the Audit Committee. Implementation of suitable internal controls rests with the Group Management Committee (GMC). The Audit Committee has the services of the internal audit function led by the Group Internal Auditor. The field work and internal audits are currently outsourced to Messrs SJMS Associates - Chartered Accountants. The internal audit findings include areas requiring improvements in internal controls and instances of any non-compliance. In addition, Independent Auditors present their findings with regard to possible improvements to the internal controls and instances of non-compliance that they come across during their engagement. The Independent Auditors and Internal Auditors present their findings to the Audit Committee.
Code of Best PracticesThe extent of compliance with the Code of Best Practices on Corporate Governance jointly issued by the Securities and Exchange Commission of Sri Lanka and The Institute of Chartered Accountants of Sri Lanka is available in the Dimo Detailed Annual Report.
Enterprise Governance
Three Lines of Defence
Stewardship
Chaminda RanawanaGeneral Manager - Construction and Material Handling
Member - Group Management Committee

60
D I E S E L & M O T O R E N G I N E E R I N G P L C
A N N U A L R E P O RT 2 0 1 2 / 1 3
DisclosuresThe tables given below provide the required and applicable details, disclosures or cross references to details/disclosures mandated by the Companies Act No. 07 of 2007 and the listing rules of the Colombo Stock Exchange:
Disclosures Required by the Companies Act No. 07 of 2007
Information required to be disclosed as per the Companies Act No. 07 of 2007 Reference to the Companies Act
Page Reference
i. The nature of the business of the Group and the Company together with any change thereof during the accounting period Section 168 (1) (a) 86
ii. Signed Financial Statements of the Group and the Company for the accounting period completed Section 168 (1) (b) 81-120
iii. Auditors’ Report on Financial Statements of the Group and the Company Section 168 (1) (c) 80
iv. Accounting Policies and any changes therein Section 168 (1) (d) 86-93
v. Particulars of the entries made in the Interests Register during the accounting period Section 168 (1) (e) 78
vi. Remuneration and other benefits paid to Directors of the Company during the accounting period Section 168 (1) (f) 96
vii. Corporate Donations made by the Company during the accounting period Section 168 (1) (g) 78
viii. Information on Directorate of the Company and its Subsidiaries during and at the end of the accounting period Section 168 (1) (h) 122
ix. Amounts paid/payable to the External Auditor as Audit Fees and Fees for other services rendered during the accounting period Section 168 (1) (i) 96
x. Auditors’ relationship or any interest with the Company and its Subsidiaries Section 168 (1) (j) 78
xi. Acknowledgement of the contents of this Report and Signatures on behalf of the Board Section 168 (1) (k) 78
Disclosures Required by the Listing Rules of the Colombo Stock ExchangeThe following table shows the level of compliance with the Section 7.10 of the Listing Rules of the Colombo Stock Exchange, pertaining to Corporate Governance:
Rule No. Subject Applicable Requirement Compliance Status Details
7.10.1.(a) Non-Executive Directors At least two or one-third of the Directors, whichever is higher, should be Non-Executive Directors
Compliant Four out of Eleven Directors are Non-Executive Directors
7.10.2.(a) Independent Directors Two or one-third of Non-Executive Directors, whichever is higher, should be independent
Compliant Three of the Four Non-Executive Directors are independent
7.10.2.(b) Independence of Directors Each Non-Executive Director should submit a declaration of independence/non-independence
Compliant Non-Executive Directors have submitted the declaration in the prescribed format
7.10.3.(a) Disclosures relating to Directors
Names of Independent Directors should be disclosed in the Annual Report
Compliant Please refer page 62
7.10.3.(b) Independence of Directors The Board shall make a determination annually as to the Independence or non-independence of each Non-Executive Director
Compliant The Board has determined that Independent Directors identified on page 62 meet the criteria of an Independent Director
Enterprise Governance
Enterprise Governance
Risk ManagementReport of the Audit Committee
Remuneration Committee ReportNomination Committee Report
Responsibility Statement of Chairman/Managing Director and Chief Executive Officer and Chief Financial Officer
Stewardship

61
Rule No. Subject Applicable Requirement Compliance Status Details
7.10.3.(c) Disclosures relating to Directors
A brief résumé of each Director should be included in the Annual Report including the area of expertise
Compliant Please refer page 121
7.10.3.(d) Appointment of new Directors
Provide brief résumé of any new Director appointed to the Board
Not Applicable Not Applicable
7.10.5 Remuneration Committee A listed company shall have a Remuneration Committee
Compliant A name of the members of the Remuneration Committee is available on page 62
7.10.5.(a) Composition of Remuneration Committee
Shall comprise Non-Executive Directors, a majority of whom shall be independent
Compliant Remuneration Committee consists of four Non-Executive Directors of which three are independent. Chairman of Remuneration Committee is an Independent Non-Executive Director
7.10.5.(b) Functions of Remuneration Committee
The Remuneration Committee shall recommend the remuneration of the Chief Executive Officer and the Executive Directors
Compliant Please refer the Remuneration Committee report on page 74
7.10.5.(c) Disclosure in the Annual Report relating to Remuneration Committee
The Annual Report should set out:
a. Names of Directors comprising the Remuneration Committee
Compliant Please refer page 62
b. Statement of Remuneration policy Compliant Please refer the Remuneration Committee Report on page 74 or a brief statement of policy
c. Aggregate remuneration paid to Executive and Non-Executive Directors
Compliant Please refer page 96
7.10.6 Audit Committee A listed company shall have an Audit Committee
Compliant Names of the members of the Audit Committee are available on page 62
7.10.6.(a) Composition of Audit Committee
Shall comprise Non-Executive Directors, a majority of whom are independent
Compliant Audit Committee consists of four Non-Executive Directors of which three are independent. Chairman of Audit Committee is a Non-Executive Independent Director
Chief Executive Officer and the Chief Financial Officer should attend Audit Committee Meetings
Compliant Chief Executive Officer and Chief Financial Officer attend Audit Committee meeting by invitation
Enterprise Governance
Stewardship

62
D I E S E L & M O T O R E N G I N E E R I N G P L C
A N N U A L R E P O RT 2 0 1 2 / 1 3
Rule No. Subject Applicable Requirement Compliance Status Details
The Chairman of the Audit Committee or one member should be a member of a professional accounting body
Compliant Chairman of the Audit Committee is a member of The Institute of Chartered Accountants of Sri Lanka and the Institute of Chartered Accountants of England and Wales
7.10.6.(b) Function of Audit Committee
Should be as outlined in the Section 7.10 of the Listing Rules
Compliant The terms of reference of the Audit Committee adopted by the Board on 20th June 2007 cover the areas outlined
7.10.6.(c) Disclosure in the Annual Report relating to Audit Committee
a. Names of Directors comprising the Audit Committee
Compliant Please refer page 62
b. The Audit Committee shall make a determination of the independence of the Auditors and disclose the basis for such determination
Compliant Please refer Audit Committee Report on pages 72 and 73
c. The Annual Report shall contain a Report of the Audit Committee in the prescribed manner
Compliant Please refer Audit Committee Report on pages 72 and 73
Disclosures specified by Section 7.6 of the Listing Rules of the Colombo Stock ExchangeThe Annual Report also contains disclosures specified above. There is no evidence of the book value being substantially different from the market value of land and other fixed assets of the Company or its subsidiaries.
Composition of the Board and Board Committees and Attendance at Meetings for 2012/13
Board MemberDate of Appointment to the
Board Board Committee Members
Audit Committee Nomination Committee Remuneration Committee
First Re-election Position Attendance Position Attendance Position Attendance Position Attendance
A.R. Pandithage June 1977 – Chairman/MD 8/8 No – Member 1/1 No –
R. Seevaratnam January 2007 June 2010 Senior Independent Director 7/8 Chairman 4/4 Member 1/1 Member 2/2
Dr. H. Cabral October 2006 June 2011 Independent Director 7/8 Member 4/4 Chairman 1/1 Member 2/2
Dr. U. Liyanage October 2006 June 2012 Independent Director 8/8 Member 4/4 Member 1/1 Chairman 2/2
A.M. Panidithage September 1982 June 2012 Non-Executive Director 7/8 Member 3/4 Member 1/1 Member 2/2
A.N. Algama November 1984 June 2012 Executive Director 8/8 No – No – No –
S.C. Algama November 1984 June 2012 Executive Director 8/8 No – No – No –
A.G. Pandithage December 1995 June 2011 CEO/ Director 8/8 No – No – No –
B.C.S.A.P. Gooneratne April 2006 June 2011 Executive Director 8/8 No – No – No –
T.G.H. Peries August 1977 June 2010 Executive Director 6/8 No – No – No –
R.C. Weerawardane June 2002 June 2011 Executive Director 8/8 No – No – No –
Enterprise Governance
Enterprise Governance
Risk ManagementReport of the Audit Committee
Remuneration Committee ReportNomination Committee Report
Responsibility Statement of Chairman/Managing Director and Chief Executive Officer and Chief Financial Officer
Stewardship

63
We have made an art of supporting… the education of
youth…development of the social and physical infrastructure of the
community…enhancement of the quality of community life…management of
environmental impact…

64
D I E S E L & M O T O R E N G I N E E R I N G P L C
A N N U A L R E P O RT 2 0 1 2 / 1 3
OverviewThe constantly evolving environment and the interactions with our stakeholders present the Company with risks and opportunities. In addition, the Group has to manage risks that arise from its operations. Thus, a need arises to identify and manage risks. The systematic approach required for risk management calls for measures that ensure that risks are identified on time, evaluated in terms of risk appetite of the Group and effective management and monitoring mechanisms are installed.
Risk Management StructureThe Board is primarily responsible for ensuring that the risks are identified and appropriately managed across the Group. The Audit Committee has been delegated the responsibility for reviewing the effectiveness of the Group’s Risk Management process, including the systems established to identify, assess, manage and monitor risks. The Internal Audit function also plays a key role in risk identification.
The Group Management Committee (GMC) takes the lead at the implementation level in identifying risks. The GMC examines processes and events that expose the Company into situations that could seriously reduce earnings, impair its liquidity position or create legal, regulatory or reputation risks. The GMC also evaluates options available to mitigate risks and to identify risks that do not match the risk appetite of the Group. Monitoring of risk management measures is a responsibility that rests with the GMC.
Heads of Business Units provide useful information and feed back to the GMC for risk management with the assistance of the employees of the Group
Board of Directors
Audit Committee
Group Management Committee
Heads of Business
Units
Employees
Risk Appetite
Oversight Review
Identify Implement
Monitor
Measurement Feedback
Feedback
Risk Management Structure
Risk Management
Wijith PushpawelaGeneral Manager - Power & Medical Engineering
Member - Group Management Committee
Enterprise GovernanceRisk Management
Report of the Audit CommitteeRemuneration Committee Report
Nomination Committee ReportResponsibility Statement of Chairman/Managing Director
and Chief Executive Officer and Chief Financial Officer
Stewardship

65
Risk EvaluationWhere a risk is evaluated it takes into account the likelihood of an event and its potential impact on the business. Impacts are quantified or assessed in terms of potential loss or damage. Risks are assessed both as gross risk and net risk. The assessment of gross risk involves the potential harm it can cause without mitigating actions, whereas net risk assessment considers potential harm or loss when mitigating action is taken. Risks and their corresponding mitigating action plans are reviewed by the GMC.
Risk MappingRisk mapping is carried out in order to assess the likelihood of occurrence and consequences of an event/set of events:
• Likelihood of occurrence is assessed on the basis of past experience and the preventive measures in place. A ranking of high, medium and low in terms of the probability of occurrence is assigned for each risk.
• The impact of the event is assessed by determining the loss it would cause and the extent of the impact. By considering these two factors, the impact is then categorised as low, moderate and significant.
Upon assessment of the likelihood of occurrence and the extent of the impact of each risk, it is subjected to the following matrix in order to derive the nature and intensity of action required.
Risk Management Actions
Considerable Monitoring Required
Impact
Significant
Moderate
Low
Low Medium High Likelihood
Must Manage & Monitor Risk
Extensive Management Essential
Accept Risk with Monitoring
Monitoring & Management Effort Worthwhile
Considerable Management Effort Required
Manage & Monitor RiskAccept, but Monitor RiskAccept Risk
Risk Management
Stewardship

66
D I E S E L & M O T O R E N G I N E E R I N G P L C
A N N U A L R E P O RT 2 0 1 2 / 1 3
Risk Management ActionsThe table given below sets out an assessment of risks that the strategic imperatives were subject to towards the year-end and risk mitigating actions that were/are in place:
Strategic Imperatives and Associated Risks
Strategic Imperative 1 Refine the Portfolio Mix of Our Business Continuously
Risk factor/implications Composition of product portfolio: The vehicles and vehicle parts/services segment accounts for a significant share of Group’s revenues and negative changes to the fiscal policies would adversely impact on Group’s performance.
Key controls and mitigating actions
• Gradually strengthening non-vehicle-related areas of business such as marketing & distribution and engineering solutions in power, water, building technologies and healthcare sectors.
Monitoring indicatorsDescription 2012/13 2011/12
Revenue from vehicle sales/after sales segments as a percentage of total revenue
82.95 87.59
Segments results from vehicle sales/after sales segments as a percentage of total segment results
79.81 91.37
Risk assessment Extensive management essential
Strategic Imperative 2 Create Financial Value
Risk factor/implications Credit risk - Possibility of incurring bad debts due to adverse economic conditions/poor credit management
Key controls and mitigating actions
• Strict adherence to Group Credit Policy that includes evaluation of a customer prior to granting credit and credit administration.
• Periodic review of receivables by the Group Management Committee
Monitoring indicatorsDescription 2012/13 2011/12
Bad debt charge/reversal to the income statement as a percentage of total trade receivables (%)
(2.81) 2.60
Risk assessment Manage and monitor risk
Risk factor/implications Interest rate risk - Increase in interest rates impacting vehicle sales and Company’s cost of funding
Key controls and mitigating actions
• Draw up special schemes with vehicle financiers to offer competitive lease rentals• Cautious management of working capital/prudent treasury management• Maintain an appropriate combination of fixed and floating rate debt
Monitoring indicatorsDescription 2012/13 2011/12
Debt: equity ratio (%) 10.09 13.40
Risk assessment Manage and Monitor risk
Risk Management
Enterprise GovernanceRisk Management
Report of the Audit CommitteeRemuneration Committee Report
Nomination Committee ReportResponsibility Statement of Chairman/Managing Director
and Chief Executive Officer and Chief Financial Officer
Stewardship

67
Risk factor/implications Exchange rate fluctuation risk - fluctuations in exchange rates causing potential losses on assets & liabilities and transactions denominated in foreign currency
Key controls and mitigating actions
• Hedging through forward contracts, where desirable• In addition to the above, hedging of this impact is available to the extent that trade receivables in foreign
currency and foreign currency bank account balances cover the exposure on foreign currency payables
Monitoring indicatorsDescription 2012/13 2011/12
Exchange Rate
USD - EOY 128.89 129.95
Euro - EOY 162.13 173.22
Yen - EOY 1.35 1.57
Risk assessment Manage and monitor risk
Risk factor/implications Liquidity risk - Unavailability of sufficient funds impacting smooth functioning of the day-to-day operations of the Company
Key controls and mitigating actions
• The finance and treasury functions ensure that banking facilities are in place to cover its forecasted cash needs for at least a period of twelve months
• The Group maintains a desired mixture of cash and cash equivalents
Monitoring indicatorsDescription 2012/13 2011/12
Quick assets ratio 0.72:1 0.36:1
Risk assessment Considerable monitoring required
Risk factor/implications IT - related risk - Loss of business/reputation resulting from break-down of IT systems and/or access by unauthorised personnel
Key controls and mitigating actions
• Extensive controls and reviews to maintain integrity and efficiency of IT infrastructure and data• Regular back up of data & off-site storage of data backup system• Disaster recovery plan• Significant investments have been made towards protecting the IT system from failures and security breaches
Monitoring indicatorsDescription 2012/13
Rs. mn2011/12Rs. mn
System Down Time (excluding routine maintenance) (%) 0.61 0.17
Risk assessment Considerable monitoring required
Risk Management
Stewardship

68
D I E S E L & M O T O R E N G I N E E R I N G P L C
A N N U A L R E P O RT 2 0 1 2 / 1 3
Risk factor/implications Obsolescence of inventory - Losses resulting from slow moving inventory items becoming obsolete
Key controls and mitigating actions
• Leverage information technology to manage inventory and ordering• Periodic review of inventory age analysis
Monitoring indicators • Stocks age analysis• Evaluation of slow moving stock on a regular basis with action plans reviewed by Business Unit Managers on a
periodic basis.
Risk assessment Accept, but monitor risk
Risk factor/implications Natural disasters - damages resulting from natural disasters such as fire and floods
Key controls and mitigating actions
• Preventive measures of safety are taken to minimise damage to people and property in the case of fire or floods
• The Company has a disaster recovery plan in place• Indemnity from insurance policies
Monitoring indicatorsDescription 2012/13 2011/12
Number of incidents of fire or floods that caused damages for over Rs. 3 mn Nil Nil
Risk assessment Considerable monitoring required
Risk factor/implications Technological obsolescence - Loss of business and cost of being inefficient due to non-availability of latest technology
Key controls and mitigating actions
• The Group makes regular investments in new technology in providing after sales services and in IT infrastructure
• Staff are consistently exposed to new technology and trained to handle them• The Group is backed by world renowned brands, some of whom are technology leaders. Therefore,
technology is leveraged to compete with others
Monitoring indicatorsDescription 2012/13 2011/12
Investment in IT (Rs. mn) 15.2 33.9
IT training man hours 765.5 559
Risk assessment Existence of risk is inevitable and requires monitoring
Risk Management
Enterprise GovernanceRisk Management
Report of the Audit CommitteeRemuneration Committee Report
Nomination Committee ReportResponsibility Statement of Chairman/Managing Director
and Chief Executive Officer and Chief Financial Officer
Stewardship

69
Strategic Imperative 3 Earn the Trust of Customers and They Keep Coming Back
Risk factor/implications Loss of customer relationships - Loss of customers and resulting impact on business due to dissatisfied customers.
Key controls and mitigating actions
• Availability of a Quality Management Systems.• Dedicated unit for Customer Relationship Management • Continuous training of employees on customer care and aftercare • Inclusion of customer care and customer satisfaction index in employees’ and business unit objectives. A detailed narrative on delivering value to customers is available from pages 28 to 33.
Monitoring indicatorsDescription 2012/13 2011/12
Number of staff members in CRM 42 35
Training hours relating to customer care 13,897 10,784
Risk assessment Monitoring and management effort worthwhile
Strategic Imperative 4 Nurture People and They Find it Enjoyable and Rewarding to Work with Us
Risk factor/implications Sourcing and retaining suitable human resources - Adverse impacts arising from failure to recruit/retain skilled employees
Key controls and mitigating actions
• Due importance given to the human resources management function of the Group• Top management involvement in talent management led by the Human Resources Department• Adoption of Best Practices in human resources management• Conducting employee satisfaction surveys• Investment in training and development• Policy of competitive remunerationMore employee-related information is available from pages 34 to 37.
Monitoring indicatorsDescription 2012/13 2011/12
Employee satisfaction index (%) 53.46 62.70
Staff turnover ratio (%) 21.81 21.10
Risk assessment Accepting the risk is inevitable. Monitoring required
Risk Management
Stewardship
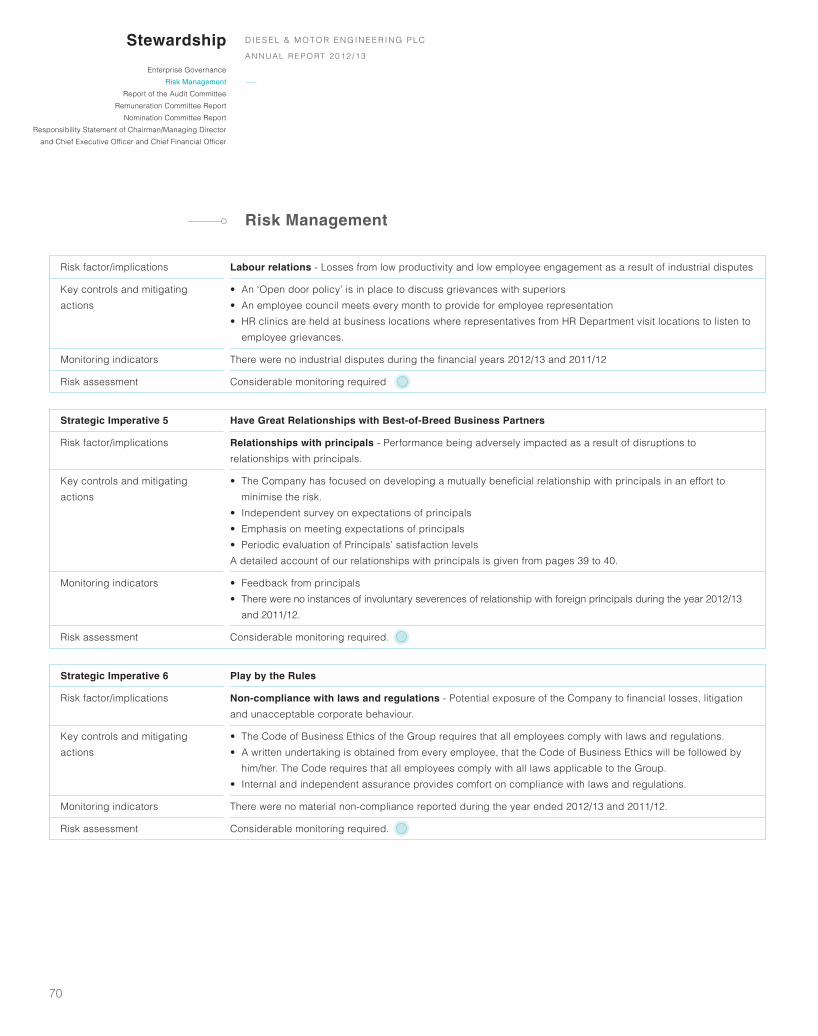
70
D I E S E L & M O T O R E N G I N E E R I N G P L C
A N N U A L R E P O RT 2 0 1 2 / 1 3
Risk factor/implications Labour relations - Losses from low productivity and low employee engagement as a result of industrial disputes
Key controls and mitigating actions
• An ‘Open door policy’ is in place to discuss grievances with superiors• An employee council meets every month to provide for employee representation• HR clinics are held at business locations where representatives from HR Department visit locations to listen to
employee grievances.
Monitoring indicators There were no industrial disputes during the financial years 2012/13 and 2011/12
Risk assessment Considerable monitoring required
Strategic Imperative 5 Have Great Relationships with Best-of-Breed Business Partners
Risk factor/implications Relationships with principals - Performance being adversely impacted as a result of disruptions to relationships with principals.
Key controls and mitigating actions
• The Company has focused on developing a mutually beneficial relationship with principals in an effort to minimise the risk.
• Independent survey on expectations of principals• Emphasis on meeting expectations of principals• Periodic evaluation of Principals’ satisfaction levelsA detailed account of our relationships with principals is given from pages 39 to 40.
Monitoring indicators • Feedback from principals• There were no instances of involuntary severences of relationship with foreign principals during the year 2012/13
and 2011/12.
Risk assessment Considerable monitoring required.
Strategic Imperative 6 Play by the Rules
Risk factor/implications Non-compliance with laws and regulations - Potential exposure of the Company to financial losses, litigation and unacceptable corporate behaviour.
Key controls and mitigating actions
• The Code of Business Ethics of the Group requires that all employees comply with laws and regulations.• A written undertaking is obtained from every employee, that the Code of Business Ethics will be followed by
him/her. The Code requires that all employees comply with all laws applicable to the Group.• Internal and independent assurance provides comfort on compliance with laws and regulations.
Monitoring indicators There were no material non-compliance reported during the year ended 2012/13 and 2011/12.
Risk assessment Considerable monitoring required.
Risk Management
Enterprise GovernanceRisk Management
Report of the Audit CommitteeRemuneration Committee Report
Nomination Committee ReportResponsibility Statement of Chairman/Managing Director
and Chief Executive Officer and Chief Financial Officer
Stewardship

71
Strategic Imperative 7 Serve the Community
Risk factor/implications Social risk - • Damage to the reputation and loss of stakeholders’ interest as a result of social rejection• Loss of reputation arising from corporate behaviour against the interests of the society
Key controls and mitigating actions
• Engagement in various community related activities, including community development• Philanthropy• Developing the social and physical infrastructure of the community• Upholding of the principles of Global Compact relating to social development. More details on interactions with the community are available on pages 43 to 45.
Monitoring indicatorsDescription 2012/13 2011/12
Community Development Investment 50.80 51.10
Risk assessment Risk may be worth, accepting with monitoring
Strategic Imperative 8 Be Friendly Towards the Environment
Risk factor/implications Environmental risk - Loss of confidence/business opportunities/depletion of Company image due to Company not being perceived as a responsible citizen.
Key controls and mitigating actions • Environmental sustainability is a part of the decision making process in day to day operations and strategy formulation
• Existence of a sustainability committee to manage environmental sustainability related issues• The Group’s Environmental Management System is accredited with ISO 14001:2004• The Company follows GRI Guidelines on sustainability reporting. The GRI index is available in the Dimo
Detailed Annual Report.
Monitoring indicatorsDescription 2012/13 2011/12
Carbon footprint (Tons) 6,312 6,779
Risk assessment Risk is inevitable and requires monitoring
Risk Management
Stewardship

72
D I E S E L & M O T O R E N G I N E E R I N G P L C
A N N U A L R E P O RT 2 0 1 2 / 1 3
The Audit Committee is formally constituted as a Sub-committee of the Main Board, to which it is accountable and consists of four Non-Executive Directors, of whom three members are Independent Non-Executive Directors.
The Audit Committee has written terms of reference, dealing clearly with its authority & duties and is established for the purpose of assisting the Board in fulfilling their oversight responsibilities regarding the integrity of the Financial Statements, risk management, internal control and compliance with legal and regulatory requirements, review of external Auditors’ performances & independence and internal audit function.
Compliance with Financial ReportingThe Group adopted the new Sri Lanka Accounting Standards that came into effect from 01st January 2012.
The Audit Committee considered the quarterly and annual Financial Statements and reviewed the Annual Report including the Financial Statements prior to publication.
The review included:
• Appropriateness and changes in Accounting Policies.
• Significant estimates and judgment made by the management.
• Compliance with relevant Accounting Standards and applicable regulatory requirements.
• Adequacy of impairment provision against assets.
• Issues arising from the Internal and External audit.
Risk ManagementThe Audit Committee meets the Internal Auditors on a quarterly basis and reviews their findings in order to identify effectiveness of internal controls and risks attached to different areas of operations.
Compliance with Laws and Regulations The Audit Committee reviewed the reports submitted by the management and Internal Auditors on the state of compliance with applicable laws and regulations and settlement of statutory payments.
Internal Controls The Committee is satisfied that an effective system of internal control is in place to provide reasonable assurance on safeguarding of the Company’s assets and reliability of Financial Statements. Effectiveness of Company’s system of Internal Controls is evaluated through reports provided by Management, Internal Auditors and External Auditors.
Internal AuditorsThe internal audit function is headed by the Group Internal Auditors. The Internal Audit field work and reporting is outsourced to Messrs SJMS Associates, a firm of Chartered Accountants. Internal auditors directly submitted their findings to Audit Committee quarterly and their reports are made available to External Auditors.
Report of the Audit Committee
Enterprise GovernanceRisk Management
Report of the Audit Committee
Remuneration Committee ReportNomination Committee Report
Responsibility Statement of Chairman/Managing Director and Chief Executive Officer and Chief Financial Officer
Stewardship

73
The Audit Committee monitors and reviews:
• The coverage of the annual audit plan.
• The follow-up action taken on the recommendation of the Internal Auditors.
• The internal audit programmes and results of the internal audit process.
• Effectiveness of the internal audit function.
Independent AuditorsThe Audit Committee reviewed the independence and objectivity of the External Auditors Messrs KPMG, Chartered Accountants. The Audit Committee has met with the External Auditors to review the annual audit plan and Financial Statements during the annual audit.
The Committee has received a declaration from the External Auditors, confirming that they do not have any relationship or interest in the Company or its subsidiaries as required by the Companies Act No. 07 of 2007.
The Committee reviewed the non-audit services and its impact on the independence of the External Auditors.
The Audit Committee has approved the extension of period of engagement External Auditors, by one year, and recommended to the Board their reappointment.
Meetings of Audit CommitteeFour Audit Committee meetings were held during the year ended 31st March 2013. The attendance details are given in page 62. The Internal Auditors attend the meetings quarterly.
ConclusionThe Audit Committee is satisfied that the effectiveness of the organisational structure of the Group and of the implementation of the Group’s accounting policies and operational controls provide reasonable assurance that the affairs of the Group are managed in accordance with Group policies and that the Group assets are properly accounted for and adequately safeguarded.
R. SeevaratnamChairman - Audit Committee
Colombo21st May 2013
Report of the Audit Committee
Stewardship

74
D I E S E L & M O T O R E N G I N E E R I N G P L C
A N N U A L R E P O RT 2 0 1 2 / 1 3
The Remuneration Committee is a sub-committee of the Board. The members of the Committee consist of three Independent Directors and a Non-Executive Director. The Chairman of the Committee who is an Independent Director and the members of the Committee were appointed by the Board.
The Committee was established for the purpose of recommending the remuneration of the Board of Directors including Chairman, Chief Executive Officer (CEO) and the Executive Directors. The Committee also approves the remuneration of the members of the Group Management Committee on their recommendations made by the Chairman and the CEO.
The Committee has acted within the parameters set by its terms of reference.
The decisions on matters relating to remuneration of Executive Directors and the members of the Group Management Committee were arrived at in consultation with the Chairman & the CEO. No Director is involved in determining his own remuneration.
Our remuneration philosophy is designed to reward, motivate and retain the Company’s executive team, with market competitive remuneration and benefits, to support the continued success of our business and the creation of shareholder value.
The remuneration packages which are linked to individual performances are aligned with the Company’s short-term and long-term strategy. The Committee makes every endeavor to maintain remuneration levels that are sufficient to attract and retain Executive Directors and Members of the Senior Management team.
All Non-Executive Directors receive a fee for serving on the Board and serving on sub-committees. They do not receive any performance related incentive payments.
The Directors’ emoluments are disclosed on page 96.
The Committee meets as and when a need arises. The Remuneration Committee meetings and members attendance is given in page 62.
Prof. U. LiyanageChairman - Remuneration Committee
Colombo21st May 2013
Remuneration Committee Report
Enterprise GovernanceRisk Management
Report of the Audit CommitteeRemuneration Committee Report
Nomination Committee Report
Responsibility Statement of Chairman/Managing Director and Chief Executive Officer and Chief Financial Officer
Stewardship

75
IntroductionThe main purpose of the Committee is to assist the Board by keeping the composition of the Board under review and conducting a rigorous and transparent process when making or renewing appointments of directors to the Board. It also advises the Board on issues of directors’ conflicts of interest and independence. The Chairman and the members of the Nomination Committee are appointed by the Board of Directors.
Committee Composition and its Key ActivitiesThe Committee composition and their attendance details are given in page 62 of Enterprise Governance Report.
The Committee has acted within the parameters set by its terms of reference.
The Committee met on one occasion in 2012/13 and the members’ attendance record is set out in the Enterprises Governance report on page 62.
The key activities carried out during the year by the Committee are as follows
• Review the structure, size and composition of the Board.
• Evaluate the independence and effectiveness of the Non-Executive Directors.
• Review the process for succession planning to ensure that the Board has the correct balance of individuals to discharge its duties effectively. During the year, the Committee was briefed on succession planning issues relating to executive director and Group corporate management roles and satisfied itself that action plans are in place to deal with longer term and as far as is practicable, unexpected short-term gaps or weaknesses in the executive team.
• Evaluate performance of Executive Directors.
The Committee is satisfied that the combined knowledge and experience of the Board matches the demands facing the Company.
Dr. H. CabralChairman - Nomination Committee
Colombo21st May 2013
Nomination Committee Report
Stewardship

76
D I E S E L & M O T O R E N G I N E E R I N G P L C
A N N U A L R E P O RT 2 0 1 2 / 1 3
The Financial Statements are prepared in compliance with the requirements of the followings:
• Sri Lanka Accounting Standards issued by The Institute of Chartered Accountants of Sri Lanka,• Companies Act No. 07 of 2007,• Listing Rules of the Colombo Stock Exchange, and• Sri Lanka Accounting and Auditing Standards Act No. 15 of 1995.
The Accounting Policies used in the preparation of the Financial Statements are appropriate and are consistently applied, except unless otherwise stated in the notes accompanying the Financial Statements. The Financial Statements have been prepared in accordance with the new Sri Lanka Accounting Standards that came into effect from 01st January 2012. There are no departures from the prescribed Accounting Standards in their adoption. Comparative information has been reclassified wherever necessary to comply with the current presentation. The Significant Accounting Policies and estimates that involved a high degree of judgment and complexity were discussed with the Audit Committee.
The Board of Directors and the management of the Company accept responsibility for the integrity and objectivity of these Financial statements. The estimates and judgments relating to the Financial Statements were made on a prudent and reasonable basis, in order that the Financial Statements reflect in a true and fair manner, the form and substance of transactions, and reasonably present the Company’s state of affairs.
To ensure this, the Company has taken proper and sufficient care in installing a system of internal control and accounting records, for safeguarding assets, and for preventing and detecting frauds as well as other irregularities, which is reviewed, evaluated and updated on an ongoing basis.
The Internal Auditors have conducted periodic audits to provide reasonable assurance that the established policies and procedures of the Company were consistently followed. However, there are inherent limitations that should be recognised in weighing the assurances provided by any system of internal controls and accounting.
The Financial Statements were audited by Messrs KPMG, Chartered Accountants, the Independent Auditors.
The Audit Committee of the Company meets periodically with the Internal Auditors and the Independent Auditors to review the manner in which these Auditors are performing their responsibilities, and to discuss auditing, internal control and financial reporting issues. To ensure complete independence, the Independent Auditors and the Internal Auditors have full and free access to the members of the Audit Committee to discuss any matter of substance.
A.R. Pandithage A.G. PandithageChairman/Managing Director Director/Chief Executive Officer
B.C.S.A.P. GooneratneDirector/Chief Financial Officer
Colombo 21st May 2013
Responsibility Statement of Chairman/Managing Director and Chief Executive Officer and Chief Financial Officer
Enterprise GovernanceRisk Management
Report of the Audit CommitteeRemuneration Committee Report
Nomination Committee ReportResponsibility Statement of Chairman/Managing Director
and Chief Executive Officer and Chief Financial Officer
Stewardship

Annual Report of the Board of Directors 78
Statement of Directors’ Responsibilities for the Financial Statements 79
Independent Auditors’ Report 80
Income Statement 81
Statement of Comprehensive Income 81
Statement of Financial Position 82
Statement of Changes in Equity 83
Cash Flow Statement 84
Notes to the Financial Statements 86
FINANCIAL CALENDAR
Interim Financial Statements Three months ended 30th June 2012 - 14th August 2012Six months ended 30th September 2012 - 13th November 2012Nine months ended 31st December 2012 - 14th February 2013Twelve months ended 31st March 2013 - 21st May 2013
DividendsFirst & Final Dividend for 2012/13 - 11th June 2013
Annual Report - Financial year ended 31st March 2013 - 21st May 201368th Annual General Meeting - 28th June 2013
Financial Reports The Financial Reports that follow are prepared and presented in accordance with Sri Lanka Accounting Standards and also comply with the requirements of the Companies Act No. 07 of 2007.

78
Financial Reports
D I E S E L & M O T O R E N G I N E E R I N G P L C
A N N U A L R E P O RT 2 0 1 2 / 1 3
The Directors have pleasure in presenting the Annual Report for the year ended 31st March 2013 which covers business strategy, strategic imperatives, Audited Financial Statements, share-related information, and reviews on risk management, governance and sustainability. This page together with information referred to in ‘Disclosures required by the Companies Act No. 07 of 2007’ appearing on page 60 form this Annual Report of the Board of Directors.
The information on Directors of the Company is available on page 121. Mr. A.G. Pandithage, Mr. R.C. Weerawardane and Mr. R. Seevarathnam retire by rotation and are eligible for re-election, as stated in ‘Notice of Meeting’ on page 128.
Mr. T.G.H. Peries who is due to retire by rotation as per Article 66 of the Articles of Associate of the Company has not offered himself for re-election and therefore will cease to be a Director of the Company with effect from the conclusion of the Annual General Meeting to be held on 28th June 2013.
The Group structure and names of the Directors of subsidiaries are available on page 122.
Director’s remuneration and other benefits are given in Note 35.1 (b) to the Financial Statements on page 112.
The Financial Statements, Significant Accounting Policies used and the Notes thereto of the Company and the Group (refer page 81 to 120) comply with the requirements of the Sri Lanka Accounting Standards and the Companies Act No. 07 of 2007. These Financial Statements and Notes thereto give a true and fair view of the Company’s and the Group’s financial position as at 31st March 2013 and of their performance for the year ended on that date.
A brief description of nature of the principal business activities of the Company and the Group is given in Note 1.3 to the Financial Statements on page 86 There was no significant change in the nature of business of the Company or its subsidiaries during the year that may have a significant impact on the state of the Company’s affairs. The Company’s External Auditors, Messrs KPMG, who were reappointed in accordance with a resolution passed at the last Annual General Meeting, have expressed their opinion which appears on page 128 of this Annual Report. The details of their remuneration are given in Note 11.1 to the Financial Statements on page 96. As far as the Directors are aware, the Auditors do not have any other relationship with the Company, or any of its subsidiaries. The Auditors do not have any interest in contracts with the Company, or any of its subsidiaries.
The Group and the Company adopted new Sri Lanka Accounting Standards (new SLASs) that came into effect from 1st April 2012. Details of adoption of the aforesaid Accounting Standards are available in Notes 7 to the Financial Statements on page 93 of this Annual Report.
The Directors, to the best of their knowledge and belief are satisfied that all statutory payments to the Government, other regulatory institutions and related to the employees have been made in time.
The Interest Register is maintained by the Company, as per the Companies Act No. 07 of 2007. All Directors have made declarations as provided for in Section 192 (2) of the aforesaid Companies Act. During the year, entries were made in the Interest Register on Directors’ interests in contracts, remuneration paid to the Directors, renewal of Directors’ and Officers’ Liability Insurance. The Interest Register is available for inspection as required under the Companies Act.
The Group and the Company made donations during the year amounting to Rs. 14.8 mn and Rs. 14.1 mn respectively (2011/12 - Group: Rs. 27.1 mn, Company - Rs. 26.6 mn).
The Board of Directors has reviewed the Company’s business plans and is satisfied that the Company has adequate resources to continue its operations in the foreseeable future. Accordingly, the Financial Statements are prepared based on going concern concept.
By order of the Board of Directors,
A.R. Pandithage Chairman/Managing Director
A.G. PandithageDirector/Chief Executive Officer
B.C.S.A.P. GooneratneDirector
Colombo21st May 2013
Annual Report of the Board of Directors
79
Financial Reports
D I E S E L & M O T O R E N G I N E E R I N G P L C
A N N U A L R E P O RT 2 0 1 2 / 1 3
The Companies Act No. 07 of 2007 require the Directors to prepare and present Financial Statements for each financial year giving a true and fair view of the state of affairs of the Group and the Company as at the end of the financial year and the financial performance of the Company and the Group for the financial year.
The responsibilities of the Directors in relation to the Financial Statements of the Group and the Company are set out in following statement. As per the provision of the Companies Act No. 07 of 2007, the Directors are required to prepare for each financial year and place before general meeting of shareholders the Financial Statements, which comprise:
1. A Income Statement and a Statement of Comprehensive Income, which presents a true and fair view of the financial performance of the Company and its subsidiaries for the financial year; and
2. A Statement of Financial Position, which presents true and fair view of the financial position of the Company and its subsidiaries as at the end of the financial year and which complies with the requirements of the Companies Act No. 07 of 2007.
In addition, the Directors have to ensure that Financial Statements present fairly for each financial year the Group’s financial position, financial performance and cash flows. This requires the faithful representation of the effects of transactions, other events and conditions in accordance with the definitions and recognition criteria for assets, liabilities, income and expenses set out in the ‘Framework for the preparation and presentation of Financial Statements’ set out in the Sri Lanka Accounting Standards. In virtually all circumstances, a fair presentation will be achieved by compliance with all applicable Sri Lanka Accounting Standards.
Directors also have to ensure that:
Appropriate accounting policies have been used in a consistent manner;
Where necessary, prudent judgment and estimates have been made;
Requirements of the Sri Lanka Accounting and Auditing Standards Act No. 15 of 1995 have been followed;
Listing Rules of the Colombo Stock Exchange are complied with.
The Directors are responsible for ensuring that the companies within the Group keep sufficient accounting records to disclose with reasonable accuracy, the financial position of the Group and the Company, and to ensure that the Financial Statements presented comply with the requirements of the Companies Act No. 07 of 2007.
The Board of Directors accepts responsibility for the integrity and objectivity of the Financial Statements presented.
The Directors are required to provide the Auditors with every opportunity to take whatever steps necessary to enable them to form their audit opinion.
The responsibility of the Auditors in relation to the Financial Statements appears in the Report of the Auditors on page 80.
Messrs KPMG, Chartered Accountants, the Auditors of the Company has examined the Financial Statements and the related records and information. Their opinion on Financial Statements is given on page 80.
The Directors are also responsible for taking reasonable measures to safeguard the assets of the Group and in that context to have proper regard to the establishment of appropriate systems of internal control with a view to prevention and detection of fraud and other irregularities. The Directors, having reviewed the financial budget and cash flows for the year to 31st March 2013 and the bank facilities, consider that the Group has adequate resources to continue in operation, and have continued to adopt the going concern basis in preparing Financial Statements.
By Order of the Board,
B.C.S.A.P. GooneratneDirector
Colombo21st May 2013
Statement of Directors’ Responsibilities for the Financial Statements

80
Financial Reports
D I E S E L & M O T O R E N G I N E E R I N G P L C
A N N U A L R E P O RT 2 0 1 2 / 1 3
TO THE SHAREHOLDERS OF DIESEL & MOTOR ENGINEERING PLC
Report on the Financial StatementsWe have audited the accompanying financial statements of Diesel & Motor Engineering PLC (“Company”), the consolidated financial statements of the Company and its subsidiaries (“the Group”) which comprise the statement of financial position as at March 31, 2013, the statements of comprehensive income, changes in equity and cash flows for the year then ended, and notes, comprising a summary of significant accounting policies and other explanatory information set out on pages 81 to 120 of the Annual Report.
Management’s Responsibility for the Financial StatementsManagement is responsible for the preparation and fair presentation of these financial statements in accordance with Sri Lanka Accounting Standards. This responsibility includes: designing, implementing and maintaining internal control relevant to the preparation and fair presentation of financial statements that are free from material misstatement, whether due to fraud or error; selecting and applying appropriate accounting policies; and making accounting estimates that are reasonable in the circumstances.
Scope of Audit and Basis of OpinionOur responsibility is to express an opinion on these financial statements based on our audit. We conducted our audit in accordance with Sri Lanka Auditing Standards. Those standards require that we plan and perform the audit to obtain reasonable assurance whether the financial statements are free from material misstatement.
An audit includes examining, on a test basis, evidence supporting the amounts and disclosures in the financial statements. An audit also includes assessing the accounting policies used and significant estimates made by management, as well as evaluating the overall financial statement presentation.
We have obtained all the information and explanations which to the best of our knowledge and belief were necessary for the purposes of our audit. We therefore believe that our audit provides a reasonable basis for our opinion.
Independent Auditors’ Report
OpinionIn our opinion, so far as appears from our examination, the Company maintained proper accounting records for the year ended March 31, 2013 and the financial statements give a true and fair view of the financial position of the Company as at March 31, 2013 and its financial performance and its cash flow for the year then ended in accordance with Sri Lanka Accounting Standards.
In our opinion, the consolidated financial statements give a true and fair view of the financial position of the Company and its subsidiaries dealt with thereby as at March 31, 2013 and of its financial performance and its cash flows for the year then ended in accordance with Sri Lanka Accounting Standards.
Report on Other Legal and Regulatory Requirements
These financial statements also comply with the requirements of Section 153 (2) to 153 (7) of the Companies Act No. 07 of 2007.
Chartered AccountantsColombo
May 21, 2013

81
Financial Reports
D I E S E L & M O T O R E N G I N E E R I N G P L C
A N N U A L R E P O RT 2 0 1 2 / 1 3
Income StatementGroup Company
For the year ended 31st March 2013 2012 Change 2013 2012 ChangeNote Rs. ’000 Rs. ’000 % Rs. ’000 Rs. ’000 %
Revenue 8 27,711,604 39,862,943 (30) 26,496,949 38,877,422 (32)Sales taxes (227,451) (315,199) (28) (216,789) (305,139) (29)
Net turnover 27,484,153 39,547,744 (31) 26,280,160 38,572,283 (32)Cost of sales (23,303,126) (32,348,060) (28) (22,519,305) (31,758,534) (29)
Gross profit 4,181,027 7,199,684 (42) 3,760,855 6,813,749 (45)
Other operating income/(expenses) 9 35,903 (18,001) 299 35,427 (23,915) 248 Distribution expenses (487,981) (667,505) (27) (475,939) (641,599) (26)Administrative expenses (2,843,448) (2,535,767) 12 (2,599,142) (2,335,213) 11
Results from operating activities 885,501 3,978,411 (78) 721,201 3,813,022 (81)Finance income 240,761 196,778 22 241,178 179,653 34 Finance expenses (636,241) (450,668) 41 (630,798) (447,553) 41
Net finance expense 10 (395,480) (253,890) 56 (389,620) (267,900) 45
Profit before income tax 11 490,021 3,724,521 (87) 331,581 3,545,122 (91)Income tax (expense)/reversal 12 (27,871) (1,022,870) (97) 20,243 (971,221) (102)
Profit for the year 462,150 2,701,651 (83) 351,824 2,573,901 (86)
Earnings per share - (Rs.) 13 52.06 304.36 39.64 289.97
Statement of Comprehensive IncomeGroup Company
For the year ended 31st March 2013 2012 Change 2013 2012 ChangeNote Rs. ’000 Rs. ’000 % Rs. ’000 Rs. ’000 %
Profit for the year 462,150 2,701,651 (83) 351,824 2,573,901 (86)
Other comprehensive income
Actuarial loss arising from defined benefit obligation 27 (28,796) (21,568) 34 (24,748) (24,159) 2 Net changes in fair value of financial assets available-for-sale 1,300 (1,605) 181 1,304 (1,593) 182Gain on freehold land revaluation – 879,140 (100) – 879,140 (100)Tax on other comprehensive income – – – –
Total other comprehensive income net of income tax (27,496) 855,967 (103) (23,444) 853,388 (103)
Total comprehensive income for the year 434,654 3,557,618 (88) 328,380 3,427,289 (90)
Figures in brackets indicate deductions.
The Notes to the Financial Statements from pages 86 to 120 form an integral part of these Financial Statements.
Income Statement and Statement of Comprehensive Income

82
Financial Reports
D I E S E L & M O T O R E N G I N E E R I N G P L C
A N N U A L R E P O RT 2 0 1 2 / 1 3
Group Company
As at 31.03.2013 31.03.2012 01.04.2011 31.03.2013 31.03.2012 01.04.2011Note Rs. ’000 Rs. ’000 Rs. ’000 Rs. ’000 Rs. ’000 Rs. ’000
Assets
Non-Current Assets
Property, plant & equipment 16 5,567,369 4,658,274 3,060,039 5,523,513 4,620,754 3,026,027 Lease rentals paid in advance 17 33,346 35,551 37,756 33,346 35,551 37,756 Intangible assets 18 2,136 3,079 702 2,136 3,079 702 Investment in subsidiaries 19 – – – 11,145 11,145 8,350 Financial assets available-for-sale 20 5,077 3,690 5,295 5,054 3,663 5,256 Deferred tax assets 28 111,082 62,841 51,052 107,280 60,711 48,640
Total non-current assets 5,719,010 4,763,435 3,154,844 5,682,474 4,734,903 3,126,731
Current Assets
Inventories 21 4,141,906 8,151,035 2,483,958 4,055,558 8,075,867 2,419,515 Trade and other receivables 22 2,086,115 1,809,028 3,151,623 1,654,001 1,585,934 3,094,359 Other current assets 23 204,189 259,630 152,411 175,881 230,763 131,660 Current tax asset 33 67,081 – – 102,176 – – Cash and cash equivalents 24 682,078 317,090 1,871,046 615,156 178,996 1,801,370
Total current assets 7,181,369 10,536,783 7,659,038 6,602,772 10,071,560 7,446,904
Total assets 12,900,379 15,300,218 10,813,882 12,285,246 14,806,463 10,573,635
Equity and Liabilities
Equity
Stated capital 25 425,297 425,297 182,500 425,297 425,297 182,500 Capital reserve 2,014,752 2,014,752 1,135,612 2,014,752 2,014,752 1,135,612 Revenue reserves 26 5,191,118 5,000,566 2,876,865 4,701,223 4,616,945 2,623,573
Total equity attributable to the equity holders of the Company 7,631,167 7,440,615 4,194,977 7,141,272 7,056,994 3,941,685
Non-Current Liabilities
Long-term borrowings 29 540,243 770,203 316,830 540,243 770,203 316,830 Defined benefit obligation 27 287,046 224,434 182,327 273,471 216,824 173,713 Deferred tax liabilities 28 96,724 91,198 109,209 92,679 87,963 105,795 Deferred income 30 140,312 179,769 91,658 77,311 147,809 91,657
Total non-current liabilities 1,064,325 1,265,604 700,024 983,704 1,222,799 687,995
Current Liabilities
Trade payables 31 843,044 1,487,608 1,558,804 792,718 1,446,635 1,500,568 Other current liabilities 32 484,286 702,489 608,954 462,254 675,801 583,238 Current portion of long-term borrowings 29 229,960 229,960 93,015 229,960 229,960 93,015 Current tax liabilities 33 – 128,276 999,487 – 105,032 1,006,205 Short-term borrowings 34 2,647,597 4,045,666 2,658,621 2,518,226 3,970,625 2,647,224 Amounts due to subsidiaries 35 – – – 157,112 98,617 113,705
Total current liabilities 4,204,887 6,593,999 5,918,881 4,160,270 6,526,670 5,943,955
Total liabilities 5,269,212 7,859,603 6,618,905 5,143,974 7,749,469 6,631,950
Total equity and liabilities 12,900,379 15,300,218 10,813,882 12,285,246 14,806,463 10,573,635
Statement of Financial Position
It is certified that the Financial Statements as set out on pages 81 to 120 have been prepared in accordance with the requirements of the Companies Act No. 07 of 2007 and give a true and fair view of the Financial Position of Diesel & Motor Engineering PLC and the Group as at 31st March 2013 and the financial performance for the year ended.
E.D.C. KodituwakkuGeneral Manager - Finance & Controlling/Member - Group Management Committee
The Directors are responsible for the preparation and presentation of these Financial Statements.
Signed for and on behalf of the Board,
A.R. PandithageChairman/Managing Director
B.C.S.A.P. GooneratneDirector/Chief Financial Officer
21st May 2013Colombo
Figures in brackets indicate deductions.
The Notes to the Financial Statements from pages 86 to 120 form an integral part of these Financial Statements.

83
Financial Reports
D I E S E L & M O T O R E N G I N E E R I N G P L C
A N N U A L R E P O RT 2 0 1 2 / 1 3
Revenue Reserves*
Stated Capital
Capital Reserve
General Reserve
Financial Assets Available-for-Sale Reserve
Retained Earnings
Total
Group Note Rs. ’000 Rs. ’000 Rs. ’000 Rs. ’000 Rs. ’000 Rs. ’000
Balances as at 1st April 2011 182,500 1,135,612 669,290 4,283 2,203,292 4,194,977 Total comprehensive income for the year Profit for the year – – – – 2,701,651 2,701,651 Other comprehensive income for the year – 879,140 – (1,605) (21,568) 855,967 Total comprehensive income for the year – 879,140 – (1,605) 2,680,083 3,557,618Transactions with equity owners, recorded directly in equity distributions to equity owners Dividends to equity owners 2010/11 Final - Cash dividend – – – – (201,025) (201,025) - Scrip dividend 242,797 – – – (242,797) – 2011/12 - First interim – – – – (44,382) (44,382) 2011/12 - Second interim – – – – (66,573) (66,573) Transfer during the year – – 1,648,000 – (1,648,000) – Total transactions with equity holders 242,797 – 1,648,000 – (2,202,777) (311,980)Balance as at 31st March 2012 425,297 2,014,752 2,317,290 2,678 2,680,598 7,440,615 Total comprehensive income for the year Profit for the year – – – – 462,150 462,150 Other comprehensive income for the year – – – 1,300 (28,796) (27,496)Total comprehensive income for the year – – – 1,300 433,354 434,654Transactions with equity owners, recorded directly in equity distributions to equity owners Dividends to equity owners 2011/12 Final - Cash dividend 14 – – – – (244,102) (244,102) Transfer during the year – – 1,500,000 – (1,500,000) – Total transactions with equity holders – – 1,500,000 – (1,744,102) (244,102)Balance as at 31st March 2013 425,297 2,014,752 3,817,290 3,978 1,369,850 7,631,167
Revenue Reserves*
Stated Capital
Capital Reserve
General Reserve
Financial Assets Available-for-Sale Reserve
Retained Earnings
Total
Company Note Rs. ’000 Rs. ’000 Rs. ’000 Rs. ’000 Rs. ’000 Rs. ’000
Balances as at 1st April 2011 182,500 1,135,612 579,464 4,251 2,039,858 3,941,685 Total comprehensive income for the year Profit for the year – – – – 2,573,901 2,573,901 Other comprehensive income for the year – 879,140 – (1,593) (24,159) 853,388 Total comprehensive income for the year – 879,140 – (1,593) 2,549,742 3,427,289Transactions with equity owners, recorded directly in equity distributions to equity ownersDividends to equity owners 2010/11 Final - Cash dividend – – – – (201,025) (201,025) - Scrip dividend 242,797 – – – (242,797) – 2011/12 - First interim – – – – (44,382) (44,382) 2011/12 - Second interim – – – – (66,573) (66,573)Transfer during the year – – 1,600,000 – (1,600,000) – Total transactions with equity holders 242,797 – 1,600,000 – (2,154,777) (311,980)Balance as at 31st March 2012 425,297 2,014,752 2,179,464 2,658 2,434,823 7,056,994 Total comprehensive income for the year Profit for the year – – – – 351,824 351,824 Other comprehensive income for the year – – – 1,304 (24,748) (23,444)Total comprehensive income for the year – – – 1,304 327,076 328,380Transactions with equity owners, recorded directly in equity distributions to equity owners Dividends to equity owners 2011/12 Final - Cash dividend 14 – – – – (244,102) (244,102) Transfer during the year – – 1,500,000 – (1,500,000) –Total transactions with equity holders – – 1,500,000 – (1,744,102) (244,102)Balance as at 31st March 2013 425,297 2,014,752 3,679,464 3,962 1,017,797 7,141,272
* The revenue reserves represent reserves available for distribution.
Figures in brackets indicate deductions.The Notes to the Financial Statements from page 86 to 120 form an integral part of these Financial Statements.
Statement of Changes in Equity

84
Financial Reports
D I E S E L & M O T O R E N G I N E E R I N G P L C
A N N U A L R E P O RT 2 0 1 2 / 1 3
Group Company
For the year ended 31st March 2013 2012 2013 2012Note Rs. ’000 Rs. ’000 Rs. ’000 Rs. ’000
Cash flows from operating activities
Profit before taxation 490,021 3,724,521 331,581 3,545,122
Adjustments for:
Depreciation on property, plant & equipment 16 167,385 135,164 160,665 129,855 Amortisation of intangible assets and lease rentals 17/18 3,148 3,364 3,148 3,364 Deferred income net of amortisation (39,457) 88,111 (70,498) 56,152 Impairment loss/(reversal) on investment in subsidiary 19 – – – (2,795)Loss on disposal of property, plant & equipment 9 4,418 67,847 2,878 67,883 Interest expenses 10 636,241 450,668 630,798 447,553 Interest income 10 (110,169) (136,648) (108,370) (135,290)Dividend income 9 (235) (165) (13,015) (3,765)Provision/(reversal) for/of impairment of trade receivables 11.1 (65,538) 181,129 (48,515) 201,941 Provision for slow moving inventories 11.1 131,061 99,989 122,593 105,092 Provision for defined benefit obligation excluding actuarial loss 43,311 34,519 40,675 32,497
1,260,186 4,648,499 1,051,940 4,447,609
Changes in working capital
(Increase)/decrease in inventories 3,878,068 (5,860,829) 3,897,716 (5,761,444)(Increase)/decrease in trade and other receivables (211,549) 1,161,466 (19,552) 1,306,484 (Increase)/decrease in other current assets 55,441 (107,219) 54,882 (99,103)Increase/(decrease) in trade payables (652,599) 8,892 (661,952) (67,608)Increase/(decrease) in other current liabilities (218,203) 93,535 (213,547) 92,563 Increase/(decrease) in amounts due to subsidiaries – – 58,495 (15,088)
Cash generated from/(used in) operating activities 4,111,344 (55,656) 4,167,982 (96,587)
Interest paid (628,206) (436,557) (622,763) (433,442)Defined benefit obligation - payment 27 (9,495) (13,980) (8,776) (13,545)Income tax paid 33 (265,943) (1,923,881) (228,818) (1,902,297)
Net cash generated from/(used in) operations 3,207,700 (2,430,074) 3,307,625 (2,445,871)
Cash Flow Statement

85
Financial Reports
D I E S E L & M O T O R E N G I N E E R I N G P L C
A N N U A L R E P O RT 2 0 1 2 / 1 3
Group Company
For the year ended 31st March 2013 2012 2013 2012Note Rs. ’000 Rs. ’000 Rs. ’000 Rs. ’000
Cash Flows from Investing Activities
Proceeds from disposal of property plant & equipment 13,556 25,257 11,953 25,222 Dividend received 147 165 12,927 3,765 Interest received 110,169 136,648 108,370 135,290 Acquisition and construction of property plant & equipment and capital work-in-progress (1,094,453) (947,363) (1,078,254) (938,547)Acquisition of intangible assets 18 – (3,536) – (3,536)
Net cash used in investing activities (970,581) (788,829) (945,004) (777,806)
Cash Flows from Financing Activities
Proceeds from long-term loans 29.1 – 750,000 – 750,000 Repayment of long-term loans 29.1 (229,960) (158,594) (229,960) (158,594)Dividend paid (244,102) (311,980) (244,102) (311,980)Payment of lease rentals 29.4 – (1,524) – (1,524)
Net cash from/(used in) financing activities (474,062) 277,902 (474,062) 277,902 Net increase/(decrease) in cash & cash equivalents 1,763,057 (2,941,001) 1,888,559 (2,945,775)Cash & cash equivalents at beginning of the year (3,728,576) (787,575) (3,791,629) (845,854)
Cash & cash equivalents at end of the year (Note A) (1,965,519) (3,728,576) (1,903,070) (3,791,629)
Note A
Analysis of Cash & Cash Equivalents at the end of the year
Cash & bank balances and short-term investments 24 682,078 317,090 615,156 178,996 Short-term borrowings 34 (2,647,597) (4,045,666) (2,518,226) (3,970,625)
Cash and cash equivalents (1,965,519) (3,728,576) (1,903,070) (3,791,629)
Figures in brackets indicate deductions.
The Notes to the Financial Statements from pages 86 to 120 form an integral part of these Financial Statements.
Cash Flow Statement

86
Financial Reports
D I E S E L & M O T O R E N G I N E E R I N G P L C
A N N U A L R E P O RT 2 0 1 2 / 1 3
Notes to the Financial Statements
1. Corporate Information1.1 Reporting EntityDiesel & Motor Engineering PLC (the Company) is a limited liability Company listed on the Colombo Stock Exchange, incorporated and domiciled in Sri Lanka. The Company and its Subsidiaries have the registered office at No. 65, Jetawana Road, Colombo 14. The ordinary shares of the Company are being traded at the Colombo Stock Exchange.
The staff strength of the Company as at 31st March 2013 was 1,367 (2011/12 - 1,222).
1.2 Consolidated Financial StatementsThe Consolidated Financial Statements of Diesel & Motor Engineering PLC as at and for the year ended 31st March 2013 comprise the Company and its fully-owned Subsidiaries (together referred to as the ‘Group’ and individually as ‘Group Entities’).
Diesel & Motor Engineering PLC does not have any identifiable parent of its own.
The Financial Statements of all companies in the Group are prepared to a common financial year, which ends on 31st March.
1.3 Principal Activities and Nature of OperationsThe principal activities of the Company and its subsidiaries are as follows:
Entity Principal Business Activities
The Company
Diesel & Motor Engineering PLC
Import, sale and repair of passenger vehicles, commercial vehicles, material handling machinery, construction machinery, agri machinery, power tools, import & sale of vehicle spares, components, accessories, providing lighting solutions and storage systems.
Fully-owned Subsidiaries
Dimo (Pvt) Ltd. Sale and after sales services of biomedical equipment, power engineering solutions, building technologies, generator sets, diesel engines for marine propulsion & rail traction, and fluid management systems.
Dimo Travels (Pvt) Ltd. Provision of transportation facilities.
Dimo Industries (Pvt) Ltd. The business operations of the Company were ceased and its business activities (Retreading of tyres) were transferred to M/s Diesel & Motor Engineering PLC in December 2010. As per a revitalisation plan, import & sale of passenger car tyres were commenced w.e.f. 1st April 2013.
There were no significant changes in the nature of the principal activities of the Group and the Company during the financial year under review and activities of the Group are described in more detail in the ‘Group Structure’ on page 122.
All subsidiaries of the Company have been incorporated in Sri Lanka.
The Directors have made an assessment of the Group’s ability to continue as a going concern in the foreseeable future, and they do not intend to liquidate or to cease trading activities in any of Group entities.
2. Basis of Preparation2.1 Statement of ComplianceThe Consolidated Financial Statements of the Group and the separate Financial Statements of the Company, have been prepared and presented in accordance with the Sri Lanka Accounting Standards laid down by The Institute of Chartered Accountants of Sri Lanka and in compliance with the requirements of the Companies Act No. 07 of 2007.
For all periods up to and including the year ended 31st March 2012, the Group prepared its Financial Statements in accordance with SLASs which were effective up to 31st March 2012 (previous SLASs). The Financial Statements for the year ended 31st March 2013 are prepared and presented in accordance with new Sri Lanka Accounting Standards (new SLASs) effective from 1st April 2012.
These annual Financial Statements for the year ended 31st March 2013 are the first Consolidated Financial Statements of the Group and the Company prepared in accordance with new Sri Lanka Accounting Standards including Sri Lanka Accounting Standard - SLFRS 1 on ‘First-time Adoption of Sri Lanka Accounting Standards’.
An explanation of as to how the transition to new SLASs has affected the reported financial position and financial performance of the Group and the Company is provided in Note 38 on pages 113 to 120.
2.2 Responsibilities for the Financial StatementsThe Board of Directors is responsible for the preparation and presentation of the Financial Statements of the Company and its subsidiaries as per provisions of Companies Act No. 07 of 2007 and the Sri Lanka Accounting Standards.
The Board of Directors acknowledges this responsibility as set out in the ‘Statement of Directors’ Responsibilities for Financial Statements’, ‘Annual Report of the Board of Directors’ and in the statement appearing with the Statement of Financial Position on pages 78 and 79 respectively, of this Annual Report.
The Financial Statements include following components:
The Income Statement and the Statement of Comprehensive Income: providing information on the financial performance of the Group and the Company for the year. (Refer page 81)
The Statement of Financial Position: providing information on the financial position of the Group and the Company as at the year. (Refer page 82)
The Statement of Changes in Equity: providing information on the movements of stated capital and reserves of the Group and the Company during the period under review. (Refer page 83)
The Statement of Cash Flow: providing information to the users, on generating cash and cash equivalents and utilisation of the same. (Refer page 84 & 85)
Notes to the Financial Statements: comprising accounting policies and other notes.
2.3 Approval of Financial Statements by the Board of DirectorsThe Financial Statements for the year ended 31st March 2013, were authorised for issue by the Board of Directors on 21st May 2013.

87
Financial Reports
D I E S E L & M O T O R E N G I N E E R I N G P L C
A N N U A L R E P O RT 2 0 1 2 / 1 3
2.4 Basis of MeasurementThe Consolidated Financial Statements have been prepared on the historical cost basis, except for the following:
Item and Basis of Measurement Note Page Reference
Land included under property, plant & equipment is measured at cost at the time of acquisition and subsequently at revalued amounts when land is revalued, which are the fair values at the date of revaluation, less accumulated provision for impairment, if any. 16a 101Financial assets available-for-sale are measured at fair value. 20 103
Liability for defined benefit obligations is recognised as the present value of the defined benefit obligation, plus unrecognised actuarial gains, less unrecognised past service cost and unrecognised actuarial losses. 27 106
2.5 Functional and Presentation CurrencyThe Financial Statements are presented in Sri Lankan Rupees, which is the Group’s functional currency.
2.5.1 Transactions and BalancesTransactions in foreign currencies are initially recorded by the Group entities at the functional currency rates prevailing at the date of the transaction. Monetary assets and liabilities denominated in foreign currencies are translated at the spot rate of the functional currency prevailing at the reporting date.
Foreign exchange differences arising on translation of foreign exchange transactions are recognised as a profit or a loss in the Income Statement.
2.6 Significant Accounting Judgments, Estimates and AssumptionsThe preparation of Financial Statements in conformity with SLASs requires management to make judgments, estimates and assumptions that affect the application of accounting policies and the reported amounts of assets, liabilities, income and expenses. Judgments and estimates are based on historical experience and other factors, including expectations that are believed to be reasonable under the circumstances. Hence, actual experience and results may differ from these judgments and estimates. Estimates and underlying assumptions are reviewed on an ongoing basis. Revisions to accounting estimates are recognised in the period in which the estimate is revised and in any future periods affected.
The most significant areas of estimation, uncertainty and critical judgments in applying accounting policies that have the most significant effect on the amounts recognised in the Financial Statements of the Group and Company are as follows:
Going ConcernThe management has made an assessment of its ability to continue as a going concern and is satisfied that it has the resources to continue in business for the foreseeable future. Furthermore, management is not aware of any material uncertainties that may cast significant doubt upon the Group’s ability to continue as a going concern. Therefore, the Financial Statements continue to be prepared on a going concern basis.
Provisions for Contingent LiabilitiesThe Group receives legal claims against it in the normal course of business. The Management considers likelihood of any claim succeeding in making provisions. The time of concluding legal claims is uncertain, as is the amount of possible outflow of economic benefits. Timing and cost ultimately depend on the due process in the respective legal jurisdictions. Please refer details available in Note 3.3.4 for further details on contingent liabilities.
Impairment Losses on Trade ReceivablesThe Group estimates an impairment loss on trade and other receivables as explained in note 3.2.5.2.2. Management’s judgment is used in the estimation of the amount and timing of future cash flows when determining the impairment loss. These estimates are based on assumptions about a number of factors and actual results may differ, resulting in future changes to the allowance made. Trade receivables that are significant are individually assessed for impairment. Remaining trade receivables that are not significant when individually taken, are assessed collectively for impairment. The collective assessment takes account of data from the historical payment patterns and judgment on the effect of concentrations of risks and economic environment.
Impairment Losses on Non Financial AssetsThe Group assesses whether there are any indicators of impairment for an asset at each reporting date or more frequently, if events or changes in circumstances necessitate doing so. This requires the estimation of the ‘value in use’ of such individual assets. Estimating value in use requires management to make an estimate of the expected future cash flows from the asset and also to select a suitable discount rate in order to calculate the present value of the relevant cash flows. This valuation requires the Group to make estimates about expected future cash flows and discount rates, and hence, they are subject to uncertainty. Specific accounting policies on impairment of assets are made available in 3.2.2.7 on page 89.
Deferred Tax AssetsDeferred tax assets are recognised in respect of tax losses to the extent that it is probable that future taxable profits will be available against which the losses can be utilised. Judgment is required to determine the amount of deferred tax assets that can be recognised, based upon the likely timing and level of future taxable profits. (Refer Note 3.5.2 on page 93).
Defined Benefit ObligationThe cost of the defined benefit obligation is determined using an actuarial valuation. The actuarial valuation involves making assumptions about discount rates, expected rates of return on assets, future salary increases, and mortality rates. Due to the long term nature of these obligation, such estimates are subject to significant uncertainty. Refer Note 3. 3.3.2 on page 91.
Income TaxThe Group recognises liabilities for anticipated tax, based on estimate of taxable income where the final tax outcome of these matters is different from the amount that were initially recorded, such differences will be adjusted in the current year’s income tax charge and/in the deferred assets/liabilities as appropriate in the period in which such determination is made.
Notes to the Financial Statements

88
Financial Reports
D I E S E L & M O T O R E N G I N E E R I N G P L C
A N N U A L R E P O RT 2 0 1 2 / 1 3
Notes to the Financial Statements
2.7 Materiality and Aggregation Each material class of similar items is presented separately in the Financial Statements. Items of dissimilar nature or function are presented separately unless they are immaterial as permitted by Sri Lanka Accounting Standard - ‘Framework for the Preparation and Presentation of Financial Statements’.
2.8 OffsettingAssets and liabilities and income and expenses are not set off unless permitted by Sri Lanka Accounting Standards.
2.9 RoundingThe amounts in the Financial Statements have been rounded off to the nearest Rupees thousand, except where otherwise indicated, as permitted by Sri Lanka Accounting Standard - ‘Framework for the Preparation and Presentation of Financial Statements’.
3. Significant Accounting PoliciesThe accounting policies set out below have been applied consistently to all periods presented in these Financial Statements and have been applied consistently by the Company and its entities.
3.1 Basis of Consolidation3.1.1 SubsidiariesSubsidiaries are those entities controlled by the Company. Control exists where the Company has the power to govern the financial and operating policies of an entity so as to obtain benefits from its activities. In assessing control, potential voting rights that are currently exercisable are also taken into account. The Financial Statements of subsidiaries are included in the Consolidated Financial Statements from the date that control commences until the date that control ceases.
A list of the Group’s subsidiaries is set out in Note 19 to the Financial Statements.
Financial Statements of the Group entities are prepared to a common financial year ending 31st March, using uniform accounting policies. Transactions and events in similar circumstances are applied with said accounting policies on a consistent basis.
There are no restrictions on the ability of subsidiaries to transfer funds to the Company (The Parent) in the form of cash dividend or repayment of loans and advances.
3.1.2 Transactions Eliminated on ConsolidationIntra-group balances and transactions, income and expenses and any unrealised gains arising from intra-group transactions are eliminated in preparing the Consolidated Financial Statements. Unrealised losses are also eliminated in the same way as unrealised gains, but only to the extent that there is no evidence of impairment.
3.2 Assets and Basis of their Valuation3.2.1 Investments in SubsidiariesInvestments in subsidiaries are recorded at cost less impairment in the Financial Statement of the Company. The net assets of each subsidiary are reviewed at each reporting date to determine whether there is any indication of impairment. If any such indication exists, then the investments’ recoverable amount is estimated. An impairment loss is recognised to the extent of its net assets loss.
3.2.2 Property, Plant & EquipmentThe Group applies the requirements of the Sri Lanka Accounting Standard - LKAS 16 on ‘Property, Plant & Equipment’ in accounting for its owned assets which are held for and use in the provision of services, or for administrative purposes and are expected to be used for more than one year.
3.2.2.1 Basis of RecognitionProperty, plant & equipment are recognised if it is probable that future economic benefits associated with the asset will flow to the Group and cost of the asset can be reliably measured.
3.2.2.2 Basis of Measurement An item of property, plant & equipment that qualifies for recognition as an asset is initially measured at its cost. Cost includes expenditure that is directly attributable to the acquisition of the asset and subsequent costs. The cost of self-constructed assets includes the cost of materials, direct labour, any other costs directly attributable to bringing the asset to a working condition for its intended use, the costs of dismantling and removing the items and restoring the site on which they are located and borrowing costs that are directly attributable to the asset under construction. Purchased software which is integral to the functionality of the related equipment is capitalised as part of Computer Equipment. When parts of an item of property or equipment have different useful lives, they are accounted for as separate items of property and equipment.
3.2.2.2.1 Cost Model
Property, plant & equipment (excluding freehold land) is stated at cost, net of accumulated depreciation and/or accumulated impairment losses, if any. Such cost includes the cost of replacing component parts of the property, plant and equipment and borrowing costs for long-term construction projects if the recognition criteria are met.
When significant parts of property, plant and equipment are required to be replaced at intervals, the Group derecognises the replaced part, and recognises the new part with its own associated useful life and depreciation. All other repair and maintenance costs are recognised in the Income Statement as incurred.
Borrowing costs directly attributable to the acquisition, construction or production of an asset that necessarily takes a substantial period of time to get ready for its intended use or sale are capitalised as part of the cost of the respective assets. All other borrowing costs are expensed in the period they occur. Borrowing costs consist of interest and other costs that an entity incurs in connection with the borrowing of funds.
3.2.2.2.2 Revaluation Model
Initially, freehold land is recognised at cost and subsequently such properties are carried at a revalued amount when they are revalued, being their fair value at the date of revaluation, less any subsequent accumulated impairment loss.
Revaluation of entire freehold land of the Company is carried out every three years or when there is a substantial difference between the fair value and the carrying amount to ensure that the carrying amounts do not differ materially from the fair values at the reporting date.
Any revaluation surplus is recognised in the Statement of Comprehensive Income and accumulated in equity in the capital reserve, except to the extent that it reverses a revaluation decrease of the same asset previously recognised in the Income Statement, in which case the increase is recognised
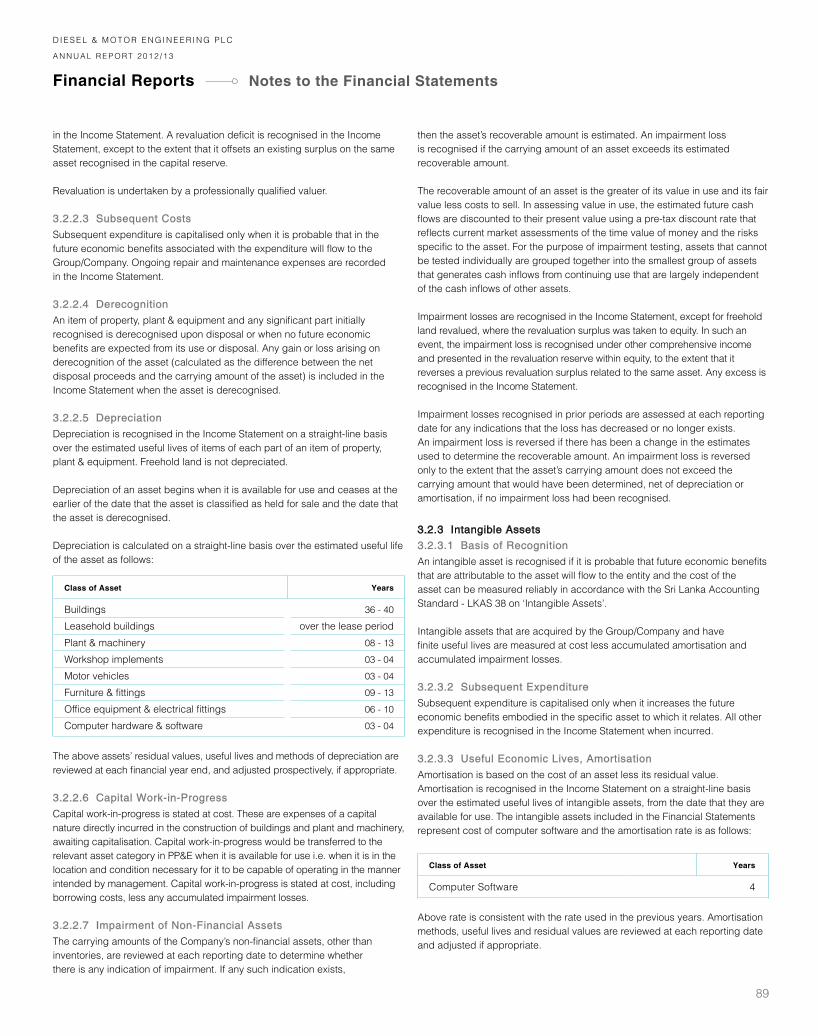
89
Financial Reports
D I E S E L & M O T O R E N G I N E E R I N G P L C
A N N U A L R E P O RT 2 0 1 2 / 1 3
in the Income Statement. A revaluation deficit is recognised in the Income Statement, except to the extent that it offsets an existing surplus on the same asset recognised in the capital reserve.
Revaluation is undertaken by a professionally qualified valuer.
3.2.2.3 Subsequent Costs Subsequent expenditure is capitalised only when it is probable that in the future economic benefits associated with the expenditure will flow to the Group/Company. Ongoing repair and maintenance expenses are recorded in the Income Statement.
3.2.2.4 DerecognitionAn item of property, plant & equipment and any significant part initially recognised is derecognised upon disposal or when no future economic benefits are expected from its use or disposal. Any gain or loss arising on derecognition of the asset (calculated as the difference between the net disposal proceeds and the carrying amount of the asset) is included in the Income Statement when the asset is derecognised.
3.2.2.5 Depreciation Depreciation is recognised in the Income Statement on a straight-line basis over the estimated useful lives of items of each part of an item of property, plant & equipment. Freehold land is not depreciated.
Depreciation of an asset begins when it is available for use and ceases at the earlier of the date that the asset is classified as held for sale and the date that the asset is derecognised.
Depreciation is calculated on a straight-line basis over the estimated useful life of the asset as follows:
Class of Asset Years
Buildings 36 - 40Leasehold buildings over the lease period Plant & machinery 08 - 13Workshop implements 03 - 04Motor vehicles 03 - 04Furniture & fittings 09 - 13Office equipment & electrical fittings 06 - 10Computer hardware & software 03 - 04
The above assets’ residual values, useful lives and methods of depreciation are reviewed at each financial year end, and adjusted prospectively, if appropriate.
3.2.2.6 Capital Work-in-ProgressCapital work-in-progress is stated at cost. These are expenses of a capital nature directly incurred in the construction of buildings and plant and machinery, awaiting capitalisation. Capital work-in-progress would be transferred to the relevant asset category in PP&E when it is available for use i.e. when it is in the location and condition necessary for it to be capable of operating in the manner intended by management. Capital work-in-progress is stated at cost, including borrowing costs, less any accumulated impairment losses.
3.2.2.7 Impairment of Non-Financial Assets The carrying amounts of the Company’s non-financial assets, other than inventories, are reviewed at each reporting date to determine whether there is any indication of impairment. If any such indication exists,
then the asset’s recoverable amount is estimated. An impairment loss is recognised if the carrying amount of an asset exceeds its estimated recoverable amount.
The recoverable amount of an asset is the greater of its value in use and its fair value less costs to sell. In assessing value in use, the estimated future cash flows are discounted to their present value using a pre-tax discount rate that reflects current market assessments of the time value of money and the risks specific to the asset. For the purpose of impairment testing, assets that cannot be tested individually are grouped together into the smallest group of assets that generates cash inflows from continuing use that are largely independent of the cash inflows of other assets.
Impairment losses are recognised in the Income Statement, except for freehold land revalued, where the revaluation surplus was taken to equity. In such an event, the impairment loss is recognised under other comprehensive income and presented in the revaluation reserve within equity, to the extent that it reverses a previous revaluation surplus related to the same asset. Any excess is recognised in the Income Statement. Impairment losses recognised in prior periods are assessed at each reporting date for any indications that the loss has decreased or no longer exists. An impairment loss is reversed if there has been a change in the estimates used to determine the recoverable amount. An impairment loss is reversed only to the extent that the asset’s carrying amount does not exceed the carrying amount that would have been determined, net of depreciation or amortisation, if no impairment loss had been recognised.
3.2.3 Intangible Assets3.2.3.1 Basis of RecognitionAn intangible asset is recognised if it is probable that future economic benefits that are attributable to the asset will flow to the entity and the cost of the asset can be measured reliably in accordance with the Sri Lanka Accounting Standard - LKAS 38 on ‘Intangible Assets’.
Intangible assets that are acquired by the Group/Company and have finite useful lives are measured at cost less accumulated amortisation and accumulated impairment losses.
3.2.3.2 Subsequent ExpenditureSubsequent expenditure is capitalised only when it increases the future economic benefits embodied in the specific asset to which it relates. All other expenditure is recognised in the Income Statement when incurred.
3.2.3.3 Useful Economic Lives, Amortisation Amortisation is based on the cost of an asset less its residual value. Amortisation is recognised in the Income Statement on a straight-line basis over the estimated useful lives of intangible assets, from the date that they are available for use. The intangible assets included in the Financial Statements represent cost of computer software and the amortisation rate is as follows:
Class of Asset Years
Computer Software 4
Above rate is consistent with the rate used in the previous years. Amortisation methods, useful lives and residual values are reviewed at each reporting date and adjusted if appropriate.
Notes to the Financial Statements

90
Financial Reports
D I E S E L & M O T O R E N G I N E E R I N G P L C
A N N U A L R E P O RT 2 0 1 2 / 1 3
The Group’s intangible assets, with the reconciliation of carrying amount, accumulated amortisation at the beginning and the end of the year is given in Note 18 to the Financial Statements on page 102 of this Annual Report. Amortisation expenses of intangible assets are included in administrative expenses in the Income Statement.
3.2.3.4 DerecognitionIntangible assets are derecognised on disposal or when no future economic benefits are expected from its use. Gains or losses arising from derecognition of intangible assets are measured as the difference between the net disposal proceeds, and the carrying amount of the assets and are recognised in the Income Statement.
3.2.3.5 ImpairmentIntangible assets with indefinite useful lives are tested for impairment annually as at 31st March either individually or at the cash-generating unit level, as appropriate, and when circumstances indicate that the carrying value may be impaired.
3.2.4 Lease Rentals Paid in AdvanceLease rentals paid in advance is stated at cost less accumulated amortisation. Such carrying amounts are amortised over the remaining lease period or useful life of the leasehold property whichever is shorter. Details of lease rentals paid in advance are given in Note 17 to the Financial Statements.
3.2.5 Financial Assets3.2.5.1 Measurement and Recognition3.2.5.1.1 Financial Assets Available-for-Sale (AFS)
Financial assets available-for-sale consist of investments in quoted shares, which are non-derivative instruments, AFSs are carried at fair value. Dividend income is recognised in the Income Statement when the Group becomes entitled to receive the dividend.
After initial measurement, AFSs are subsequently measured at fair value with unrealised gain or losses recognised through other comprehensive income in the ‘financial assets available-for-sales reserve’ (AFS reserve) until the investment is derecognised, at which time the cumulative gain or loss is recognised under other operating income. In the event of the financial asset being deemed to be impaired, the cumulative loss is shown in the Income Statement under finance costs at which time it will be removed from the ‘AFS reserve’.
3.2.5.1.2 Trade and Other Receivables
Trade and other receivables are non-derivative financial assets with fixed or determinable payments. They are recognised initially at fair value and subsequently measured at amortised cost using effective interest rate method, less provision for impairment.
3.2.5.2 Impairment of Financial Assets3.2.5.2.1 Impairment of Financial Assets Available-for-Sale
For financial assets available-for-sale, the Group assesses at each reporting date whether there is objective evidence that an asset or a group of assets is impaired. In the case of equity investments classified as available-for-sale, objective evidence would include a significant or prolonged decline in the fair value of the investment below its cost. ‘Significant’ is evaluated against the original cost of the investment and ‘prolonged’ against the period for which the fair value has been below its original cost. Where there is evidence of impairment, the cumulative loss - measured as the difference between the acquisition cost and the current fair value, is removed from other comprehensive income.
3.2.5.2.2 Impairment of Trade and Other Receivables
The Company considers evidence of impairment of receivables at both specific asset level and at collective level. All individually significant receivables are assessed for specific impairment. Receivables not individually assessed are then collectively assessed for any impairment. Receivables that are considered for collective impairment are collectively assessed for impairment by grouping together receivables with similar risk characteristics.
In assessing collective impairment, the Company uses historical trends of the probability of default, the timing of recoveries, and the amount of losses incurred, adjusted for management’s judgment as to whether current economic and credit conditions are such that the actual losses are likely to be greater or less than suggested historical trends.
3.2.6 Cash and Cash EquivalentsCash and cash equivalents comprise of cash balances, investments in government treasury bills and short-term deposits with an original maturity of three months or less. Cash and Bank balances are stated at recoverable values. Short-term deposits are stated at recoverable value of the deposit. Treasury bills are stated at gross value less unearned interest. There were no cash and cash equivalents held by the Group companies that were not available for use. Bank overdrafts and short-term borrowings that are repayable on demand and forming an integral part of the Group’s cash management are included as a component of cash and cash equivalents for the purpose of the Statement of Cash Flows. Details of cash and cash equivalents are given in Note 24 to the Financial Statements on page 105.
3.2.7 Derecognition of Financial AssetsFinancial assets (or, where applicable a part of a financial asset or part of a group of similar financial assets) is derecognised when:
a. The right to receive cash from the assets have expiredb. The Group has transferred its right to receive cash flow from the asset or
has assumed an obligation to pay the received cash in full without material delay to a third party under a ‘pass through’ arrangement, and either,i. The Group: has transferred substantially all the risk and rewards of the
assets, orii. has neither transferred nor retained substantially all the risk and rewards
of the assets, but has transferred control of the assets
3.2.8 Other Current AssetsOther current assets include advances, deposits and prepayments.
Advances and deposits are carried at historical value less impairment. Prepayments are carried at historical value less impairment and amortised over the period during which it is utilised.
3.2.9 Current Tax Assets/LiabilitiesCurrent tax assets are recognised at historical value less impairment. Income tax liabilities are recorded at the amounts expected to be paid.
Notes to the Financial Statements

91
Financial Reports
D I E S E L & M O T O R E N G I N E E R I N G P L C
A N N U A L R E P O RT 2 0 1 2 / 1 3
3.2.10 Inventories3.2.10.1 Stock in TradeInventories are measured at the lower of cost and net realisable value. The general basis on which cost is determined is as follows:
All inventory items are measured at weighted average of the directly attributable costs and include expenditure incurred in acquiring the inventories and bringing them to their present location and condition but excluding borrowing costs. Work in progress is measured at cost including all directly attributable costs.
Net realisable value is the estimated selling price in the ordinary course of business less the estimated cost of selling expenses.
3.2.10.2 Goods-in-TransitInventory items shipped, but not received by the Company as at the reporting date are treated as goods-in transit. In such situations, estimates are made for unpaid bills in order to value goods-in-transit.
3.3 Liabilities and Provisions3.3.1 Liabilities3.3.1.1 Long-Term and Short-Term BorrowingsBorrowings are initially recognised at fair value net of transactions cost. Subsequently, they are stated at amortised cost; any difference between the proceeds (Net of transaction cost) and the repayable amount (including interest) is recognised in the Income Statement over the period of the loan using effective interest method.
3.3.1.2 Trade PayablesTrade payables are due within ninety days and are recorded at amounts expected to be paid.
3.3.1.3 DividendsDividends declared during the year on ordinary shares, are recognised as a liability and deducted from equity when they are approved by the Board of Directors. Dividends for the year approved after the reporting date are disclosed as an event after the reporting period in accordance with the Sri Lanka Accounting Standard - LKAS 10 on ‘Events after the Reporting Period’.
3.3.1.4 Other Current LiabilitiesOther current liabilities include accruals and advances. These liabilities are recorded at the amounts that are expected to be paid.
3.3.1.5 Amounts due to SubsidiariesAmount due to subsidiaries are recorded in the Company’s Financial Statements at the amounts expected to be paid.
3.3.2 ProvisionsProvisions are recognised when the Group has a present obligation (legal or constructive) as a result of a past event, it is probable that an outflow of resources embodying economic benefits will be required to settle the obligation and a reliable estimate can be made of the amount of the obligation. Where the Group expects some or all of a provision to be reimbursed, for example under an insurance contract, the reimbursement is recognised as a separate asset when the reimbursement is certain.
The expense relating to any provision is presented in the Income Statement net of any reimbursement. If the effect of the time value of money is material, provisions are discounted using a current pre-tax rate that reflects, where appropriate, the risks specific to the liability. Where discounting is used, the increase in the provision due to the passage of time is recognised as a finance cost.
All known provisions have been accounted for in preparing the Financial Statements.
3.3.2.1 Provision for Extended Warranty The Company may offer extended warranties on vehicles on its own account in certain circumstances. The extended warranty is provided by giving a warranty period that goes beyond the warranty provided by manufacturers. The Company recognises a provision for such warranty given when the product is sold. The quantum of the provision is based on the historical experience. The said extended warranty provision will be reversed upon expiration of warranty period.
3.3.3 Employee Benefits3.3.3.1 Defined Contribution Plans A defined contribution plan is a post-employment benefit plan under which an entity pays fixed of determinable contributions into a separate entity and will have no legal or constructive obligation to pay further amounts.
Employees are eligible to Employees’ Provident Fund (EPF) contributions and Employees’ Trust Fund (ETF) contributions as per the respective statutes. These obligations come within the scope of a defined contribution plan as per LKAS -19 on ‘Employee Benefits’. The contributions made are expensed to the Income Statement as and when the contributions are made.
3.3.3.2 Defined Benefits Obligations In accordance with the Gratuity Act No. 12 of 1983, a liability arises for a defined benefit obligation to employees. Such defined benefit obligation is a post-employment benefit obligation falling within the scope of Sri Lanka Accounting Standard LKAS -19 on ‘Employee Benefits’.
The calculation is performed annually by a qualified actuary using the projected unit credit method (PUC). The Company recognises all actuarial gain and loss arising from defined benefit obligation immediately in other comprehensive income. The discount rate is the yield at the reporting date based on six year government bonds. The liability is not externally funded.
3.3.3.3 Short-Term BenefitsShort-term employee benefit obligations are measured at cost and are expensed as and when the related service is provided.
3.3.4 Contingent LiabilitiesContingent liabilities are possible obligations whose existence will be confirmed only by uncertain future events or present obligations where the transfer of economic benefit is not probable or cannot be readily measured as defined in the Sri Lanka Accounting Standard - LKAS 37 on ‘Provisions, Contingent Liabilities and Contingent Assets’.
No provision for any claims has been made in the Financial Statements. The contingent liabilities are disclosed in Note 36.2 to the Financial Statement.
Notes to the Financial Statements

92
Financial Reports
D I E S E L & M O T O R E N G I N E E R I N G P L C
A N N U A L R E P O RT 2 0 1 2 / 1 3
3.3.5 Deferred Income Arising from Sale and Lease Back Transactions
The excess of sales proceeds over the cost of an asset in a sale and lease back transaction is classified as deferred income. Deferred income is systematically amortised to the Income Statement over the lease period.
Arising from Undelivered Free Services Relating to Sale of VehiclesThe Company sells vehicles bundled with the free services to the customers with warranty limitations on mileage or usage period. The unprovided free services are measured on each reporting date by using relative fair value method and shown in the Statement of Financial Position under deferred income. Fair value in connection with the used or expired free service income is transferred to the Income Statement.
3.3.6 Offsetting of Financial Assets and LiabilitiesFinancial assets and financial liabilities are offset and the net amount is reported in the Statement of Financial Position if, and only if, there is a currently enforceable legal right to offset the recognised amounts and there is an intention to settle on a net basis, or to realise the assets and settle the liabilities simultaneously.
3.4 The Income Statement For the purpose of presentation of the Income Statement, the function of expenses method is adopted, as it represents fairly the elements of the Company performance.
3.4.1 Revenue RecognitionRevenue is recognised to the extent that it is probable that the economic benefits will flow to the Company and the revenue and associated costs incurred or to be incurred can be reliably measured. Revenue is measured at the fair value of the consideration received or receivable net of trade discounts and sales taxes. The Group separately identifies different components of a single transaction in order to reflect the substance of the transaction. The following specific criteria are used for the purpose of recognition of revenue.
a. Sale of GoodsRevenue from the sale of goods is recognised when the significant risks and rewards of ownership of the goods have passed to the buyer, usually on delivery of the goods.
b. Provision of ServicesRevenue from services rendered is recognised in the Income Statement once all significant performance obligations have been provided.
c. Construction Related ContractsRevenue from construction related contracts is recognised in the Income Statement by reference to the stage of completion of the transactions at the end of the reporting date.
d. Service Support IncomeService support income which is included in revenue represents income received from foreign principals on indent sales. Such income is recognised on an accrual basis at the time of supply of goods and services relating to the service support provided by the Group.
e. Free Services Income Bundled With Vehicle SalesRevenue arising from free service are deferred using relative fair value basis and recognised as and when the revenue recognition criteria are fulfilled i.e. upon provision of the service or expiration of entitled period or/and criteria, whichever occurs first.
f. Rent IncomeRent income is recognised as it accrues.
g. Dividend IncomeDividend income is recognised when the entity becomes entitled to receive the dividend.
h. Other Comprehensive Income (OCI)OCI refers to revenues, expenses, gains and losses that, are classified under comprehensive income, but are excluded from net income as these amounts are recorded directly as an adjustment to shareholders’ equity. The Group’s other comprehensive income is primarily comprised of unrealised gains/losses on marketable securities designated as financial assets available for-sale, actuarial gain/loss, and revaluation adjustments arising from freehold land.
3.4.2 Finance Income and ExpensesFinance income comprises of interest income. Interest income is recognised in the Income Statement as it accrues, using the effective interest method.
Finance costs comprise interest expense on borrowings and impairment losses recognised on financial assets (other than trade receivables).
Foreign currency gains and losses are reported on a net basis as either finance income or finance cost depending on whether foreign currency movements are in a net gain or net loss position.
3.4.3 Borrowing CostsAs per the Sri Lanka Accounting Standard - LKAS 23 on ‘Borrowing costs’, the Group capitalises borrowing costs that are directly attributable to the acquisition, construction or production of a qualifying asset, as part of the cost of the asset. A qualifying asset is an asset which takes a substantial period of time to get ready for its intended use or sale. Other borrowing costs are recognised in the Income Statement in the period in which they occur.
3.4.4 Warranty CostCosts incurred by the Company under the terms of the warranty are reimbursed by manufacturers. Any amounts that are not reimbursed under the warranty agreement are charged to the Income Statement.
3.5 Income Tax ExpenseAs per the Sri Lanka Accounting Standards - LKAS 12 on ‘Income Taxes’, tax expense/(reversal) is the aggregate amount included in determination of profit or loss for the period in respect of current and deferred taxes. Therefore, it consist of current and deferred tax. Income tax expense is recognised in the Income Statement except to the extent it relates to items recognised directly in Equity or in Other Comprehensive Income (OCI), in which case it is recognised in Equity or in OCI. The Group recognises liabilities for anticipated tax, based on estimates of taxable income. where the final tax outcome of these matters is different from the amounts, that were initially recorded such difference will be adjusted in the current year’s income tax charge and/or in the deferred tax assets/liabilities as appropriate in the period in which such determination is made.
Notes to the Financial Statements

93
Financial Reports
D I E S E L & M O T O R E N G I N E E R I N G P L C
A N N U A L R E P O RT 2 0 1 2 / 1 3
3.5.1 Current TaxCurrent tax is the expected tax payable on the taxable income for the year, using tax rates enacted at the reporting date and any adjustments to tax payable in respect of previous years. Note 12 includes the major components of tax expense, the effective tax rates and reconciliation between the profit before tax and tax expense, as required by the Sri Lanka Accounting Standard LKAS - 12 on ‘Income Taxes’.
3.5.2 Deferred TaxationDeferred tax is provided using liability method on temporary differences as at the reporting date between the tax written down value and their carrying amounts in financial reporting, for all Group entities.
Deferred tax provision calculated by applying on the temporary difference, the income tax rate that is applicable at the time of reversal. In the absence of the availability of the income tax rate applicable on the reversal date, the income tax rate applicable on the reporting date is used.
A deferred tax asset is recognised only to the extent that it is probable that future taxable profits will be available against which the temporary difference can be utilised.
The carrying amount of deferred tax assets is reviewed at each reporting date and reduced to the extent that is no longer probable that sufficient taxable profits will be available to allow all or part of the deferred tax assets to be utilised. Unrecognised deferred tax assets are reassessed at each reporting date and are recognised to the extent that it is probable that future taxable profits will allow the deferred tax assets to be recovered.
3.5.3 Withholding Tax on Dividends, Distributed by the Company
and Group EntitiesWithholding Tax (WHT) on dividend arising from the distribution of dividends by the Company is recognised at the time the liability to pay the related dividend is recognised.
3.6 Events Occurring After the Reporting DateIn accordance with the Sri Lanka Accounting Standard - LKAS 10 on ‘Events After the Reporting Period’, events after the reporting date are those events that occur between the reporting date and the date when the Financial Statements are authorised to issue. All material Post reporting date events have been considered and where appropriate adjustments or disclosures have been made in the respective Notes to the Financial Statements.
3.7 Earnings Per Share (EPS)EPS is calculated by dividing the profit attributable to ordinary shareholders of the Company by the weighted average number of ordinary shares outstanding during the period.
4. Cash Flow StatementThe Cash flow statement has been prepared using the ‘indirect method’ in accordance with Sri Lanka Financial Reporting Standard - LKAS 7 on ‘Statement of Cash Flows’. Cash and cash equivalents comprise cash in hand and cash at bank that are readily convertible to known amounts of cash and are subject to an insignificant risk of changes in value. The transition from previous SLASs to new SLASs has not had a material impact on the Statement of Cash Flows.
Interest paid is classified under operating cash flows. Dividends received and interest income is classified under cash flows from investing activities. Dividends paid are classified under cash flow from financing activities.
Bank overdraft and short term borrowings that are repayable on demand and forming an integral part of the Group’s cash management are included as a component of cash and cash equivalents for the purpose of the Statement of Cash Flow.
5. Segment ReportingAn operating segment is a component of the Group that engages in business activities from which it may earn revenues and incur expenses, including revenues and expenses that relate to transactions with any of the Group’s other components.
Inter-segment transfers are based on fair market prices (arm’s length basis in a manner similar to transactions with third parties). Segment results, assets and liabilities include items directly attributable to a segment as well as those that can be allocated on a reasonable basis.
Unallocated assets and liabilities comprise mainly of assets and liabilities that cannot be attributed to a particular segment.
Detailed information of each reportable segment as required by the Sri Lanka Accounting Standard - SLFRS 8 on ‘Operating Segments’ is provided in Note 8 on page 94.
6. Comparative InformationComparative information is reclassified wherever necessary to conform with the current year’s classification in order to provide a better presentation. The details of such reclassifications have been provided in Note 38 to the Financial Statements.
7. First-time Adoption of New SLASs The Group followed the Sri Lanka Accounting Standard - SLFRS 1 on ‘First-time Adoption of Sri Lanka Accounting Standards’. An explanation for the adjustments and reclassifications as a consequence of transition from previous SLASs to new SLASs is disclosed in Note 38 to the Financial Statement.
Notes to the Financial Statements

94
Financial Reports
D I E S E L & M O T O R E N G I N E E R I N G P L C
A N N U A L R E P O RT 2 0 1 2 / 1 3
8. Segment InformationThe Group comprises of the following main business segments:
Segment Products and Services
Vehicles - Sales - Sale of Brand new Passenger Vehicles, Four-Wheel Drive Vehicles, Commercial Vehicles, Agri Machinery, Special Purpose Vehicles and Pre-owned Passenger Vehicles.
Vehicles - After Services - Repair and Service of Passenger and Commercial Vehicles, Sale of Vehicle Spare Parts, Accessories and Components.
Marketing and Distribution - Sale of Power Tools and Accessories, Lamps, Lighting Fittings and Accessories, Tyres and Retreaded Tyres.
Construction & Material Handling
Equipment and After Services
- Sales and Services of Earth Moving Machinery, Road Construction Machinery, Forklifts, Material Handling Machinery, Racking Systems, Fluid Management Systems, Dock Levellers and Car Parking Systems.
Electro-Mechanical, Bio Medical
Engineering and Marine Solutions
- Sale, Installation, Commissioning and Maintenance of Medical Equipment, Generating Sets, Diesel Engines for Marine Propulsion and Rail Traction, Building Management Systems, Industrial Refrigeration Systems and Power Engineering Equipment and Systems.
8.1 Segmental Results and Assets/Liabilities
Group
Vehicles - Sales Vehicles - After Services Marketing and Distribution
Construction & Material Handling Equipment and
After Services
Electro Mechanical & Bio Medical Engineering
and Marine Solutions
Total
For the year ended 31st March 2013Rs. ’000
2012Rs. ’000
2013Rs. ’000
2012Rs. ’000
2013Rs. ’000
2012Rs. ’000
2013Rs. ’000
2012Rs. ’000
2013Rs. ’000
2012Rs. ’000
2013Rs. ’000
2012Rs. ’000
Business Segment Turnover and Results
Total segment revenue 20,794,283 33,234,126 2,758,442 2,196,655 2,181,450 2,014,504 1,437,782 2,138,204 1,221,937 868,895 28,393,894 40,452,384
Inter-segment revenue 57,995 89,233 463,793 453,460 47,450 46,412 56,461 – 56,591 336 682,290 589,441
Total external revenue 20,736,288 33,144,893 2,294,649 1,743,195 2,134,000 1,968,092 1,381,321 2,138,204 1,165,346 868,559 27,711,604 39,862,943
Segment results 916,766 3,841,848 445,586 456,170 15,605 125,345 142,765 150,177 186,168 130,319 1,706,890 4,703,859
Unallocated other income/(expenses) – – – – – – – – – – 35,903 (18,001)
Unallocated expenses – – – – – – – – – – (857,292) (707,447)
Finance cost - net – – – – – – – – – – (395,480) (253,890)
Income tax expense – – – – – – – – – – (27,871) (1,022,870)
Profit for the year – – – – – – – – – – 462,150 2,701,651
Business Segment Assets and Liabilities
Segment assets 3,740,927 6,795,550 1,251,320 1,109,438 1,132,103 1,223,006 492,174 627,668 1,034,883 565,170 7,651,407 10,320,832
Unallocated assets – – – – – – – – – – 5,248,972 4,979,386
Total assets 12,900,379 15,300,218
Segment liabilities 2,914,312 4,792,748 109,137 32,988 102,724 84,800 23,084 235,810 88,902 39,035 3,238,159 5,185,381
Unallocated liabilities – – – – – – – – – – 2,031,053 2,674,222
Equity – – – – – – – – – – 7,631,167 7,440,615
Total equity and liabilities 12,900,379 15,300,218
Other Information
Capital expenditure 12,741 35,488 86,525 61,221 28,395 10,672 5,512 3,838 15,984 7,455 149,157 118,674
Unallocated capital expenditure – – – – – – – – – – 945,296 832,225
Depreciation 13,759 15,835 52,867 43,459 8,036 3,068 3,389 2,891 6,719 6,981 84,770 72,234
Unallocated depreciation – – – – – – – – – – 85,763 66,294
Notes to the Financial Statements

95
Financial Reports
D I E S E L & M O T O R E N G I N E E R I N G P L C
A N N U A L R E P O RT 2 0 1 2 / 1 3
8.2 Segment Cash FlowVehicles - Sales Vehicles - After Services Marketing and
DistributionConstruction & Material Handling Equipment and
After Services
Electro Mechanical & Bio Medical Engineering
and Marine Solutions
Total
For the year ended 31st March 2013Rs. ’000
2012Rs. ’000
2013Rs. ’000
2012Rs. ’000
2013Rs. ’000
2012Rs. ’000
2013Rs. ’000
2012Rs. ’000
2013Rs. ’000
2012Rs. ’000
2013Rs. ’000
2012Rs. ’000
Business Segment Cash Flows
Cash generated from/ (used in) operations 3,855,559 (1,611,812) 678,865 (76,734) (116,989) 225,486 325,714 (315,373) (46,286) (409,612) 4,696,863 (2,188,045)
Net cash flows from/(used in) investing activities (33,485) (21,280) (191,048) (29,251) (2,414) (3,616) (5,517) (9,687) (17,803) (13,594) (250,267) (77,428)
Unallocated Cash Flows
Common cash (out flow)/inflow (972,953) 1,759,280
Income tax paid (265,943) (1,923,881)
Proceeds from disposal of property, plant & equipment 13,556 25,257
Dividend received 147 165
Interest received 110,169 136,648
Acquisition and construction of property, plant & equipment and capital work-in-progress (1,094,453) (947,363)
Acquisition of intangible asset – (3,536)
Proceeds from long-term loans – 750,000
Repayment of long-term loans (229,960) (158,594)
Repayment of finance lease rentals – (1,524)
Dividend paid (244,102) (311,980)
Net increase/(decrease) in cash and cash equivalents 1,763,057 (2,941,001)
The Operating business are organised and managed separately according to the nature of the products and services provided. The Primary segment reporting format is determined based on products and services offered as the Group’s risks and returns are affected predominantly by differences in the products and services offered.
9. Other Operating Income/(Expenses)Group Company
For the year ended 31st March 2013 2012 2013 2012Rs. ’000 Rs. ’000 Rs. ’000 Rs. ’000
Rent income 6,534 10,210 – 2,983 Amortisation of deferred income 3,191 3,190 3,191 3,190 Sundry income 30,361 36,281 22,099 34,030 Dividend income 235 165 13,015 3,765 Loss on disposal of property, plant & equipment (4,418) (67,847) (2,878) (67,883)
35,903 (18,001) 35,427 (23,915)
Notes to the Financial Statements

96
Financial Reports
D I E S E L & M O T O R E N G I N E E R I N G P L C
A N N U A L R E P O RT 2 0 1 2 / 1 3
10. Net Finance ExpenseGroup Company
For the year ended 31st March 2013 2012 2013 2012Rs. ’000 Rs. ’000 Rs. ’000 Rs. ’000
Finance Income
Interest income 110,169 136,648 108,370 135,290 Exchange gain on translation of foreign currency 130,592 60,130 132,808 44,363
Total finance income 240,761 196,778 241,178 179,653
Finance Expense
Interest on long-term borrowings (53,329) (59,738) (53,329) (59,738)Interest on short-term borrowings (582,912) (390,461) (577,469) (387,346)Interest on finance lease – (469) – (469)
Total finance expense (636,241) (450,668) (630,798) (447,553)
Net finance expense (395,480) (253,890) (389,620) (267,900)
11. Profit Before Income Tax 11.1 Profit before Income Tax is Stated after Charging/(Reversing) the following:
Group Company
For the year ended 31st March 2013 2012 2013 2012Rs. ’000 Rs. ’000 Rs. ’000 Rs. ’000
Directors’ emoluments - Short-term employment benefit 159,847 100,587 149,827 90,542 Directors’ emoluments - Post-employment benefits 43,267 41,086 41,011 39,267 Auditors’ remuneration - Audit services 2,415 1,928 1,980 1,575 - Audit-related services 932 991 785 826 - Non-audit services 628 2,272 454 1,830 Depreciation on property, plant & equipment 167,385 135,164 160,665 129,855 Amortisation of intangible assets and lease rentals paid in advance 3,148 3,364 3,148 3,364 Provision/(reversal) for/of impairment of trade and other receivable (65,538) 181,129 (48,515) 201,941 Provision for slow moving inventories 131,061 99,989 122,593 105,092 Donations 14,804 27,105 14,104 26,576 Legal fees 17,753 5,958 15,904 5,833 Staff expenses (Note 11.2) 1,098,171 1,019,101 970,656 910,612
11.2 Staff ExpensesGroup Company
For the year ended 31st March 2013 2012 2013 2012Rs. ’000 Rs. ’000 Rs. ’000 Rs. ’000
Defined contribution plan costs (EPF and ETF) 145,001 119,202 128,032 105,983Defined benefit obligation current cost (Retiring gratuity) 19,745 15,375 17,908 14,257Training expenses 41,866 31,920 28,401 27,918Salaries and wages 891,559 852,604 796,315 762,454
1,098,171 1,019,101 970,656 910,612
Average number of employees for the year 1,433 1,179 1,290 1,077
The average number of employees is calculated by averaging the number of employees as at the year end in the current and previous year.
Notes to the Financial Statements

97
Financial Reports
D I E S E L & M O T O R E N G I N E E R I N G P L C
A N N U A L R E P O RT 2 0 1 2 / 1 3
12. Income Tax Expense Group Company
For the year ended 31st March 2013 2012 2013 2012Rs. ’000 Rs. ’000 Rs. ’000 Rs. ’000
Current Tax Expense
Current tax on profit for the year (Note 12.1) 69,092 1,065,737 21,536 1,013,462 Under/(over) provision in respect of previous year 1,494 (13,067) 74 (12,338)
70,586 1,052,670 21,610 1,001,124
Deferred Tax Expense
Reversal of temporary differences (Note 28) (42,715) (29,800) (41,853) (29,903)
Total income tax expense/(reversal) 27,871 1,022,870 (20,243) 971,221
12.1 Reconciliation of Accounting Profit to Income Tax ExpenseGroup Company
For the year ended 31st March 2013 2012 2013 2012Rs. ’000 Rs. ’000 Rs. ’000 Rs. ’000
Profit before taxation 490,021 3,724,521 331,581 3,545,122
Disallowable expenses 387,338 381,075 371,219 368,528 Allowable expenses (267,963) (274,494) (263,745) (270,539)Qualifying Payments (362,177) (20,160) (361,677) (20,125)
Taxable income 247,219 3,810,942 77,378 3,622,986
Income tax Tax at 12% 98 995 98 730 Tax at 28% 68,994 1,064,742 21,438 1,012,732
Current tax on profits for the year 69,092 1,065,737 21,536 1,013,462
Effective tax rate (%) 14 29 6 29
Income tax has been computed in accordance with the Inland Revenue Act No. 10 of 2006 and amendments thereto. The companies within the Group are liable to income tax at 28%. The tax on export profits is 12%.
Withholding tax on the final dividend approved on 21st May 2013 is Rs. 8.88 mn. The actual liability arises in the year in which dividend is paid. Therefore, no liability is recognised in these Financial Statements.
12.2 Tax Losses Brought Forward and Utilised During the Year
Group Company
For the year ended 31st March 2013 2012 2013 2012Rs. ’000 Rs. ’000 Rs. ’000 Rs. ’000
Tax losses at the beginning of the year 10,546 9,580 – – Loss incurred during the year – 966 – –
Tax losses at the end of the year 10,546 10,546 – –
Tax losses brought forward relate to Dimo Industries (Pvt) Ltd. (Refer Note 28.3)
Notes to the Financial Statements

98
Financial Reports
D I E S E L & M O T O R E N G I N E E R I N G P L C
A N N U A L R E P O RT 2 0 1 2 / 1 3
13. Earnings Per Share13.1 Earnings per share has been calculated by dividing the profit for the year attributable to equity holders of the Company by the weighted average number of ordinary shares outstanding during the year. The weighted average number of ordinary shares outstanding during the year and the previous year are adjusted for events that have changed the number of ordinary shares outstanding during the year, as per the requirements of the Sri Lanka Accounting Standard - LKAS 33 on ‘Earnings per Share’.
13.2 Calculation of Earnings Per ShareGroup Company
For the year ended 31st March 2013 2012 2013 2012
Profit attributable to ordinary shareholders (Rs. ’000) 462,150 2,701,651 351,824 2,573,901Weighted average number of ordinary shares 8,876,437 8,876,437 8,876,437 8,876,437
Earnings per ordinary share (Rs.) 52.06 304.36 39.64 289.97
14. Dividends
Calculation of Dividend Per ShareCompany
For the year ended 31st March 2013 2012Rs. ’000 Rs. ’000
Interim dividend paid - First interim – 44,382 - Second interim – 66,573 Final dividend approved 88,764 244,102
88,764 355,057
Dividend per share (Rs.) 10.00 40.00
No interim dividend was paid during the financial year 2012/13. (Interim dividends totalling to Rs. 12.50 per share were paid in 2011/12.)
14.1 Approved Final DividendThe Board of Directors of the Company has approved the payment of a first and final dividend of Rs. 10.00 per share for the year ended 31st March 2013 (2011/12 - final dividend of Rs. 27.50 per share). In accordance with the - LKAS 10 on ‘Events after the Reporting Period’, this final dividend has not been recognised as a liability in the Financial Statements as at 31st March 2013.
Notes to the Financial Statements

99
Financial Reports
D I E S E L & M O T O R E N G I N E E R I N G P L C
A N N U A L R E P O RT 2 0 1 2 / 1 3
15. Classification of Financial Assets and LiabilitiesIn accordance with the LKAS 39 on ‘Financial Instrument Recognition and Measurement’, financial assets have been classified as follows.
Group Company
As at 31.03.2013 31.03.2012 01.04.2011 31.03.2013 31.03.2012 01.04.2011Rs. ’000 Rs. ’000 Rs. ’000 Rs. ’000 Rs. ’000 Rs. ’000
i. Held-for-trading (HFT) – – – – – – ii. Held-to-maturity (HTM) – – – – – – iii. Loans & receivables (L&R)
Trade & other receivables 2,086,115 1,809,028 3,151,623 1,654,001 1,585,934 3,094,359 Cash and cash equivalents 682,078 317,090 1,871,046 615,156 178,996 1,801,370 iv. Available-for-sales (AFS)
Financial assets available-for-sale 5,077 3,690 5,295 5,054 3,663 5,256
Total financial assets 2,773,270 2,129,808 5,027,964 2,274,211 1,768,593 4,900,985
In accordance with the LKAS 39 ‘Financial Instrument Recognition and Measurement’ financial liabilities have been classified as follows.
Group Company
As at 31.03.2013 31.03.2012 01.04.2011 31.03.2013 31.03.2012 01.04.2011Rs. ’000 Rs. ’000 Rs. ’000 Rs. ’000 Rs. ’000 Rs. ’000
i. Held-for-trading (HFT) – – – – – – ii. At amortised cost
Current portion of long-term borrowings 229,960 229,960 93,015 229,960 229,960 93,015 Long-term borrowings 540,243 770,203 316,830 540,243 770,203 316,830 Short-term borrowings 2,647,597 4,045,666 2,658,621 2,518,226 3,970,625 2,647,224 Trade payables 843,044 1,487,608 1,558,804 792,718 1,446,635 1,500,568
Total financial liabilities 4,260,844 6,533,437 4,627,270 4,081,147 6,417,423 4,557,637
Notes to the Financial Statements

100
Financial Reports
D I E S E L & M O T O R E N G I N E E R I N G P L C
A N N U A L R E P O RT 2 0 1 2 / 1 3
16. Property, Plant & Equipment
FreeholdLand
Buildingsand
Premises
LeaseholdBuildings
andPremises
Plant andMachinery
Tools andImplements
MotorVehicles
LeasedMotor
Vehicles
ComputerHardware
andSoftware
ElectricalFixtures,
Fittingsand OfficeEquipment
Total as at
31.03.2013 31.03.2012 01.04.2011Rs. ’000 Rs. ’000 Rs. ’000 Rs. ’000 Rs. ’000 Rs. ’000 Rs. ’000 Rs. ’000 Rs. ’000 Rs. ’000 Rs. ’000 Rs. ’000
a. Group Cost or Revalued AmountOpening balance 3,298,110 671,197 22,423 312,978 162,800 363,977 – 178,275 232,234 5,241,994 3,703,757 2,740,467 Revaluation – – – – – – – – – – 879,140 – Additions 98,748 33,291 52,461 136,717 15,550 67,982 – 15,129 23,832 443,710 790,622 1,044,628 Transferred from capital work-in-progress – 491 48,166 1,954 1,237 – – – 13,510 65,358 – – Disposals – (3,151) – (3,523) (205) (32,139) – (2,406) (588) (42,012) (131,525) (81,338)
Closing balance 3,396,858 701,828 123,050 448,126 179,382 399,820 – 190,998 268,988 5,709,050 5,241,994 3,703,757
DepreciationOpening balance – 106,389 12,798 112,516 126,021 162,385 – 110,544 109,808 740,461 643,718 602,720 Charge for the year – 16,623 3,203 22,389 13,507 70,949 – 23,185 17,529 167,385 135,164 93,100 On disposals – (1,723) – (370) (205) (18,752) – (2,401) (588) (24,039) (38,421) (52,102)
Closing balance – 121,289 16,001 134,535 139,323 214,582 – 131,328 126,749 883,807 740,461 643,718
Carrying amount before capital work-in- progress 3,396,858 580,539 107,049 313,591 40,059 185,238 – 59,670 142,239 4,825,243 4,501,533 3,060,039
Capital work-in-progress at cost Opening balance – 71,271 65,181 1,954 1,237 – – – 17,098 156,741 – – Additions – 568,105 76,545 – – – – 908 5,185 650,743 156,741 – Transferred to PPE – (491) (48,166) (1,954) (1,237) – – (13,510) (65,358) – – Closing balance – 638,885 93,560 – – – – 908 8,773 742,126 156,741 –
Carrying amount as at 31st March 2013 3,396,858 1,219,424 200,609 313,591 40,059 185,238 – 60,578 151,012 5,567,369 – –
Carrying amount as at 31st March 2012 3,298,110 636,079 74,806 202,416 38,016 201,592 – 67,731 139,524 – 4,658,274 –
Carrying amount as at 1st April 2011 2,015,808 521,743 13,253 205,909 32,158 132,604 795 50,308 87,461 – – 3,060,039
FreeholdLand
Buildingsand
Premises
LeaseholdBuildings
andPremises
Plant andMachinery
Tools andImplements
MotorVehicles
LeasedMotor
Vehicles
ComputerHardware
andSoftware
ElectricalFixtures,
Fittingsand OfficeEquipment
Total as at
31.03.2013 31.03.2012 01.04.2011Rs. ’000 Rs. ’000 Rs. ’000 Rs. ’000 Rs. ’000 Rs. ’000 Rs. ’000 Rs. ’000 Rs. ’000 Rs. ’000 Rs. ’000 Rs. ’000
b. Company Cost or Revalued AmountOpening balance 3,298,110 667,859 22,423 281,612 147,913 360,402 – 161,531 217,751 5,157,601 3,628,072 2,639,437 Revaluation – – – – – – – – – – 879,140 – Additions 98,748 33,291 52,461 129,016 10,152 67,982 – 13,017 22,844 427,511 781,806 1,034,741 Transferred from capital work-in-progress – 491 48,166 1,954 1,237 – – – 13,510 65,358 – – Disposals – (1,428) – (20) (205) (32,139) – (1,815) (586) (36,193) (131,417) (46,106)
Closing balance 3,396,858 700,213 123,050 412,562 159,097 396,245 – 172,733 253,519 5,614,277 5,157,601 3,628,072
DepreciationOpening balance – 104,366 12,798 102,420 112,351 160,562 – 99,168 101,923 693,588 602,045 559,814 Charge for the year – 16,582 3,203 20,140 12,632 70,365 – 21,341 16,402 160,665 129,855 85,853 On disposals – – – (10) (205) (18,752) – (1,810) (586) (21,363) (38,312) (43,622)
Closing balance – 120,948 16,001 122,550 124,778 212,175 – 118,699 117,739 832,890 693,588 602,045
Carrying amount before capital work-in-progress 3,396,858 579,265 107,049 290,012 34,319 184,070 – 54,034 135,780 4,781,387 4,464,013 3,026,027
Capital work-in-progress at cost Opening balance – 71,271 65,181 1,954 1,237 – – – 17,098 156,741 – – Additions – 568,105 76,545 – – – – 908 5,185 650,743 156,741 – Transferred to PPE – (491) (48,166) (1,954) (1,237) – – – (13,510) (65,358) – –
Closing balance – 638,885 93,560 – – – – 908 8,773 742,126 156,741 –
Carrying amount as at 31st March 2013 3,396,858 1,218,150 200,609 290,012 34,319 184,070 – 54,942 144,553 5,523,513 – – Carrying amount as at 31st March 2012 3,298,110 634,764 74,806 181,146 36,799 199,840 – 62,363 132,926 – 4,620,754 –
Carrying amount as at 1st April 2011 2,015,808 520,388 13,253 187,270 30,597 130,245 795 47,528 80,143 – – 3,026,027
Notes to the Financial Statements

101
Financial Reports
D I E S E L & M O T O R E N G I N E E R I N G P L C
A N N U A L R E P O RT 2 0 1 2 / 1 3
Notes:
16.a Revaluation of Freehold LandFreehold land was revalued as at 30th September 2011 by Mr. K. Arthur Perera, A.M.I.V. (Sri Lanka) who is a professionally qualified independent valuer. The revaluation was carried out by taking into account the observable prices in active market or recent market transactions on arm’s length terms. The revaluation surplus, amounting to Rs. 879.14 mn was credited to the capital reserve account during the year 2011/12.
The valuation of the freehold land has been written up to correspond with the market value and the details are as follows:
Freehold Land
Location Extent OriginalCost
Rs. ’000
Revalued
Rs. ’000
RevaluedAmount as
No. of Times of Cost
FreeholdBuilding
Square Feet
Pledged Mortgagedto
No. 65, Jetawana Road, Colombo 14 and No. 56, K. Cyril C. Perera Mawatha, Colombo 14 2A-0R-33.29P 414 1,349,135 3,258.78 65,605 – – No. 61, Jetawana Road, Colombo 14 0A-1R-04.00P 18,014 220,000 12.21 8,423 – –
No. 74, Jetawana Road, Colombo 14 0A-1R-14.56P 113,808 252,640 2.22 4,042 √ Hatton National
BankNo. 800, Sirimawo Bandaranaike Mawatha,Colombo 14 3A-3R-14.00P 641,519 659,388 1.03 – – –
No. 135, Mahena Road, Siyambalape 7A-3R-05.90P 16,483 222,660 13.51 96,300 √ Hatton National
Bank
Kirindiwela Road, Weliweriya 16A-0R-36.31P 89,958 191,125 2.12 213,925 √ Commercial
BankNo.360, Madampitiya Road, Mahawatta, Colombo 14 1A-2R-26.80P 301,599 301,599* – – – – No. 09, Ariyala, Kandy Road, Jaffna 1A-2R-26.72P 32,487 32,487* – – – – Yaggapitiya Watta, Dambulla Road, Kurunegala 5A-0R-0P 54,599 54,599* – – – – No. 274/A, Kakunagaha Watta, Siyambalape. 1A-0R-14.00P 21,123 21,123* – – – – No. 23, Kaldemulla Road, Moratuwa. 0A-3R-27.04P 92,102 92,102* – 18,274 – –
Total 1,382,106 3,396,858 406,569
* These freehold lands were acquired subsequent to the last revaluation done and therefore, the original cost is shown under the ‘Revalued’ column.
16.b Fully Depreciated but still in UseProperty, plant & equipment with cost of Rs. 433 mn (2012 - Rs. 400 mn) have been fully depreciated and continue to be used by the Group. The cost of fully-depreciated assets of the Company amounted to Rs. 403 mn (2012 - Rs. 373 mn).
16.c Property, Plant & Equipment Pledged as Security against Long-Term Bank LoanLand and buildings with a carrying value of Rs. 666 mn (2012 - Rs. 666 mn) have been pledged as security against term loans obtained.
16.d Permanent Fall in Value of Property, Plant & EquipmentThere is no permanent fall in the value of property, plant & equipment which require a provision for impairment.
16.e Title Restriction on Property, Plant & EquipmentThere were no restrictions that existed on the title to the property, plant & equipment of the Group as at reporting date.
Notes to the Financial Statements

102
Financial Reports
D I E S E L & M O T O R E N G I N E E R I N G P L C
A N N U A L R E P O RT 2 0 1 2 / 1 3
17. Lease Rentals Paid in Advance
Group Company
As at 31.03.2013 31.03.2012 01.04.2011 31.03.2013 31.03.2012 01.04.2011Rs. ’000 Rs. ’000 Rs. ’000 Rs. ’000 Rs. ’000 Rs. ’000
Cost
Opening balance (Note 17.1) 39,938 39,938 2,400 39,938 39,938 2,400 Additions during the year – – 37,538 – – 37,538
Closing balance 39,938 39,938 39,938 39,938 39,938 39,938
Accumulated Amortisation
Opening balance 4,387 2,182 1,040 4,387 2,182 1,040 Amortisation for the year 2,205 2,205 1,142 2,205 2,205 1,142
Closing balance 6,592 4,387 2,182 6,592 4,387 2,182
Carrying amount at the end of the year 33,346 35,551 37,756 33,346 35,551 37,756
17.1 Details of Lease Rentals Paid in AdvanceLocation Amount of
leaseRs. ’000
Duration of the lease
i. No. 562/126, D.S. Senanayake Mawatha, Anuradhapura 2,400 From April 1997 to August 2021ii. No. 562/100, Jayanthi Mawatha, Anuradhapura 37,538 From October 2010 to May 2028
39,938
18. Intangible AssetsGroup Company
As at 31.03.2013 31.03.2012 01.04.2011 31.03.2013 31.03.2012 01.04.2011Rs. ’000 Rs. ’000 Rs. ’000 Rs. ’000 Rs. ’000 Rs. ’000
Cost
Opening balance 6,344 2,808 2,808 6,344 2,808 2,808 *Additions during the year – 3,536 – – 3,536 – Closing balance 6,344 6,344 2,808 6,344 6,344 2,808
Accumulated Amortisation
Opening balance 3,265 2,106 1,463 3,265 2,106 1,463 Amortisation for the year 943 1,159 643 943 1,159 643
Closing balance 4,208 3,265 2,106 4,208 3,265 2,106
Carrying amount at the end of the year 2,136 3,079 702 2,136 3,079 702
*Additions consist of Rs. 3.5 mn invested on upgrading human resource information system software during 2011/12.
18.1 Assessment of ImpairmentComputer software purchase cost has been classified as an intangible asset. No provision for impairment is required to be made in the Financial Statements as at the year-end.
Notes to the Financial Statements

103
Financial Reports
D I E S E L & M O T O R E N G I N E E R I N G P L C
A N N U A L R E P O RT 2 0 1 2 / 1 3
19. Investment in SubsidiariesCompany
As at Percentage of 31.03.2013 31.03.2012 01.04.2011Holding (%) Rs. ’000 Rs. ’000 Rs. ’000
Unquoted Investment - Ordinary Shares
Dimo (Pvt) Ltd. - 25,000 ordinary shares 100 250 250 250Dimo Industries (Pvt) Ltd. - 2,305,000 ordinary shares 100 23,050 23,050 23,050Dimo Travels (Pvt) Ltd. - 500 ordinary shares 100 50 50 50
23,350 23,350 23,350
Impairment provision (Note 19.1) (12,205) (12,205) (15,000)
11,145 11,145 8,350
19.1 Provision for Impairment of Investments in Subsidiaries
Company
As at 31.03.2013 31.03.2012 01.04.2011Rs. ’000 Rs. ’000 Rs. ’000
Opening balance 12,205 15,000 – Provision/(reversal) for/of impairment – (2,795) 15,000
Closing balance 12,205 12,205 15,000
An impairment assessment was carried out as at 31st March 2013 and it was concluded that net realisable value of all the investments included under unquoted investments exceed over its carrying value except for Dimo Industries (Pvt) Ltd. Based on an assessment made for impairment a loss of Rs. 12.2 mn (2011/12 - Rs. 12.2 mn) was recorded in the Financial Statements of the Company in relation to the investment in Dimo Industries (Pvt) Ltd. which was considered adequate amount as at reporting date. However, the management has implemented a revitalisation plan for Dimo Industries (Pvt) Ltd. and commenced tyre trading activities with effect from 1st April 2013.
20. Financial Asset Available-for-Sale
Group Company
No. ofShares
Market Value
(Per Share)
Total Cost
Fair Value
No. ofShares
Market Value
(Per Share)
Total Cost
Fair Value
As at 31.03.2013 31.03.2013 31.03.2012 01.04.2011 31.03.2013 31.03.2013 31.03.2012 01.04.2011Rs. ’000 Rs. ’000 Rs. ’000 Rs. ’000 Rs. ’000 Rs. ’000 Rs. ’000 Rs. ’000
Quoted Investments
Ordinary Shares
Hunas Falls Hotels PLC 900 52.50 14 47 54 78 450 52.50 7 24 27 39 Hatton National Bank PLC (non-voting) 33,943 131.80 700 4,474 3,119 4,709 33,943 131.80 700 4,474 3,119 4,709 Ceylinco Insurance PLC (non-voting) 1,700 327.20 298 556 517 508 1,700 327.20 298 556 517 508
1,012 5,077 3,690 5,295 1,005 5,054 3,663 5,256
20.1 Review of Market RiskFinancial assets available-for-sale represent investments in shares of quoted companies. Therefore, the value of these investments is subjected to the performance of investee company and the factors that effects the status of the stock market. Sensitivity analysis on the value of the investments is not provided as it is deemed to be not material.
Notes to the Financial Statements

104
Financial Reports
D I E S E L & M O T O R E N G I N E E R I N G P L C
A N N U A L R E P O RT 2 0 1 2 / 1 3
21. InventoriesGroup Company
As at 31.03.2013 31.03.2012 01.04.2011 31.03.2013 31.03.2012 01.04.2011Rs. ’000 Rs. ’000 Rs. ’000 Rs. ’000 Rs. ’000 Rs. ’000
Stock-in-trade (at cost) 3,930,259 7,078,120 2,111,435 3,895,507 7,053,690 2,070,522 Work-in-progress (at cost) 106,467 92,336 45,889 52,708 54,381 22,690 Provision for slow moving inventories (340,028) (208,968) (108,979) (328,375) (205,782) (100,690)
3,696,698 6,961,488 2,048,345 3,619,840 6,902,289 1,992,522 Goods-in-transit 445,208 1,189,547 435,613 435,718 1,173,578 426,993
Total inventories at the lower of cost and net realisable value 4,141,906 8,151,035 2,483,958 4,055,558 8,075,867 2,419,515
22. Trade and Other Receivables
Group Company
As at 31.03.2013 31.03.2012 01.04.2011 31.03.2013 31.03.2012 01.04.2011Rs. ’000 Rs. ’000 Rs. ’000 Rs. ’000 Rs. ’000 Rs. ’000
Trade receivables 2,329,280 2,196,274 3,375,558 1,868,141 1,924,220 3,266,457 Impairment provision (261,952) (404,492) (238,141) (232,800) (355,467) (186,171)
2,067,328 1,791,782 3,137,417 1,635,341 1,568,753 3,080,286 Other receivables 18,787 17,246 14,206 18,660 17,181 14,073
Carrying value of trade and other receivables 2,086,115 1,809,028 3,151,623 1,654,001 1,585,934 3,094,359
22.1 Age Analysis of Trade Receivables after Impairment ProvisionGroup Company
As at 31.03.2013 31.03.2012 31.03.2013 31.03.2012Rs. ’000 Rs. ’000 Rs. ’000 Rs. ’000
Not yet due 1,446,388 1,267,493 1,177,492 1,098,555Between 61 days to - 180 days 368,730 398,082 287,861 342,384
Between 181 days to - 365 days 163,544 124,614 101,672 113,556Over 365 days 88,666 1,593 68,316 14,258
Net trade receivables 2,067,328 1,791,782 1,635,341 1,568,753
Impairment provision 261,952 404,492 232,800 355,467
Gross trade receivables 2,329,280 2,196,274 1,868,141 1,924,220
22.2 Trade debtors jointly with inventories are pledged as security for short-term borrowings up to a limit of Rs. 95 mn (2011/12 - Rs. 95 mn).
22.3 Terms of Trade and Other Receivables Trade and other receivables are non-interest-bearing and are expected to be received before 60 days.
22.4 Review of Credit Risk The Company extends credit facilities to customers during the course of business. Therefore, non-payment of trade debts is a key risk associated with trade receivables. The Company has taken several measures to manage and mitigate the credit risk including carrying out a credit evaluation as per the Group credit policy, prior to extending credit. A review of age analysis of trade debtors and follow-up meetings are carried out by the business unit managers at least once a month and by the Group Management Committee (GMC) at least once a quarter. In the event of a debt becoming doubtful, legal action is initiated by the Manager - Legal.
Notes to the Financial Statements

105
Financial Reports
D I E S E L & M O T O R E N G I N E E R I N G P L C
A N N U A L R E P O RT 2 0 1 2 / 1 3
23. Other Current AssetsGroup Company
As at 31.03.2013 31.03.2012 01.04.2011 31.03.2013 31.03.2012 01.04.2011Rs. ’000 Rs. ’000 Rs. ’000 Rs. ’000 Rs. ’000 Rs. ’000
Deposits and prepayments 198,410 159,426 137,033 171,424 136,751 121,705 Other receivables 5,779 100,204 15,378 4,457 94,012 9,955
204,189 259,630 152,411 175,881 230,763 131,660
24. Cash and Cash EquivalentsGroup Company
As at 31.03.2013 31.03.2012 01.04.2011 31.03.2013 31.03.2012 01.04.2011Rs. ’000 Rs. ’000 Rs. ’000 Rs. ’000 Rs. ’000 Rs. ’000
Bank balances 225,859 297,973 310,781 159,998 160,480 241,706 Investment in treasury bills – – 1,549,133 – – 1,549,133 Investment in fixed deposits 436,366 – – 436,366 – –Cash in hand 19,853 19,117 11,132 18,792 18,516 10,531
682,078 317,090 1,871,046 615,156 178,996 1,801,370
24.1 Review of Credit & Interest Rate Risks
The Group’s cash and cash equivalents comprise of bank balances and fixed deposits which are invested in commercial banks and does not bear a credit risk. Fixed deposits have been placed with the maturity period less than three months and carrying a fixed rate of interest. Investments in Treasury bills/fixed deposits are made for varying periods of between one week to three months.
25. Stated Capital
Group/Company
As at 31.03.2013 31.03.2012 01.04.2011
No. ofShares Rs. ’000
No. ofShares Rs. ’000
No. ofShares Rs. ’000
Ordinary Shares
Issued and Fully-paid Ordinary Shares
Opening balance 8,876,437 425,297 8,702,389 182,500 8,702,389 182,500 Scrip dividend during the year* – – 174,048 242,797 – –
Closing balance 8,876,437 425,297 8,876,437 425,297 8,702,389 182,500
* The increase in stated capital represents the scrip dividends declared in May 2011.
26. Revenue ReserveGroup Company
As at 31.03.2013 31.03.2012 31.03.2013 31.03.2012Rs. ’000 Rs. ’000 Rs. ’000 Rs. ’000
Opening balance 5,000,566 2,876,865 4,616,945 2,623,573Dividend (244,102) (554,777) (244,102) (554,777)Total comprehensive income
Profit for the year 433,354 2,680,083 327,076 2,549,742
Other comprehensive income 1,300 (1,605) 1,304 (1,593)
Closing balance 5,191,118 5,000,566 4,701,223 4,616,945
Notes to the Financial Statements

106
Financial Reports
D I E S E L & M O T O R E N G I N E E R I N G P L C
A N N U A L R E P O RT 2 0 1 2 / 1 3
27. Employee BenefitsGroup Company
As at 31.03.2013 31.03.2012 01.04.2011 31.03.2013 31.03.2012 01.04.2011Rs. ’000 Rs. ’000 Rs. ’000 Rs. ’000 Rs. ’000 Rs. ’000
Present value of unfunded obligation 287,046 224,434 182,327 273,471 216,824 173,713
Opening balance 224,434 182,327 142,138 216,824 173,713 132,607 Current service cost 19,745 15,375 13,058 17,908 14,257 11,674 Interest cost 23,566 19,144 15,626 22,767 18,240 14,586 Actuarial loss/(gain) 28,796 21,568 28,983 24,748 24,159 29,691
Total charge for the year 72,107 56,087 57,667 65,423 56,656 55,951
Paid during the year (9,495) (13,980) (17,478) (8,776) (13,545) (14,845)
Closing balance 287,046 224,434 182,327 273,471 216,824 173,713
An actuarial valuation for defined benefit obligation was carried out as at 31st March 2013 by Mr. M. Poopalanathan, AIA, of Messrs Actuarial and Management Consultants (Pvt) Ltd., a firm of professional actuaries. The valuation method used by the actuaries to value the obligation is the ‘Projected Unit Credit Method’, a method recommended by the Sri Lanka Accounting Standard - LKAS 19 on ‘Employee Benefits’.
The following assumptions and data were used in valuing the defined benefit obligation by the actuarial valuer:
31.03.2013 31.03.2012% %
Rate of discount 10.50 10.50Salary escalation rate 10.00 10.00
Assumptions regarding future mortality are based on a 67/70 mortality table, issued by the Institute of Actuaries, London.
Normal retirement age of an executive employee is assumed to be 60 years while a non-executive employee is assumed to retire at the age of 55 years.
The current service cost for the year under review is included under Administration Expenses.
However, according to the Payment of Gratuity Act No. 12 of 1983, the liability for gratuity to an employee arises only on completion of five years of continuous service. The liability as required by the Payment of Gratuity Act for the Group and the Company as at 31st March 2013 amounted to Rs. 277.2 mn and Rs. 264.1 mn respectively.
28. Deferred Tax Assets/(Liabilities)Group Company
As at 31.03.2013 31.03.2012 01.04.2011 31.03.2013 31.03.2012 01.04.2011Rs. ’000 Rs. ’000 Rs. ’000 Rs. ’000 Rs. ’000 Rs. ’000
Summary of net deferred tax assets/(liabilities)
Opening balance (28,357) (58,157) (28,137) (27,252) (57,155) (36,078) (Origination)/reversal of temporary differences 42,715 29,800 (30,020) 41,853 29,903 (21,077)
Closing balance (Note 28.1) 14,358 (28,357) (58,157) 14,601 (27,252) (57,155)
Notes to the Financial Statements

107
Financial Reports
D I E S E L & M O T O R E N G I N E E R I N G P L C
A N N U A L R E P O RT 2 0 1 2 / 1 3
28.1 Reconciliation of Deferred Tax Assets and LiabilitiesGroup Company
As at 31.03.2013 31.03.2012 01.04.2011 31.03.2013 31.03.2012 01.04.2011Rs. ’000 Rs. ’000 Rs. ’000 Rs. ’000 Rs. ’000 Rs. ’000
Deferred Tax Liability
Temporary difference arising from property, plant & equipment (345,444) (325,708) (390,030) (330,999) (314,154) (377,839)
Total temporary difference of deferred tax liability (345,444) (325,708) (390,030) (330,999) (314,154) (377,839)
Closing deferred tax liability @ 28% (96,724) (91,198) (109,209) (92,679) (87,963) (105,795)
Group Company
As at 31.03.2013 31.03.2012 01.04.2011 31.03.2013 31.03.2012 01.04.2011Rs. ’000 Rs. ’000 Rs. ’000 Rs. ’000 Rs. ’000 Rs. ’000
Deferred Tax Assets
Temporary difference arising from defined benefit obligations 287,048 224,433 182,327 273,470 216,824 173,713Temporary difference arising from deferred free service income and warranty provision 109,674 – – 109,674 – –
Total temporary difference of deferred tax asset 396,722 224,433 182,327 383,144 216,824 173,713
Closing deferred tax assets @ 28% 111,082 62,841 51,052 107,280 60,711 48,640
Net temporary differences 51,278 (101,275) (207,703) 52,145 (97,330) (204,126)
Net deferred tax liability/(asset) 14,358 (28,357) (58,157) 14,601 (27,252) (57,155)
28.2 Movement in Deferred Tax Assets and Liabilities during the YearGroup Company
Balance as at
01.04.2012
Recognised in Income Statement
Balance as at
31.03.2013
Balance as at
01.04.2012
Recognised in Income Statement
Balance as at
31.03.2013Rs. ’000 Rs. ’000 Rs. ’000 Rs. ’000 Rs. ’000 Rs. ’000
Property, plant & equipment - Deferred tax liability (91,198) (5,526) (96,724) (87,963) (4,717) (92,680)
Retirement benefit obligation - Deferred tax asset 62,841 17,532 80,373 60,711 15,861 76,572
Deferred free service and warranty provision - Deferred tax assets – 30,709 30,709 – 30,709 30,709
(28,357) 42,715 14,358 (27,252) 41,853 14,601
28.3 Unrecognised Deferred Tax AssetsIncome tax loss of Rs. 10.5 mn (2012 - Rs. 10.5 mn) in respect of Dimo Industries (Pvt) Ltd. has not been recognised as a deferred tax asset as it is not probable that future taxable profits will be available against which the Company can utilise the benefit therefrom.
Notes to the Financial Statements

108
Financial Reports
D I E S E L & M O T O R E N G I N E E R I N G P L C
A N N U A L R E P O RT 2 0 1 2 / 1 3
29. Long-Term BorrowingsGroup Company
As at 31.03.2013Rs. ’000
31.03.2012Rs. ’000
01.04.2011Rs. ’000
31.03.2013Rs. ’000
31.03.2012Rs. ’000
01.04.2011Rs. ’000
a. Non-current portion of the long-term borrowings
Term loans (Note 29.1) 540,243 770,203 316,830 540,243 770,203 316,830
Total non-current long-term borrowings 540,243 770,203 316,830 540,243 770,203 316,830
b. Current portion of the long-term borrowings
Term loans (Note 29.1) 229,960 229,960 91,927 229,960 229,960 91,927 Finance lease obligations (Note 29.4) – – 1,088 – – 1,088
Total current portion of long-term borrowings 229,960 229,960 93,015 229,960 229,960 93,015
29.1 Movement and Classification of Long-Term BorrowingsGroup Company
As at 31.03.2013Rs. ’000
31.03.2012Rs. ’000
01.04.2011Rs. ’000
31.03.2013Rs. ’000
31.03.2012Rs. ’000
01.04.2011Rs. ’000
Opening balance 1,000,163 408,757 662,883 1,000,163 408,757 662,883 Loans obtained during the year – 750,000 – – 750,000 – Repayments during the year (229,960) (158,594) (254,126) (229,960) (158,594) (254,126)
Closing balance 770,203 1,000,163 408,757 770,203 1,000,163 408,757 Classified as current liabilities (repayable within one year) 229,960 229,960 91,927 229,960 229,960 91,927
Classified as long-term loans (repayable after one year) 540,243 770,203 316,830 540,243 770,203 316,830
29.2 Principal Amounts of Long-Term Borrowings Company
Lender31.03.2013
Rs. ’000 31.03.2012
Rs. ’000
Balance Outstanding as at
31.03. 2013
Secured Repayments Tenure
Commercial Bank of Ceylon PLC 400,000 400,000 196,870 √ Repayable in 120 Installments commenced from February 2008Hatton National Bank PLC 200,000 200,000 40,000 √ Repayable in 60 Installments commenced from March 2009DFCC Bank 250,000 250,000 158,333 Repayable in 60 Installments commenced from June 2011Bank of Ceylon 500,000 500,000 375,000 Repayable in 60 Installments commenced from January 2012
Total 1,350,000 1,350,000 770,203
Details of land which were pledged against above bank loan facilities are disclosed in Note 16 (a).
Notes to the Financial Statements

109
Financial Reports
D I E S E L & M O T O R E N G I N E E R I N G P L C
A N N U A L R E P O RT 2 0 1 2 / 1 3
29.3 Analysis of Long-Term Borrowings by the year of Repayment
CommercialBank of
Ceylon PLCRs. ’000
Hatton National
Bank PLCRs. ’000
DFCCBank
Rs. ’000
Bank of Ceylon
Rs. ’000
Total 31.03.2013
Rs. ’000
Total 31.03.2012
Rs. ’000
Movement of Loans
Balance at the beginning of the year 236,830 80,000 208,333 475,000 1,000,163 408,757 Loans obtained during the year – – – – – 750,000 Repayments during the year (39,960) (40,000) (50,000) (100,000) (229,960) (158,594)
Balance at the end of the year 196,870 40,000 158,333 375,000 770,203 1,000,163
Analysis of Long-Term Borrowings by Period of Repayment
Long-term loans repayable within 6 months from year end 19,980 20,000 25,000 50,000 114,980 114,980 Long-term loans repayable between 6 months and 1 year 19,980 20,000 25,000 50,000 114,980 114,980 Long-term loans repayable between 2 and 5 years from year end 156,910 – 108,333 275,000 540,243 733,173 Long-term loans repayable later than 5 years from year end – – – – – 37,030
196,870 40,000 158,333 375,000 770,203 1,000,163
29.4 Finance Lease ObligationsGroup Company
As at 31.03.2013Rs. ’000
31.03.2012Rs. ’000
01.04.2011Rs. ’000
31.03.2013Rs. ’000
31.03.2012Rs. ’000
01.04.2011Rs. ’000
Opening balance of gross lease obligations – 1,524 3,223 – 1,524 3,223 Payments during the year – (1,524) (1,699) – (1,524) (1,699)
Closing balance of gross lease obligation – – 1,524 – – 1,524 Interest in suspense – – (436) – – (436)
Lease obligations net of interest – – 1,088 – – 1,088
The Group has a centralised treasury function to manage its financial risk. All the debts of the Group are denominated in the functional currency which is Sri Lankan Rupees.
The borrowings of the Company carry variable interest rate (excluding the balance of Rs. 158.33 mn). Hence, the Company is exposed to the interest rate risk. 1% increase/(decrease) in interest rate would cause an increase/(decrease) in the expense by +/- Rs. 7.7 mn per annum.
30. Deferred IncomeGroup Company
As at 31.03.2013Rs. ’000
31.03.2012Rs. ’000
01.04.2011Rs. ’000
31.03.2013Rs. ’000
31.03.2012Rs. ’000
01.04.2011Rs. ’000
Opening balance 179,769 91,658 30,650 147,809 91,657 30,114 Income deferred during the year 148,528 349,797 296,199 90,211 317,838 296,199 Income amortised during the year (187,985) (261,686) (235,191) (160,709) (261,686) (234,656)
Closing balance 140,312 179,769 91,658 77,311 147,809 91,657
Notes to the Financial Statements

110
Financial Reports
D I E S E L & M O T O R E N G I N E E R I N G P L C
A N N U A L R E P O RT 2 0 1 2 / 1 3
31. Trade PayablesGroup Company
As at 31.03.2013Rs. ’000
31.03.2012Rs. ’000
01.04.2011Rs. ’000
31.03.2013Rs. ’000
31.03.2012Rs. ’000
01.04.2011Rs. ’000
Trade payables 843,044 1,487,608 1,558,804 792,718 1,446,635 1,500,568
31.1 Review of Liquidity Risk Trade payables are non-interest-bearing and have settlement periods less than 90 days. The quick assets ratio of the Company as at the year-end was 0.72:1 (in 2011/12 - 0.36:1). As a liquidity risk management measure, the entities continually compare trade payables with receivables, cash and cash equivalents and unutilised backing facilities.
The trade payables of the Group include an amount of Rs. 445.21 million as bills payable corresponding to goods shipped but not received (Goods-in-Transit). At the time of settlement of such bills, entities will obtain short-term loans to cover the working capital cycle period of the imports.
Unutilised banking facilities are given in Note 34.
32. Other Current LiabilitiesGroup Company
As at 31.03.2013Rs. ’000
31.03.2012Rs. ’000
01.04.2011Rs. ’000
31.03.2013Rs. ’000
31.03.2012Rs. ’000
01.04.2011Rs. ’000
Advances received 124,185 232,617 96,898 124,185 232,617 96,898 Interest payable 8,035 13,675 9,914 8,035 13,675 9,914 Unclaimed dividend 6,503 3,493 2,289 6,503 3,493 2,289 Value Added Tax (VAT)/Turnover Tax payable 10,583 – 64,818 5,269 – 64,889 Other payables and accrued expenses 334,980 452,704 435,035 318,262 426,016 409,248
484,286 702,489 608,954 462,254 675,801 583,238
32.1 Terms of Settlement of Other Current LiabilitiesOther current liabilities excluding advances received are non-interest bearing and are payable within three months excluding unclaimed dividends. Advances received are also non-interest bearing and are expected to be set-off within three months.
Notes to the Financial Statements

111
Financial Reports
D I E S E L & M O T O R E N G I N E E R I N G P L C
A N N U A L R E P O RT 2 0 1 2 / 1 3
33. Current Tax Asset/(Liability)Group Company
As at 31.03.2013Rs. ’000
31.03.2012Rs. ’000
01.04.2011Rs. ’000
31.03.2013Rs. ’000
31.03.2012Rs. ’000
01.04.2011Rs. ’000
Opening balance 128,276 999,487 5,304 105,032 1,006,205 (10,183)Current income tax for the year (Note 12) 70,586 1,052,670 1,244,208 21,610 1,001,124 1,243,703
198,862 2,052,157 1,249,512 126,642 2,007,329 1,233,520
Tax paid during the year: Economic Service Charge – 129,525 126,707 – 120,000 121,227 Income tax, Social Responsibility Levy (SRL) & WHT 265,943 1,791,306 123,318 228,818 1,782,115 106,088 Payments/adjustments pertaining to previous year – 3,050 – – 182 –
265,943 1,923,881 250,025 228,818 1,902,297 227,315
Current tax asset/(liability) 67,081 (128,276) (999,487) 102,176 (105,032) (1,006,205)
Made up as follows:
Current tax asset 103,550 1,374 7,983 102,176 – – Current tax liability (36,469) (129,650) (1,007,470) – (105,032) (1,006,205)
67,081 (128,276) (999,487) 102,176 (105,032) (1,006,205)
34. Short-Term BorrowingsGroup Company
As at 31.03.2013Rs. ’000
31.03.2012Rs. ’000
01.04.2011Rs. ’000
31.03.2013Rs. ’000
31.03.2012Rs. ’000
01.04.2011Rs. ’000
Short-term bank loans 2,284,352 3,728,542 2,588,594 2,204,731 3,698,892 2,588,594 Bank overdrafts 363,245 317,124 70,027 313,495 271,733 58,630
2,647,597 4,045,666 2,658,621 2,518,226 3,970,625 2,647,224
Unutilised bank facilities as at 31st March 2013 amounted to Rs. 9,233 mn (2012 - Rs. 6,564 mn).
Short-term bank loans are repayable within the period of six months and details of inventories and book debts which were pledged against above short-term loan facilities are disclosed in Note 22.2.
35. Related Party DisclosuresThe Company carried out transactions in the ordinary course of its business with parties who are defined as related parties as per Sri Lanka Accounting Standard - LKAS 24 on ‘Related Party Disclosures’, the details of which are reported below:
35.1 (a) Transactions with Key Management Personnel (KMPs)According to Sri Lanka Accounting Standard - LKAS 24 on ‘Related Party Disclosures’, Key Management Personnel are those having authority and responsibility for planning, directing and controlling the activities of the entity. Accordingly, the Board of Directors of the Company (Executive and Non-Executive Directors) have been classified as KMPs. As the Company is the ultimate parent of the subsidiaries (listed in Note 1.3), the Board of Directors of the Company has the authority and responsibility for planning or controlling the activities of the Group directly or indirectly. Accordingly, the Board of Directors of the Company (Executive & Non-Executive) are KMPs of the Group.
Officers who are employees of Diesel & Motor Engineering PLC and Directors of the subsidiaries and not of the Company have been classified as KMPs of the respective subsidiary only.
Notes to the Financial Statements

112
Financial Reports
D I E S E L & M O T O R E N G I N E E R I N G P L C
A N N U A L R E P O RT 2 0 1 2 / 1 3
35.1 (b) The Compensation Paid to Key Management Personnel - (KMPs)The Executive Directors are entitled to a structured incentive scheme which is linked to performance.
The Company contributes towards a post-employment contribution plan for the Executive Directors. In addition to their salaries, the Company provides non-cash benefits to KMPs.
There are no share-based payments made to the Directors during the year.
No Loans were granted to KMPs of the Company.
Compensation to Key Management Personnel of the Company are as follows:
Group Company
As at31.03.2013
Rs. ’000 31.03.2012
Rs. ’000 31.03.2013
Rs. ’000 31.03.2012
Rs. ’000
Short-term employment benefits 159,847 100,587 149,827 90,542Post-employment benefits 43,267 41,086 41,011 39,267
Total compensation applicable to key management personnel 203,114 141,673 190,838 129,809
The Company also has an obligation towards a post-employment benefit plan for the Executive Directors. The liability arising from the post-employment obligation has been provided for, based on an actuarial valuation and is covered under Employee Benefits referred to in Note 27 to the Financial Statements.
35.1 (c) Transactions with Close Family Members of KMPsClose family members are defined as spouse or dependant. Dependant is defined as any one who depends on the respective Director for more than 50% of his/her financial needs.
There were no transactions with the close family members during the year.
35.2 Amounts Due to SubsidiariesName of the Company Dimo
(Pvt) Ltd.Dimo
Industries(Pvt) Ltd.
DimoTravels
(Pvt) Ltd.
Shareholding 100%
Rs. ’000
100%
Rs. ’000
100%
Rs. ’000
As at31.03.2013
Rs. ’000
As at31.03.2012
Rs. ’000
As at01.04.2011
Rs. ’000
Opening balance due to subsidiaries (88,852) (9,438) (327) (98,617) (113,705) (13,988)
Sale of goods and services 12,260 – – 12,260 57,173 3,171
Purchase of goods and services (56,387) – – (56,387) (51,012) (94,055)
Expenses incurred on behalf of subsidiaries 64,623 – – 64,623 49,468 35,915
Fund transfers - net (79,041) 50 – (78,991) (40,541) (44,748)
Closing balance due to subsidiaries (147,397) (9,388) (327) (157,112) (98,617) (113,705)
Notes to the Financial Statements

113
Financial Reports
D I E S E L & M O T O R E N G I N E E R I N G P L C
A N N U A L R E P O RT 2 0 1 2 / 1 3
35.3 Transactions with Companies Significantly Influenced by Key Management Personnel (KMP)Mr. A.M. Pandithage who is a Director of the Company is also the Chairman of Hayleys PLC.
The balances due to and due from Hayleys Group as at 31st March 2012 are as follows:
Group
As at31.03.2013
Rs. ’00031.03.2012
Rs. ’000
Balance due to Hayleys Group – –Balances due from Hayleys Group 1,674 208
Transactions during the year with the Hayleys Group:
Group
For the year ended 31st March2013
Rs. ’0002012
Rs. ’000
Goods and services purchased from Hayleys Group 25,681 13,601Goods and services sold to Hayleys Group 42,633 14,502
Terms and Conditions of Transactions with the companies on which KMPs have Significant Influence
Outstanding balances at the year-end relating to the Companies on which KMPs have significant influence are unsecured, interest free, and all related-party dues are on demand. There have been no guarantees provided or received for any related party receivables or payables for the year ended 31st March 2013. The Group has not recorded any impairment of receivables relating to amounts owed by related parties (2011/12 - Rs. Nil).
36. Commitments and Contingencies
36.1 Capital Expenditure CommitmentsCapital expenditure committed by the Board of Directors for which a provision has not been made in the Financial Statements amount to approximately Rs. 2,101.4 mn (2011/12 - Rs. 993.2 mn).
36.2 Contingent LiabilitiesGuarantees
The contingent liabilities as at 31st March 2013 on guarantees given by Diesel & Motor Engineering PLC, in respect of bank guarantees, bid bonds and performance bonds amounted to Rs. 731.7 mn (2011/12 - Rs. 623.0 mn).
36.3 Litigation Against the CompanyThe claims for lawsuits filed against the Company as at 31st March 2013 amount to Rs. 37.9 mn (2012 - Rs. 30.4 mn). Although, there can be no assurance, the Directors believe, based on the information currently available that the ultimate resolution of such lawsuits are not likely to have a material effect on the results of operations, financial position or liquidity. Accordingly, no provision for a liability has been made in the Financial Statements.
37. Events Occurring After the Reporting PeriodSubsequent to the reporting date, the Board of Directors of the Company approved a first & final dividend of Rs. 10.00 per share for the year ended 31st March 2013. Details of the above dividend are disclosed in Note 14.1 to the Financial Statements.
There were no other material events that occurred after the reporting date that require adjustments to or disclosure in the Financial Statements.
38. Transition to New Sri Lanka Accounting Standards (SLASs)As stated in Note 2.1 these are the Company’s first Consolidated Financial Statements prepared in accordance with new Sri Lanka Accounting Standards prefixed both SLFRS and LKAS, promulgated by The Institute of Chartered Accountants of Sri Lanka. The Accounting Policies set out in Notes 2 to 7 have been applied in preparing the Financial Statements for the year ended 31st March 2013, the comparative information presented in these Financial Statements for the year ended
Notes to the Financial Statements

114
Financial Reports
D I E S E L & M O T O R E N G I N E E R I N G P L C
A N N U A L R E P O RT 2 0 1 2 / 1 3
31st March 2012 and in the preparation of an opening Statement of Financial Position as at 1st April 2011. In preparing its opening new SLASs Statement of Financial Position, the Company has adjusted amounts reported previously in Financial Statements prepared in accordance with previous SLASs. An explanation of how the transition from previous SLASs has affected the Company’s Financial Position and financial performance is set out in the following notes:
38.1 Reconciliation of Equity - Group as at 1st April 2011 and 31st March 2012
Group
As at 01.04.2011 31.03.2012
PreviousSLASs
Re-measurement
due to transition to new SLASs
Re- classification
due to transition to new SLASs
New SLASs
PreviousSLASs
Re-measurement
due to transition to new SLASs
Re- classification
due to transition to new SLASs
New SLASs
Note Rs. ’000 Rs. ’000 Rs. ’000 Rs. ’000 Rs. ’000 Rs. ’000 Rs. ’000 Rs. ’000
Assets
Non-Current Assets
Property, plant & equipment 3,060,039 – – 3,060,039 4,658,274 – – 4,658,274Lease rental paid in advance 37,756 – – 37,756 35,551 – – 35,551Intangible assets 702 – – 702 3,079 – – 3,079Financial asset available-for-sale a 1,012 4,283 5,295 1,012 2,678 – 3,690Deferred tax assets – – 51,052 51,052 – – 62,841 62,841
Total non-current assets 3,099,509 4,283 51,052 3,154,844 4,697,916 2,678 62,841 4,763,435
Current AssetsInventories 2,483,958 – – 2,483,958 8,151,035 – – 8,151,035Trade and other receivables b 3,328,428 (24,394) (152,411) 3,151,623 2,078,274 (9,616) (259,630) 1,809,028Other current assets b – – 152,411 152,411 – – 259,630 259,630Cash and cash equivalents i 1,871,046 – – 1,871,046 317,090 – – 317,090
Total current assets 7,683,432 (24,394) – 7,659,038 10,546,399 (9,616) – 10,536,783
Total assets 10,782,941 (20,111) 51,052 10,813,882 15,244,315 (6,938) 62,841 15,300,218
Equity and Liabilities
Equity
Stated capital 182,500 – – 182,500 425,297 – – 425,297Capital reserve 1,135,612 – – 1,135,612 2,014,752 – – 2,014,752Revenue reserves f 2,882,735 (5,870) – 2,876,865 5,025,283 (24,717) – 5,000,566
Total equity attributable to the equity holders of the Company 4,200,847 (5,870) – 4,194,977 7,465,332 (24,717) – 7,440,615
Non-Current Liabilities
Long-term borrowings 316,830 – – 316,830 770,203 – – 770,203Defined benefit obligation 182,327 – – 182,327 224,434 – – 224,434Deferred tax liabilities 58,157 – 51,052 109,209 28,357 – 62,841 91,198Deferred income c 105,899 (14,241) – 91,658 166,151 13,618 – 179,769
Total non-current liabilities 663,213 (14,241) 51,052 700,024 1,189,145 13,618 62,841 1,265,604
Current Liabilities
Trade payables d 2,167,758 – (608,954) 1,558,804 2,190,097 – (702,489) 1,487,608Other current liabilities d – – 608,954 608,954 – – 702,489 702,489Current portion of long-term borrowings 93,015 – – 93,015 229,960 – – 229,960Current tax liabilities 999,487 – – 999,487 124,115 4,161 – 128,276Short-term borrowings 2,658,621 – – 2,658,621 4,045,666 – – 4,045,666
Total current liabilities 5,918,881 – – 5,918,881 6,589,838 4,161 – 6,593,999
Total liabilities 6,582,094 (14,241) 51,052 6,618,905 7,778,983 17,779 62,841 7,859,603
Total equity and liabilities 10,782,941 (20,111) 51,052 10,813,882 15,244,315 (6,938) 62,841 15,300,218
Notes to the Financial Statements

115
Financial Reports
D I E S E L & M O T O R E N G I N E E R I N G P L C
A N N U A L R E P O RT 2 0 1 2 / 1 3
38.2 Reconciliation of Equity - Company as at 1st April 2011 and 31st March 2012Company
As at 01.04.2011 31.03.2012
PreviousSLASs
Re-measurement
due to transition to new SLASs
Re-classification
due to transition to new SLASs
New SLASs
PreviousSLASs
Re-measurement
due to transition to new SLASs
Re-classification
due to transition to new SLASs
New SLASs
Note Rs. ’000 Rs. ’000 Rs. ’000 Rs. ’000 Rs. ’000 Rs. ’000 Rs. ’000 Rs. ’000
Assets
Non-Current Assets
Property, plant & equipment 3,026,027 – – 3,026,027 4,620,754 – – 4,620,754Lease rental paid in advance 37,756 – – 37,756 35,551 – – 35,551Intangible assets 702 – – 702 3,079 – – 3,079Investment in subsidiaries 8,350 – – 8,350 11,145 – – 11,145Financial assets available-for-sale a 1,005 4,251 5,256 1,005 2,658 – 3,663Deferred tax assets – – 48,640 48,640 – – 60,711 60,711
Total non-current assets 3,073,840 4,251 48,640 3,126,731 4,671,534 2,658 60,711 4,734,903
Current Assets
Inventories 2,419,515 2,419,515 8,075,867 – – 8,075,867Trade & other receivables b 3,255,689 (29,670) (131,660) 3,094,359 1,813,722 2,975 (230,763) 1,585,934Other current assets b – – 131,660 131,660 – – 230,763 230,763Cash and cash equivalents i 1,801,370 – – 1,801,370 178,996 – – 178,996
Total current assets 7,476,574 (29,670) – 7,446,904 10,068,585 2,975 – 10,071,560
Total assets 10,550,414 (25,419) 48,640 10,573,635 14,740,119 5,633 60,711 14,806,463
Equity and Liabilities
Equity
Stated capital 182,500 – – 182,500 425,297 – – 425,297Capital reserve 1,135,612 – – 1,135,612 2,014,752 – – 2,014,752Revenue reserves f 2,634,751 (11,178) – 2,623,573 4,634,060 (17,115) – 4,616,945
Total equity attributable to the equity holders of the Company 3,952,863 (11,178) – 3,941,685 7,074,109 (17,115) – 7,056,994
Non-Current Liabilities
Long-term borrowings 316,830 – – 316,830 770,203 – – 770,203Defined benefit obligation 173,713 – – 173,713 216,824 – – 216,824Deferred tax liabilities 57,155 – 48,640 105,795 27,252 – 60,711 87,963Deferred income c 105,898 (14,241) – 91,657 134,191 13,618 – 147,809
Total non-current liabilities 653,596 (14,241) 48,640 687,995 1,148,470 13,618 60,711 1,222,799
Current Liabilities
Trade payables d 2,083,806 – (583,238) 1,500,568 2,122,436 – (675,801) 1,446,635Other current liabilities d – – 583,238 583,238 – – 675,801 675,801Current portion of long-term borrowings 93,015 – – 93,015 229,960 – – 229,960Current tax liabilities 1,006,205 – – 1,006,205 95,902 9,130 – 105,032Short-term borrowings 2,647,224 – – 2,647,224 3,970,625 – – 3,970,625Amounts due to subsidiaries 113,705 – – 113,705 98,617 – – 98,617
Total current liabilities 5,943,955 – – 5,943,955 6,517,540 9,130 – 6,526,670
Total liabilities 6,597,551 (14,241) 48,640 6,631,950 7,666,010 22,748 60,711 7,749,469
Total equity and liabilities 10,550,414 (25,419) 48,640 10,573,635 14,740,119 5,633 60,711 14,806,463
Notes to the Financial Statements

116
Financial Reports
D I E S E L & M O T O R E N G I N E E R I N G P L C
A N N U A L R E P O RT 2 0 1 2 / 1 3
38.3 Reconciliation of Comprehensive Income for the year ended 31st March 2012
Group Company
For the year ended 31.03.2012 31.03.2012
PreviousSLASs
Re-measurement
due to transition to new SLASs
Re-classification
due to transition to new SLASs
New SLASs
PreviousSLASs
Re-measurement
due to transition to new SLASs
Re-classification
due to transition to new SLASs
New SLASs
Note Rs. ’000 Rs. ’000 Rs. ’000 Rs. ’000 Rs. ’000 Rs. ’000 Rs. ’000 Rs. ’000
Revenue c 39,922,285 (27,859) (31,483) 39,862,943 38,936,764 (27,859) (31,483) 38,877,422Sales taxes (315,199) – – (315,199) (305,139) – – (305,139)
Net turnover 39,607,086 (27,859) (31,483) 39,547,744 38,631,625 (27,859) (31,483) 38,572,283Cost of sales c (32,379,543) – 31,483 (32,348,060) (31,790,017) – 31,483 (31,758,534)
Gross profit 7,227,543 (27,859) – 7,199,684 6,841,608 (27,859) – 6,813,749
Other operating income/ (expenses) (18,001) – – (18,001) (23,915) – – (23,915)Distribution expenses b (682,283) 14,778 – (667,505) (674,244) 32,645 – (641,599)Administrative expenses g (2,557,335) 21,568 – (2,535,767) (2,359,372) 24,159 – (2,335,213)
Results from operating activities 3,969,924 8,487 – 3,978,411 3,784,077 28,945 – 3,813,022Finance income 196,778 – – 196,778 179,653 – 179,653
Finance expenses (450,668) – – (450,668) (447,553) – – (447,553)
Net finance expense (253,890) – – (253,890) (267,900) – – (267,900)
Profit before income tax 3,716,034 8,487 – 3,724,521 3,516,177 28,945 – 3,545,122 Income tax expense (1,018,709) (4,161) – (1,022,870) (962,091) (9,130) – (971,221)
Profit for the year 2,697,325 4,326 – 2,701,651 2,554,086 19,815 – 2,573,901
Other comprehensive income
Actuarial loss arising from defined benefit obligation g – (21,568) – (21,568) – (24,159) – (24,159)Net changes in fair value of financial assets available- for-sale a – (1,605) – (1,605) – (1,593) – (1,593)Gain on freehold land revaluation h – 879,140 – 879,140 – 879,140 – 879,140
Total other comprehensive income net of tax – 855,967 – 855,967 – 853,388 – 853,388
Total comprehensive income for the year 2,697,325 860,293 – 3,557,618 2,554,086 873,203 – 3,427,289
Notes to the Financial Statements

117
Financial Reports
D I E S E L & M O T O R E N G I N E E R I N G P L C
A N N U A L R E P O RT 2 0 1 2 / 1 3
38.4 Explanation of Transition to New SLASs
Notes to the Reconciliations
Figures within the brackets in the ‘Adjustments due to transition to new SLASs and ‘Re-classification’ columns depict a credit entry whilst figures without brackets depict a debits entry.
a. Financial Assets Available-for-SaleThe Group has invested in quoted shares with the intention of holding them for a pro-long period of time. These assets are categorised under ‘Financial Assets Available-for-Sale’ and recorded in the Statement of Financial Position at market value. These assets were previously carried at cost. The difference between the cost and the fair value is accounted for in the Statement of Change in Equity through ‘Other Comprehensive Income’.
The impact arising from the change is summarised as follows:
Group Company
As at 01.04.2011Rs. ’000
31.03.2012Rs. ’000
01.04.2011Rs. ’000
31.03.2012Rs. ’000
Statement of Financial Position
Financial assets available-for-sale: Re-measurement (Changing in fair value) 4,283 2,678 4,251 2,658
Group Company
For the year ended 31.03.2012Rs. ’000
31.03.2012Rs. ’000
Statement of Comprehensive Income
Financial assets available-for-sale: Re-measurement 1,605 1,593
b. Trade and Other Receivables
b.1 Trade and Other Receivables: Re-measurement
As explained in Note 3.2.5.2.2, impairment of trade receivables was remeasured and net difference adjusted in Financial Statements as mentioned below.
The impact arising from the change is summarised as follows:
Group Company
As at 01.04.2011Rs. ’000
31.03.2012Rs. ’000
01.04.2011Rs. ’000
31.03.2012Rs. ’000
Statement of Financial Position
Trade & other receivables: Re-measurement (24,394) (9,616) (29,670) 2,975
Group Company
For the year ended 31.03.2012Rs. ’000
31.03.2012Rs. ’000
Statement of Comprehensive Income
Distribution expenses: Re-measurement (14,778) (32,645)
b.2 Trade Receivables and Other Receivables - Re-classification
In compliance with LKAS 32 and 39, non-financial assets which were previously classified as ‘Trade and other receivables’, have now been reclassified as ‘Other current assets’.
Notes to the Financial Statements

118
Financial Reports
D I E S E L & M O T O R E N G I N E E R I N G P L C
A N N U A L R E P O RT 2 0 1 2 / 1 3
The impact arising from the change is summarised as follows:
Group Company
As at 01.04.2011Rs. ’000
31.03.2012Rs. ’000
01.04.2011Rs. ’000
31.03.2012Rs. ’000
Trade and other receivables: Re-classification (152,411) (259,630) (131,660) (230,763)Other Current assets: Re-classification 152,411 259,630 131,660 230,763
c. Deferred Income
c.1 Deferred income: Re-measurement
The revenue that was related to the free services, where the services are not delivered as at each reporting date, was measured using relative fair value method, and was deferred with corresponding entry adjusted to the retained earnings.
The impact arising from the change is summarised as follows:
Group Company
As at 01.04.2011Rs. ’000
31.03.2012Rs. ’000
01.04.2011Rs. ’000
31.03.2012Rs. ’000
Statement of Financial Position
Deferred income: Re-measurement 14,241 (13,618) 14,241 (13,618)
Group Company
For the year ended 31.03.2012Rs. ’000
31.03.2012Rs. ’000
Statement of Comprehensive Income
Revenue: Re-measurement 27,859 27,859
c.2 Deferred income: Re-classification
Previously, undelivered free services cost has been charged to ‘Cost of sales’ whereas in accordance with new SLAS, fair value of undelivered free services has to be treated as ‘Deferred income’.
The impact arising from the change is summarised as follows:
Group Company
As at 31.03.2012Rs. ’000
31.03.2012Rs. ’000
Revenue: Re-classification 31,483 31,483Cost of sales: Re-classification (31,483) (31,483)
d. Trade and Other Payables
In compliance with LKAS 32 and 39, non-financial liabilities which were earlier classified as ‘Trade payables’, has been reclassified as ‘Other current liabilities’.
The impact arising from the change is summarised as follows:
Group Company
As at 01.04.2011Rs. ’000
31.03.2012Rs. ’000
01.04.2011Rs. ’000
31.03.2012Rs. ’000
Statement of Financial Position
Trade Payables: Re-classification 608,954 702,489 583,238 675,801Other Current Liabilities: Re-classification (608,954) (702,489) (583,238) (675,801)
Notes to the Financial Statements

119
Financial Reports
D I E S E L & M O T O R E N G I N E E R I N G P L C
A N N U A L R E P O RT 2 0 1 2 / 1 3
e. Deferred Tax Assets/Liabilities
The ‘Deferred tax assets’ which were previously set off against ‘Deferred tax liabilities’ are now disclosed separately.
The impact arising from the change is summarised as follows:
Group Company
As at 01.04.2011Rs. ’000
31.03.2012Rs. ’000
01.04.2011Rs. ’000
31.03.2012Rs. ’000
Statement of Financial Position
Deferred tax asset: Re-classification 51,052 62,841 48,640 60,711 Deferred tax liability: Re-classification (51,052) (62,841) (48,640) (60,711)
f. Revenue Reserves
The impact on Revenue Reserve arising from re-measurement related adjustment from (a) to (e) above are summarised as follows:
Group Company
As at GeneralReserve
Rs. ’000
FinancialAssets
Availablefor SaleReserveRs. ’000
RetainedEarnings
Rs. ’000
GeneralReserve
Rs. ’000
FinancialAssets
Available-for-SaleReserveRs. ’000
RetainedEarnings
Rs. ’000
Balance as at 1st April 2011 (as per previous SLASs) 669,290 – 2,213,445 579,464 – 2,055,287Fair value adjustment for financial assets available for sale (refer 38.4.a) – 4,283 – – 4,251 – Trade receivable - provision for impairment (refer 38.4.b.1) – – (24,394) – – (29,670)Adjustment relating to free service cost (refer 38.4.c.1) – – 14,241 – – 14,241Adjusted balance as at 1st April 2011 (as per new SLASs) 669,290 4,283 2,203,292 579,464 4,251 2,039,858
g. Administrative Expenses
Actuarial loss arising from valuation of defined benefit obligation which was previously categorised as ‘Administrative expenses’ is now classified under ‘Other Comprehensive Income’.
The impact arising from the change is summarised as follows:
Group Company
For the year ended 31.03.2012Rs. ’000
31.03.2012Rs. ’000
Statement of Comprehensive Income
Administrative expenses: Re-classification (21,568 ) (24,159)
Statement of Other Comprehensive Income
Actuarial loss arising from Defined Benefits Plans: Re-classification 21,568 24,159
Notes to the Financial Statements

120
Financial Reports
D I E S E L & M O T O R E N G I N E E R I N G P L C
A N N U A L R E P O RT 2 0 1 2 / 1 3
h. Gain on Freehold Land Revaluation
Gain on revaluation of freehold land that was previously adjusted through equity statement, is now adjusted through ‘Statement of Other Comprehensive Income’.
The impact arising, from the change is summarised as follows:
Group Company
For the year ended 31.03.2012Rs. ’000
31.03.2012Rs. ’000
Statement of Other Comprehensive Income
Gain on freehold land revaluation: Re-classification (879,140) (879,140)
i. Cash Flow Statement
The transition from previous SLASs to new SLASs did not make a material impact on the Statement of Cash Flows.
39. Risk Management
39.1 Financial Assets/LiabilitiesRisks associated with financial assets and liabilities their nature and steps taken to manage these risks are given in the notes pertaining to the respective financial assets and liabilities.
39.2 Capital Management The objectives of the capital management can be summarised as follows:
a. Appropriately allocate capital to meet strategic objectives.
b. Enable the Group to face any economic down turn/ crisis situation.
The Company’s policy is to maintain a strong capital base so as to ensure investor, creditor and market confidence and to sustain future development of the business. The impact of the level of capital on shareholders’ return is also recognised and the Company recognises the need to maintain a balance between higher returns that might be possible with greater gearing and the advantages and security afforded by a sound capital position. The Company manages its capital structure and adjusts it accordingly in line with changes in global and local economic and market conditions and its overall risk appetite.
Given below is a summary of the capital structure of the Group:
For the year ended31.03.2013
Rs. ’000 31.03.2012
Rs. ’000
Long-term borrowings (Note 29) 770,203 1,000,163 Equity 7,631,167 7,440,615 Total equity and long-term loans 8,401,370 8,440,778 Gearing ratio (%) 9 12
40. Directors’ Responsibility for the Financial StatementsThe Board of Directors of the Company is responsible for the preparation and presentation of these Financial Statements. The Statement of Directors’ Responsibilities is given on page 79.
Notes to the Financial Statements

121
Appendices
D I E S E L & M O T O R E N G I N E E R I N G P L C
A N N U A L R E P O RT 2 0 1 2 / 1 3
A.R. PandithageChairman/Managing Director
Joined the Company in June 1973. Appointed to the Board in June 1977. Appointed as joint Managing Director in November 1984 and as Managing Director in 1986. Appointed as the Chief Executive Officer in 1994. Appointed as the Chairman, Managing Director and CEO in July 2004 and continues to be Chairman/Managing Director since April 2012,Holder of Dip.Ing. from Germany. Member of the Institute of Engineers, Germany (VDI). Director, Dial Textiles Ltd. Chairman, Audit Committee of Dial Textiles Ltd.
A.G. PandithageChief Executive Officer
Joined the Company in September 1986. Appointed to the Board in December 1995. Fellow of the Chartered Institute of Management Accountants, UK. Appointed as the Deputy Chief Executive Officer with effect from April 2006 and appointed as CEO from April 2012.
A.N. AlgamaJoined the Company in June 1973. Appointed to the Board in November 1984. Past Chairman of The Ceylon Motor Traders’ Association and Sri Lanka Tyre Importers’ Association. Executive Committee Member of the Ceylon Chamber of Commerce - Import Section.
S.C. AlgamaAppointed to the Board in November 1984. Appointed as an Executive Director in 1994. Fellow of the Institute of Incorporated Engineers (SL). Council Member and Chairman-Transport & Automobiles Industries Committee of the National Chamber of Commerce, Sri Lanka.
Dr. H. Cabral**Appointed to the Board in October 2006. President’s Counsel, PhD in Corporate Law (Australia), Commissioner-Law Commission of Sri Lanka, Member - Advisory Commission on Company Law, Council Member - University of Colombo, UGC nominee - PGIM(Post Graduate Institute of Medicine), Member-Board of Studies-Incorporated Council of Legal Education , Member Academic Board of Studies-The Institute of Chartered Accountants of Sri Lanka, Member - Corporate Governance Committee, Senior Lecturer-University of Colombo, University of Wales, IALS Sri Lanka Law College, ICLP.Senior Practitioner in the fields of Corporate Law, Intellectual Property Law, International Trade Law, Commercial Law and Commercial Arbitration. Director-Hayleys PLC, Union Bank PLC, Tokyo Cement PLC, Lanka Orix Finance PLC, Commercial Leasing and Finance PLC, Richard Pieris Distributors Ltd, Tokyo Super Cement Lanka Co. Ltd, Fuji Lanka Cement Co. Ltd., Tokyo Power Lanka Co. Ltd, Hambana Petrochemicals Ltd., and Just in Time Consultants Ltd.
Board of Directors
B.C.S.A.P. GooneratneJoined the Company in January 2001. Appointed to the Board in April 2006. Fellow Member of the Institute of Chartered Accountants of Sri Lanka and holder of Master of Business Administration Degree from University of Sri Jayewardenapura. Non-Executive Director of Hunas Falls PLC.
Prof. U.P. Liyanage**Appointed to the Board in October 2006. Fellow of the Chartered Institute of Marketing. MBA and Ph.D. from the Postgraduate Institute of Management (PIM), University of Sri Jayewardenapura. Director and Chairman of the Board of Management of PIM. Non-Executive Director of Chemenex PLC, Ceylon Cold Stores PLC, Arpico Plastics PLC, Talawakelle Tea Estate PLC, Kuruwita Textile Mills PLC & Commercial Bank of Ceylon PLC, Richard Peiris & Co. PLC (Plastic Sector).
A.M. Pandithage*Appointed to the Board in September 1982. Chairman and Chief Executive of Hayleys PLC. Honorary Consul of United Mexican States (Mexico) to SriLanka. Fellow of the Chartered Institute of Logistics & Transport. Member of the Presidential Committee on Maritime Matters. Committee Member of the Ceylon Chamber of Commerce. Council Member of the Employer’s Federation of Ceylon. Member of the Monetary Policy Consultative Committee of the Central Bank of SriLanka. Director of SriLanka Port Management & Consultancy Services Ltd.
T.G.H. PeriesJoined the Company in 1962 and appointed to the Board in August 1977.
R. Seevaratnam**Appointed to the Board in January 2007. Fellow member of The Institute of Chartered Accountants of Sri Lanka and England & Wales and holder of General Science Degree from the University of London. Former senior partner of KPMG Ford, Rhodes, Thornton & Company. Non-Executive Independent Director of Haycarb PLC, Dipped Products PLC, Acme Printing & Packaging PLC, Acme Packaging Solutions (Pvt) Ltd., Tea Factories Small Holders PLC, Tokyo Cement PLC, Hayleys MGT PLC, Kelani Valley Plantations PLC, Lanka Aluminium Industries PLC, Metecno Lanka (Pvt) Ltd., Classic Teas (Pvt) Ltd., Green Farms (Pvt) Ltd., Colombo Fort & Land Building Co PLC, Omega Line Ltd., Sirio Ltd, Banji Ltd., Alpha Apparels Ltd., Hayleys Agricultural Holdings (Pvt) Ltd., Hayleys Consumers (Pvt) Ltd.
R.C. WeerawardaneJoined the Company in February 1990. Appointed to the Board in June 2002. Certificate holder of the Chartered Institute of Marketing, UK.
The Board of Directors’ portraits: in the spirit of integration, these photographs have been randomly interspersed from pages 18 to 40 in this Annual Report.
* Non-Executive Directors** Independent Non-Executive Directors

122
Appendices
D I E S E L & M O T O R E N G I N E E R I N G P L C
A N N U A L R E P O RT 2 0 1 2 / 1 3
Group Structure and Group Management Committee
A.R. PandithageChairman/Managing Director
A.G. PandithageDirector/Chief Executive Officer
S.C. AlgamaExecutive Director
B.C.S.A.P. GooneratneDirector/Chief Financial Officer
R.C. WeerawardaneExecutive Director
M.V. BandaraGeneral Manager - Sales and Service, Commercial Vehicles
A.C.G. DiasGeneral Manager - Tyres
E.D.C. KodituwakkuGeneral Manager - Finance & Controlling
Dimo Group Management Committee Members
D.N.K. KurukulasuriyaGeneral Manager - Human Resources
A. MapalagamaGeneral Manager - Infrastructure Development
N. MudannayakeGroup IT Manager
S.R.W.M. C. RanawanaGeneral Manager - Construction and Material Handling
W. PushpawelaGeneral Manager - Power & Medical Engineering
The Group Management Committee portraits: in the spirit of integration, these photographs have been randomly interspersed from pages 42 to 64 in this Annual Report.
Name of the Company/ Year of Incorporation
Reg. No./ % Holding
Division Segment Directors
Diesel & Motor Engineering PLCInc. 1945
PQ 146 AutomobileVehicles
Vehicle Parts & Services
A.R. Pandithage (Chairman/MD), A.G. Pandithage (CEO), A.N. Algama, S.C. Algama, Dr. H. Cabral, B.C.S.A.P. Gooneratne, Prof. U.P. Liyanage, A.M. Pandithage, T.G.H. Peries, R. Seevaratnam, R.C. Weerawardane
Marketing & Projects
Lighting & Power Tools
Construction Agricultural & Material Handling Machinery
Dimo Travels (Pvt) Ltd.
Inc. 1975PV1256
100%
TravellingA.R. Pandithage (Chairman), S.C. Algama, M.V. Bandara, E.D.C. Kodituwakku
Dimo (Pvt) Ltd.
INC. 1980PV2317
100%
Industrial Solutions Electro Mechanical
& Bio Medical Engineering
A.R. Pandithage (Chairman), S.C. Algama (MD), R.H. Fernando, B.C.S.A.P. Gooneratne, A.G. Pandithage, W. Pushpawela, C. Ranawana, R.C. Weerawardane
Dimo Industries (Pvt) Ltd.
Inc. 1979PV1260
100%
A.R. Pandithage (Chairman), S.C. Algama, A.C.G. Dias, B.C.S.A.P. Gooneratne, A.G. Pandithage,R.C. Weerawardane

123
Appendices
D I E S E L & M O T O R E N G I N E E R I N G P L C
A N N U A L R E P O RT 2 0 1 2 / 1 3
Independent Assurance Statement on Non-Financial Reporting
IntroductionDet Norske Veritas AS (DNV) has been commissioned by the management of Diesel & Motor Engineering PLC (‘Dimo’ or ‘the Company’) to carry out an assurance of the Company’s non-financial disclosures related to sustainability performance in its Annual Report 2012-13 (the Report) in its printed and online formats against the Global Reporting Initiative (GRI) Sustainability Reporting Guidelines Version 3.1 (GRI G3.1) and Accountability’s AA1000 Assurance Standard 2008 (AA1000AS 2008). The verification was carried out in May 2013.
The intended users of this assurance statement are the management of the Company and the readers of the Report. The Management of the Company is responsible for all information provided in the Report as well as the processes for collecting, analysing and reporting the information, including the maintenance and integrity of the website. DNV’s responsibility regarding this verification is to Dimo only and in accordance with the agreed scope of work. The assurance engagement is based on the assumption that the data and information provided to us is complete, sufficient and authentic.
Scope, Boundary and Limitations of AssuranceThe scope of work agreed upon with Diesel & Motor Engineering PLC included the following:
The content of the sustainability performance reported in the Annual Report i.e. review of the policies, initiatives, practices and performance described in the Report as well as references made in the Report;
Sustainability performance covering economic, environmental and social indicators for the period 1st April 2012 to 31st March 2013 in the Report prepared as per GRI G3.1;
Evaluation of the Report’s adherence to the Accountability principles and specified information mentioned below, as required for a Type 2, Moderate Level of assurance, according to AA1000AS 2008: Information related to Company’s sustainability issues, responses,
performance data, case studies and underlying systems for the management of such information and data;
Information relating to Company’s materiality assessment and stakeholder engagement processes;
Confirmation of adherence to the requirements for GRI Application Level ‘A+’.
The reporting boundary is as set out in the Report, covering entities over which the management has control and significant influence; during the verification process, there were no limitations encountered on the scope for the assurance engagement. Our verification was limited to the Report presented to us and our assurance does not cover maintenance and integrity of the website.
Verification MethodologyOur assurance engagement was planned and carried out in accordance with AA1000AS (2008) and the DNV Protocol for Verification of Sustainability Reporting1. The Report was evaluated with regard to the following criteria:
Adherence to the principles of Inclusivity, Materiality and Responsiveness as set out in AA1000AS (2008);
The Reliability of specified sustainability performance information, as required for a Type 2, moderate level assurance engagement;
Evaluation of the additional principles of Completeness and Neutrality, as set out in DNV’s Protocol for Verification of Sustainability Reporting1;
The principles and requirements of GRI G3.1 for Application Level ‘A+’.
As part of the verification, DNV has verified the statements and claims made in the Report and assessed the robustness of the underlying data management system, information flow and controls. In doing so, we have:
Reviewed the Company’s approach to stakeholder engagement and its materiality determination process;
Verified the sustainability-related statements and claims made in the Report and assessed the robustness of the data management system, information flow and controls;
Examined and reviewed documents, data and other information made available to us by the Company;
Visited the Head-Office and site operations at Siyambalape and Colombo (Jetawana Road);
Conducted interviews with key representatives (including data owners and decision-makers from different divisions and functions) of the Company;
Performed sample-based reviews of the mechanisms for implementing the Company’s own sustainability-related policies, as described in the Report, and for determining material issues to be included in the report;
Performed sample-based checks of the processes for generating, gathering and managing the quantitative and qualitative data included in the Report;
Reviewed the process of acquiring information and economic data from the financial data presented in the certified financial statements.
ConclusionsThe sustainability performance as reported in the Diesel & Motor Engineering PLC Annual Report 2012–2013 provides a fair representation of the Company’s sustainability policies, objectives, management approach and performance during the reporting year. We also confirm that the Report meets the content requirements of GRI G3.1 Application Level ‘A+’. We have evaluated the Report’s adherence to the following principles on a scale of ‘Good’, ‘Acceptable’ and ‘Needs Improvement’:
AA1000AS (2008) principles:Inclusivity: The Company has identified key stakeholders and documented the process of engagement. The stakeholder engagement process is carried out with the help of an external organization and outputs of stakeholder engagement is validated.
In our view, the level at which the Report adheres to this principle is ‘Good’.
Materiality: The Company has established the process of determining the materiality and updated material aspects for monitoring and continual improvement of its sustainability performance. The identified material aspects have been adequately prioritised and responded to in the Report.
In our view, the level at which the Report adheres to this principle is ‘Good’.
Responsiveness: The Company has a fair understanding the sustainability context and has adequately responded to possible key stakeholder concerns through its policies and management systems. This is fairly reflected in the Report within the defined scope and boundary.
In our view, the level at which the Report adheres to this principle is ‘Acceptable’.
1 www.dnv.com/cr

124
Appendices
D I E S E L & M O T O R E N G I N E E R I N G P L C
A N N U A L R E P O RT 2 0 1 2 / 1 3
Reliability: The majority of data and information verified were found to be accurate. Some of the data inaccuracies identified during the verification process were found to be attributable to data aggregation errors and the same has been corrected. Hence in accordance with the AA1000AS (2008) requirements for a Type 2, moderate level assurance engagement, we conclude that the specified sustainability data and information presented in the Report is generally reliable and acceptable.
Specific Evaluation of the Information on Sustainability PerformancesWe consider the methodology and process for gathering information developed by the Company for its sustainability performance reporting to be appropriate and the qualitative and quantitative data included in the Report, was found to be identifiable and traceable; the personnel responsible was able to demonstrate the origin and interpretation of the data and its reliability. We also assessed the reported progress against the Company’s commitments as disclosed in its previous Report and observed that the Report presents a fair description of the sustainability activities and the goals achieved.
Additional Parameters as per DNV’s Protocol:Completeness: The report boundary covers its operations in Sri Lanka. The Company has made disclosures on the performance of aspects and indicators relating to the key material issues identified and is also committed to improve the disclosures in future.
In our view, the level at which the Report adheres to this principle is ‘Acceptable’.
Neutrality: The sustainability performance and related issues are reported in a fairly transparent and balanced manner, in terms of content and tone.
In our view, the level at which the Report adheres to this principle is ‘Good’.
Opportunities for ImprovementThe following is a summary of the observations and opportunities reported back to the management. These do not, however, affect our conclusions regarding the Report, and they are indeed consistent with the management objectives already in place:
The stakeholder engagement process may be broad-based and increase the engagement intensity to further improve the feedback and the Report may explicitly bring out the engagement outcomes and Company’s responses;
The Company may expedite the implementation of a health and safety management system across the entities of Dimo, to help identify and mitigate the health and safety risks related its workforce;
To further strengthen and respond on the aspects related to human rights, formal assessments may be carried out across its value chain to identify frontier risks if any and implement suitable risk mitigation strategies.
DNV’s Competence and IndependenceDNV is a global provider of sustainability services, with qualified environmental and social assurance specialists working in over 100 countries. DNV states its independence and impartiality with regard to this assurance engagement. DNV was not involved in the preparation of any statements or data included in the Report, with the exception of this Assurance Statement. DNV maintains complete impartiality toward any people interviewed. DNV expressly disclaims any liability or co-responsibility for any decision a person or entity would make based on this Assurance Statement.
For Det Norske Veritas AS,
Prasun KunduProject Manager,Head - Sustainability & Business Excellence Services, East Service Responsible - Social Accountability & Ethics,Det Norske Veritas AS, India.
Vadakepatth NandkumarAssurance Reviewer,National Head - Sustainability & Business Excellence Services,DNV Business Assurance, India.
Kolkata, India30th May 2013
Independent Assurance Statement on Non-Financial Reporting

125
Appendices
D I E S E L & M O T O R E N G I N E E R I N G P L C
A N N U A L R E P O RT 2 0 1 2 / 1 3
Ten Year Summary
Year Ended 31st March 2012/13 2011/12 2010/11 2009/10 2008/09 2007/08 2006/07 2005/06 2004/05 2003/04Rs. ’000 Rs. ’000 Rs. ’000 Rs. ’000 Rs. ’000 Rs. ’000 Rs. ’000 Rs. ’000 Rs. ’000 Rs. ’000
Operating results
Revenue 27,711,604 39,862,943 29,357,271 10,530,587 9,187,966 12,687,289 12,989,916 10,512,326 7,565,327 4,796,905
Profit before income tax 490,021 3,724,521 3,395,980 420,095 175,082 344,444 512,895 382,235 253,633 148,396
Income tax expense (27,871) (1,022,870) (1,274,228) (141,842) (72,054) (139,351) (211,118) (117,062) (76,431) (48,131)
Profit for the year 462,150 2,701,651 2,121,752 278,253 103,028 205,093 301,777 265,173 177,202 100,265
Capital employed
Stated capital 425,297 425,297 182,500 182,500 182,500 182,500
Share capital – – – – – 121,000 90,000 90,000 90,000
Share premium – – – – – 61,500 37,500 37,500 37,500
Capital reserve 2,014,752 2,014,752 1,135,612 1,135,612 1,135,612 311,522 311,522 311,522 311,522 182,301
Revenue reserve 5,191,118 5,000,566 2,882,735 882,816 686,733 1,163,129 1,012,486 777,009 566,836 432,634
Total equity attributable to the equity holders of the company 7,631,167 7,440,615 4,200,847 2,200,928 2,004,845 1,657,151 1,506,508 1,216,031 1,005,858 742,435
Total borrowings (including both long-term and short-term borrowing) 3,417,800 5,045,829 3,068,466 1,966,600 2,709,671 2,802,374 2,864,688 2,796,158 1,608,915 958,049
Capital employed 11,048,967 12,486,444 7,269,313 4,167,528 4,714,516 4,459,525 4,371,196 4,012,189 2,614,773 1,700,484
Net assets employed
Non-current assets 5,719,010 4,763,435 3,099,509 2,149,406 2,234,911 1,463,068 1,005,370 775,323 734,720 559,752
Current assets 7,181,369 10,536,783 7,839,972 3,389,023 3,028,263 4,368,090 4,193,262 3,794,288 2,460,687 1,692,349
Total liabilities (excluding borrowings) (1,851,412) (2,813,774) (3,670,168) (1,370,901) (548,658) (1,371,633) (827,436) (557,422) (580,634) (551,617)
Net assets employed 11,048,967 12,486,444 7,269,313 4,167,528 4,714,516 4,459,525 4,371,196 4,012,189 2,614,773 1,700,484
Cash flows
Net cash generated from/ (used in) operations 3,207,700 (2,430,074) 1,793,848 846,833 625,652 520,706 383,134 (990,433) (587,299) (39,915)
Net cash from/(used in) investing activities (970,581) (788,829) (937,710) (24,275) 1,918 (519,212) (287,636) (91,474) (97,584) (75,584)
Net cash from/(used in) financing activities (474,062) 277,902 (377,658) (295,885) (416,861) 179,289 (49,458) 305,800 92,125 26,434
Net increase/(decrease) in cash & cash equivalents 1,763,057 (2,941,001) 478,480 526,673 210,709 180,783 46,040 (776,107) (592,758) (89,065)
Key indicators
Earnings per share (Rs.) 52.06 304.36 239.03 27.97 9.36 16.95 25.76 22.96 15.34 8.68
Net assets per share (Rs.) 859.71 838.24 473.26 252.92 230.39 136.95 124.50 121.60 100.59 82.49
Market value per share (Rs.) 505.00 982.20 1,484.70 394.25 60.25 88.75 120.00 138.50 103.00 53.00
Dividend per share (Rs.) 10.00 40.00 61.00 7.00 3.00 4.00 6.00 6.00 5.00 3.50
Dividend approved (Rs. ’000) 88,764 244,102 443,822 34,810 26,107 48,400 72,600 60,000 50,000 31,500
Annual sales growth (%) (30.48) 35.91 178.78 14.61 (27.58) (2.33) 23.57 38.95 57.71 40.89
Equity to total assets ratio (%) 59.15 48.63 38.40 39.78 38.09 28.42 28.98 26.61 31.48 32.97
Dividend cover (No. of Times) 5.21 7.61 4.00 3.11 2.34 4.02 3.88 3.99 3.18 3.29
Price earnings ratio (No. of Times) 9.70 3.23 6.21 14.89 6.44 5.24 4.66 6.03 6.71 6.11
Current ratio (No. of times) 1.71:1 1.60:1 1.27:1 1.20:1 1.31:1 1.26:1 1.30:1 1.33:1 1.24:1 1.20:1
Turnover to capital employed (No. of Times) 2.51 3.19 4.04 2.53 1.95 2.84 2.97 2.62 2.89 2.82
Interest cover (No. of Times) 2.24 15.67 17.35 2.20 1.31 1.67 2.11 2.43 2.73 2.54
Average No. of employees 1,433 1,179 942 867 869 866 820 714 627 613

126
Appendices
D I E S E L & M O T O R E N G I N E E R I N G P L C
A N N U A L R E P O RT 2 0 1 2 / 1 3
1. Stock Exchange ListingThe issued ordinary shares of Diesel & Motor Engineering PLC, are listed with the Colombo Stock Exchange of Sri Lanka. The audited Consolidated Income Statement for the year ended 31st March 2013 and the audited Statement of Financial Position at that date have been submitted to the Colombo Stock Exchange within three months of the Reporting date.
2. Shareholders The number of Shareholders as at 31st March 2013 was 2,024 (1,865 as at 31st March 2012).
Resident Non-Resident Total
No. of Shares HeldNo. of
ShareholdersNo. of
Shares %No. of
ShareholdersNo. of
Shares %No. of
ShareholdersNo. of
Shares %
1 - 1,000 1,708 223,388 2.52 30 9,852 0.11 1,738 233,240 2.63 1,001 - 10,000 219 603,503 6.80 2 6,541 0.07 221 610,044 6.87 10,001 - 100,000 48 1,431,160 16.12 2 41,880 0.47 50 1,473,040 16.59 100,001 - 1,000,000 14 5,331,810 60.07 – – – 14 5,331,810 60.07 1,000,001 and over 1 1,228,303 13.84 – – – 1 1,228,303 13.84
Total 1,990 8,818,164 99.35 34 58,273 0.65 2,024 8,876,437 100.00
Over 95% of the shares issued is held by residents of Sri Lanka.
31st March 2013 31st March 2012
Categories of ShareholdersNo. of
ShareholdersNo. of
Shares %No. of
ShareholdersNo. of
Shares %
Individuals 1,919 5,869,921 66.13 1,758 5,886,444 66.32Institutions 105 3,006,516 33.87 107 2,989,993 33.68
Total 2,024 8,876,437 100.00 1,865 8,876,437 100.00
3. Market Value of Shares The Market value of an ordinary share of Diesel & Motor Engineering PLC (based on the Volume Weighted Price), as at 31st March 2013 was Rs. 505.00 (Rs. 982.20 as at 31st March 2012).
4. Share Trading Information from 1st April 2012 to 31st March 20132012/13 2011/12 2010/11 2009/10
Highest (Rs.) 940.10 (02nd April 2012) 1,780.00 (18th April 2011) 1,900.00 (15th Feb 2011) 505.00 (26th Feb 2010)Lowest (Rs.) 490.00 (15th March 2013) 920.00 (23rd March 2012) 400.00 (7th May 2010) 60.00 (6th April 2009)Closing (Rs.) 505.00 (28th March 2013) 982.20 (30th March 2012) 1,484.70 (31st March 2011) 424.75 (30th March 2010)
5. Public ShareholdingAs at 31 March 2013 2012 2011 2010
Number of Shares 3,895,878 3,931,310 4,239,990 3,769,203 % 43.89 44.29 48.72 43.31
Share Information

127
Appendices
D I E S E L & M O T O R E N G I N E E R I N G P L C
A N N U A L R E P O RT 2 0 1 2 / 1 3
6. Changes in Shareholdings of Directors and their Spouses during 2012/13
NameShareholding
%
As at 31.03.2013
SharesMovement
Shares
As at 31.03.2012
Shares
Mr. A.R. Pandithage 21.62 1,919,735 – 1,919,735Mr. A.N. Algama 2.41 213,739 – 213,739Mr. S.C. Algama 6.47 574,779 – 574,779Mr. A.G. Pandithage 6.43 570,862 – 570,862Mr. A.M. Pandithage 2.53 224,172 – 224,172Mr. T.G.H. Peries 2.80 248,969 (165) 249,134
42.26 3,752,256 (165) 3,752,421
7. Top Twenty Shareholders31st March 2013 31st March 2012
Name Shares % Shares %
Employees Provident Fund 1,228,303 13.84 1,192,706 13.44 Mr. A.R. Pandithage 991,233 11.17 991,233 11.17 Mrs. J.C. Pandithage 928,502 10.46 928,502 10.46 A & G Investments Pvt Ltd. 608,939 6.86 608,939 6.86 Mr. S.C. Algama 567,786 6.40 567,786 6.40 Mr. A.G. Pandithage 525,814 5.92 525,814 5.92 Sri Lanka Insurance Corporation Ltd. - Life Fund 315,466 3.55 315,466 3.55 Almar Trading Co (Pvt) Ltd. 309,374 3.49 306,476 3.45 Mr. A.N. Algama 213,739 2.41 213,739 2.41 Mr. T.G.H. Peries 193,069 2.18 193,069 2.18 Mr. A.M. Pandithage 182,319 2.05 182,319 2.05 Dr. D.Jayanntha 158,700 1.79 157,700 1.79 Miss T.R.N.C. Peries 148,009 1.67 148,009 1.67 Mr. L.P. Algama 134,569 1.52 134,569 1.52 Estate of the Late N.U. Algama 118,845 1.34 118,845 1.34 United Motors Lanka PLC 78,803 0.89 50,300 0.56 Mr. M. Radhakrishnan 69,788 0.79 69,788 0.79 Almar International (Pvt) Ltd. 62,861 0.71 62,861 0.71 Mrs. M.S. Peries 55,900 0.63 56,065 0.63 Mrs. T.E.I. Wickramasinghe 47,216 0.53 46,291 0.52
6,939,235 78.20 6,870,477 77.42
8. The stated capital represents 8,876,437 ordinary shares.
Share Information
The Art of our Science
Putting this report together required a marriage of art and science. We want to tell you a bit about the art. Our artistic medium was inspired by traditional Sri Lankan decorative art dating back over 2,000 years and visible in a variety of artistic expression across the country - from wall paintings to rock sculptures, carvings and more. Working in acrylics, we chose the diversity of Dimo’s business as our unique canvas. The examples you see rendered in this report will be permanently on display at our new Mercedes Benz Centre in Colombo...a celebration of the art of science.

128
Appendices
D I E S E L & M O T O R E N G I N E E R I N G P L C
A N N U A L R E P O RT 2 0 1 2 / 1 3
Notice of Meeting
NOTICE IS HEREBY GIVEN that the Sixty-Eighth Annual General Meeting of Diesel & Motor Engineering PLC will be held at the Registered Office of the Company, No. 65, Jetawana Road, Colombo 14, on Friday, 28th June 2013 at 10.00 a.m. and the business to be brought before the meeting will be:
Agenda
1. To consider and adopt the Report of the Directors and the Statement of Accounts for the year ended 31st March 2013, with the Report of the Auditors thereon.
2. To re-elect Mr. A.G. Pandithage, who retires by rotation in terms of Articles 66 of the Articles of Association as a Director of the Company.
3. To re-elect Mr. R.C. Weerawardane, who retires by rotation in terms of Articles 66 of the Articles of Association as a Director of the Company.
4. To re-elect Mr. R. Seevaratnam, who retires by rotation in terms of Articles 66 of the Articles of Association as a Director of the Company.
5. To note that Mr. T.G.H. Peries, a Director who retires in terms of Article 66 of the Articles of Association of the Company has not offered himself for re-election and therefore will cease to be a Director of the Company with effect from the conclusion of this meeting
6. To reappoint Messrs KPMG as Auditors to the Company for the ensuing year and to authorize the Board of Directors to determine their remuneration.
7. To authorise the Directors to determine contributions to charities.
The profiles of the Directors proposed for re-election are given on the Annual Report.
NoteA member is entitled to appoint a proxy to attend and vote instead of himself/herself and a proxy need not be a member of the Company. A Form of proxy is enclosed for this purpose. The instrument appointing a proxy must be deposited at the Registered Office, No. 65, Jetawana Road, Colombo 14, not less than forty-eight hours before the time fixed for the Meeting.
By Order of the Board,Diesel & Motor Engineering PLCCompany Registration No. PQ-146
B.C.S.A.P. GooneratneSecretary
Colombo
21st May 2013

D I E S E L & M O T O R E N G I N E E R I N G P L C
A N N U A L R E P O RT 2 0 1 2 / 1 3Form of Proxy
I/We,……………………………………………………………………………………………………………………………………....................................................……………
of ..............................................................................................................................................................................................................................................................
being a member/members of DIESEL & MOTOR ENGINEERING PLC hereby appoint:
1............................................................................................................................................................................................................................................................ of
..................................................................................................................................................................................................................................................................
Holder of NIC No. ......................................................................................................or failing him/them.
2. ASOKA RANJITH PANDITHAGE (Chairman of the Company) of Colombo or, failing him, one of the Directors of the Company as my/our proxy to vote as indicated hereunder for me/us and on my/our behalf at the Sixty-Eighth Annual General Meeting of the company to be held on Friday, 28th June 2013 and at every poll which may be taken in consequence of the aforesaid meeting and at any adjournment thereof.
For Against
1. To consider and adopt the Report of the Directors and the Statement of Accounts for the year ended 31st March 2013, with the Report of the Auditors thereon.
2. To re-elect Mr. A.G. Pandithage, who retires by rotation at the Annual General Meeting, a Director.
3. To re-elect Mr. R.C. Weerawardane, who retires by rotation at the Annual General Meeting, a Director.
4. To re-elect Mr. R. Seevaratnam, who retires by rotation at the Annual General Meeting, a Director.
5. To re-appoint Messrs KPMG as Auditors and authorise the Directors to determine their remuneration.
6. To authorise the Directors to determine contributions to charities.
The proxy may vote as he/she thinks fit on any other resolution brought before the meeting.
Dated this ................................................................................ day of ............................................................................... 2013.
Witness: ...............................................
............................................... ............................................... Signature of Shareholder 1. A proxy need not be a member of the Company.2. Instructions to fill the Form of Proxy (please see overleaf).

D I E S E L & M O T O R E N G I N E E R I N G P L C
A N N U A L R E P O RT 2 0 1 2 / 1 3
Instruction as to Completion1. To be valid this form of proxy must be deposited at the Registered Office, No. 65, Jetawana Road, Colombo 14, not less than 48 hours before the time
appointed for the holding of the meeting.
2. In perfecting the form of proxy please ensure that all details are legible.
3. If you wish to appoint a person as your proxy, please insert the relevant details overleaf and initial against this entry.
4. Please indicate with a ‘X’ in the spaces provided how your proxy is to vote on each resolution. If no indication is given the proxy in his/her discretion will vote as he/she thinks fit. Please delete if you do not wish your proxy to vote as he/she thinks fit on any other resolution brought before the meeting.
5. In the case of a company/corporation, the proxy must be under its common seal which should be affixed and attested in the manner prescribed by its Articles of Association.
6. In the case of a proxy signed by an Attorney, the Power of Attorney must be deposited at the registered office for registration.
Form of Proxy

Name of the CompanyDiesel & Motor Engineering PLC
Registered OfficeP.O. Box 339, No. 65, Jetawana Road,Colombo 14, Sri Lanka.Telephone: +94-11-2449797,+94-11- 2338883www.dimolanka.comE-mail: [email protected]: +94-11-2449080
Legal FormA public limited Company incorporated in 1945 under the Laws of the Democratic Socialist Republic of Sri Lanka. The company was re-registered under the Companies Act No. 7 of 2007 on 9th May 2008.
Company Registration NumberPQ 146
Founded1939
Accounting Year End31st March
Tax Payer Identification Number (TIN)104002498
Stock Exchange ListingThe ordinary shares of the Company are listed with the Colombo Stock Exchange of Sri Lanka
AuditorsKPMG,Chartered Accountants,No. 32A, Sir Mohamed Macan Markar Mawatha,Colombo 3, Sri Lanka.
Internal AuditorsSJMS AssociatesChartered AccountantsNo. 2, Castle Street,Colombo 04, Sri Lanka.
LawyersF J & G De Saram & CompanyAttorneys-at-LawNo. 216, De Saram Place,Colombo 10, Sri Lanka.
BankersBank of CeylonCommercial Bank of Ceylon PLCCiti BankDFCC Vardhana BankHatton National Bank PLCHongkong & Shanghai Banking Corporation LtdNations Trust Bank PLCNDB Bank PLCPeople’s BankSampath Bank PLC
Company SecretaryB.C.S.A.P. Gooneratne, F.C.A., M.B.A. (Sri J.)
Company RegistrarsCorporate Services LtdNo. 216, De Saram Place,Colombo 10, Sri Lanka
This Diesel & Motor Engineering PLC annual report has been produced by Smart Media The Annual Report Company, a certified carbon neutral organisation. Additionally, the greenhouse gas emissions resulting from activities outsourced by Smart Media in the production of this annual report, including the usage of paper and printing, are offset through verified sources.
Corporate Information


CONTENTS
ContextA 360-Degree View of Highlights of the Year 6Report Approach…Setting Tone and Tenor 7Chairman’s Letter 13Chief Executive Officer’s Review 15 Management ReportThe Operating Environment...and Trends 18Refining our Portfolio…and Reinventing our Future 21Financial Value Creation 22Delivering Value to Customers... and their Value to Us 28Working at Dimo…Enjoyable and Rewarding 34Our Business Partners… A Symbiotic Relationship 39Regulatory Authorities…Playing by the Rules 41Our Community…Live and Let Live 43The Environment…Now and for Generations Yet Unborn 47Sustainability Performance Objectives in 2012-2013 50 StewardshipEnterprise Governance 52Risk Management 64Report of the Audit Committee 72Remuneration Committee Report 74Nomination Committee Report 75Responsibility Statement of Chairman/ Managing Director and Chief Executive Officer and Chief Financial Officer 76 Financial ReportsAnnual Report of the Board of Directors 78Statement of Directors’ Responsibilities for the Financial Statements 79Independent Auditors’ Report 80Income Statement 81Statement of Comprehensive Income 81Statement of Financial Position 82Statement of Changes in Equity 83Cash Flow Statement 84Notes to the Financial Statements 86 AppendicesBoard of Directors 121Group Structure and Group Management Committee 122Independent Assurance Statement on Non-Financial Reporting 123Ten Year Summary 125Share Information 126Notice of Meeting 128Corporate Information EnclosedForm of Proxy Enclosed
Diesel & Motor Engineering PLC, better known as Dimo is a public quoted company listed on the Colombo Bourse. Founded in 1939, Dimo operates across the five business segments, representing several best-in-class Principals. Headquartered in the commercial capital of Colombo in Sri Lanka, Dimo has an extensive network of sales and after-sales facilities spread throughout the Island and a team of over 1500 employees.
Our vision is to be the leader in all the businesses we are engaged in, by building a world-class team and partnering with the best in the world, to deliver, lasting and outstanding value to all our stakeholders.
THIS IS DIMO
Vehicles – Aftercare Services Parts for the aftercare markets of passenger vehicles, commercial vehicles and agri-machinery plus engine management systems and services.
Principals Represented
Rs. mn
09 10
Performance Highlights of the Year
Both Turnover and the number of units sold decreased by 37%. Total industry volumes of commercial vehicles decreased by l8% and, tractors and harvesters by 40% and 60% respectively. Mercedes-Benz passenger cars were the most severely affected. Chrysler and TATA passenger cars and Jeep also performed below expectations. The silver lining is that we increased our market share in several categories of the light commercial category such as the LCV bus, trucks and tippers segments.
Profit and Profitability
Outlook for 2013/14
The end to the ceiling on credit growth imposed on banks, a downward trend in interest rates and a stable exchange rate should translate to a gradual increase in demand for commercial vehicles. Passenger cars would however remain challenged with the prevailing high tariffs. The forthcoming launches of the two new Mercedes-Benz models; the A-Class and the S-Class Hybrid together with our launch of Sri Lanka’s largest range of tractors in Q4 would provide a fillip. Overall, we remain cautiously optimistic.
Principals Represented
Rs. mn
09 10 11 12 13
%
0
7,000
14,000
21,000
28,000
35,000
0
20
40
60
80
100
Return on Total Assets (%)Turnover (Rs. mn) )Results (Rs. mn
0
700
1,400
2,100
2,800
3,500
Performance Highlights of the Year
Long-term investments on aftercare including decentralisation and opening of new workshops island wide have already begun to show results. Last year’s growth momentum was maintained. Turnover across most segments increased with TATA parts recording nearly a 20% rise. Vehicle throughput for TATA commercial vehicles increased from last year’s record 45,281 units to 53,480 units, as was the service hours sold increasing from 208,767 to 244,691. The Bosch diesel and car service centre grew turnover by 73%.
Profit and Profitability
Outlook for 2013/14
We expect the growth not just to continue but also to pickup momentum as our new investments come on stream. The Mercedes-Benz Centre, which would be completed by the end of 2013, will provide an integrated sales, service & parts solution under one roof. With technical specifica-tions and green guidelines from Daimler AG, the new centre will usher a new paradigm in vehicles sales and aftercare in the Country.
11 12 13
Return on Total Assets (%)Turnover (Rs. mn) )Results (Rs. mn
%
0
10
20
30
40
50
Performance Highlights of the Year
Turnover from Lighting Products, OEM parts, commercial vehicle tyres and passenger vehicle tyres increased by 3%, 7%, 26% and 33% respectively. The new Kumho brand of tyres launched last year played a major part. In contrast. Turnover from power tools and Bosch auto components reduced by 3% and 16% respectively. Despite the drop in turnover, our power tools remained the market leader with a 38% share of the branded powertools market.
Profit and Profitability
Outlook for 2013/14
Developments in the construction sector and the emerging trends in adopting smart technology for lighting would fuel growth in power tools and lighting products, respectively. Further streamlining of supplies of passenger car tyres and positioning Kumho as a preferred brand would ensure growth momentum in tyre sales.
Principals Represented
Return on Total Assets (%)Turnover (Rs. mn) )Results (Rs. mn
Principals Represented
Performance Highlights of the Year
Machinery equipment sales were severely challenged by an influx of cheaper alternatives from China. Thus, turnover from this line dropped by 42%. Nevertheless, turnover from the sale of construction machinery parts increased by 12%. A range of warehousing systems, automated racking systems and cold storage systems were sold to several clients.
Profit and Profitability
Outlook for 2013/14
Growth potential remains high with the infrastructure development projects and plans underway and growth in the construction sector.
Return on Total Assets (%)Turnover (Rs. mn) )Results (Rs. mn
Rs . mn
09 10 11 12 13
%
0
700
1,400
2,100
2,800
3,500
0
10
20
30
40
50Performance Highlights of the Year
Landmark projects were once again won or completed. They included a complex fire detection system, fire pump and water supply systems and sewerage pump systems at Mattala International Airport, an Access Control System at the Central Bank of Sri Lanka, the country’s first Nero Biplane Angiography System to Central Hospital, the electrical installations one of the country’s largest grid substation projects.
Profit and Profitability
Outlook for 2013/14
Large scale infrastructure development projects, growth in the hotels sector and hospitals sector augur well for the prospects.
Principals Represented
LEADER MARINE
Return on Total Assets (%)Turnover (Rs. mn) )Results (Rs. mn
Rs . mn
09 10 11 12 130
250
500
750
1,000
1,250
0
12
24
36
48
60
%
Vehicle - SalesPassenger cars, SUVs, and a range of commercial vehicles from small 750kg trucks to large 40 Ton+ trucks to tippers, buses, tractors, agri-implements and harvesters.
Electro-Mechanical , Bio Medical Engineering and Marine
Power solutions, building automation systems, fire detection protection and suppression systems, CCTV and access control systems, public address systems, power systems for marine propulsion and rail traction, industrial refrigeration and medical equipment.
Marketing and Distribution
Hitherto known as Lighting and Power Tools the scope of this segment has been widened with some activities previously under Vehicles and Aftercare Service; Range of lamps, lighting fittings, Industrial and domestic power tools, tyres, and original equipment manufacturers (OEM) parts.
Construction & Material Handling Equipment and After Services
Construction and mining equipment, compaction, and road building machinery, concrete machinery, fluid management systems, forklifts, storage and racking systems, building cleaning and maintenance systems, aerial work platforms, parking systems and construction machinery parts.
