dimetic 2011 - maastricht floortje...
TRANSCRIPT
Lectures 7 and 8: Networks and complexity
Lectures 7 and 8: Networks and complexity
Dimetic 2011 - Maastricht
Floortje Alkemade
Dimetic 2011 - Maastricht
Lectures 7 and 8: Networks and complexity
Outline
Lecture 7: Models of innovation in networks
networks of innovators
networks of technologies
networks of products
Lecture 8: The NK-model and its application to technological systems
Technology choice when technologies are complex adaptivesystems
The relation between technological design complexity andtechnological performance
Dimetic 2011 - Maastricht
Lectures 7 and 8: Networks and complexity
Networks of innovators
R. Cowan and N. Jonard. Network structure and the diffusion ofknowledge. Journal of Economic Dynamics and Control 28:1557-1575,2004
Dimetic 2011 - Maastricht
Lectures 7 and 8: Networks and complexity
Questions
How do markets process information?
If the network structure is exogenous, how do the structuralproperties of the network affect aggregate outcomes?
If network formation is endogenous, what structures are likely toemerge?
Dimetic 2011 - Maastricht
Lectures 7 and 8: Networks and complexity
Assumptions/Starting points
Tacit knowledge and the importance of face-to-face interactions
Knowledge exchange in industry networks in barter arrangements
Dimetic 2011 - Maastricht
Lectures 7 and 8: Networks and complexity
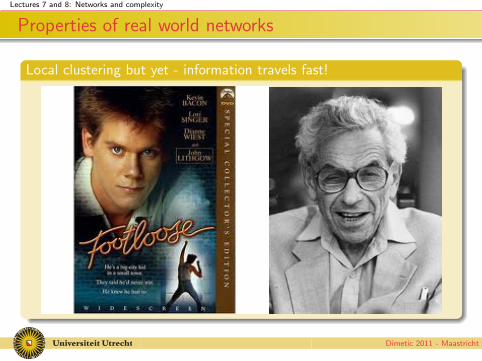
Properties of real world networks
Local clustering but yet - information travels fast!
Dimetic 2011 - Maastricht
Lectures 7 and 8: Networks and complexity
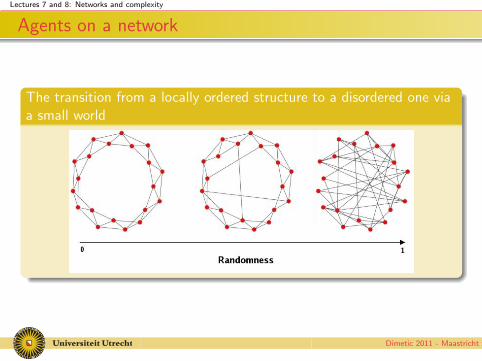
Agents on a network
The transition from a locally ordered structure to a disordered one viaa small world
Dimetic 2011 - Maastricht
Lectures 7 and 8: Networks and complexity
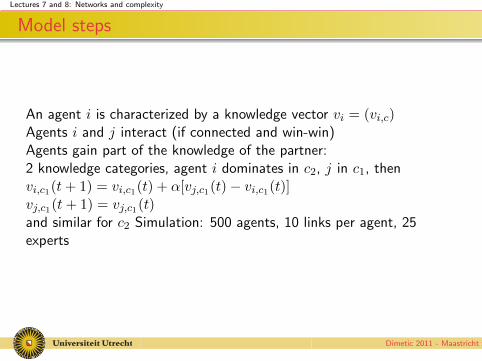
Model steps
An agent i is characterized by a knowledge vector vi = (vi,c)Agents i and j interact (if connected and win-win)Agents gain part of the knowledge of the partner:2 knowledge categories, agent i dominates in c2, j in c1, thenvi,c1(t+ 1) = vi,c1(t) + α[vj,c1(t)− vi,c1(t)]vj,c1(t+ 1) = vj,c1(t)and similar for c2 Simulation: 500 agents, 10 links per agent, 25experts
Dimetic 2011 - Maastricht
Lectures 7 and 8: Networks and complexity
Model outcomes - What do you think?
Highest knowledge levels - why?
Highest knowledge variance - why?
Dimetic 2011 - Maastricht
Lectures 7 and 8: Networks and complexity
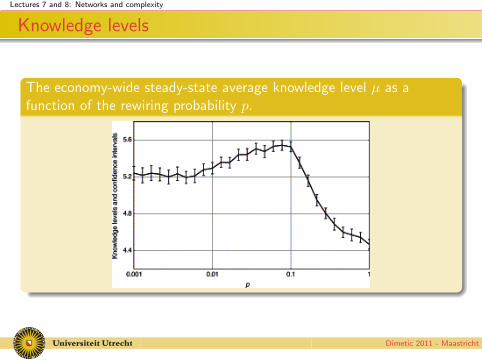
Knowledge levels
The economy-wide steady-state average knowledge level µ as afunction of the rewiring probability p.
Dimetic 2011 - Maastricht
Lectures 7 and 8: Networks and complexity
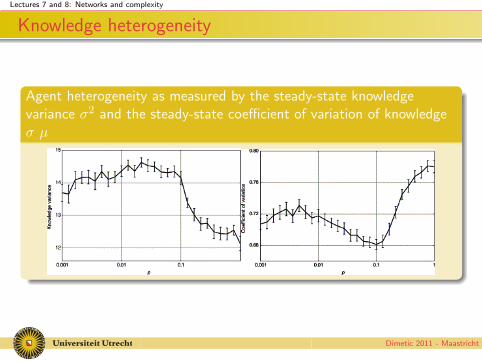
Knowledge heterogeneity
Agent heterogeneity as measured by the steady-state knowledgevariance σ2 and the steady-state coefficient of variation of knowledgeσ µ
Dimetic 2011 - Maastricht

Lectures 7 and 8: Networks and complexity
Implications
So what?
Dimetic 2011 - Maastricht
Lectures 7 and 8: Networks and complexity
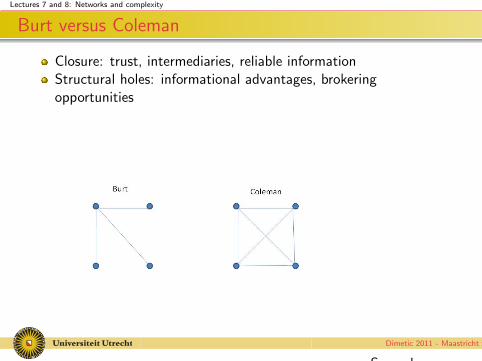
Burt versus Coleman
Closure: trust, intermediaries, reliable informationStructural holes: informational advantages, brokeringopportunities
Severalauthors have investigated which network structures are stable underthe assumptions that actor(s) strive for structural holes. But theprocesses guiding network formation may well be context dependent.
Dimetic 2011 - Maastricht
Lectures 7 and 8: Networks and complexity
... from a dynamic perspective more and less integratedstructures, with stronger or weaker linkages betweenactivities, are complements rather than substitutes: theyhave comparative advantages in different stages of theinnovation process (Nooteboom 1999 - Research Policy)
Dimetic 2011 - Maastricht

Lectures 7 and 8: Networks and complexity
Show model
Dimetic 2011 - Maastricht
Lectures 7 and 8: Networks and complexity
Networks of technologies
G. Silverberg and B. Verspagen. A percolation model of innovation incomplex technology spaces. Journal of economic dynamics and control29:225-244, 2005
Dimetic 2011 - Maastricht
Lectures 7 and 8: Networks and complexity
Stylized facts
Technical change is cumulative
Agents tend to search locally for new technologies
Technical change follows relatively ordered pathways
Highly skewed size distribution of innovation
Dimetic 2011 - Maastricht
Lectures 7 and 8: Networks and complexity
The model
A lattice of technological nichesA lattice site aij can be in one of four states:
0 or technologically excluded by nature
1 or possible but not yet discovered
2 discovered but not yet viable
3 discovered and viable
A discovered technology only becomes viable when it can draw onan unbroken chain of supporting technologies already in use
Dimetic 2011 - Maastricht
Lectures 7 and 8: Networks and complexity
The simulation
1 Initiate lattice with 0’s and 1’s (percolation model)
2 BPF (t) = (i, j(i)) where j(i) = maxj for which a(i,j) = 3
3 R&D, search (with some probability) with radius m around viablestates on BPF.
Dimetic 2011 - Maastricht
Lectures 7 and 8: Networks and complexity
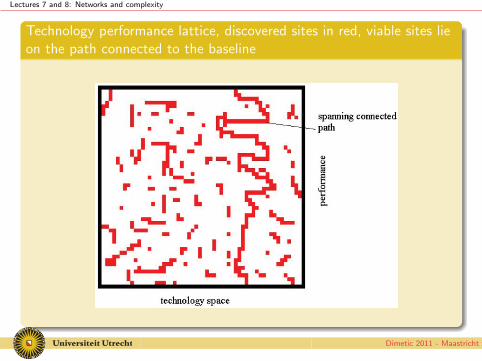
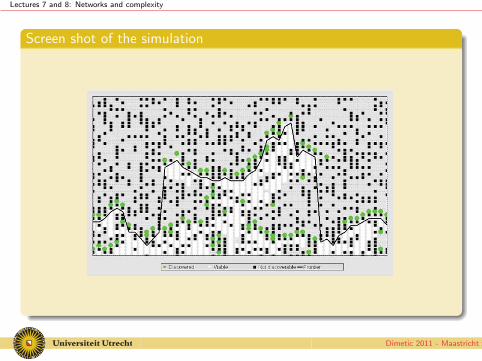
Technology performance lattice, discovered sites in red, viable sites lieon the path connected to the baseline
Dimetic 2011 - Maastricht
Lectures 7 and 8: Networks and complexity
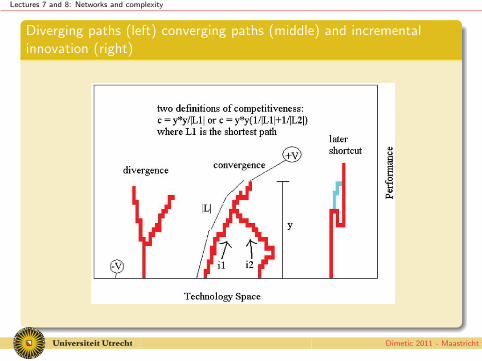
Diverging paths (left) converging paths (middle) and incrementalinnovation (right)
Dimetic 2011 - Maastricht
Lectures 7 and 8: Networks and complexity
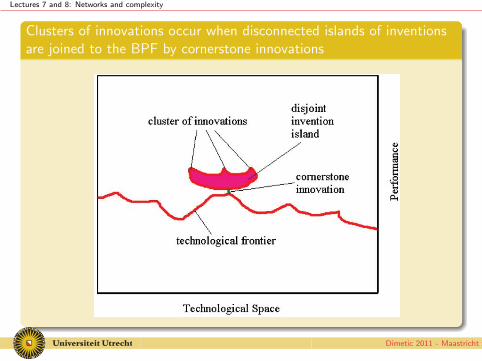
Clusters of innovations occur when disconnected islands of inventionsare joined to the BPF by cornerstone innovations
Dimetic 2011 - Maastricht
Lectures 7 and 8: Networks and complexity
Screen shot of the simulation
Dimetic 2011 - Maastricht
Lectures 7 and 8: Networks and complexity
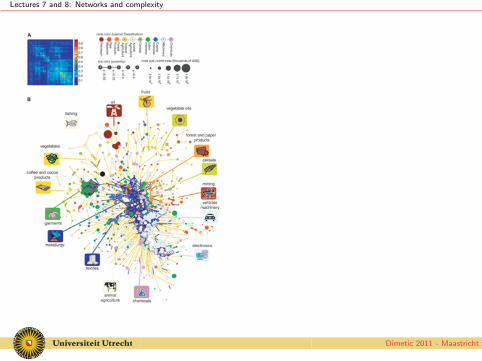
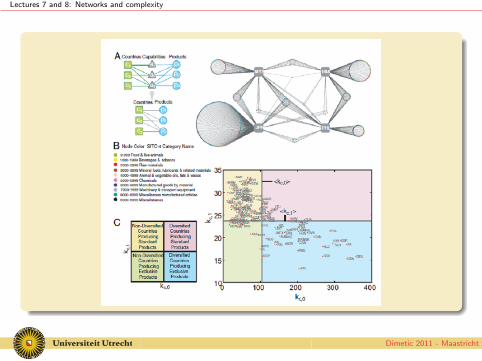
Networks of products
C.A. Hidalgo, B. Klinger, A.-L. Barabasi, R. Hausmann. The productspace conditions the development of nations. Science 317:482-487,2007.
Dimetic 2011 - Maastricht
Lectures 7 and 8: Networks and complexity
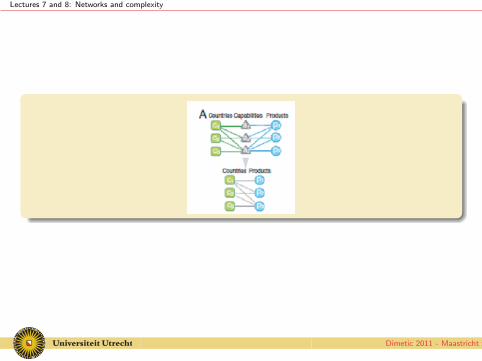
Some intuition
Economies grow by upgrading the products they produce andexport
The ability of a country to produce a product depends on itsability to produce other products
If two goods are related because they require similar institutions,infrastructure, physical factors, technology, or some combinationthereof, they will tend to be produced in tandem, whereasdissimilar goods are less likely to be produced together.
Dimetic 2011 - Maastricht
Lectures 7 and 8: Networks and complexity
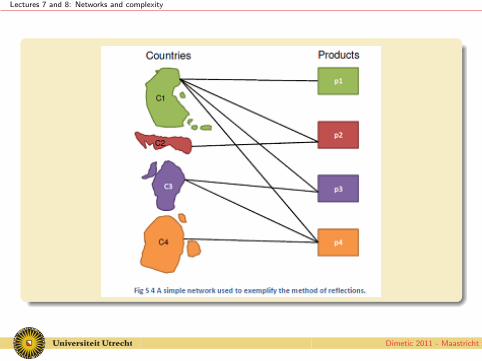
Methodology
1 Calculate a measure for proximity between goods
2 Compute Revealed Comparative Advantage for countries (usingtrade data)
3 Compute proximity measure (using RCAs)
4 Construct proximity matrix
5 Construct product space: a network where related goods are linked
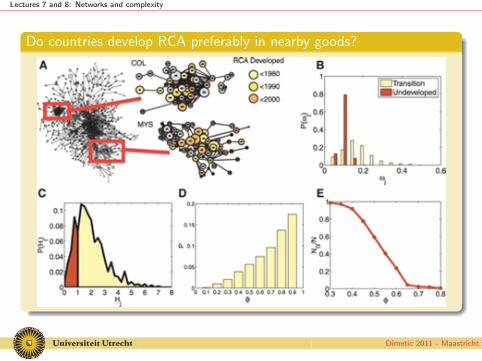
6 Test whether countries do indeed diversify into related goods
Dimetic 2011 - Maastricht
Lectures 7 and 8: Networks and complexity
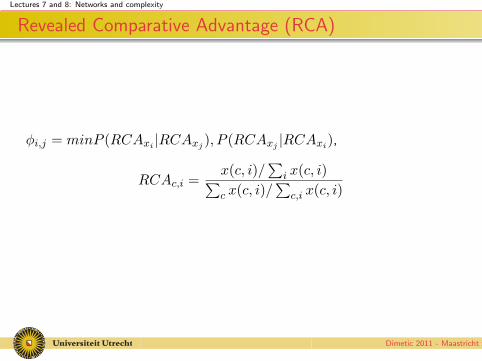
Revealed Comparative Advantage (RCA)
φi,j = minP (RCAxi |RCAxj ), P (RCAxj |RCAxi),
RCAc,i =x(c, i)/
∑i x(c, i)∑
c x(c, i)/∑
c,i x(c, i)
Dimetic 2011 - Maastricht
Lectures 7 and 8: Networks and complexity
Dimetic 2011 - Maastricht
Lectures 7 and 8: Networks and complexity
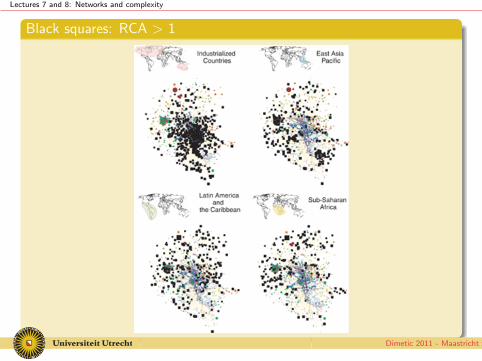
Black squares: RCA > 1
Dimetic 2011 - Maastricht
Lectures 7 and 8: Networks and complexity
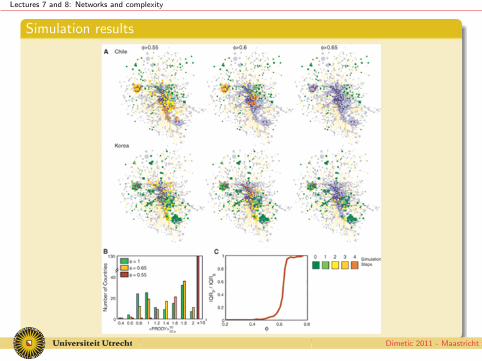
Do countries develop RCA preferably in nearby goods?
Dimetic 2011 - Maastricht
Lectures 7 and 8: Networks and complexity
Simulation results
Dimetic 2011 - Maastricht
Lectures 7 and 8: Networks and complexity
Dimetic 2011 - Maastricht
Lectures 7 and 8: Networks and complexity
Dimetic 2011 - Maastricht
Lectures 7 and 8: Networks and complexity
Dimetic 2011 - Maastricht
Lectures 7 and 8: Networks and complexity
Dimetic 2011 - Maastricht
Lectures 7 and 8: Networks and complexity
Technology choice when technologies are complex adaptivesystems
F. Alkemade, K. Frenken, M. Hekkert, M. Schwoon. A complexsystems methodology to transition management. EvolutionaryEconomics 19:527-543, 2009
Dimetic 2011 - Maastricht
Lectures 7 and 8: Networks and complexity
Motivaton
Major technological transitions are required for sustainabledevelopmentButComplexity of the domain prevents top-down steeringAim: To present a technology assessment methodology that takes intoaccount the complexity of the domain
Dimetic 2011 - Maastricht
Lectures 7 and 8: Networks and complexity
Technological transitions
Desirability of alternative technological optionsActual strategy dictated by most preferred optionProblems:
Future performance often uncertain
Decisions now may cut-off future alternatives
Dimetic 2011 - Maastricht

Lectures 7 and 8: Networks and complexity
Flexible strategies
Initial steps should be robust regarding changing evidenceInitial steps should be robust regarding changing preferences
Dimetic 2011 - Maastricht
Lectures 7 and 8: Networks and complexity
NK-Fitness landscapes
Interdependent subsystems
Fitness of the overall system depends on combination ofsubsystems
Design space
Technological change is a search process in this design space
N subsystems
K interdependencies
Dimetic 2011 - Maastricht
Lectures 7 and 8: Networks and complexity
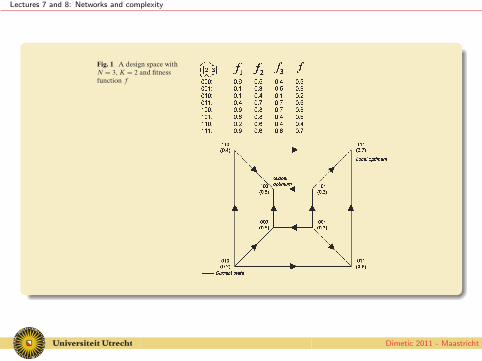
Fig. 1 A design space withN = 3, K = 2 and fitnessfunction f
Dimetic 2011 - Maastricht

Lectures 7 and 8: Networks and complexity
Assumptions
Only one subsystem is allowed to change at each time stepEach single transition step needs to be (weakly) fitness improving
Dimetic 2011 - Maastricht
Lectures 7 and 8: Networks and complexity
Flexibility in technological transitions
Changing evidence concerning optima:Goal flexibility: the number of different optima that can be reachedafter the initial transition step has taken placeChanging evidence concerning non-optimal designs:Path flexibility: the number of different paths that lead to anoptimum given an initial transition stepChanging preferences:Preference flexibility: a step that meets both sets of preferences atthe same time
Dimetic 2011 - Maastricht
Lectures 7 and 8: Networks and complexity
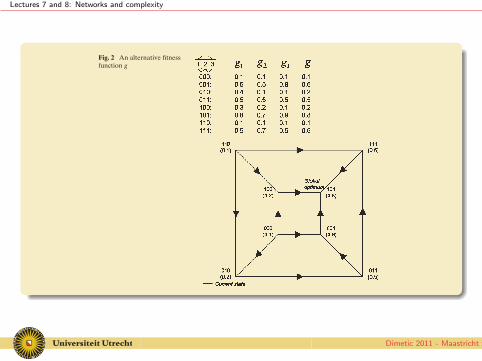
Fig. 2 An alternative fitnessfunction g
Dimetic 2011 - Maastricht
Lectures 7 and 8: Networks and complexity
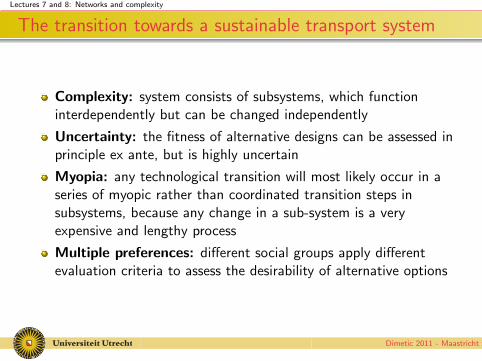
The transition towards a sustainable transport system
Complexity: system consists of subsystems, which functioninterdependently but can be changed independently
Uncertainty: the fitness of alternative designs can be assessed inprinciple ex ante, but is highly uncertain
Myopia: any technological transition will most likely occur in aseries of myopic rather than coordinated transition steps insubsystems, because any change in a sub-system is a veryexpensive and lengthy process
Multiple preferences: different social groups apply differentevaluation criteria to assess the desirability of alternative options
Dimetic 2011 - Maastricht
Lectures 7 and 8: Networks and complexity
Methodology
Construct design space
Assign fitness values (economic as well as environmentalperformance)
Derive local and global optima
Compute flexibility measures
Draw conclusion regarding desirability of transition steps
Dimetic 2011 - Maastricht
Lectures 7 and 8: Networks and complexity
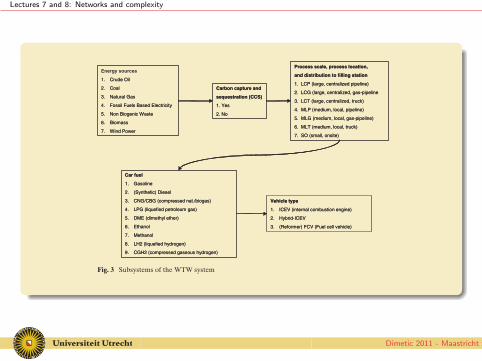
1. Crude Oil
2. Coal
3. Natural Gas
4. Fossil Fuels Based Electricity
5. Non Biogenic Waste
6. Biomass
7. Wind Power
Carbon capture and
sequestration (CCS)
1. Yes
2. No
Process scale, process location,
and distribution to filling station
1. LCP (large, centralized pipeline)
2. LCG (large, centralized, gas-pipeline
3. LCT (large, centralized, truck)
4. MLP (medium, local, pipeline)
5. MLG (medium, local, gas-pipeline)
6. MLT (medium, local, truck)
7. SO (small, onsite)
Car fuel
1. Gasoline
2. (Synthetic) Diesel
3. CNG/CBG (compressed nat./biogas)
4. LPG (liquefied petroleum gas)
5. DME (dimethyl ether)
6. Ethanol
7. Methanol
8. LH2 (liquefied hydrogen)
9. CGH2 (compressed gaseous hydrogen)
Vehicle type
1. ICEV (internal combustion engine)
2. Hybrid-ICEV
3. (Reformer) FCV (Fuel cell vehicle)
Energy sources
1. Crude Oil
2. Coal
3. Natural Gas
4. Fossil Fuels Based Electricity
5. Non Biogenic Waste
6. Biomass
7. Wind Power
Carbon capture and
sequestration (CCS)
1. Yes
2. No
Process scale, process location,
and distribution to filling station
1. LCP (large, centralized pipeline)
2. LCG (large, centralized, gas-pipeline
3. LCT (large, centralized, truck)
4. MLP (medium, local, pipeline)
5. MLG (medium, local, gas-pipeline)
6. MLT (medium, local, truck)
7. SO (small, onsite)
Car fuel
1. Gasoline
2. (Synthetic) Diesel
3. CNG/CBG (compressed nat./biogas)
4. LPG (liquefied petroleum gas)
5. DME (dimethyl ether)
6. Ethanol
7. Methanol
8. LH2 (liquefied hydrogen)
9. CGH2 (compressed gaseous hydrogen)
Vehicle type
1. ICEV (internal combustion engine)
2. Hybrid-ICEV
3. (Reformer) FCV (Fuel cell vehicle)
Fig. 3 Subsystems of the WTW system
Dimetic 2011 - Maastricht
Lectures 7 and 8: Networks and complexity
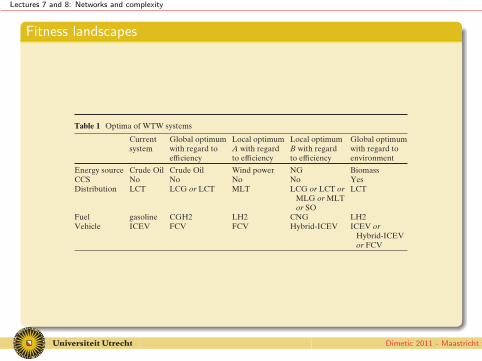
Fitness landscapes
Table 1 Optima of WTW systems
Current Global optimum Local optimum Local optimum Global optimumsystem with regard to A with regard B with regard with regard to
efficiency to efficiency to efficiency environment
Energy source Crude Oil Crude Oil Wind power NG BiomassCCS No No No No YesDistribution LCT LCG or LCT MLT LCG or LCT or LCT
MLG or MLTor SO
Fuel gasoline CGH2 LH2 CNG LH2Vehicle ICEV FCV FCV Hybrid-ICEV ICEV or
Hybrid-ICEVor FCV
Dimetic 2011 - Maastricht
Lectures 7 and 8: Networks and complexity
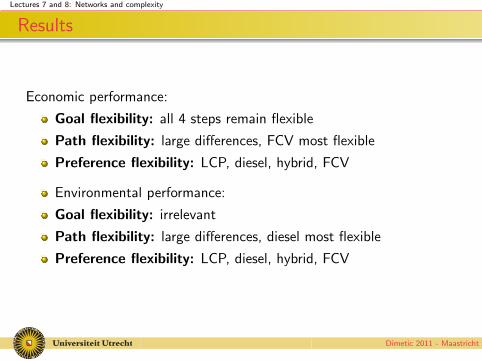
Results
Economic performance:
Goal flexibility: all 4 steps remain flexible
Path flexibility: large differences, FCV most flexible
Preference flexibility: LCP, diesel, hybrid, FCV
Environmental performance:
Goal flexibility: irrelevant
Path flexibility: large differences, diesel most flexible
Preference flexibility: LCP, diesel, hybrid, FCV
Dimetic 2011 - Maastricht
Lectures 7 and 8: Networks and complexity
Conclusions
Overall, it seems that changes in the vehicle technology towardseither a hybrid car or a fuel cell car is most desirable because it isfairly flexible in all the four flexibility dimensions discussed.
The methodology developed in this paper can lead to usefulinsights regarding optimal transition strategies.
Dimetic 2011 - Maastricht
Lectures 7 and 8: Networks and complexity
The relation between technological design complexity andtechnological performance
J. McNerney, J.D. Farmer, S. Redner, and J.E. Trancik. Role of designcomplexity in technology improvement. PNAS 108(22):9008-9013
Dimetic 2011 - Maastricht
Lectures 7 and 8: Networks and complexity
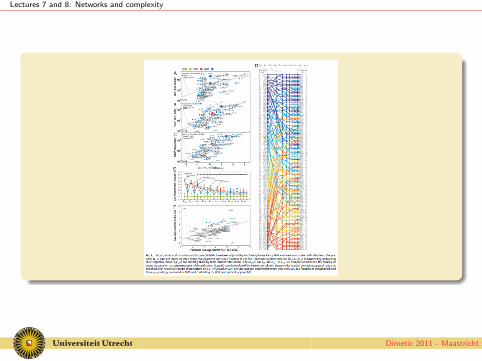
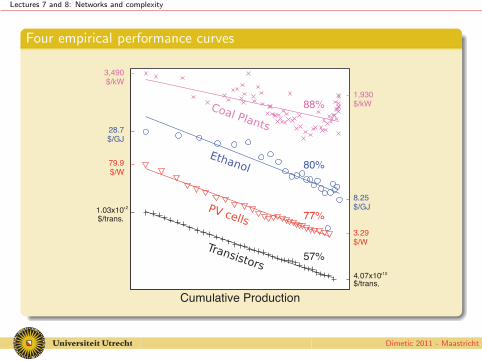
Four empirical performance curves
Dimetic 2011 - Maastricht

Lectures 7 and 8: Networks and complexity
Motivation
The potential for exploiting performance curves has so far notbeen fully realized
Why do performance curves tend to look like power laws, asopposed to some other functional form?
What factors determine the exponent α, which governs thelong-term rate of improvement?
Dimetic 2011 - Maastricht
Lectures 7 and 8: Networks and complexity
The model
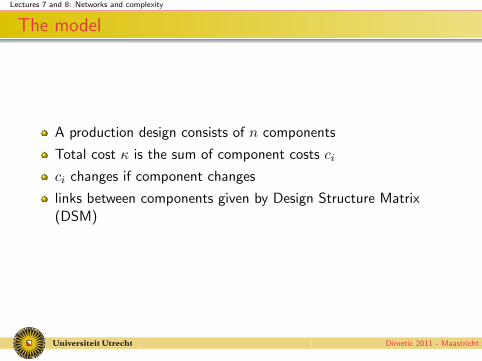
A production design consists of n components
Total cost κ is the sum of component costs ci
ci changes if component changes
links between components given by Design Structure Matrix(DSM)
Dimetic 2011 - Maastricht
Lectures 7 and 8: Networks and complexity
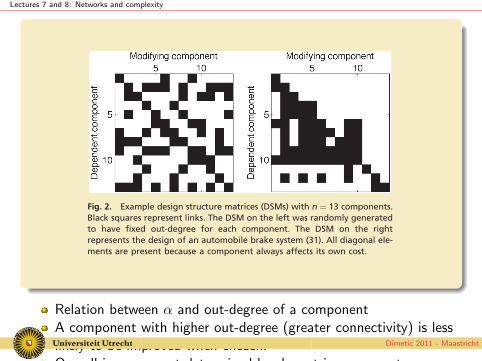
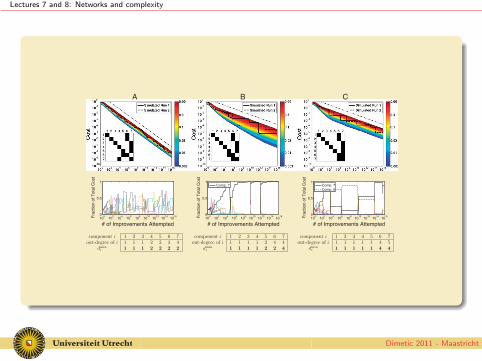
Fig. 2. Example design structure matrices (DSMs) with n ¼ 13 components.Black squares represent links. The DSM on the left was randomly generatedto have fixed out-degree for each component. The DSM on the rightrepresents the design of an automobile brake system (31). All diagonal ele-ments are present because a component always affects its own cost.
Relation between α and out-degree of a componentA component with higher out-degree (greater connectivity) is lesslikely to be improved when chosen.Overall improvement determined by slowest-improvementcomponent, governed by design complexity.
Dimetic 2011 - Maastricht
Lectures 7 and 8: Networks and complexity
The simulation
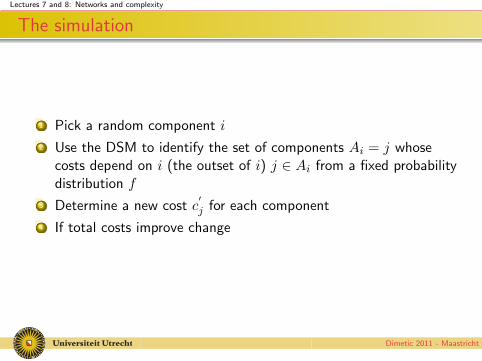
1 Pick a random component i
2 Use the DSM to identify the set of components Ai = j whosecosts depend on i (the outset of i) j ∈ Ai from a fixed probabilitydistribution f
3 Determine a new cost c′j for each component
4 If total costs improve change
Dimetic 2011 - Maastricht
Lectures 7 and 8: Networks and complexity
Results
j
i
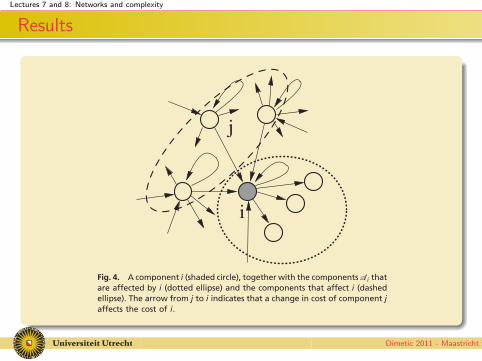
Fig. 4. A component i (shaded circle), together with the componentsAi thatare affected by i (dotted ellipse) and the components that affect i (dashedellipse). The arrow from j to i indicates that a change in cost of component jaffects the cost of i.
Dimetic 2011 - Maastricht
Lectures 7 and 8: Networks and complexity
A B C
Dimetic 2011 - Maastricht

Lectures 7 and 8: Networks and complexity
Thank you
Dimetic 2011 - Maastricht
Lectures 7 and 8: Networks and complexity
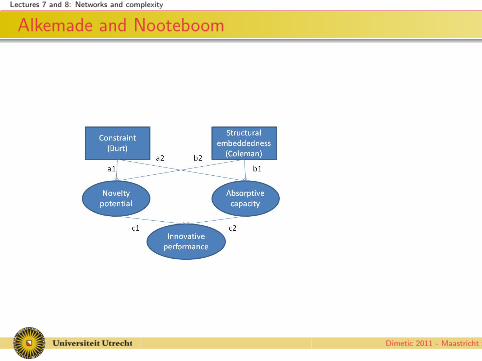
Alkemade and Nooteboom
Dimetic 2011 - Maastricht
Lectures 7 and 8: Networks and complexity
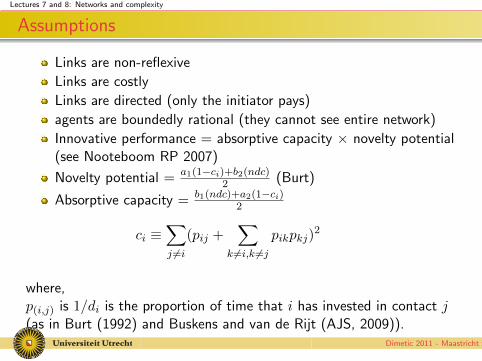
Assumptions
Links are non-reflexive
Links are costly
Links are directed (only the initiator pays)
agents are boundedly rational (they cannot see entire network)
Innovative performance = absorptive capacity × novelty potential(see Nooteboom RP 2007)
Novelty potential = a1(1−ci)+b2(ndc)2 (Burt)
Absorptive capacity = b1(ndc)+a2(1−ci)2
ci ≡∑j 6=i
(pij +∑
k 6=i,k 6=j
pikpkj)2
where,p(i,j) is 1/di is the proportion of time that i has invested in contact j(as in Burt (1992) and Buskens and van de Rijt (AJS, 2009)).
Dimetic 2011 - Maastricht
Lectures 7 and 8: Networks and complexity
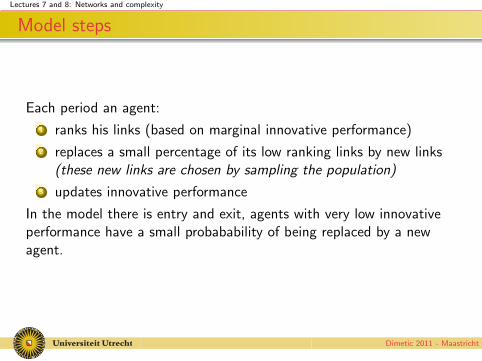
Model steps
Each period an agent:
1 ranks his links (based on marginal innovative performance)
2 replaces a small percentage of its low ranking links by new links(these new links are chosen by sampling the population)
3 updates innovative performance
In the model there is entry and exit, agents with very low innovativeperformance have a small probabability of being replaced by a newagent.
Dimetic 2011 - Maastricht