dimensioning of mobile data - non-uniform usage ... 2016... · cell planning and re-use 1 2 33 2 2...
TRANSCRIPT

1
1
Dimensioning of mobile data- Non-uniform usage
Dimensioning of voice services(Thanks to Claes Beckman)
Jan MarkendahlDecember 12, 2016
2
TimeTime
00:0
0
01:0
0
02:0
0
03:0
0
04:0
0
05:0
0
06:0
0
07:0
0
08:0
0
09:0
0
10:0
0
11:0
0
12:0
0
13:0
0
14:0
0
15:
00
16:0
0
17:0
0
18:0
0
19:0
0
20:0
0
21:0
0
22:0
0
23:0
0
Time
Cal
l Att
empt
s
2
3
Today
• Dimensioning not assuming uniform usage• Non uniform usage profile• Conditions set by bit rates• Erlang type of dimensioning• Criticism of simple ”HW3” model
• Capacity of a cell• System bandwidth• Spectral efficiency• Spectral reuse
4
Today
• Dimensioning not assuming uniform usage• Non uniform usage profile• Conditions set by bit rates• Erlang type of dimensioning• Criticism of simple ”HW3” model
• Capacity of a cell• System bandwidth• Spectral efficiency• Spectral reuse

3
5
Capacity dimensioning – Mobile broadband
Montly demand of MBB spread out - all days of the month- all 24 hours of the day
Time
For data NRT data traffic the approach with”average data rate” per user can be used
X GB per user and month -> Y kbps per user
6
Montly demand of MBB spread out - all days of the month- 12 out of 24 hours of the day
Capacity dimensioning – Mobile broadband
Time
4
7
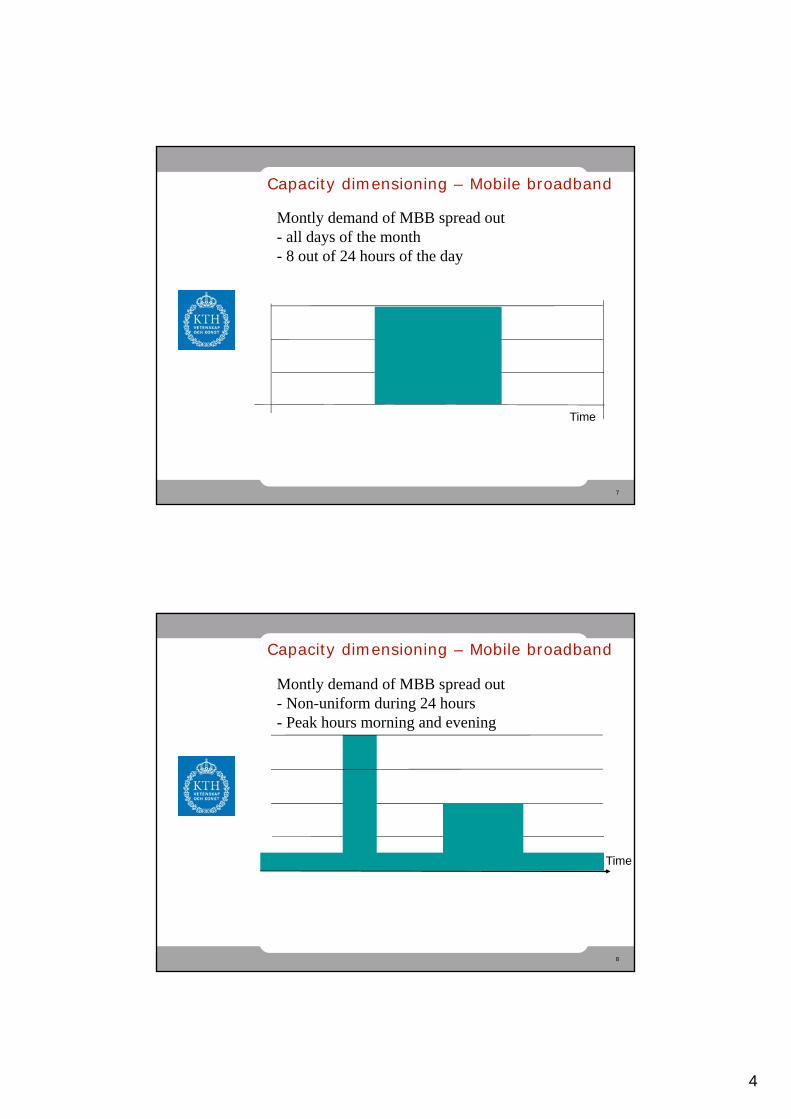
Capacity dimensioning – Mobile broadband
Montly demand of MBB spread out - all days of the month- 8 out of 24 hours of the day
Time
8
Capacity dimensioning – Mobile broadband
Montly demand of MBB spread out- Non-uniform during 24 hours- Peak hours morning and evening
Time

5
9
Capacity dimensioning – Mobile broadband
Montly demand of MBB spread out- Non-uniform during 24 hours
Time
Office area
10
Capacity dimensioning – Mobile broadband
Montly demand of MBB spread out- Non-uniform during 24 hours
Time
Residential area
6
11
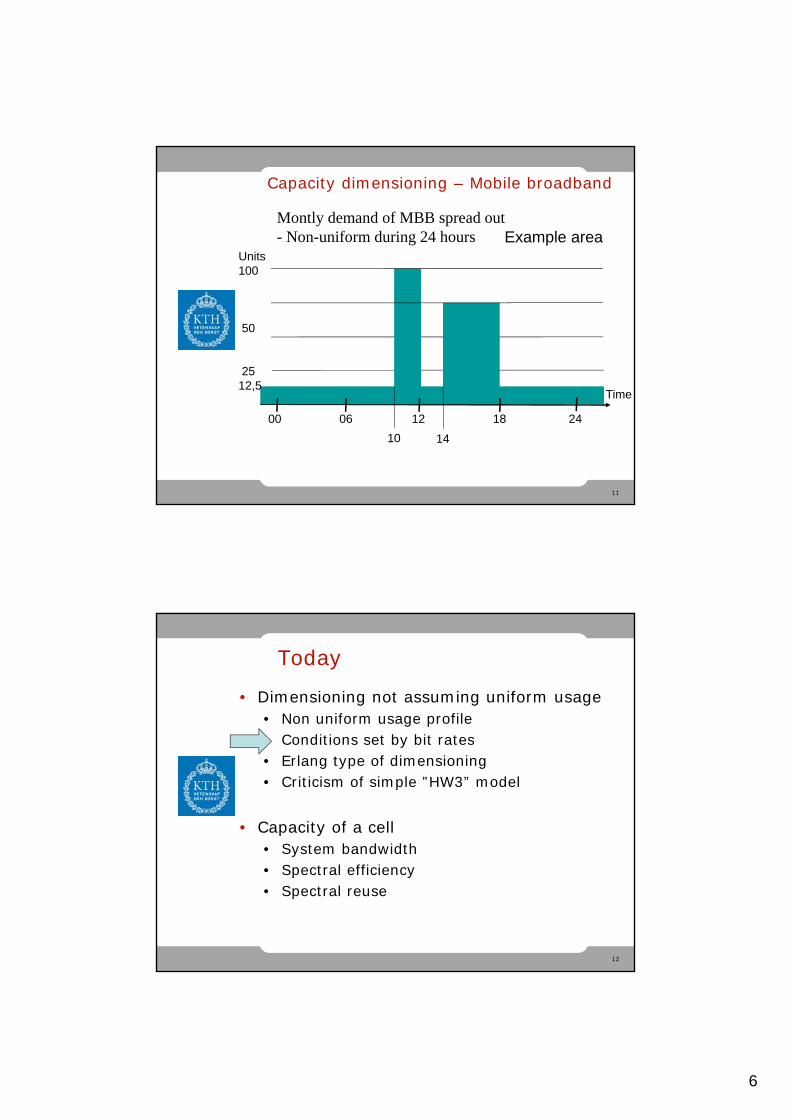
Capacity dimensioning – Mobile broadband
Montly demand of MBB spread out- Non-uniform during 24 hours
Time
Example area
00 06 12 18 24
10 14
Units100
50
2512,5
12
Today
• Dimensioning not assuming uniform usage• Non uniform usage profile• Conditions set by bit rates• Erlang type of dimensioning• Criticism of simple ”HW3” model
• Capacity of a cell• System bandwidth• Spectral efficiency• Spectral reuse

7
13
Conditions set by bit rates• What happens if there are requirements
on data rates?• Examples: 10 users per cell
1 Mbps per user10 Mbps per user
14
A short exercise: how many users can be served,- in a cell with capacities as below ?
Spectralefficiency
5 MHz of Spectrum
10 MHz of Spectrum
20 MHz of Spectrum
0,7 bps/Hz 3,5 MbpsA: 70 usersB: 4 users
7,0 Mbps 14 Mbps
2,0 bps/Hz 10 Mbps 20 Mbps 40 MbpsA: 800 usersB: 50 users
“user demand” • A: [ 5,4 GB/month; 8 hrs/day] => 50 kbps per user• B: [21,6 GB/month; 2 hrs/day] => 800 kbps per user

8
15
Today
• Dimensioning not assuming uniform usage• Non uniform usage profile• Conditions set by bit rates• Erlang type of dimensioning• Criticism of simple ”HW3” model
• Capacity of a cell• System bandwidth• Spectral efficiency• Spectral reuse
16

9
17
Cell planning and re-use
1
2
3 3
221
3
2
2
2
1
1
2
33
2
1
3
1
2
111
4
2
6 7
537
2
1
4
5
6
3
6
47
7
5
3
1
4
621
a) K= 7 b) K= 3
DD
18
Bandwidth for differents systems
LTE1.4MHz 3MHz 5MHz 10MHz 15MHz 20MHzRe-use: 1(2 with fractional frequency reuse)
UMTS, WCDMA 5MHz carriers5MHz 10MHz 15MHz 20 MHzRe-use: 1
GSM, N 200 kHz carriers• Voice: 8 time slots (calls) per carrier• Data: 9,6-59,2 kbps per time slot
max downlink 4*59,2 kbps = 236,8 kbps/carrierRe-use: 1, 3, 4, 7, 9

10
19
Today
• Dimensioning not assuming uniform usage• Non uniform usage profile• Conditions set by bit rates• Erlang type of dimensioning• Criticism of simple ”HW3” model
• Capacity of a cell• System bandwidth• Spectral efficiency• Spectral reuse
20
Peak data rate ~10 - 20 bps per Hz
Average data rate~1 -2 bps per Hz
Cell border rate < 0,10 bps per Hz
Spectral effiency
11
21
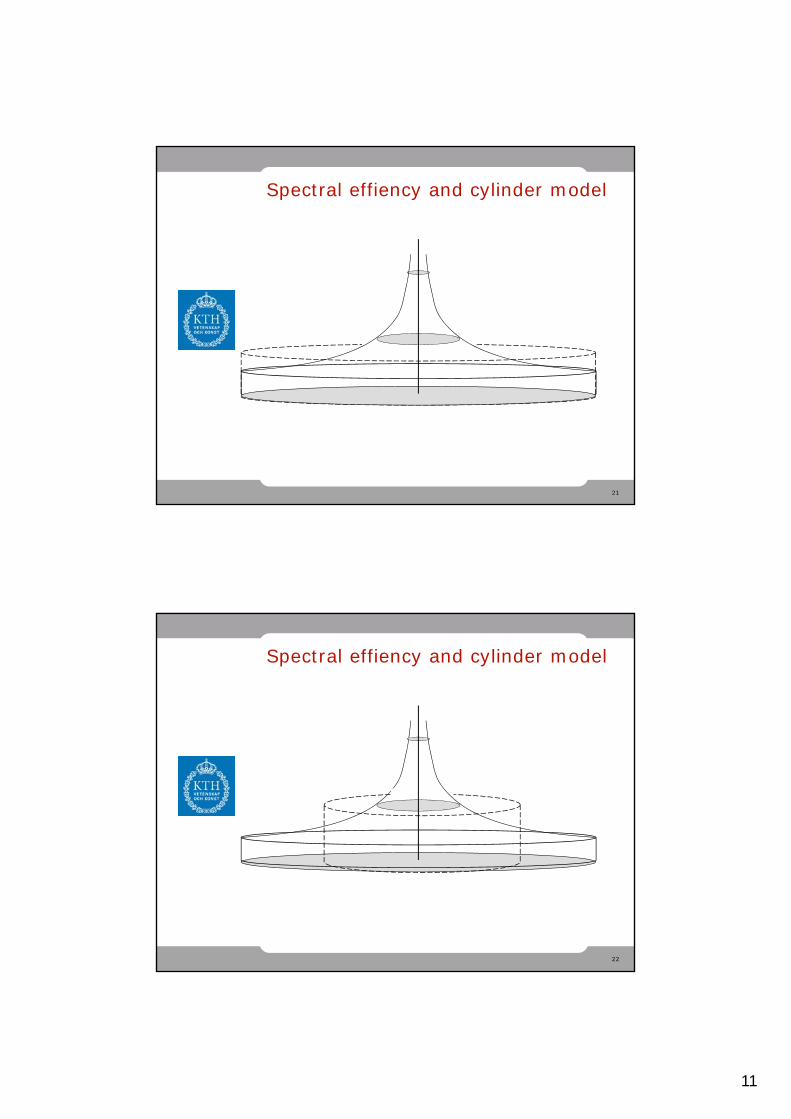
Spectral effiency and cylinder model
22
Spectral effiency and cylinder model

12
23
From Ericsson: Capital markets day, May 2008
24
Maximum throughput – LTE
Spectralefficiency(bps/Hz)
1,683,365,0410,0820,16

13
25
Dimensioning of mobile data- Non-uniform usage
Dimensioning of voice services(Thanks to Claes Beckman)
Jan MarkendahlDecember 12, 2016
26
Capacity dimensioning – The busy hour
00:0
0
01:0
0
02:0
0
03:0
0
04:0
0
05:0
0
06:0
0
07:0
0
08:0
0
09:0
0
10:0
0
11:0
0
12:0
0
13:0
0
14:0
0
15:0
0
16:0
0
17:0
0
18:0
0
19:0
0
20:0
0
21:0
0
22:0
0
23:0
0
Time
Cal
l Att
emp
ts
Capacity that is deployed
Blockedtraffic
14
27
TrafficAn Erlang is a unit of telecommunications traffic
measurement. Strictly speaking, an Erlang represents the continuous use of one voice path. In practice, it is used to describe the total traffic volume of one hour.
Example, if a group of users make 30 calls in one hour, and each call had an average call duration of 5 minutes, then the number of Erlangs this represents is worked out as follows:
Minutes of traffic in the hour = number of calls x duration Minutes of traffic in the hour = 30 x 5 = 150Hours of traffic in the hour = 150 / 60 = 2.5
Traffic figure= 2.5 Erlangs
28
Erlang BSeveral traffic models exist which share their name with the Erlang unit of traffic. They are formulae which can be used to estimate the number of lines required in a network, or to a central office (PSTN exchange lines).
Erlang B is the most commonly used traffic model, and is used to work out how many lines are required if the traffic figure (in Erlangs) during the busiest hour and the number of blocked calls are known. The model assumes that all blocked calls are immediately cleared.
http://www.erlang.com/calculator/erlb/
15
29
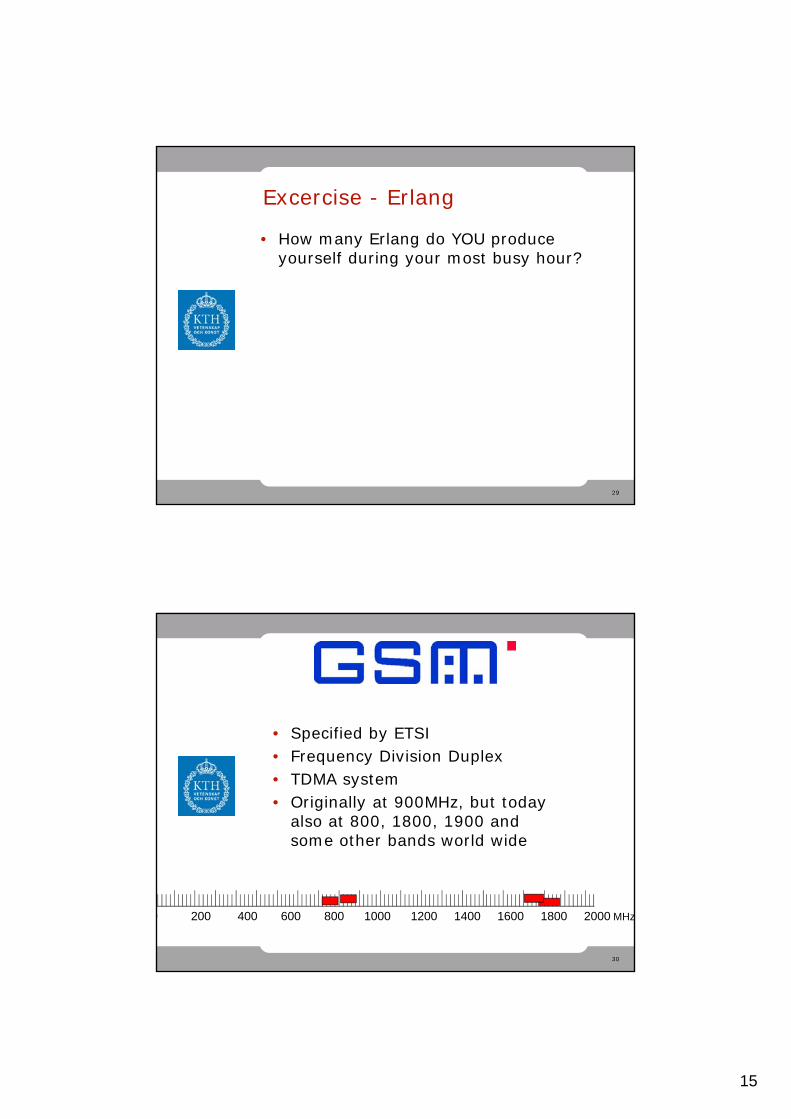
Excercise - Erlang
• How many Erlang do YOU produceyourself during your most busy hour?
30
• Specified by ETSI• Frequency Division Duplex• TDMA system• Originally at 900MHz, but today
also at 800, 1800, 1900 and some other bands world wide
0 200 400 600 800 1000 1200 1400 1600 1800 2000 MHz
16
31
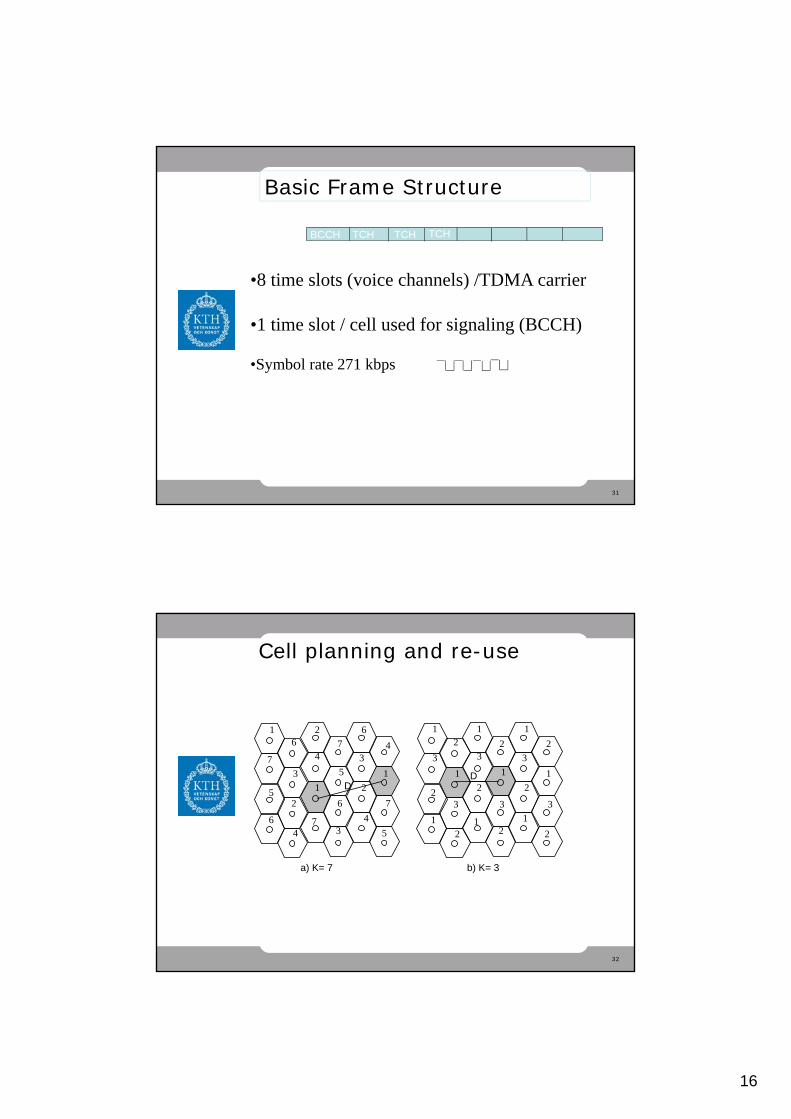
Basic Frame Structure
•8 time slots (voice channels) /TDMA carrier
•1 time slot / cell used for signaling (BCCH)
•Symbol rate 271 kbps
BCCH TCH TCHTCH
32
Cell planning and re-use
1
2
3 3
221
3
2
2
2
1
1
2
33
2
1
3
1
2
111
4
2
6 7
537
2
1
4
5
6
3
6
47
7
5
3
1
4
621
a) K= 7 b) K= 3
DD

17
33
Number of channels to use- Short exercise
How many voice channels per site in the cases
A. Bandwidth 2,8 MHz, re-use factor 7, omni antenna
B. Bandwidth 1,2 MHz, re-use factor 3, omni antenna
34
Number of channels to use- Short exercise
How many voice channels per site in the cases
A. Bandwidth 2,8 MHz, re-use factor 7, omni antennaNo carriers: 2,8/0,2= 14, No Carriers per site: 14/7 = 2
=> 2*8 = 16 voice channels (no signalling)
B. Bandwidth 1,2 MHz, re-use factor 3, omni antennaNo carriers: 1,2/0,2= 6, No Carriers per site: 6/3 = 2
A. => 2*8 = 16 voice channels (no signalling)

18
35
Network Capital requirements are a
function of peak demand
Service Revenues are a function of average
demand
Network Traffic Load
30mErlang is the statistical traffic per subscriber in busy hour.
Minutes of use is the sum of all traffic,i.e the blue area
36
Blocking in Cellular systems
• Typically we plan the voice capacity of our mobile phone systems for 2% blocking rate (98% availability)

19
37
An example• Bandwidth 1,2 MHz, re-use factor 3, three sectors• Assume that one channel will be used for control• No carriers:2• Total No cannels: 16• Usable No channels: 15
• 2% blocking => 9 Erlang
• How many 20mE users can be served? 9/(20*10-3) = 450• How many 50mE users can be served? 9/(50*10-3) = 180
38

20
39
The examples we did Dec 12• A and B from before, both leading to 2 carriers• How many 100 mE users can be served for cases K and L
Case availability No Ctrl channels No GPRS channelsK 90% 1 1L 99,9% 1 4
40
The examples we did Dec 12• A and B from before, both leading to 2 carriers• How many 100 mE users can be served for cases K and L
Case availability No Ctrl channels No GPRS channelsK 90% 1 1L 99,9% 1 4
Blocking prob No of voice channels Offered trafficK 10% 16-1-1= 14 11,47 EL 0,1% 16-1-4= 11 3,651 E
No users (100mE)K 114L 36

21
41