diin papr ri - docs.iza.org
TRANSCRIPT

DISCUSSION PAPER SERIES
IZA DP No. 12274
Susan NiknamiLena SchröderEskil Wadensjö
Ethnic Minority Youths in the Labour Markets in Denmark, Finland, Norway and Sweden
APRIL 2019

Any opinions expressed in this paper are those of the author(s) and not those of IZA. Research published in this series may include views on policy, but IZA takes no institutional policy positions. The IZA research network is committed to the IZA Guiding Principles of Research Integrity.The IZA Institute of Labor Economics is an independent economic research institute that conducts research in labor economics and offers evidence-based policy advice on labor market issues. Supported by the Deutsche Post Foundation, IZA runs the world’s largest network of economists, whose research aims to provide answers to the global labor market challenges of our time. Our key objective is to build bridges between academic research, policymakers and society.IZA Discussion Papers often represent preliminary work and are circulated to encourage discussion. Citation of such a paper should account for its provisional character. A revised version may be available directly from the author.
Schaumburg-Lippe-Straße 5–953113 Bonn, Germany
Phone: +49-228-3894-0Email: [email protected] www.iza.org
IZA – Institute of Labor Economics
DISCUSSION PAPER SERIES
ISSN: 2365-9793
IZA DP No. 12274
Ethnic Minority Youths in the Labour Markets in Denmark, Finland, Norway and Sweden
APRIL 2019
Susan NiknamiSOFI, Stockholm University
Lena SchröderSOFI, Stockholm University
Eskil WadensjöSOFI, Stockholm University and IZA

ABSTRACT
IZA DP No. 12274 APRIL 2019
Ethnic Minority Youths in the Labour Markets in Denmark, Finland, Norway and Sweden1
This paper uses administrative data to in detail document how the share of youths not in
employment, education or training has evolved over time in the Scandinavian countries.
We study both first- and second-generation immigrant youths as well as natives to explore
whether the pattern differ depending on the region of origin. We show that the NEET rates
are higher among youths with an immigrant background compared to youths with a native
background in all countries. Even when controlling for youth background characteristics,
first- and second-generation immigrant youths have significantly higher probability of being
in NEET compared to native youths.
JEL Classification: J15, J13, J61, J64
Keywords: ethnic minority youths, NEET, Nordic countries
Corresponding author:Eskil WadensjöSwedish Institute for Social ResearchUniversity of StockholmSE-106 91 StockholmSweden
E-mail: [email protected]
1 A shorter version of this paper has been published as Susan Niknami, Lena Schröder and Eskil Wadensjö,
”Minority ethnic youth in the Nordic labour market: Policy responses and outcomes”, Chapter 5, pp. 106–126 in
Rune Halvorsen and Bjørn Hvinden (eds.), Youth, Diversity and Employment. Comparative Perspectives on Labour
Market Policies, Edward Elgar Publishing, Cheltenham, 2018.
2
1. Introduction
There has been a dramatic increase in ethnic diversity in many European countries in the last
few years. Since 2015, more than 3 million migrants has been seeking asylum in Europe2. It
is hardly controversial to say that this recent trend has contributed to the debate on the
integration of immigrants into the labour market that has been dominating the political and
public agendas in the last years.
The labour market situation of immigrants has been studied by a large literature (e.g. Borjas
1994; Chiswick 1991). The general finding from this literature is that immigrants face
disadvantages in the labour market, with on average, both higher unemployment rates and
lower earnings compared to natives (e.g. Oreopoulos 2011). 3 While our understanding of the
labour market situation of immigrants has improved in the last decade, there is still limited
research on their children.4 This is mainly attributed to lack of high-quality administrative data
that link immigrants to their children as well as the difficulties in measuring youths’ labour
market situation. Many youths are in education and thus outside the labour force. Standard
labour market outcomes may therefore not reflect youth’s true labour market situation. A
perhaps better indicator of youth’s labour market opportunities is therefore the share of youth,
which are neither in employment, nor in education or training in the youth population, the so-
called NEET rate. This indicator is broader since it also includes youths outside the labour
force that are not in education or training. The NEET rates is however not available in most
datasets.
In this paper, we use high-quality administrative data on the entire youth populations in
Denmark, Finland, Norway and Sweden to in detail document how the NEET rates of the
children of immigrants has evolved over time compared to the children of natives in the
Scandinavian countries. The study asks whether the labour market situation of minority ethnic
youth improved or deteriorated in the last decade. The compressive data enables us to study
2 https://ec.europa.eu/eurostat/statistics-explained/index.php/Asylum_statistics 3 For Scandinavian results, see e.g. Andersson & Wadensjö (2004; 2012), Andersson et al (2014), Bratsberg et
al (2017), Bratsberg et al (2018), Gerdes & Wadensjö (2016), Sarvimäki & Kari-Hämäläinen (2016), Sarvimäki
(2017), Schultz-Nielsen (2017) and Åslund et al (2017). 4 For the youth labour market situation in the Scandinavian countries, we refer the reader to Celikaksoy &
Wadensjö (2015), ISF (2013), Olofsson & Wadensjö (2012), Olli Segendorf (2013) and Statistics Sweden
(2013).
3
both first- and second-generation immigrant youths and to explore whether the pattern differ
depending on the region of origin. Our results show that NEET rates are highest among first
generation immigrant youths and lowest among native youths. The NEET gap between
immigrant and native youths is highest in Denmark and Finland. The gap decreased between
1997 and 2007. After the economic crisis hit Scandinavia in 2007–2008 the gap has however
been increasing. Our findings further suggest that NEET rates increase with age and that being
in NEET is somewhat more common among women.
We further analyse the determinants of NEET and finally we examine what youths that are in
neither employment, education nor training do. In this analysis, we use individual level
administrative data from Swedish records with detailed information on both youth and
parental characteristics. We find that NEET rates decreases with parental education and with
years in Sweden. Even when controlling for youth background characteristics, first- and
second-generation immigrant youths have significantly higher probability of being in NEET
compared to native youths. The NEET gap is largest among first generation immigrant youths.
The Swedish data set has allowed us to we shed some light on what youths who are neither in
education, employment or training actually do. We find that most youths in NEET are in labor
force but are unemployed. Many youths are further on sick leave or disability insurance. A
significant amount of youths is further not found in any administrative registers. Among first
and second-generation immigrant youths with parents born in Western countries almost 2/3
are not found in any registers. One explanation could be unregistered emigration among those
two groups. They may have moved from Sweden but not reported it to the Tax Authority. This
means that the estimated labor market situation for these two groups could be biased.
The paper is structured as follows. Section 2 provides a brief overview of the Scandinavian
social protection systems. First, the Scandinavian immigration history is described, and then
the section compares income maintenance, social services and the social regulations of the
four countries. Section 3 describes our data and sample restrictions. Section 4 presents the
results, and Section 5 concludes. An online appendix provides additional results.

4
2. Policy context: reforms in Scandinavian social protection systems
The immigration to the Scandinavian countries has been very diverse. Moreover, the
Scandinavian countries have responded differently to immigration. Sweden was a country with
large labour migration from the 1940s after the end of WW2 up to the early 1970s. From the
1970s, the refugee migration has been larger than the labour migration. Until recently, Sweden
has been more positive to immigration and had a more liberal immigration policy than the
other Scandinavian countries. Denmark started receiving labour immigrants in the 1960s.
Later the refugee migration became larger. Today, Denmark has one of the most restrictive
immigration policies in Europe. Norway started to receive labour immigrants in the late 1960s
and still do so. In later decades, refugee migration has become more important. Norway has
an intermediary position in terms of immigration policy. Finland has been the exception with
net emigration until the 1980s and since then a moderate but increasing immigration of
refugees and labour migrants (Brochmann and Hagelund 2010, Kivisto and Wahlbeck 2013).
Yet, we may ask if we find a common pattern or approach to the inclusion of first and second-
generation migrants in Scandinavian social protection policy. The principle that everybody
with the same needs should be treated in the same way and receive the same type and amount
of services, whether in cash or in kind, has been a central pillar in the construction of the
Scandinavian welfare model. Scandinavian governments have aimed to minimise the overall
role of means-testing and fragmented insurance provisions by establishing universal access
services and by extending social protection to the entire population (Anttonen et al. 2012). In
the next paragraphs, we give a brief description of the main patterns in Scandinavian social
protection policy affecting the labour market inclusion of first and second-generation
migrants.

5
A. Income maintenance
Generally, each country’s rules for achieving legal residence have been a main factor in
limiting a person’s basic entitlement to income maintenance during periods out of paid work.
Hardly any provisions have been dependent on becoming naturalized and achieving a formal
citizenship in a Scandinavian country. However, we find a number of differentiations of
specific entitlements.
Entitlement to social insurance benefits has been conditional on a minimum duration of legal
residence in the country and the amount of earnings and tax contributions made as an
employee in the labour market. Young adults immigrating to the Scandinavian countries have
not been entitled such benefits until they have a sufficient record of labour market
participation and legal residence in the country. While newly arrived migrants with legal
residence have generally been eligible for means-tested financial assistance, payments in some
programmes may be lower than the regular social assistance payments. This has been the case
with the Danish Start Help and Introduction Allowance (Liebig, 2007).
The distinction between rights-based social security benefits and means-tested social
assistance implies a two-track system for income maintenance in the Scandinavian welfare
states: Young adults have qualified for social insurance benefits if they have a previous record
of labour market experience. Those with no or poor records of labour market participation
have been deferred to means-tested social assistance. This has often been the case for newly
arrived immigrants and young adults without a previous record of labour market experience
and earnings (or contributions). The scope for local discretion in defining the benefit level has
been greatest in Norway and most restricted in Denmark and Finland, with Sweden in an
intermediate position (Kuivalainen & Nelson, 2012).
Since the 1990s, Scandinavian governments have adjusted their income maintenance systems
on grounds of the changing demographic and economic conditions to strengthen the
sustainability of social benefit systems. The Scandinavian countries have introduced stricter
qualifying criteria and/or reduced the benefit levels to avoid disincentives in the income
maintenance system and reinforced their orientation towards employment-promoting active
measures – particularly in connection with young adults (Bonoli, 2010, Nelson, 2013).
6
B. Social services: education and active labour market policy measures
A prominent feature of Scandinavian social protection policy has attempts to avoid policy
efforts targeted exclusively at immigrants or their native-born children. With the exception of
Denmark (where some job-centres have started initiatives specially targeted at minority ethnic
youth in the age 15–17 years old), we find no specific strategies for minority ethnic youth.
Rather the general labour market inclusion policy and general youth policy are supposed to
meet also the needs of minority ethnic youth. One argument has been that targeted measures
would be stigmatizing. Yet, all countries have adopted measures for newly arrived
immigrants; the underlying assumption has been that only if they are newly arrived they have
special needs deriving from their immigration. The programmes and requirements differ
between the countries. Several of the countries have emphasized language training for
immigrants (Brochmann & Hagelund 2010).
Earlier studies of the role of educational systems for the labour market success of ethnic
minority youth are of interest as Norway and in particular Denmark, have extensive
apprenticeship systems, while Finland and Sweden have comprehensive educational systems.
These studies find that the apprenticeship system allows for smooth transitions to the labour
market for those who have gained access to an apprenticeship-training place. The drawback
of the apprenticeship system is, however, that the obstacles faced by many ethnic minority
youth at the point of labour market entry move upstream, to the point at which training slots
in the apprenticeship system are allocated. This has partly to do with discrimination and partly
with ethnic minority youth being less successful in school than other pupils (Brzinsky-Fay &
Nikolai 2008, Crul 2007, Worbs 2003, Herzog-Punzenberger 2003, Helland & Støren 2006
and OECD 2008).
C. Social regulation
In the 1960s, the Scandinavian countries ratified international human rights conventions
prohibiting discrimination on grounds of race, religion and ethnicity. While they adopted early
non-discrimination provisions in their penal code and the constitution to prevent negative
discrimination, the commitment was limited to ensure difference blindness and not
accommodate that difference. While the EU Racial Equality Directive (2000/43/EC) does not
explicitly mention the principle of reasonable accommodation, the directive allows for

7
positive action measures ‘to prevent or compensate for disadvantages linked to racial or ethnic
origin’.
Sweden adopted a law against ethnic discrimination in 1993 and later amended it in 1998 with
a special law against discrimination in working life (Proposition 1997/98). Thus, Sweden
anticipated the adoption of the Racial Equality Directive. The new Anti-Discrimination Act
2008 defined not only direct but also indirect discrimination as illegal. Borevi (2013:162)
argues that the new provision provides a legal entitlement to wear religious clothing in the
workplace. Under the new act employers are responsible for ensuring “that the working
conditions are suitable for all employees regardless of sex, ethnicity, religion or other belief”
(SFS 2008:567:3,4). In the aftermaths of the new statutory regulation several public
workplaces, e.g. Swedish Police and Swedish Armed Forces, have changed their dress code
policy accordingly (Borevi, ibid.). The new Anti-Discrimination Act also enlarged the
population protected against discrimination in working life. In addition to employees and
jobseekers, the antidiscrimination safeguards cover persons who make job enquiries and
persons applying for or undergoing work training.
Inspired by Sweden, Norway first introduced legislation against discrimination on grounds of
race, colour, national or ethnic origin in 1998 and adopted shadow legislation to the Race
Equality Directive in 2005 (EC/48/2000). Since 2002, regulations request all Norwegian state
enterprises to invite at least one job applicant with immigrant background for interview. Since
2007, all Norwegian state enterprises have been encouraged to adopt recruitment plans to
ensure the inclusion of immigrants and children of immigrants. In 2008, Norway adopted a
moderate quota for persons with two foreign-born parents. In 2008–2012 public employers
could choose to hire applicants with a minority background even if the applicant was ranked
behind the most qualified candidate (Orupabo et al., 2009, Government of Norway, 2011).
From 2012, public employers have to choose the applicant with a non-Western background if
the person has approximately the same qualifications.
Denmark transposed the Racial Equality Directive in 2003 but has been reluctant to provide
the opportunity to favour employees with an immigrant background in employment and
occupation in a transition period “and only in exceptional cases [made] juridical and political
allowance for minority rights and cultural claims based on minority status” (Hedetoft,
2006:403).

8
Finland transposed the Race Equality Directive in 2004. Since the adoption of the Act on the
Promotion of Integration of Immigrants 1386/2010 persons with an immigrant background
can be favoured in recruitment when the candidate’s qualifications otherwise are equal.
Additionally public employers must develop an equality action plan, identifying measures to
foster equality and prevent discrimination (Act on the Promotion of Integration of Immigrants
1386/2010, Finland).
Of the Scandinavian countries, Sweden has adopted the most and Denmark the fewest positive
action measures to improve the employment prospects of minority ethnic youth. Generally,
Denmark has had less employment protection than the other three countries. Whereas Sweden
and Norway do not impose specific obligations on employers regarding the identification of
barriers to equality, both countries mention in their administrative guidelines certain
techniques that an employer may carry out so as to identify barriers to equality (Craig, 2013).
So far, there is little systematic and documented knowledge about what impact the these
instruments of social regulation have had, if any, on the job prospects of minority ethnic youth.
As first step toward such knowledge, this chapter analyses how the employment possibilities
for minority ethnic youth have developed and how these developments differ between diverse
categories of minority ethnic youth in four Scandinavian countries, to the extent that the data
available have allowed us to make such analyses.
3. Data
Statistics Denmark, Statistics Finland, Statistics Norway and Statistics Sweden have collected
our data. The statistic agencies in Denmark, Finland and Norway have provided us with
compiled yearly national averages by gender, age and origin for the outcomes of interest in
the period 1997–2010.
For Sweden, the data are instead at the individual level and originate from several longitudinal
administrative registers maintained by Statistics Sweden. The Swedish data provide detailed
information on the entire population aged 16−65 each year from 1997 to 2010. There is for
instance information on a wide range of labour market, educational and demographic

9
characteristics. Because of the comprehensive individual data, we are able to make a more
detailed analysis on the labour market situation for the different groups of youths in Sweden.
The data sets of the four countries differ somewhat regarding the time period covered, the
demarcation of the youth age group and the definition of work and education. However, the
differences are rather small. The emphasis in this chapter is a comparison by country of origin
– natives with native-born parents and different groups of foreign born and their children.
Throughout, we use the NEET rate (Not in Employment, Education or Training) to measure
the labour market situation of youths. Unemployment, as it is often used, is a problematic
concept when applied to the labour market situation for young people (Statistics Sweden,
2013). Many young people are in education, meaning that a high unemployment rate among
young people in the labour force may stand for a high unemployment rate among a few being
in the labour force at that age, but a low unemployment rate if calculated among all those in
the cohort. A related problem is that the measure is affected by labour force exits, which
fluctuate with the economic cycle (Niknami & Schröder, 2014). Another problem is that one
form of youth education, apprenticeship training, is classified as work (getting a wage) and
other closely related forms of youth education as vocational school training is classified as
education (and not being in labour force). There are still other problems related to youth
unemployment because students who have found a job for the summer vacation and wait to
start it until the end of the study term are counted as unemployed. Another problem is also
that those who are studying full-time and look for a part-time job are classified as unemployed.
Belonging to the NEET group may mean many different things, as for example, being
unemployed, studying or working abroad, or being unable to work due to illness or disability.
We present the patterns of the NEET-rate over time among youths in each country and make
a cross-country comparison. In all cases, we divide the youths into five groups: 1) native born
with native-born parents, 2) native born with parents born in Western countries, 3) native born
with parents born in non-Western countries, 4) born in a Western country, and 5) born in a
non-Western country. For Sweden, we have continued with a more detailed description of the
labour market situation of youths. We examine the importance of different background
characteristics such as country of origin and parental educational background in explaining
that young people become NEET. The data for Sweden allow us to study what youths in

10
Sweden do when they are neither in employment nor in education or training. We have also
calculated the two individual components in the NEET rate – the proportion of in education
and the employment rate – for each country in the entire period. These tables are available
from the authors on request.
It should be noted that very few are native born with foreign-born parents in Finland (the
Finnish immigration history is short) so the information for those two groups is based on fewer
observations than for the other three groups in Finland and for the corresponding groups in
the other three countries. We also show tables containing information for one year, 2010. The
information is for the same five groups as the figures but for three age groups 15–18 (16–19;
18–19), 19–23 (20–24), and 24–28 (25–29) and for all, men and women. For Sweden, we
continue with a regression analysis to examine the effects of belonging to different groups
controlling for some characteristics.
4. Results
In this section, we present the NEET rates in the four countries. In all cases, we use the division
into five groups: 1) native born with native-born parents, 2) native born with parents born in
Western countries, 3) native born with parents born in non-Western countries, 4) born in a
Western country, and 5) born in a non-Western country. We present the development over
time for each country as well as a detailed description of the NEET rates in 2010. We then
compare the NEET rates in the four countries and examine what youth background
characteristics are important in explaining NEET. We further examine what youths in NEET
do and finally we show the robustness of our main results by presenting employment and
schooling rates in the four countries.
A. NEET rates
Denmark Figure 1 shows the development of the NEET rates in Denmark during the period 1997-2010
for the five groups of youths. As expected native born with native-born parents are more often
either in education or employment and those who were born in other countries have the lowest
share in either education or employment. The situation of the native born with foreign-born
parents is somewhere in between. Maybe a bit surprising for some participants in the public

11
debate is that the situation is more or less the same for those born in Western countries and
those born in non-Western countries, and that for native born with foreign born parents the
situation is about the same irrespective of if the parents were born in Western or non-Western
countries. The Figure further show that the NEET rates has been decreasing over years until
the economic crisis in 2008, where the NEET rates instead started to increase. The reduction
in NEET between 1997 and 2007 was most pronounced among youths born in a non-Western
country.
Table 1 compares the situation for the same five groups in 2010 with information for men and
women and three different age groups. The NEET rates are lowest among youths with native-
born parents and highest among youths born in a Western country. The pattern is similar for
men and women with exception for youths born outside Denmark. For these youths there exist
a gender gap in NEET. Among youths aged 24-28 born in a non-Western country the gender
gap in NEET is 46 per cent (0.159/0.349) and more than 50 per cent of women are in NEET.
With exception for native youths, the situation differ much between different age groups. The
NEET rate is higher for the older age groups and the differences are largest among first
generation immigrant youths. This patterns is potentially explained by teenagers being in
school to a larger extent
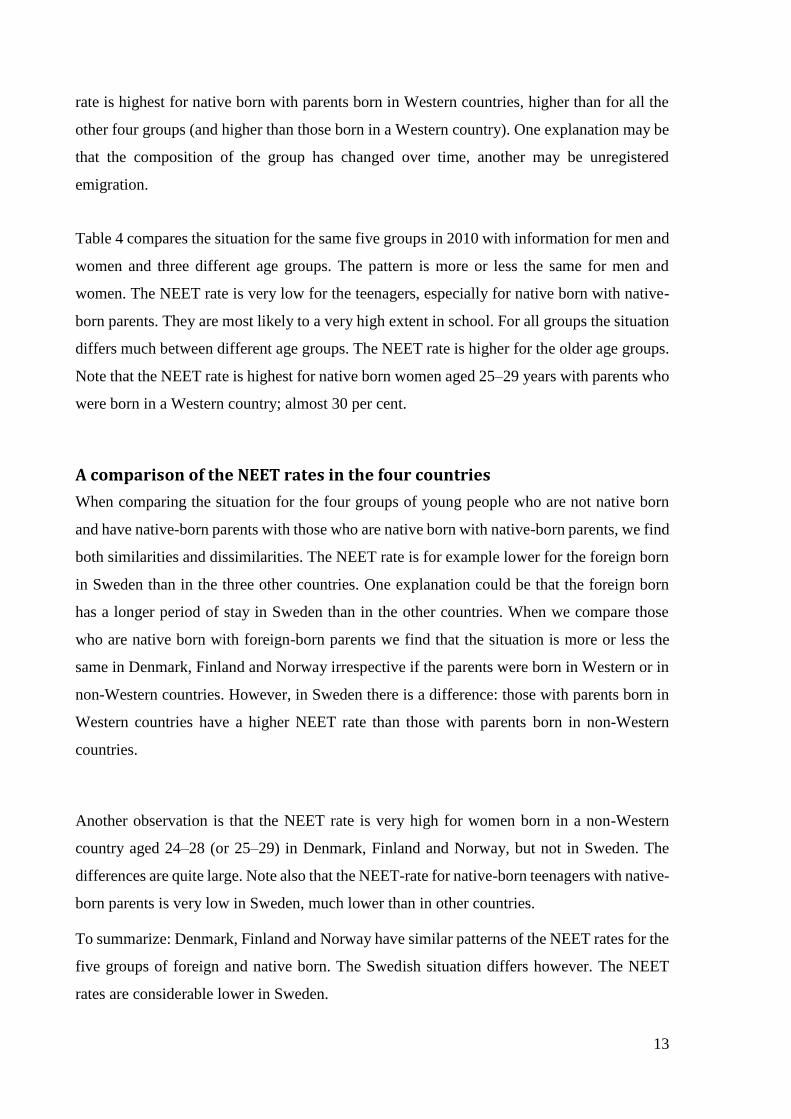
Finland
Figure 2 shows the development of the NEET rates in Finland during the period 1997-2010
for the five groups of youths. As expected native born with native born parents are in most
years more often either in education or employment and those who were born in other
countries have the lowest shares in either education or employment (but their NEET rates
decrease over time), and the native born with foreign born parents are found somewhere in
between. Note that differences between the three groups of native born are small. It should be
underlined that there in Finland are only a few native born with foreign-born parents. A bit
surprising is that the situation is more or less the same for those born in Western countries and
those born in non-Western countries in the end of the period studied. The general impression
from research is that those born in non-Western have more difficulties in establishing
themselves in the labour market.
12
Table 2 shows the situation for the same five groups in 2010 with information separately for
men and women and for three different age groups. The pattern differs between men and
women. For the four groups besides native born with native-born parents the situation differs
much between different age groups (missing value for one group). The NEET rate is higher
for the older age groups. Note that the NEET rate is highest for women aged 25–29 years born
in a non-Western country; almost 50 per cent.
Norway
Figure 3 shows the development in Norway for the five groups of young people. As expected
native born with native born parents are more often in either education or employment and
those who were born in other countries have the lowest share in either education or
employment (highest NEET rates), and the native born with foreign born parents have NEET
rates somewhere in between. Note that the differences between the three groups of native born
are rather small. The NEET rate is lower for those born in Western countries than for those
born in non-Western countries. The difference has increased over time. For the native born
the situation is more or less the same irrespective of if they were born in a Western or in a
non-Western country in the end of the period studied.
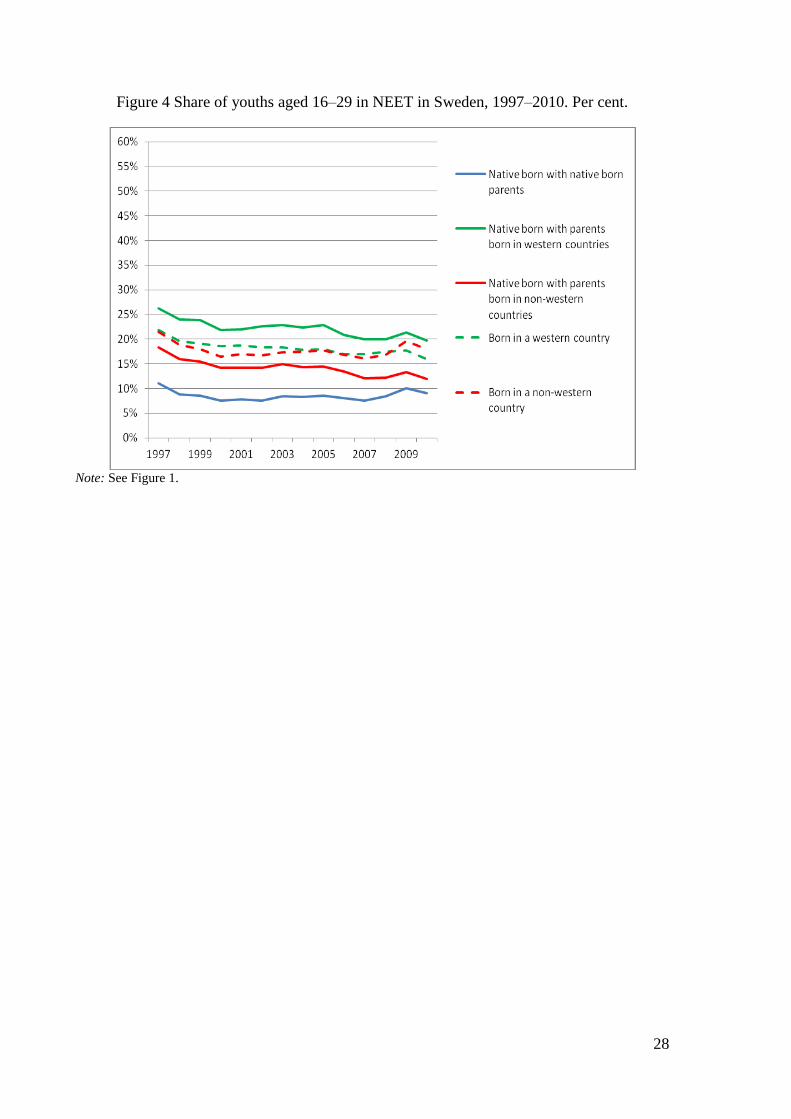
Table 3 compares the situation for the same five groups in 2010 with information for men and
women and for three different age groups. The pattern is similar for men and women. For the
four groups besides native born with native-born parents the situation differs much between
different age groups. The NEET rate is higher for the older age groups than for teenagers, but
less so for the native born with native-born parents and for those born in Western countries.
Note that the NEET rate is highest for women aged 25–29 years who were born in a non-
Western country; almost 45 per cent.
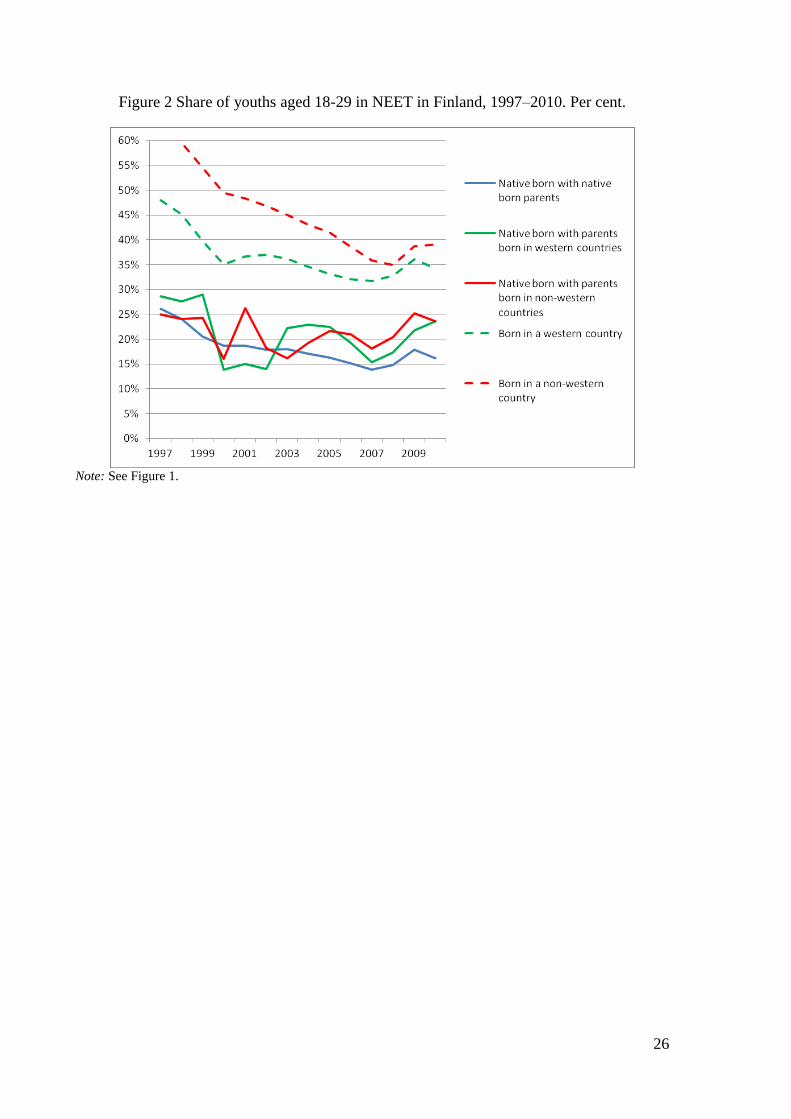
Sweden
Figure 4 shows the development in Sweden for the five groups of young people. As expected
native born with native-born parents are more often in either education or employment than
the other four groups. The differences between the five groups are smallest in Sweden. One
explanation could be that those who are foreign born have a longer duration of residence in
Sweden than what is the case for the foreign born in the other three Scandinavian countries.
(As we have individual data for Sweden only, the importance of duration of residence or age
at immigration cannot be analysed for the other countries). A bit surprising is that the NEET
13
rate is highest for native born with parents born in Western countries, higher than for all the
other four groups (and higher than those born in a Western country). One explanation may be
that the composition of the group has changed over time, another may be unregistered
emigration.
Table 4 compares the situation for the same five groups in 2010 with information for men and
women and three different age groups. The pattern is more or less the same for men and
women. The NEET rate is very low for the teenagers, especially for native born with native-
born parents. They are most likely to a very high extent in school. For all groups the situation
differs much between different age groups. The NEET rate is higher for the older age groups.
Note that the NEET rate is highest for native born women aged 25–29 years with parents who
were born in a Western country; almost 30 per cent.
A comparison of the NEET rates in the four countries
When comparing the situation for the four groups of young people who are not native born
and have native-born parents with those who are native born with native-born parents, we find
both similarities and dissimilarities. The NEET rate is for example lower for the foreign born
in Sweden than in the three other countries. One explanation could be that the foreign born
has a longer period of stay in Sweden than in the other countries. When we compare those
who are native born with foreign-born parents we find that the situation is more or less the
same in Denmark, Finland and Norway irrespective if the parents were born in Western or in
non-Western countries. However, in Sweden there is a difference: those with parents born in
Western countries have a higher NEET rate than those with parents born in non-Western
countries.
Another observation is that the NEET rate is very high for women born in a non-Western
country aged 24–28 (or 25–29) in Denmark, Finland and Norway, but not in Sweden. The
differences are quite large. Note also that the NEET-rate for native-born teenagers with native-
born parents is very low in Sweden, much lower than in other countries.
To summarize: Denmark, Finland and Norway have similar patterns of the NEET rates for the
five groups of foreign and native born. The Swedish situation differs however. The NEET
rates are considerable lower in Sweden.

14
B. Youth background characteristics and the probability of NEET
In this section, we explore what youth background characteristics are important in explaining
NEET. In particular, we investigate the importance of parental education, of living in an urban
area and years since immigration. The exercise is done for youths in Sweden, since we only
have individual level data for this group of youths. In Table 5, we show the estimation results
of the odds ratio of NEET being in education or employment in 2010. The results show that
female youths have a significantly lower probability of being in NEET. The probability of
being in NEET further increases with age. As expected, the odds ratio of being in NEET
decreases with parental education. The odds ratio of becoming a NEET is lower if living in an
urban area compared to a rural area. Even when controlling for youth background
characteristics, youths of immigrants have significantly higher odds ratios of NEET compared
to youths of natives. The probability of NEET is highest among first- and second-generation
immigrant youths with parents born in Western countries.
C. What do youths in NEET do?
In this section we shed some light on is what youths who are in neither education, employment
nor training do. The very compressive data enables us to explore this important question. We
divide the NEET group into six different categories: unemployment, other education, sick
leave or disability pension, parental leave a mixture and unknown. An individual is defined
as being unemployed if the individual is registered at the employment office in 2010. Other
education includes military service, compulsory education, labour market education and
Swedish language education. An individual is categorized as being on sick leave or early
retirement if the individual gets sick leave insurance or pension. The individual is further
categorized as being on parental leave if receiving parental benefits. The results are given in
Table 6. Column 1 reports the results for youths of native born parents, column 2 reports the
results for second generation immigrant youths with parents born in a Western country,
column 3 reports the results for second generation immigrant youths with parents born in non-
Western countries, column 4 show the results for first generation immigrant youths born in a
Western country and column 5 reports the findings for first generation immigrant youths born
in a non-Western country. Unemployment is an important category for all five groups.
“Unknown” is a much more important category for those who were born in a Western country

15
and those who are native born but have parents who were born in Western countries than for
the other three groups. One explanation could be unregistered emigration among those two
groups. They may have moved from Sweden but not reported it to the Tax Authority. It means
that the NEET rate for these two groups could be overestimated. The results further show that
almost one fourth of youths born in a non-Western country are on disability or sick leave
insurance.
D. Employment
In following section, we give some information on the employment rates of youths in the
Scandinavian countries.
Denmark
The employment of youths in Denmark in 2010 is given in Table A1. As mentioned, it is
country with a large share of the young people in apprenticeship training. The apprentices are
as earlier mentioned being classified as employed in the statistics. It means that the
employment rate is high for those aged 15–18 and 19–23 in Denmark compared to the
corresponding age groups in the other Nordic countries. The employment rate is not very much
higher for those who are 24–28 compared to those who are younger in Denmark and not higher
for those aged 24–28 than in the other Nordic countries.
Those with a foreign background have lower employment rates than the native born with
native-born parents. This is especially so for those who are not born in Denmark. For the
younger ones it is probably explained by fewer being apprentices and by the older ones by
that they have more difficulties in getting a job.
Finland
Finland has a vocational school system. It means that few of the teenagers are counted as
employed. The employment rate of teenagers is low in Finland compared to that in Denmark.
If we however compare those who are of an age when most have left the educational system,
we get more or less the same share in employment as in Denmark among the native born, see
Table A2. Note that the employment rate for those in that age is more or less the same for men

16
and women. The foreign-born have lower employment rates in most age and gender groups.
Remember that there are only a few who are native born with parents born outside Finland.
Norway
The employment of youths in Norway in 2010 is given in Table A3. Norway has as Denmark
an extensive apprenticeship system, but the first two of the four years are school based in
Norway. It may explain why Norway has a slightly lower employment rate among teenagers
than Denmark but a higher rate than Finland. The employment rate is for all the three age
groups and for both men and women higher for the native born with native-born parents than
for the four groups who have a foreign background. The employment rate in the oldest of the
three age groups is especially low among women who are born in a non-Western country.
Sweden
In Sweden, almost all young people continue to secondary school. It means that few teenagers
are in the labour market. Some teenagers have however a part-time job besides their studies
(classified as employed) or are looking for a part-time job (classified as unemployed). In Table
A4, it is revealed that the employment rates are low for all teenagers irrespective of origin, for
both natives and those with foreign background. The differences are however larger between
the older age groups: the employment rates are lower for those with a foreign background. It
indicates that those groups have more difficulties to establish themselves in the labour market
than the native born with native-born parents does.
Among those who are in their late twenties in Sweden, the employment rates are high
compared to those in Denmark and Finland and are more or less the same as in Norway.
Youths in employment, a comparison of Denmark and Sweden
As underlined, there are important differences between how different forms of vocational
education are classified – as education (vocational school) or as employment (apprenticeship).
It also means that the classification system leads to large differences in registered
employment. Denmark with a large share of the education in apprenticeship training and
Sweden with the training mainly in school are here the outliers among the four Nordic

17
countries studied. We will show it with the help of two figures showing the development of
the teenage employment shares for the two countries between 1997 and 2010.
In Figure A1, the development for Denmark is shown. The employment share is very high
even if it is declining somewhat over time. It is highest for the native born with native-born
parents (having better access to apprenticeship placement), slightly lower for those born in
Denmark with foreign-born parents and lowest for those who are foreign born.
As shown in Figure A2, the share of teenagers in employment is in contrast low in Sweden –
most of them in that age group are in school. Quite a few of them are however working besides
being in school; they often have short part time jobs (e.g. working weekends). The native born
with native-born parents have slightly higher employment rates than those with a foreign
background. One explanation could be that those with foreign background have more
difficulties in getting part-time jobs besides the schoolwork. The employment rate is more or
less the same for all groups with a foreign background.
E. Education
Here we present information on the share in education for young people in the countries
covered in our study. Remember that those in apprentice training are not classified as being
in education but as being employed in Denmark and Norway leading to large differences
between countries especially for the teenagers.
Denmark
In Table A5, we can see that only 37 per cent of the native-born teenagers with native-born
parents are classified as being in education in spite of the fact that the group we have
information on in Denmark is slightly younger than the corresponding groups in the other
three countries. The explanation is that many are employed by being apprentices (and
receiving pay for that). The pattern of the share in education is more or less the same for the
five groups with different origin. The share is slightly higher among teenagers for three of the
four groups with foreign background than for native born with native-born parents. An

18
explanation may be that they have more difficulties in getting apprenticeship places and they
more often choose theoretical study lines in secondary education.
Finland
The share of youths in education in Finland in 2010 is given in Table A6. The share in
education is higher in Finland than in Denmark among teenagers. The difference is explained
by the differences between the two educational systems. For those in their twenties the pattern
and the level is more or less the same in the two countries. For those with foreign background
the pattern and level is more or less the same as for those with native background with a few
exceptions. Remember that there are only few native born with foreign-born parents in
Finland, which may explain that the results are a bit surprising for some of the groups.
Norway
The share of youths in education in Norway in 2010 is given in Table A7. Norway has a partly
school-based, partly workplace based apprenticeship system. It explains that the share of the
teenagers classified as being in education is higher than in Denmark but a bit lower than in
Finland. Note that fewer aged 25–29 years are in education in Norway compared to those in
the other three countries. The share being in education is more or less the same irrespective of
native or foreign origin. An exception is that the native born with foreign-born parents more
often are in education than the natives with native-born parents are.
Sweden
Sweden is an outlier regarding the share being in education compared to the other three
countries. The explanation is that the secondary education is school-based but also that many
continue to higher education. The share of the teenagers being in education is much higher in
Sweden than in the other three countries and the shares are also higher in the other age groups,
see Table A8. The pattern is mainly the same for the five groups with different origin. The
main exception is that native born with parents from non-Western countries to a higher extent
than the four other groups of teenagers are in education. Those aged 20–24 with foreign
background are to a higher extent in education than native born with native-born parents.

19
Youths in education, a comparison of Denmark and Sweden
We will also here make a comparison between the two countries with lowest and highest rates
of young people classified as in education, Denmark and Sweden, and concentrate our
attention to the teenagers, the group for which the difference is largest.
From Figure A3, we can see the education rate is stable over time in Denmark and that it does
not differ much according to origin. Denmark is a typical apprenticeship country with many
teenagers (and some older ones also) in apprenticeship training. They get a wage and are
classified as employed. Figure A4 reports results from Sweden and shows a quite different
situation. The education rate is almost twice as high as in Denmark. The differences are rather
small between natives with native-born parents and those with foreign background. The rate
is slightly increasing over time.
5 Conclusion
In this paper, we study the labour market situation of first and second-generation immigrants
in the Scandinavian countries. The Scandinavian countries are similar in many respects but
there are important differences regarding the youth education system, especially regarding
the secondary education level. Due to that, different forms of education are classified in
different ways, it is not appropriate to compare unemployment, education, and employment
rates for teenagers and to some extent for those who are slightly older. It is much better to
compare the NEET rates.
We find higher NEET rates among the children of immigrants compared to the children of
natives in all countries. For those who are in the late twenties we find that the NEET rates
are lowest in Norway and Sweden, two countries with quite different educational systems.
The NEET rate is high in Denmark – the main apprenticeship country.

20
We find some striking differences between groups of different origin, indicating that the
employment problems are more pronounced for some groups with foreign background.

21
References
Andersson Joona, Pernilla and Eskil Wadensjö (2004), “Temporary employment agencies: a
route for immigrants to enter the labour market?” IZA DP 1090.
Andersson Joona, Pernilla and Eskil Wadensjö (2012), “A price for flexibility? The temp
agency wage gap in Sweden 1998–2008”, IZA DP 6587.
Andersson Joona, Pernilla, Nabanita Datta Gupta, and Eskil Wadensjö (2014),
“Overeducation among immigrants in Sweden: incidence, wage effects and state
dependence”, IZA Journal of Migration 3:9.
Ansala, Laura, Olof Åslund and Matti Sarvimäki (2018), “Immigration history, entry jobs,
and the labor market integration of immigrants”, IFAU Working Paper 2018:20.
Anttonen, Anneli, Liisa Häikiö and Kolbeinn Stefánsson (eds.) (2012), Welfare State,
Universalism and Diversity, Cheltenham, UK and Northampton, MA, USA: Edward Elgar
Publishing.
Åslund, Olof, Anders Forslund and Linus Liljeberg (2017), “Labour market entry of non-
labour migrants – Swedish evidence”, Nordic Economic Policy Review, pp. 115–158.
TemaNord 2017:520.
Bonoli, Giuliano (2010), “The political economy of active labor-market policy”, Politics and
Society, Vol. 38(4), pp. 435–457.
Borevi, Karin (2013), “Understanding Swedish Multiculturalism”, pp. 140–169 in Peter
Kivisto and Östen Wahlbeck (eds.) (2013), Debating Multiculturalism in the Nordic Welfare
States, London: Palgrave Macmillan.
Borjas, George J. (1994), “Economics of immigration”, Journal of Economic Literature, Vol.
32(4), pp. 1667–1717.
Bratsberg, Bernt, Oddbjørn Raaum and Knut Røed (2017), “Immigrant labor market
integration across admission classes”, Nordic Economic Policy Review, pp. 17–53. TemaNord
2017:520.
Bratsberg, Bernt, Oddbjørn Raaum and Knut Røed (2018), “Job loss and immigrant labour
market performance”, Economica, Vol. 85(337), pp. 124–151.
Brochmann, Grete and Anniken Hagelund (eds.) (2012), Immigration Policy and the
Scandinavian Welfare State 1945–2010, Basingstoke: Palgrave Macmillan.

22
Brzinsky-Fay, Christian and Rita Nikolai (2008), “What Difference Does It Make?
Educational Reforms and the Low-Qualified”, presented at the Sixteenth Annual Workshop
of the European Research Network on Transitions in Youth, Bamberg, Germany, 10–13
September 2008.
Çelikaksoy, Aycan, and Eskil Wadensjö (2015), “The unaccompanied refugee minors and the
Swedish labour market”, IZA DP 9306.
Chiswick, Barry (1991), “Speaking, Reading, and Earnings among Low-Skilled Immigrants”,
Journal of Labor Economics, Vol. 9 (2), pp. 149–170.
Craig, Ronald (2007), Systemic Discrimination in Employment and the Promotion of Ethnic
Equality, Leiden and Boston, MA: Martinus Nijhoff Publishers.
Crul, Maurice (2007), “Pathways to success for the children of immigrants”, Washington
D.C.: Bertelsmann Stiftung and Migration Policy Institute.
Gerdes, Christer, and Eskil Wadensjö (2016), “Post-enlargement migration and adjustment in
a receiving country: The case of Sweden”, pp. 123–138 in Martin Kahanec and Klaus F.
Zimmermann (eds.), Labor Migration, EU Enlargement, and the Great Recession, Berlin,
Heidelberg: Springer Press.
Government of Norway (2011), Velferd og migrasjon: Den norske modellens framtid, NOU
2011: 7.
Grönqvist, Hans, and Susan Niknami (2017), “The School Achievements of Refugee
Children: Lessons from Sweden”, Nordic Economic Policy Review, pp. 159–183. TemaNord
2017:520.
Hedetoft, Ulf (2006), “More than kin and less than kind: The Danish politics of ethnic
consensus and the pluralistic challenge”, in John Campbell, John Hall and Ove Pedersen
(eds.), National Identity and the Varieties of Capitalism: The Danish Experiment, Montreal
and Kingston: McGill-Queen’s University Press.
Helland, Håvard and Liv Anne Støren (2006), “Vocational Education and the Allocation of
Apprenticeships: Equal Chances for Applicants Regardless of Immigrant Background?”
European Sociological Review, Vol. 22(3), pp. 339–351.
Herzog-Punzenberger, Barbara (2003), “Ethnic Segmentation in School and Labor Market –
40 Year Legacy of Austrian Guestworker Policy”, International Migration Review, Vol.
37(4), pp. 1120–1144.

23
ISF (2013), Unga förtidspensionärer. Studie av sju europeiska länder, Stockholm: ISF.
Kivisto, Peter and Östen Wahlbeck (eds.) (2013), Debating Multiculturalism in the Nordic
Welfare States, London: Palgrave Macmillan.
Kuivalainen, Susan and Kenneth Nelson (2012), “Eroding minimum income protection in the
Nordic countries? Reassessing the Nordic model of social assistance”, in Jon Kvist, Johan
Fritzell, Bjørn Hvinden and Olli Kangas (eds.), Changing Social Equality: The Nordic
Welfare Model in the 21st Century, Bristol: Policy Press.
Liebig, Thomas (2007), “The labour market integration of immigrants in Denmark”, OECD
Social Employment and Migration Working Papers, No. 50, Paris: OECD.
Nelson, Kenneth (2011), “Social assistance and EU poverty thresholds 1990–2008: Are
European welfare systems providing just and fair protection against low income?”, European
Sociological Review, Vol. 29(2), pp. 386–401.
Niknami, Susan and Lena Schröder (2014), Bakom siffrorna – unga som varken arbetar eller
studerar, Expert report commissioned by the Swedish National Board for Youth Affairs.
OECD (2008), Jobs for Immigrants, volume 2. Labour market integration in Belgium, France,
the Netherlands and Portugal. Paris: OECD.
OECD (2010), Unequal Opportunities, the Labour Market Integration of the Children of
Immigrants. Paris: OECD.
Olli Segendorf, Åsa (2013), Unga i arbete i Norden, TemaNord 2013:572, Copenhagen:
Nordiska Ministerrådet.
Olofsson, Jonas and Eskil Wadensjö (2012), Youth, Education and Labour Market in the
Nordic Countries. Similar but not the same, Berlin: Friedrich Ebert Stiftung.
Oreopoulos, Philip (2011), “Why do skilled immigrants struggle in the labor market? A field
experiment with thirteen thousand resumes”, American Economic Journal: Economic
Policy, Vol. 3.4, pp 148–171.
Orupabo, Julia, Ragnhild Jensen and Aagoth Storvik (2009), Midtveisevaluering av forsøk
med moderat kvotering av personer med ikke-vestlig bakgrunn, Oslo: Institutt for
samfunnsforskning.
Rooth, Dan-Olof and Olof Åslund (2006), Utbildning och kunskaper i svenska –
framgångsfaktorer för invandrade? Stockholm: SNS Förlag.

24
Sarvimäki, Matti (2017), “Labor market integration of refugees in Finland”, Nordic Economic
Policy Review, pp. 91–114. TemaNord 2017:520.
Sarvimäki, Matti and Kari Hämäläinen (2016), “Integrating immigrants: The impact of
restructuring active labor market programs”, Journal of Labor Economics, Vol. 34(2), pp.
479–508.
Schultz-Nielsen, Marie Louise (2017), “Labour market integration of refugees in
Denmark”, Nordic Economic Policy Review, pp. 55–90. TemaNord 2017:520.
Statistics Sweden (2007), ”Ungdomar utan fullföljd gymnasieutbildning”, Tema: Utbildning
2007 nr 4, Stockholm: Statistics Sweden
Statistics Sweden (2008), ”Ungdomar utan fullföljd gymnasieutbildning – en undersökning
med många utmaningar”, Arbetsmarknads- och utbildningsstatistik, Bakgrundsfakta 2008:1,
Stockholm: Statistics Sweden.
Statistics Sweden (2013), ”Ungdomsarbetslöshet – jämförbarhet i statistiken mellan ett antal
europeiska länder”, Arbetsmarknads- och utbildningsstatistik. Bakgrundsfakta 2013:1,
Stockholm: Statistics Sweden.
Swedish Government (2008), Diskrimineringslag, 2008:567 (changed to SFS 2017:1128 after
amendment), Stockholm: Ministry of Culture.
SOU 2013:13, Ungdomar utanför gymnasieskolan – Ett förtydligat ansvar för stat och
kommun, Delbetänkande av utredningen om unga som varken arbetar eller studerar.
Worbs, Susanne (2003), “The Second Generation in Germany: Between School and Labor
Market”, International Migration Review, Vol. 37(4), pp. 1011–1038.

25
Figure 1 Share of youths aged 15–28 in NEET in Denmark, 1997–2010. Per cent.
Note: An individual is defined as being in education if (s)he is registered at compulsory school, upper secondary
school or university in October given year. An individual is defined as being employed if (s)he is registered as
employed in November given year. An individual is considered to be born in a Western country if (s)he was born
in: Australia, New Zealand, North America and Europe (only EU/EEA countries except the Nordic countries).
An individual is considered to be born in a non-Western country if (s)he was born in Africa, Asia (including
Turkey), Latin America, Oceania (except Australia and New Zealand) and Europe (except EU/EEA countries).
26
Figure 2 Share of youths aged 18-29 in NEET in Finland, 1997–2010. Per cent.
Note: See Figure 1.

27
Figure 3 Share of youths aged 16–29 in NEET in Norway, 2001–2011. Per cent.
Note: See Figure 1. If the country of origin of the mother is unknown, we have used the country of origin of the
father.
28
Figure 4 Share of youths aged 16–29 in NEET in Sweden, 1997–2010. Per cent.
Note: See Figure 1.

29
Table 1 Share of youths in NEET in Denmark in 2010. Per cent.
All Men Women
Native born with both parents native
born
Age 15 – 18 12.4 12.9 12.0
Age 19 – 23 17.8 18.6 17.0
Age 24 – 28 17.5 16.2 18.9
Native born with both parents born in Western countries (except the Nordic countries)
Age 15 – 18 17.3 18.3 16.3
Age 19 – 23 22.8 24.8 20.6
Age 24 – 28 27.5 31.3 23.8
Native born with both parents born in non-Western countries
Age 15 – 18 16.4 18.4 14.4
Age 19 – 23 25.0 27.2 22.6
Age 24 – 28 30.5 29.4 31.7
Born in a Western country (except the Nordic countries)
Age 15 – 18 27.8 26.2 29.4
Age 19 – 23 49.5 47.0 51.9
Age 24 – 28 40.0 37.3 42.9
Born in a non-Western country
Age 15 – 18 24.4 24.8 24.0
Age 19 – 23 38.7 4.9 42.6
Age 24 – 28 43.9 34.9 50.8
Note: See Figure 1.

30
Table 2 Share of youths in NEET in Finland in 2010. Per cent.
All Men Women
Native born with both parents native
born
Age 18 – 19 15.4 18.9 11.7
Age 20 – 24 17.4 20.6 14.1
Age 25 – 29 15.0 14.4 15.6
Native born with both parents born in Western countries (except the Nordic countries)
Age 18 – 19 20.5 28.3 9.4
Age 20 – 24 26.7 35.0 20.0
Age 25 – 29 28.6 21.4 42.9
Native born with both parents born in non-Western countries
Age 18 – 19 22.2 22.2 18.9
Age 20 – 24 26.7 25.0 20.7
Age 25 – 29 22.4 -- 20.6
Born in a Western country (except the Nordic countries)
Age 18 – 19 29.0 29.3 27.6
Age 20 – 24 36.6 34.8 36.5
Age 25 – 29 33.5 27.7 36.2
Born in a non-Western country
Age 18 – 19 39.2 42.4 35.5
Age 20 – 24 37.5 34.8 40.5
Age 25 –29 40.2 33.0 48.2
Note: See figure 1.
31
Table 3 Share of youths in NEET in Norway in 2010. Per cent.
All Men Women
Native born with both parents native
born
Age 16 – 19 6.1 6.8 5.4
Age 20 – 24 11.7 12.5 10.8
Age 25 – 29 12.2 11.8 12.7
Native born with mother born in Western countries(except the Nordic countries)*
Age 16 – 19 15.8 14.6 17.0
Age 20 – 24 16.5 17.1 15.9
Age 25 – 29 20.2 16.3 24.8
Native born with mother born in non-Western countries*
Age 16 – 19 9.7 10.4 9.0
Age 20 – 24 17.2 19.4 15.0
Age 25 – 29 21.5 19.1 24.1
Born in a Western country (except the Nordic countries)
Age 16 – 19 24.1 23.6 27.7
Age 20 – 24 32.9 29.6 36.3
Age 25 – 29 24.5 21.5 28.2
Born in a non-Western country
Age 16 – 19 27.8 31.9 22.8
Age 20 – 24 32.6 27.7 36.9
Age 25 – 29 35.5 27.3 43.5
Note: See Figure 1. * = in cases where the country of origin of the mother is unknown, the country of the
origin of the father is used.

32
Table 4 Share of youths in NEET in Sweden in 2010. Per cent.
All Men Women
Native born with both parents native
born
Age 16 – 19 3.6 3.9 2.7
Age 20 – 24 12.4 13.4 11.4
Age 25 – 29 10.4 10.5 10.3
Native born with both parents born in Western countries(except the Nordic countries)
Age 16 – 19 8.0 8.2 7.8
Age 20 – 24 18.5 20.5 16.5
Age 25 – 29 25.9 23.4 28.6
Native born with both parents born in non-Western countries
Age 16 – 19 6.0 6.9 5.1
Age 20 – 24 16.2 18.9 13.5
Age 25 – 29 18.7 18.3 19.1
Born in a Western country (except the Nordic countries)
Age 16 – 19 9.8 9.4 10.3
Age 20 – 24 19.1 19.6 18.5
Age 25 – 29 22.6 22.6 22.6
Born in a non-Western country
Age 16 – 19 12.0 12.0 12.0
Age 20 – 24 18.3 20.4 15.9
Age 25 – 29 21.9 22.4 21.2
Note: See Figure 1

33
Table 5 Youth background characteristics and the probability of NEET in 2010
Background characteristics Odds ratio
Female .86*
Age 16–19 (ref)
Age 20–24 3.59*
Age 25–29 3.06*
Native born with both parents native born reference category
(ref)
Native born with both parents born in Western countries 1.81*
Native born with both parents born in non-Western countries 1.35*
Born in a Western country 1.82*
Born in a non-Western country 1.59*
Education mother
Compulsory school mother (ref)
Upper secondary school mother .69*
University mother .50*
Unknown education mother 1.24*
Education father
Compulsory school father (ref)
Upper secondary school father .86*
University father .66*
Unknown education father 1.17*
Living in an urban area .84*
Migrated to Sweden 2005 or later 2.20*
Number of observations 1,351,618
Note: Estimates from a logit model. The dependent variable is set to one if the individual is not in education or
employment and zero otherwise. *= statistically significant at 1 %. All numbers are rounded to two decimals. See
Figure 1 for the division according to origin.

34
Table 6 Youths in NEET in Sweden in 2010. Per cent.
Native born
with both
parents
native born
Native
born with
both
parents
born in
Western
countries
Native born
with both
parents born
in non-
Western
countries
Born in a
Western
country
Born in a
non-Western
country
Unemployed 39.0 23.9 35.3 19.0 38.7
Other education 3.2 1.3 6,0 9.2 9.1
Sick leave, disability
pension
12.8 7.3 8.7 5.5 24.3
Parental leave 3.5 2.3 3.0 2.1 4.2
Mixture 10.5 3.6 7.2 4.3 11.9
Unknown 31.1 61.6 39.9 59.8 29.9
Number of
observations
106,005 524 8,739 898 15,706
Note: All numbers are rounded to one decimal. See Figure 1 for the division according to origin. An individual is
defined as 1) being unemployed if (s)he is registered at the employment office in 2010; 2) being in other education
if (s)he is in military service/education, compulsory education, labour market education, or is taking a Swedish
language course in 2010; 3) sick leave or early retirement if (s)he is getting income from sick leave insurance or
pension; 4) Parental leave if (s) is getting parental benefits in 2010; 5) unknown if (s)he is not found in 1)–4); 6) A
mixture if (s)he is registered in more than one of 1)–5)

35
Appendix: Additional Results
Table A1 Share of youths in employment in Denmark in 2010. Per cent.
All Men Women
Native born with both parents native
born
Age 15 –18 50.8 47.8 54.0
Age 19 – 23 66.1 65.2 67.0
Age 24 – 28 74.3 76.3 72.4
Native born with both parents born in Western countries (except the Nordic countries)
Age 15 – 18 47.9 42.2 53.8
Age 19 – 23 59.8 57.8 62.1
Age 24 – 28 66.1 63.5 68.7
Native born with both parents born in non-Western countries
Age 15 – 18 43.0 40.5 45.6
Age 19 – 23 54.9 55.1 54.8
Age 24 – 28 62.0 64.0 60.0
Born in a Western country (except the Nordic countries)
Age 15 – 18 31.4 30.1 32.7
Age 19 – 23 36.3 38.6 34.2
Age 24 – 28 54.1 57.2 50.6
Born in a non-Western country
Age 15 – 18 33.3 32.5 34.2
Age 19 – 23 46.3 50.2 42.4
Age 24 – 28 49.8 58.6 42.3
Note: See Figure 1.

36
Table A2 Share of youths in employment in Finland in 2010. Per cent.
All Men Women
Native born with both parents native
born
Age 18 –19 32.2 26.0 38.7
Age 20 – 24 56.5 53.1 60.2
Age 25 – 29 74.7 75.5 73.8
Native born with both parents born in Western countries (except the Nordic countries)
Age 18 – 19 37.2 32.6 43.8
Age 20 – 24 42.2 35.1 48.0
Age 25 – 29 57.1 78.6 14.3
Native born with both parents born in non-Western countries
Age 18 – 19 26.2 21.5 32.0
Age 20 – 24 55.5 49.6 62.1
Age 25 – 29 73.1 69.7 76.5
Born in a Western country (except the Nordic countries)
Age 18 – 19 29.1 25.4 32.6
Age 20 – 24 47.7 48.1 47.3
Age 25 – 29 58.3 61.4 54.7
Born in a non-Western country
Age 18 – 19 19.8 17.1 22.8
Age 20 – 24 41.8 44.8 38.5
Age 25 – 29 50.0 57.8 41.4
Note: See Figure 1.

37
Table A3 Share of youths in employment in Norway in 2010. Per cent.
All Men Women
Native born with both parents native born
Age 16 – 19 47.1 44.8 49.6
Age 20 – 24 71.7 71.8 71.5
Age 25 – 29 82,0 82.9 81.0
Native born with mother born in Western countries(except the Nordic countries)*
Age 16 – 19 33.7 27.8 39.6
Age 20 – 24 58.3 55.6 61.1
Age 25 – 29 74.3 78.1 69.9
Native born with mother born in non-Western countries*
Age 16 – 19 34.3 33.3 35.4
Age 20 – 24 64.8 62.7 67,0
Age 25 – 29 72.2 74.6 69.6
Born in a Western country (except the Nordic countries)
Age 16 – 19 29.7 29,0 30.3
Age 20 – 24 57.3 61.2 53.2
Age 25 – 29 73.4 77.1 68.8
Born in a non-Western country
Age 16 – 19 28.1 25.6 31.2
Age 20 – 24 51.7 56.0 48.0
Age 25 – 29 57.2 66.0 50.3
Note: See Figure 1. * = in cases where the country of origin of the mother is unknown, the country of the
origin of the father is used.

38
Table A4 Share of youths in employment in Sweden in 2010. Per cent.
All Men Women
Native born with both parents native
born
Age 16 – 19 20.4 19.1 21.7
Age 20 – 24 62.2 62.7 61.7
Age 25 – 29 78.3 79.4 77.0
Native born with both parents born in Western countries(except the Nordic countries)
Age 16 – 19 18.5 16.1 20.9
Age 20 – 24 47.4 48.6 46.2
Age 25 – 29 63.4 65.7 60.9
Native born with both parents born in non-Western countries
Age 16 – 19 11.7 10.5 12.9
Age 20 – 24 46.6 46.6 46.6
Age 25 – 29 68.3 69.6 66.8
Born in a Western country (except the Nordic countries)
Age 16 – 19 10.1 8.5 11.9
Age 20 – 24 37.7 37.1 38.4
Age 25 – 29 60.6 62.3 58.7
Born in a non-Western country
Age 16 – 19 11.9 11.5 12.3
Age 20 – 24 44.0 44.9 43.0
Age 25 – 29 63.6 65.1 61.9
Note: See Figure 1.

39
Table A5 Share of youths in education in Denmark in 2010. Per cent.
All Men Women
Native born with both parents native
born
Age 15 – 18 36.8 39.4 34.0
Age 19 – 23 16.1 16.2 16.0
Age 24 –28 8.1 7.5 8.8
Native born with both parents born in Western countries (except the Nordic countries)
Age 15 – 18 34.8 39.4 29.9
Age 19 – 23 17.4 17.5 17.2
Age 24 – 28 6.4 5.2 7.5
Native born with both parents born in non-Western countries
Age 15 – 18 40.6 41.1 40.0
Age 19 – 23 20.1 17.7 22.6
Age 24 – 28 7.5 6.6 8.3
Born in a Western country (except the Nordic countries)
Age 15 – 18 40.8 43.6 37.9
Age 19 – 23 14.2 14.4 14.0
Age 24 – 28 5.9 5.4 6.5
Born in a non-Western country
Age 15 – 18 42.3 42.7 41.8
Age 19 – 23 15.0 14.9 15.1
Age 24 – 28 6.3 5.6 6.9
Note: An individual is defined as being in education if (s)he is registered at compulsory school, upper secondary
school or university in October 2010 and is not employed in November 2010. See Figure 1 for the division
according to origin.

40
Table A6 Share of youths in education in Finland in 2010. Per cent.
All Men Women
Native born with both parents native
born
Age 18 – 19 49.6 50.4 48.7
Age 20 –24 24.4 24.3 24.5
Age 25 – 29 9.8 9.7 10.0
Native born with both parents born in Western countries (except the Nordic countries)
Age 18 – 19 41.0 37.0 46.9
Age 20 – 24 26.7 25.0 28.0
Age 25 – 29 14.3 0.0 42.9
Native born with both parents born in non-Western countries
Age 18 – 19 51.2 53.0 49.1
Age 20 – 24 16.6 16.0 17.2
Age 25 – 29 4.5 6.1 2.9
Born in a Western country (except the Nordic countries)
Age 18 – 19 40.6 42.2 39.1
Age 20 – 24 14.9 14.6 15.3
Age 25 – 29 7.8 7.1 8.6
Born in a non-Western country
Age 18 – 19 40.5 39.8 41.3
Age 20 – 24 19.9 19.7 20.2
Age 25 – 29 9.5 9.0 10.0
Note: An individual is defined as being in education if (s)he is registered at compulsory school, upper secondary
school or university in December 2010 and is not employed in December 2010. See Figure 1 for the division
according to origin.

41
Table A7 Share of youths in education in Norway in 2010. Per cent.
All Men Women
Native born with both parents native
born
Age 16 – 19 46.8 48.4 45.0
Age 20 – 24 16.6 15.6 17.7
Age 25 – 29 5.8 5.3 6.4
Native born with mother born in Western countries(except the Nordic countries)*
Age 16 – 19 56.0 57.5 43.4
Age 20 – 24 18.0 27.2 23.0
Age 25 – 29 6.3 5.6 5.2
Native born with mother born in non-Western countries*
Age 16 – 19 50.5 56.3 55.6
Age 20 – 24 25.2 17.9 18.1
Age 25 – 29 5.4 6.3 6.3
Born in a Western country (except the Nordic countries)
Age 16 – 19 46.2 47.4 45.0
Age 20 – 24 9.8 9.1 10.5
Age 25 – 29 2.1 1.5 2.9
Born in a non-Western country
Age 16 – 19 44.1 42.5 46.0
Age 20 – 24 15.7 16.3 15.1
Age 25 – 29 7.0 6.7 7.2
Note: An individual is defined as being in education if (s)he is registered at upper secondary school or university
in October 2010 and is not employed in November 2010. * = in cases where the country of origin of the mother is
unknown, the country of origin of the father is used. See Figure 1 for the division according to origin.

42
Table A8 Share of youths in education in Sweden in 2010. Per cent.
All Men Women
Native born with both parents native
born
Age 16 –19 70.4 71.1 69.7
Age 20 – 24 23.0 21.4 24.6
Age 25 – 29 10.8 9.6 12.0
Native born with both parents born in Western countries(except the Nordic countries)
Age 16 – 19 65.4 68.1 62.8
Age 20 – 24 31.7 28.0 35.5
Age 25 – 29 10.2 10.1 10.3
Native born with both parents born in non-Western countries
Age 16 – 19 77.7 77.7 77.6
Age 20 – 24 33.2 30.3 36.4
Age 25 – 29 12.1 11.2 13.0
Born in a Western country (except the Nordic countries)
Age 16 – 19 73.7 76.2 70.9
Age 20 – 24 39.7 39.8 39.4
Age 25 – 29 15.8 13.9 17.9
Born in a non-Western country
Age 16 – 19 70.9 70.9 71.0
Age 20 – 24 33.1 29.8 36.7
Age 25 – 29 13.3 11.3 15.5
Note: An individual is defined as being in education if (s)he is registered at upper secondary school or adult
education during fall 2010, or at university during spring and/or fall 2010 and is not employed in November 2010.
See Figure 1 for the division according to origin.

43
Figure A1 Share of youths aged 15–18 in employment in Denmark, 1997–2010. Per cent.
Note: See Figure 1.
Figure A2 Share of youths aged 16–19 in employment in Sweden 1997–2010. Per cent.
Note: See Figure 1.

44
Figure A3 Share of youths aged 15–18 who are studying in Denmark, 1997–2010. Per cent.
Note: An individual is defined as being in education if (s)he is registered at compulsory school, upper secondary
school or university in October and is not employed in November. See Figure 1 for the division according to
origin.
Figure A4 Share of youths aged 16–19 who study in Sweden 1997–2010. Per cent.
Note: An individual is defined as being in education if (s)he is registered at upper secondary school or adult
education during fall 2010, or at university during spring and/or fall and is not employed in November. See
Figure 1 for the division according to origin.