digital storage oscilloscope logic analyzer - … humidity: < 85% temperature: 0°cto 5. ... this...
TRANSCRIPT

Digital Storage Oscilloscope Logic Analyzer GDS-2000 Series & GLA-1000 Series
Training MANUAL GW INSTEK PART NO. 82DB-02000MA1
ISO-9001 CERTIFIED MANUFACTURER

This manual contains proprietary information, which is protected by copyrights. All rights are reserved. No part of this manual may be photocopied, reproduced or translated to another language without prior written consent of Good Will company.
The information in this manual was correct at the time of printing. However, Good Will continues to improve products and reserves the rights to change specification, equipment, and maintenance procedures at any time without notice.
Good Will Instrument Co., Ltd. No. 7-1, Jhongsing Rd., Tucheng Dist., New Taipei City 236, Taiwan.

TABLE OF CONTENTS
3
Table of Contents SAFETY INSTRUCTION .................................................... 5
OVERVIEW ...................................................................... 7
GDS-2000 TUTORIAL ....................................................... 8
GDS-2000 Overview ............................... 9
1. Power up GDS-2000 ......................... 11
2. Set up the Environment ................... 12
3. Connect and View a Waveform ......... 13
4. Measure the Waveform .................... 14
5. Adjust Waveform Scale and Position 15
6. Compensate the Probe ..................... 16
7. Save Data Using Hardcopy Function 17
GDS-2000 ADVANCED ................................................... 18
Demo Board Overview ......................... 19
GDS-2000 Demonstration Setup .......... 20
1GSa/s & Single Shot .......................... 22
Automatic Measurement (Delay) ......... 24
Automatic Measurement (Overshoot) .. 25
Frequency Modulation (FM) ................. 26
Long Memory ....................................... 27
Peak Detection ..................................... 28
Peak Detection + Long Memory ........... 29
Pulse Width Trigger .............................. 31
Roll / Scan Mode ................................. 32
X-Y Mode ............................................. 33
GLA-1000 ADVANCED .................................................... 34
GLA-1000 Overview .............................. 35
GLA-1000 Demonstration Setup ........... 36

GDS-2000 Series Training Manual
DAC Simulation ................................... 38
I2C Bus Analysis ................................... 41
SPI Bus Analysis .................................. 42
UART Analysis ..................................... 43
APPENDIX ...................................................................... 44
Sine Wave Frequency Adjustment ......... 44
Demo Board Signal List ....................... 45

SAFETY INSTRUCTION
5
SAFETY INSTRUCTION This chapter contains important safety instructions that you must follow when operating or storing the demo board designed for GDS-2000 and GLA-1000. For safety instructions regarding GDS and GLA, refer to their user manuals.
Safety Symbols
These safety symbols may appear in this manual.
WARNING Warning: Identifies conditions or practices that could result in injury or loss of life.
CAUTION Caution: Identifies conditions or practices that could result in damage to GDS-2000 or to other properties.
Attention Refer to the Manual

GDS-2000 Series Training Manual
6
Safety Guidelines
General Guideline
CAUTION
Do not place any heavy object on the instruments.
Avoid severe impacts or rough handling that leads to damaging the instruments.
Do not discharge static electricity to the instruments.
Use only mating connectors, not bare wires, for the terminals.
Do not disassemble the instruments unless you are qualified.
Power Supply
WARNING
Input voltage: DC 5V
The power supply voltage should not fluctuate more than 10%.
Operation Environment
Location: Indoor, no direct sunlight, dust free, almost non-conductive pollution (Note below)
Relative Humidity: < 80%
Altitude: < 2000m
Temperature: 0°C to 50°C
(Pollution Degree) EN 61010-1:2001 specifies the pollution degrees and their requirements as follows. GDS-2000 and the Training Kit fall under degree 2.Pollution refers to “addition of foreign matter, solid, liquid, or gaseous (ionized gases), that may produce a reduction of dielectric strength or surface resistivity”.
Pollution degree 1: No pollution or only dry, non-conductive pollution occurs. The pollution has no influence.
Pollution degree 2: Normally only non-conductive pollution occurs. Occasionally, however, a temporary conductivity caused by condensation must be expected.
Pollution degree 3: Conductive pollution occurs, or dry, non-conductive pollution occurs which becomes conductive due to condensation which is expected. In such conditions, equipment is normally protected against exposure to direct sunlight, precipitation, and full wind pressure, but neither temperature nor humidity is controlled.
Storage environment
Location: Indoor
Relative Humidity: < 85%
Temperature: 0°C to 50°C

OVERVIEW
7
OVERVIEW
What this document is about
This manual describes tutorials of GDS-2000 digital storage oscilloscope and demonstrations of advanced features in GDS-2000 and GLA series logic analyzers using the demo board. The following contents are included.
GDS-2000 tutorial: This chapter teaches you basic functionalities of GDS-2000 in a step-by-step manner, from powering up to saving files.
GDS-2000 advanced: This chapter introduces how to demonstrate GDS-2000 advanced features using the demo board.
GLA-1000 advanced: This chapter introduces how to demonstrate advanced features of GLA series logic analyzers.
For more details about GDS-2000 and GLA-1000 series, refer to the user manuals.
Whom this document is for
This document is written for novice and intermediate users of oscilloscope. The following is the list of typical audience.
Students who want to learn the basic oscilloscope operation
Sales representatives who need to introduce advanced GDS-2000 / GLA features to their clients
Engineers who need comprehensive signal generator for oscilloscope and logic analyzer applications
When you finish running the tutorial and demonstrations, you will feel comfortable observing real-life application signals on your own.

GDS-2000 Series Training Manual
8
GDS-2000 TUTORIAL The GDS-2000 tutorial is intended for novice users who are unfamiliar with GDS-2000 operation or oscilloscope in general.
For theoretical aspects of oscilloscope, consult other resources. Below is the list of useful websites.
Wikipedia oscilloscope entry (http://en.wikipedia.org/wiki/Oscilloscope)
Oscilloscope tutorial (https://www.cs.tcd.ie/courses/baict/bac/jf/labs/scope/oscilloscope.html)
Tutorial contents
The tutorial simulates power up, setup, signal viewing, measurement, probe compensation, and saving data. Each tutorial step builds upon the previous step, so run them in order.
1. Power up
2. Environment setup
3. Waveform connection and viewing
4. Waveform measurement
5. Waveform scale and position adjustment
6. Probe compensation
7. Data saving
Required tools
GDS-2000 x 1
Standard oscilloscope probe x 1
GDS-2000 TUTORIAL
9
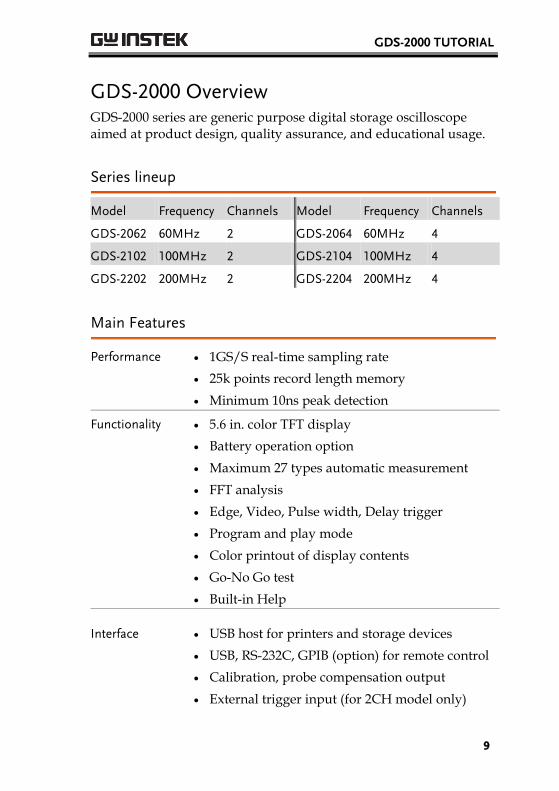
GDS-2000 Overview GDS-2000 series are generic purpose digital storage oscilloscope aimed at product design, quality assurance, and educational usage.
Series lineup
Model Frequency Channels Model Frequency Channels
GDS-2062 60MHz 2 GDS-2064 60MHz 4
GDS-2102 100MHz 2 GDS-2104 100MHz 4
GDS-2202 200MHz 2 GDS-2204 200MHz 4
Main Features
Performance 1GS/S real-time sampling rate
25k points record length memory
Minimum 10ns peak detection
Functionality 5.6 in. color TFT display
Battery operation option
Maximum 27 types automatic measurement
FFT analysis
Edge, Video, Pulse width, Delay trigger
Program and play mode
Color printout of display contents
Go-No Go test
Built-in Help
Interface USB host for printers and storage devices
USB, RS-232C, GPIB (option) for remote control
Calibration, probe compensation output
External trigger input (for 2CH model only)
GDS-2000 Series Training Manual
10
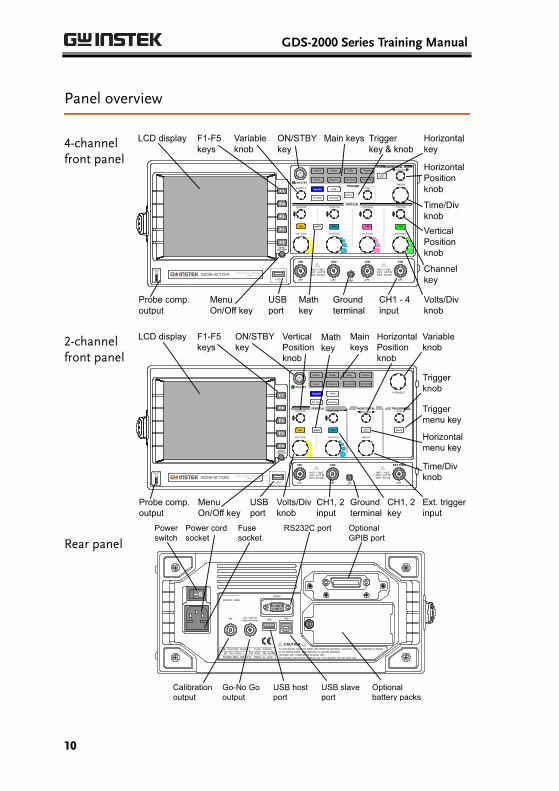
Panel overview
4-channel front panel
2-channel front panel
Rear panel
GDS-2000 TUTORIAL
11
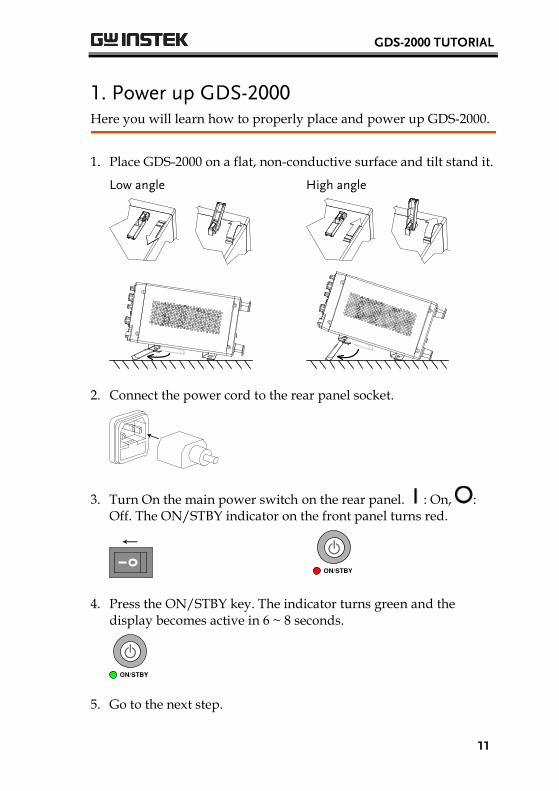
1. Power up GDS-2000 Here you will learn how to properly place and power up GDS-2000.
1. Place GDS-2000 on a flat, non-conductive surface and tilt stand it.
Low angle
High angle
2. Connect the power cord to the rear panel socket.
3. Turn On the main power switch on the rear panel. : On, : Off. The ON/STBY indicator on the front panel turns red.
4. Press the ON/STBY key. The indicator turns green and the display becomes active in 6 ~ 8 seconds.
5. Go to the next step.
GDS-2000 Series Training Manual
12
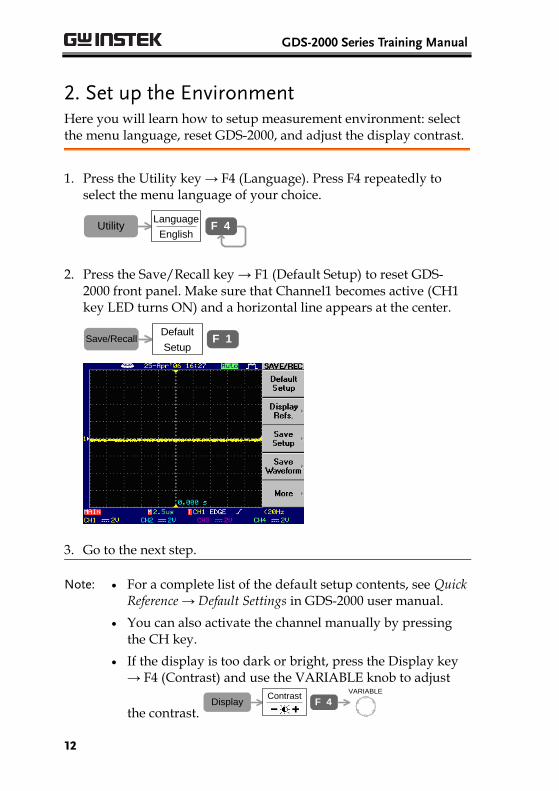
2. Set up the Environment Here you will learn how to setup measurement environment: select the menu language, reset GDS-2000, and adjust the display contrast.
1. Press the Utility key → F4 (Language). Press F4 repeatedly to select the menu language of your choice.
UtilityLanguage
EnglishF 4
2. Press the Save/Recall key → F1 (Default Setup) to reset GDS-2000 front panel. Make sure that Channel1 becomes active (CH1 key LED turns ON) and a horizontal line appears at the center.
Save/RecallDefault
SetupF 1
3. Go to the next step.
Note: For a complete list of the default setup contents, see Quick Reference → Default Settings in GDS-2000 user manual.
You can also activate the channel manually by pressing the CH key.
If the display is too dark or bright, press the Display key → F4 (Contrast) and use the VARIABLE knob to adjust
the contrast. Display
ContrastF 4
VARIABLE
GDS-2000 TUTORIAL
13
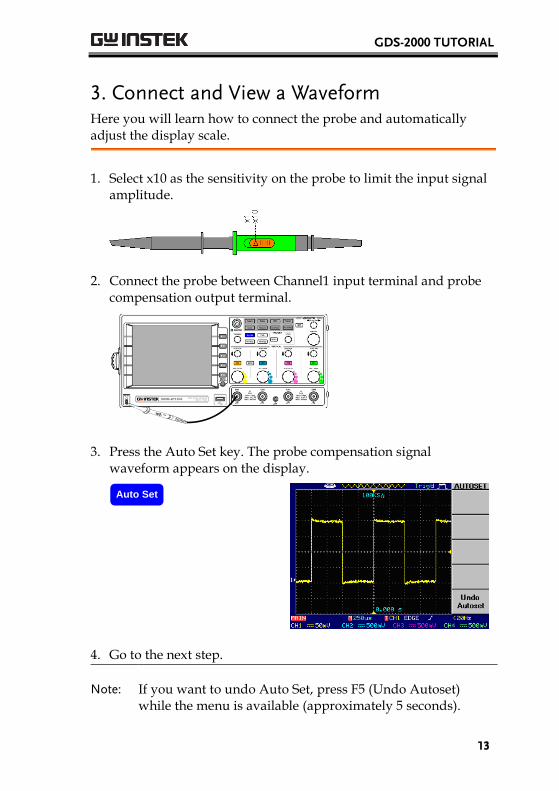
3. Connect and View a Waveform Here you will learn how to connect the probe and automatically adjust the display scale.
1. Select x10 as the sensitivity on the probe to limit the input signal amplitude.
2. Connect the probe between Channel1 input terminal and probe compensation output terminal.
X10
X1
3. Press the Auto Set key. The probe compensation signal waveform appears on the display.
Auto Set
4. Go to the next step.
Note: If you want to undo Auto Set, press F5 (Undo Autoset) while the menu is available (approximately 5 seconds).

GDS-2000 Series Training Manual
14
4. Measure the Waveform Here you will learn how to automatically measure the voltage, frequency, and timing of the signal waveform.
1. Press the Measure key. GDS-2000 automatically measures five major attributes of input signal and displays them in the menu.
Measure
2. Press the Measure key again, then F1 (CH1). The voltage, frequency, and timing of CH1 waveform appear on the display.
Measure CH1 F 1
3. Press F5 (OFF) to cancel measurement and reset the display.
OFF F 5
4. Go to the next step.
Note: You can also measure the waveform using the Cursor function. For details, see Measurement → Automatic Measurement and Cursor Measurement in the user manual.

GDS-2000 TUTORIAL
15
5. Adjust Waveform Scale and Position Here you will learn how to manually change the horizontal and vertical scale and move the waveform position.
1. Turn the TIME/DIV knob clockwise by one notch to change the horizontal scale to 100us/div.
TIME/DIV
2. Turn the horizontal POSITION knob counter-clockwise, until the waveform edge moves three divisions to the left.
POSITION
3. Turn the Channel1 VOLTS/DIV knob clockwise by one notch to change the vertical scale to 20mV/div.
VOLTS/DIV
4. Turn the vertical POSITION knob counter-clockwise, until the waveform edge is located at two divisions above the center.
POSITION
5. Go to the next step.
Note: For details, see Configuration → Horizontal View and Vertical View in the user manual.

GDS-2000 Series Training Manual
16
6. Compensate the Probe Here you will learn how to adjust probe sensitivity by compensating overshoot or undershoot.
1. Press the Acquire key → F3 (Average). Press F3 repeatedly until the average number becomes 16.
Average
16F 3Acquire
2. Adjust the probe to make the waveform edge flat.
Under compensation
Normal
Over compensation
3. Press the Auto Set key and view the compensated waveform.
Auto Set
4. Go to the next step.
GDS-2000 TUTORIAL
17
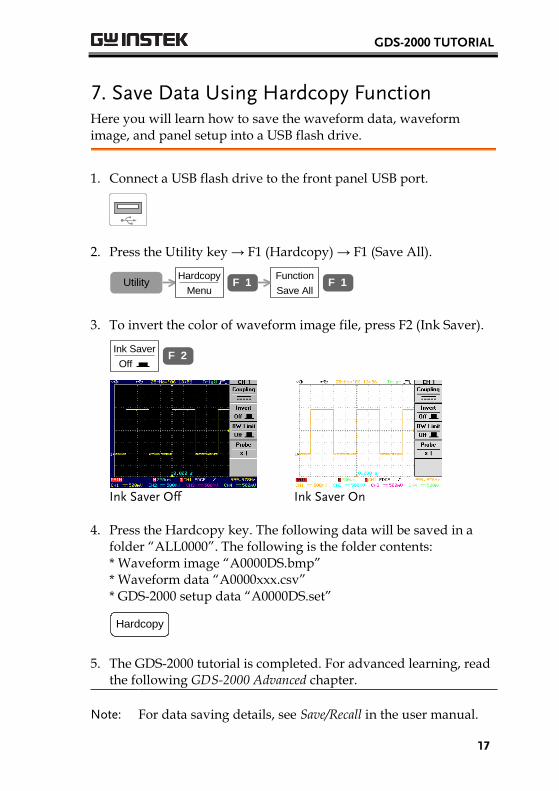
7. Save Data Using Hardcopy Function Here you will learn how to save the waveform data, waveform image, and panel setup into a USB flash drive.
1. Connect a USB flash drive to the front panel USB port.
2. Press the Utility key → F1 (Hardcopy) → F1 (Save All).
UtilityHardcopy
MenuF 1
Function
Save AllF 1
3. To invert the color of waveform image file, press F2 (Ink Saver).
Ink Saver
OffF 2
Ink Saver Off
Ink Saver On
4. Press the Hardcopy key. The following data will be saved in a folder “ALL0000”. The following is the folder contents: * Waveform image “A0000DS.bmp” * Waveform data “A0000xxx.csv” * GDS-2000 setup data “A0000DS.set”
Hardcopy
5. The GDS-2000 tutorial is completed. For advanced learning, read the following GDS-2000 Advanced chapter.
Note: For data saving details, see Save/Recall in the user manual.
GDS-2000 Series Training Manual
18
GDS-2000 ADVANCED Using the demo board designed specially for GDS-2000, you can verify and observe various GDS-2000 advanced functionalities for demonstration or your own education.
Required tools
GDS-2000 x 1
Demo board x 1
USB type A – type B x1 cable for demo board power supply
Standard oscilloscope probe x 2
BNC-BNC cable x 1 (only for 1GSa/s & Single shot)
Demonstration type
1GSa/s & Single shot Automatic measurement
FM signal observation Long memory
Peak detection Pulse width trigger
Roll / Scan mode X-Y mode
* DAC simulation demo is available when used with GLA (page38).
How to run demonstration
1. Setup the demo board according to the procedure on page20.
2. Pick up the demonstration topic and run it. Resetting GDS-2000 after each demo, according to page20, is recommended.

GDS-2000 ADVANCED
19
Demo Board Overview The demo board is a signal generator board capable of producing waveforms which represent various real-life scenarios you might encounter. You can use the board as a training kit to learn how to properly view signals, or use it as a generic signal generator.
Appearance
AuxiliaryPower In
Sine Wave
Ripple
X-Y Mode
Counter(Logic Analyzer)
Roll/Scan
Power In(USB TypeB)
Long Memory
FM
ReservedConnectors
IIC/UART/SPI(Logic Analyzer)
Trigger Signal(Logic Analyzer)
Peak Detection
Pulse Width
Overshoot
Ground PlaneGround Plane
Frequency Knob(Sine Wave)
1ns PulseOutput
Delay
Specification
Signal output 10 types for oscilloscope
5 types for logic analyzer
Signal details are listed in page45.
Power supply 5V DC, USB or auxiliary power input
Accessory USB cable typeA – typeB x 1

GDS-2000 Series Training Manual
20
GDS-2000 Demonstration Setup Follow the below steps to properly power up and connect the demo board. Use step 5 ~ 8 to reset the board after each demonstration.
1. Power up GDS-2000.
2. Connect the USB cable to the demo board and GDS-2000 rear panel USB connector.
3. Select x10 as attenuation level, for both CH1 & CH2 probe.
4. Connect the probes between GDS-2000 CH1&2 and the Sine wave terminal on the demo board.
CH1 CH2
FM Sin
Make sure the ground clips are connected to the ground plane.
5. Press the Save/Recall key → F1 to reset the system.
Save/RecallDefault
SetupF 1

GDS-2000 ADVANCED
21
6. Press the CH2 key to activate CH2.
CH2CH2
7. Press the Display key → F1 (Vector) to select vector drawing.
DisplayType
VectorsF 1
8. Press the Auto Set key. GDS-2000 automatically adjusts the horizontal, vertical, and trigger setting.
Auto Set
Now the display should look like the following: CH1 and CH2 showing 1kHz sine wave on top and bottom half of the display, respectively.
9. Continue with each demonstration.
Note: If one or more of the demonstrations do not work properly, reset the system according to the above steps.
GDS-2000 Series Training Manual
22
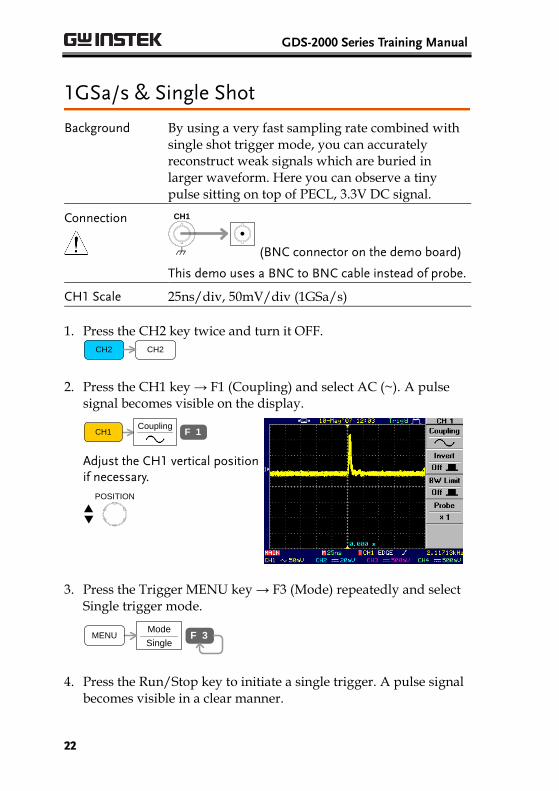
1GSa/s & Single Shot
Background By using a very fast sampling rate combined with single shot trigger mode, you can accurately reconstruct weak signals which are buried in larger waveform. Here you can observe a tiny pulse sitting on top of PECL, 3.3V DC signal.
Connection
CH1
(BNC connector on the demo board)
This demo uses a BNC to BNC cable instead of probe.
CH1 Scale 25ns/div, 50mV/div (1GSa/s)
1. Press the CH2 key twice and turn it OFF.
CH2CH2
2. Press the CH1 key → F1 (Coupling) and select AC (~). A pulse signal becomes visible on the display.
CH1Coupling
F 1
Adjust the CH1 vertical position if necessary.
POSITION
3. Press the Trigger MENU key → F3 (Mode) repeatedly and select Single trigger mode.
Mode
SingleF 3MENU
4. Press the Run/Stop key to initiate a single trigger. A pulse signal becomes visible in a clear manner.

GDS-2000 ADVANCED
23
Run/Stop
5. Press the Run/Stop key several times and observe that the pulse signal amplitude and width remains stable, due to high sampling rate 1GSa/s.
Run/Stop
6. Change the horizontal scale to 100ns/div. Due to the additional data memory requirement, the sampling rate falls from 1GSa/s to 250MSa/s.
TIME/DIV
1GSa/s → 250MSa/s
7. Press the Run/Stop key several times and observe the pulse signal. The signal amplitude and width becomes somewhat unstable due to slower sampling rate 250MSa/s.
Run/Stop
Demonstration completed

GDS-2000 Series Training Manual
24
Automatic Measurement (Delay)
Background Using the automatic measurement function, you can easily measure the waveform, including the time distance between two waveforms.
Connection CH1 CH2
CH1/CH2 Scale 50ns/div, 200mV/div (if CH1 is still unstable, increase the trigger level)
1. Press the Measurement key to show the Measurement menu.
Measure
2. Press F1 → F3 → F3 (Delay FRR) to select the measurement item. Press F5 (Previous menu) to go back and observe the delay time.
Vpp 1:344mV
2:24.0mV
F 1Time
FrequencyF 3
Delay
DelayFRRF 3
Previous
MenuF 5
FRR
3. Press F2 → F3 → F3 and use VARIABLE knob to select Delay LRR. Press F5 (Previous menu) to go back and observe the delay.
Delay
DelayFRRF 3
Previous
MenuF 5
F 3
Delay
DelayLRRF 3
F 2Vavg
1:99.3mV
2:4.28mV
VARIABLE
LRR
Demonstration completed

GDS-2000 ADVANCED
25
Automatic Measurement (Overshoot)
Background Using the automatic measurement function, you can easily measure the waveform, including the rise and fall overshoot.
Connection CH1
CH1 Scale 50ns/div, 100mV/div (if CH1 is still unstable, increase the trigger level)
1. Press the Measurement key. The menu shows five types of measurement results.
Measure
2. Press F1, turn the VARIABLE knob until the measurement item (F3) changes to ROVShoot (Rise overshoot), then press F5 (Previous Menu). The F1 menu reflects the new measurement.
Vpp 1:344mV
2:24.0mV
F 1
VARIABLE
Voltage
ROVShootF 3
Previous
MenuF 5
3. Repeat the same step with F2, this time FOV (Fall overshoot).
Demonstration completed

GDS-2000 Series Training Manual
26
Frequency Modulation (FM)
Background Observing an FM signal works best when short memory mode is selected, due to faster update.
Connection CH1
FM
CH1 Scale 1us/div, 50mV/div
1. Move the CH1 waveform position to the center of the display, both horizontally and vertically, for clear view.
2. To get wider view, press the Menu On/Off key. The menu disappears and the horizontal range expands to 12div.
Note: If the FM waveform is not clearly visible, make sure the memory (Acquisition key → F5) is set to 500.
Demonstration completed
GDS-2000 ADVANCED
27
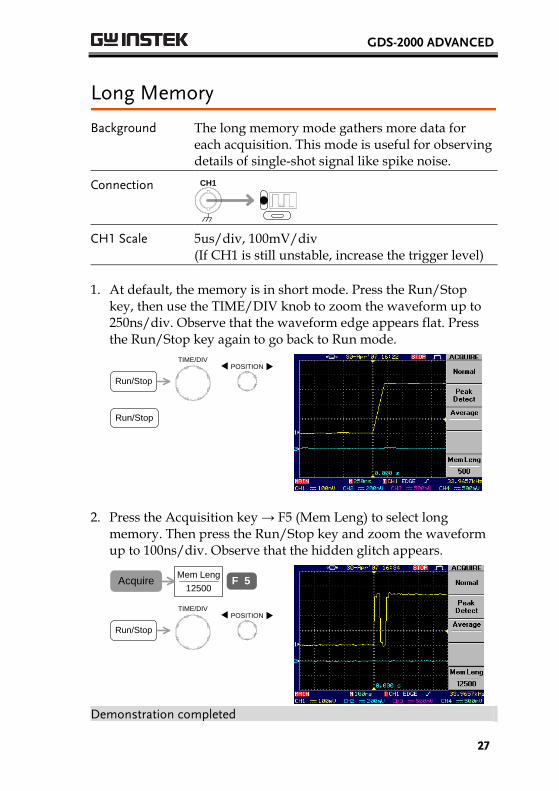
Long Memory
Background The long memory mode gathers more data for each acquisition. This mode is useful for observing details of single-shot signal like spike noise.
Connection CH1
CH1 Scale 5us/div, 100mV/div (If CH1 is still unstable, increase the trigger level)
1. At default, the memory is in short mode. Press the Run/Stop key, then use the TIME/DIV knob to zoom the waveform up to 250ns/div. Observe that the waveform edge appears flat. Press the Run/Stop key again to go back to Run mode.
Run/Stop
POSITIONTIME/DIV
Run/Stop
2. Press the Acquisition key → F5 (Mem Leng) to select long memory. Then press the Run/Stop key and zoom the waveform up to 100ns/div. Observe that the hidden glitch appears.
Mem Leng
12500F 5Acquire
Run/Stop
POSITIONTIME/DIV
Demonstration completed

GDS-2000 Series Training Manual
28
Peak Detection
Background The peak detection mode acquires the max and min amplitude in each signal acquisition. It is useful for catching abnormal glitches in the signal.
Connection CH1
CH1 Scale 10us/div, 100mV/div (If CH1 is still unstable, increase the trigger level)
1. A supposedly pure square waveform appears on the display, in the default Normal acquisition mode.
2. Press the Acquire key → F2 and select Peak detect acquisition mode. The previously hidden spike noise becomes visible.
Peak
DetectF 2Acquire
Demonstration completed
GDS-2000 ADVANCED
29
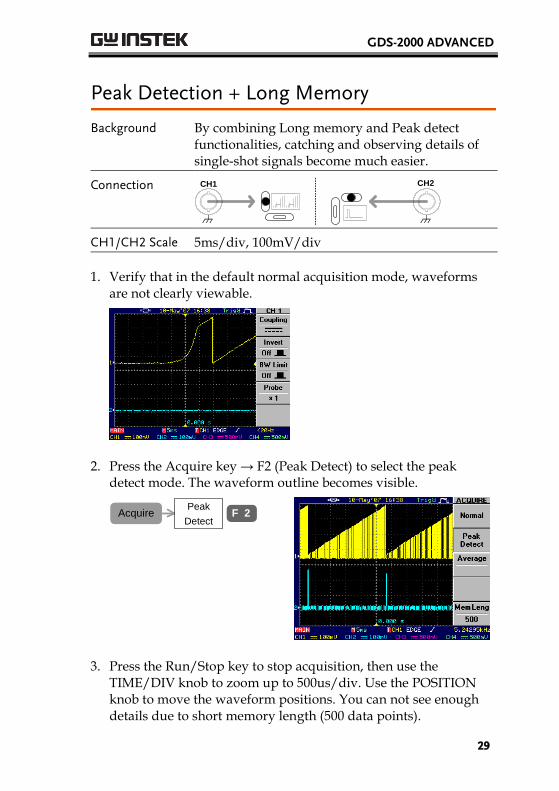
Peak Detection + Long Memory
Background By combining Long memory and Peak detect functionalities, catching and observing details of single-shot signals become much easier.
Connection CH1 CH2
CH1/CH2 Scale 5ms/div, 100mV/div
1. Verify that in the default normal acquisition mode, waveforms are not clearly viewable.
2. Press the Acquire key → F2 (Peak Detect) to select the peak detect mode. The waveform outline becomes visible.
Peak
DetectF 2Acquire
3. Press the Run/Stop key to stop acquisition, then use the TIME/DIV knob to zoom up to 500us/div. Use the POSITION knob to move the waveform positions. You can not see enough details due to short memory length (500 data points).
GDS-2000 Series Training Manual
30
Run/Stop
POSITIONTIME/DIV
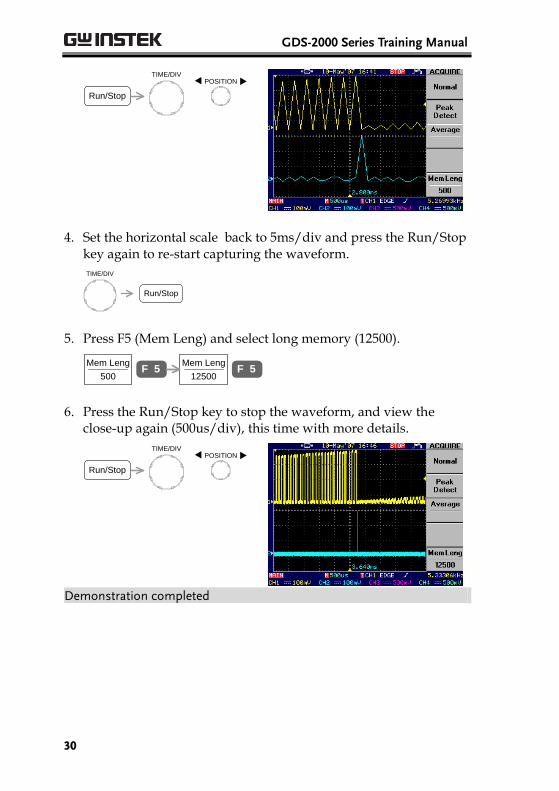
4. Set the horizontal scale back to 5ms/div and press the Run/Stop key again to re-start capturing the waveform.
Run/Stop
TIME/DIV
5. Press F5 (Mem Leng) and select long memory (12500).
Mem Leng
500F 5
Mem Leng
12500F 5
6. Press the Run/Stop key to stop the waveform, and view the close-up again (500us/div), this time with more details.
Run/Stop
POSITIONTIME/DIV
Demonstration completed

GDS-2000 ADVANCED
31
Pulse Width Trigger
Background The pulse width trigger allows observing pulse signals in clear manner, even when several pulse widths are mixed in a single waveform.
Connection CH1
CH1 Scale 250ns/div, 200mV/div (if CH1 is still unstable, increase the trigger level)
1. The input signal contains several pulses with different width. In the default edge trigger mode, all pulses are mixed together.
2. Press the trigger MENU key → F1 (Type) and select Pulse. Press F4 (When), select < , and set the pulse width to 40ns. The narrowest pulse, 20ns, appears on the display.
MENUType
PulseF 1
When <
40.0nsF 4
VARIABLE
3. Repeat the above step and observe the following pulses: =&200ns (200ns), =&500ns (500ns), >&700ns (1us)
Demonstration completed

GDS-2000 Series Training Manual
32
Roll / Scan Mode
Background For observation of slow signal (<20Hz), scan mode and roll mode are available, each with its own merit.
Connection CH1
CH1 Scale 250ms/div, 20mV/div
1. The CH1 triangle waveform will be displayed in SCAN mode, running from left to right. In this mode, old part of the waveform is gradually replaced by new data.
2. Press the HORIMENU key → F4 (Roll) to get a more complete viewing of the waveform. In the Roll mode, the waveform moves from right to left.
Demonstration completed
GDS-2000 ADVANCED
33
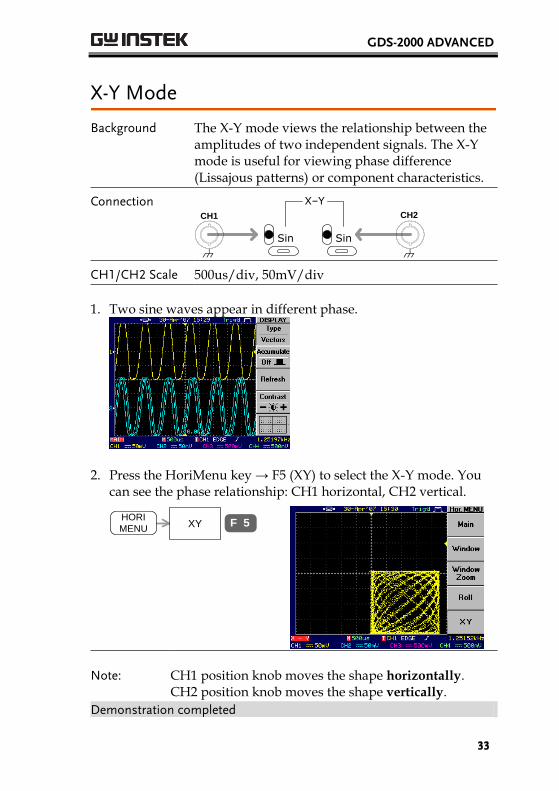
X-Y Mode
Background The X-Y mode views the relationship between the amplitudes of two independent signals. The X-Y mode is useful for viewing phase difference (Lissajous patterns) or component characteristics.
Connection CH1 CH2
Sin
X–Y
Sin
CH1/CH2 Scale 500us/div, 50mV/div
1. Two sine waves appear in different phase.
2. Press the HoriMenu key → F5 (XY) to select the X-Y mode. You can see the phase relationship: CH1 horizontal, CH2 vertical.
HORI
MENUXY F 5
Note: CH1 position knob moves the shape horizontally. CH2 position knob moves the shape vertically.
Demonstration completed

GDS-2000 Series Training Manual
34
GLA-1000 ADVANCED Using the demo board, you can verify the advanced bus analysis feature in GLA series. By using GDS-2000 and GLA series together, you can also observe how to trigger on ripple counter.
Required tools
Demo board x 1
GLA-1000 series x 1
USB type A – type B x1 cable for demo board power supply
GDS-2000 x 1 (only for DAC simulation demo)
Standard oscilloscope probe x 1 (only for DAC simulation demo)
Demonstration type
DAC simulation I2C bus analysis
SPI bus analysis UART analysis
How to run demonstration
1. Setup the demo board and logic analyzer according to page36.
2. Pick up the demonstration topic and run it.
Note
The demonstration is applicable to GLA series firmware version 2.03 or later.

GLA-1000 ADVANCED
35
GLA-1000 Overview GLA-1000 series are PC-based portable, generic purpose digital logic analyzer aimed at product design and educational field.
Series lineup
Model Channel & Memory Model Channel & Memory
GLA-1016 16, 256kbits per CH GLA-1032 32, 128kbits per CH
GLA-1132 32, 1Mbits per CH
Panel overview
Start Switch
PowerLED
TriggerLED
ReadLED
RunLED
PowerSwitch
USBConnector
InputConnector
Main Features
Characteristics 100MHz full bandwidth
External clock range: 0.001Hz ~ 100MHz
Max. x255 ratio data compression
Signal characteristic filtering: Enable function
I2C, RS-232C, SPI waveform analyzer
Waveform statistics function
PC operation, GUI environment, USB bus power

GDS-2000 Series Training Manual
36
GLA-1000 Demonstration Setup Follow the below steps to properly power up and connect the demo board. This section assumes you already have GLA-1000 application software, together with GLA driver, installed in your PC.
1. Connect GLA to the PC, press the power switch to power it up. The POWER LED on GLA turns on.
2. The demo board can be connected to GDS-2000 rear panel USB connector, or to the PC.
3. Connect GLA and demo board as in the following diagram. Connect both 2 GND pins for secure grounding.
SD
A
SC
L
Tx
Rx
SC
K
SS
Gn
d
LA
0
LA
1
LA
2
LA
3
LA
4
LA
5
LA
6
LA
7
T_
0
Gn
d
MO
SI
MIS
O
GLA-1000 ADVANCED
37
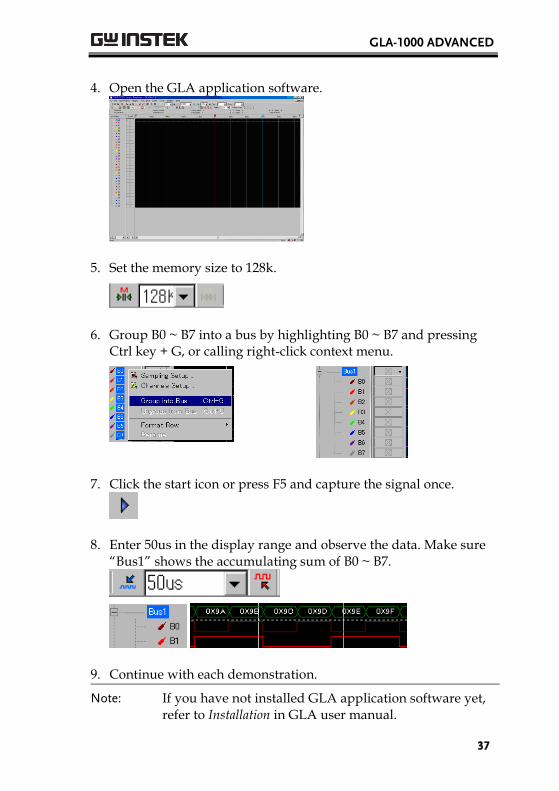
4. Open the GLA application software.
5. Set the memory size to 128k.
6. Group B0 ~ B7 into a bus by highlighting B0 ~ B7 and pressing Ctrl key + G, or calling right-click context menu.
7. Click the start icon or press F5 and capture the signal once.
8. Enter 50us in the display range and observe the data. Make sure “Bus1” shows the accumulating sum of B0 ~ B7.
9. Continue with each demonstration.
Note: If you have not installed GLA application software yet, refer to Installation in GLA user manual.
GDS-2000 Series Training Manual
38
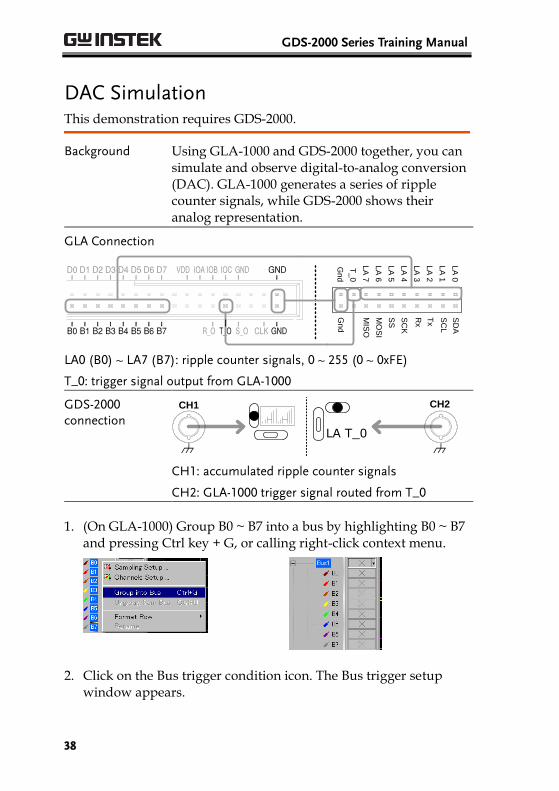
DAC Simulation This demonstration requires GDS-2000.
Background Using GLA-1000 and GDS-2000 together, you can simulate and observe digital-to-analog conversion (DAC). GLA-1000 generates a series of ripple counter signals, while GDS-2000 shows their analog representation.
GLA Connection
SD
A
SC
L
Tx
Rx
SC
K
SS
Gn
d
LA
0
LA
1
LA
2
LA
3
LA
4
LA
5
LA
6
LA
7
T_
0
Gn
d
MO
SI
MIS
O
LA0 (B0) ~ LA7 (B7): ripple counter signals, 0 ~ 255 (0 ~ 0xFE)
T_0: trigger signal output from GLA-1000
GDS-2000 connection
LA T_0
CH1 CH2
CH1: accumulated ripple counter signals
CH2: GLA-1000 trigger signal routed from T_0
1. (On GLA-1000) Group B0 ~ B7 into a bus by highlighting B0 ~ B7 and pressing Ctrl key + G, or calling right-click context menu.
2. Click on the Bus trigger condition icon. The Bus trigger setup window appears.

GLA-1000 ADVANCED
39
3. Click the Decimal radio button, enter a number between 0 and 254 in Value corner, and press OK.
→ → (Decimal 50 selected)
4. Click the Repetitive Run icon or press F6 to acquire data continuously. GLA constantly triggers and the B0-B7 bus shows the setup value (0x32, decimal 50, in the below figure).
5. (On GDS-2000) Press the Save/Recall key → F1 to reset the system.
Save/RecallDefault
SetupF 1
6. Press the CH2 key to activate CH2.
CH2CH2
7. Press the Display key → F1 (Vector) to select vector drawing.
DisplayType
VectorsF 1
8. Separate CH1 and CH2 wave vertically for 3 divs, using the vertical position knobs.

GDS-2000 Series Training Manual
40
POSITION
9. Set the scales as follows. Horizontal: 10ms Vertical: CH1 200mV/div, CH2 200mV/div
10. Press the Acquire key → F5 (Mem Leng) and select long memory.
Mem Leng
12500F 5Acquire
11. Press the trigger MENU key → F2 (Source) and select CH2. Press F3 (Mode) and select Normal mode. (If the waveform does not appear, increase the Trigger level)
Source
CH2F 2MENU
Mode
AutoF 3
Mode
NormalF 3
12. You can see the ripple waveform, which is an analog representation of the ripple counter signals. Using the trigger output from GLA-1000, the waveform is triggered at the specified value (decimal 50 in the below example, as specified above).
Demonstration completed
GLA-1000 ADVANCED
41
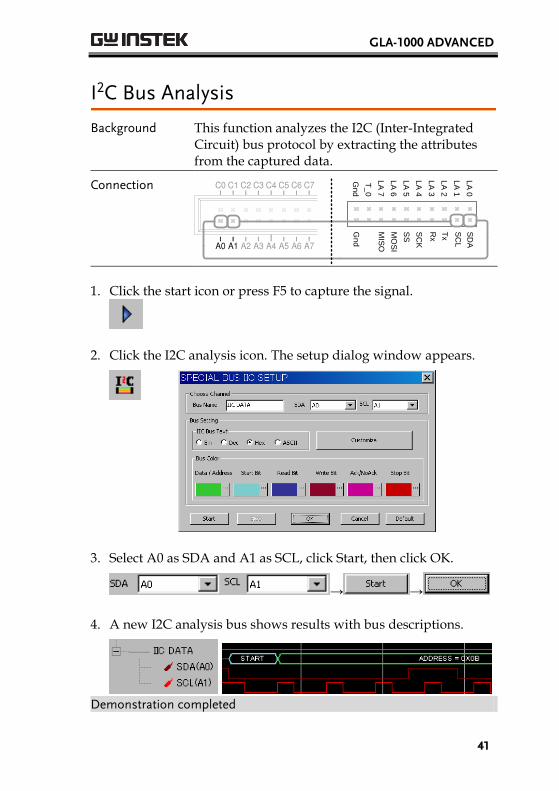
I2C Bus Analysis
Background This function analyzes the I2C (Inter-Integrated Circuit) bus protocol by extracting the attributes from the captured data.
Connection
SD
A
SC
L
Tx
Rx
SC
K
SS
Gn
d
LA
0
LA
1
LA
2
LA
3
LA
4
LA
5
LA
6
LA
7
T_
0
Gn
d
MO
SI
MIS
O
1. Click the start icon or press F5 to capture the signal.
2. Click the I2C analysis icon. The setup dialog window appears.
3. Select A0 as SDA and A1 as SCL, click Start, then click OK.
→ →
4. A new I2C analysis bus shows results with bus descriptions.
Demonstration completed

GDS-2000 Series Training Manual
42
SPI Bus Analysis
Background This function analyzes the SPI (Serial Peripheral Interface) bus protocol by extracting the attributes from the captured data.
Connection
SD
A
SC
L
Tx
Rx
SC
K
SS
Gn
d
LA
0
LA
1
LA
2
LA
3
LA
4
LA
5
LA
6
LA
7
T_
0
Gn
d
MO
SI
MIS
O
1. Click the start icon or press F5 to capture the signal.
2. Click the SPI analysis icon. The setup dialog window appears.
3. Select A4 ~ A7 as SCK ~ MISO, click Start, then click OK.
(Channel setup) → →
4. Two new SPI analysis buses show results with bus descriptions.
Demonstration completed
GLA-1000 ADVANCED
43
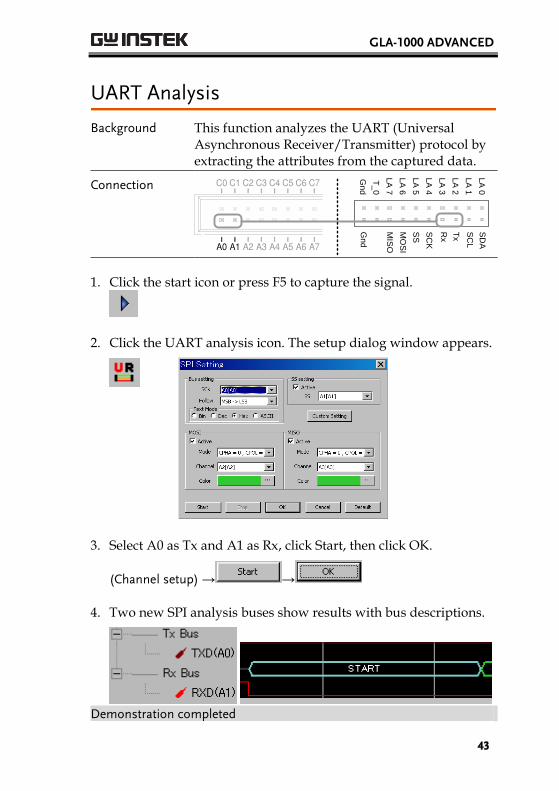
UART Analysis
Background This function analyzes the UART (Universal Asynchronous Receiver/Transmitter) protocol by extracting the attributes from the captured data.
Connection
SD
A
SC
L
Tx
Rx
SC
K
SS
Gn
d
LA
0
LA
1
LA
2
LA
3
LA
4
LA
5
LA
6
LA
7
T_
0
Gn
d
MO
SI
MIS
O
1. Click the start icon or press F5 to capture the signal.
2. Click the UART analysis icon. The setup dialog window appears.
3. Select A0 as Tx and A1 as Rx, click Start, then click OK.
(Channel setup) → →
4. Two new SPI analysis buses show results with bus descriptions.
Demonstration completed
GDS-2000 Series Training Manual
44
APPENDIX
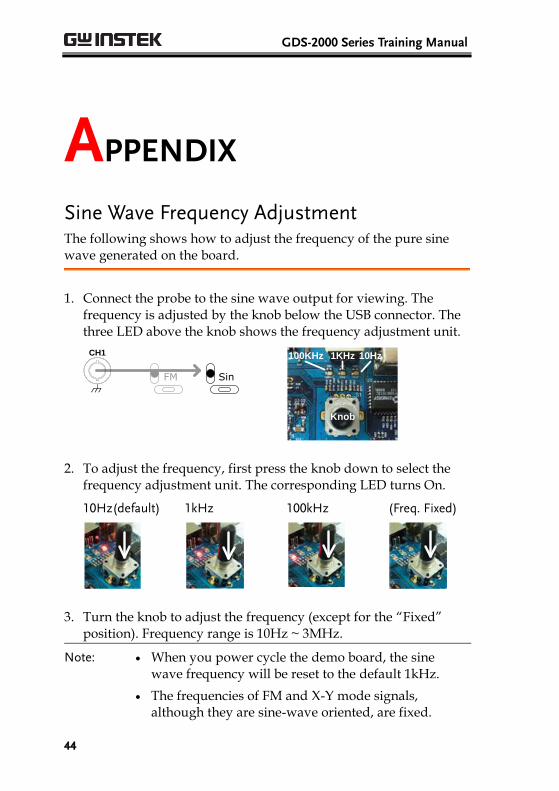
Sine Wave Frequency Adjustment The following shows how to adjust the frequency of the pure sine wave generated on the board.
1. Connect the probe to the sine wave output for viewing. The frequency is adjusted by the knob below the USB connector. The three LED above the knob shows the frequency adjustment unit.
CH1
FM Sin
100KHz 1KHz 10Hz
Knob
2. To adjust the frequency, first press the knob down to select the frequency adjustment unit. The corresponding LED turns On.
10Hz(default)
1kHz
100kHz
(Freq. Fixed)
3. Turn the knob to adjust the frequency (except for the “Fixed” position). Frequency range is 10Hz ~ 3MHz.
Note: When you power cycle the demo board, the sine wave frequency will be reset to the default 1kHz.
The frequencies of FM and X-Y mode signals, although they are sine-wave oriented, are fixed.
APPENDIX
45
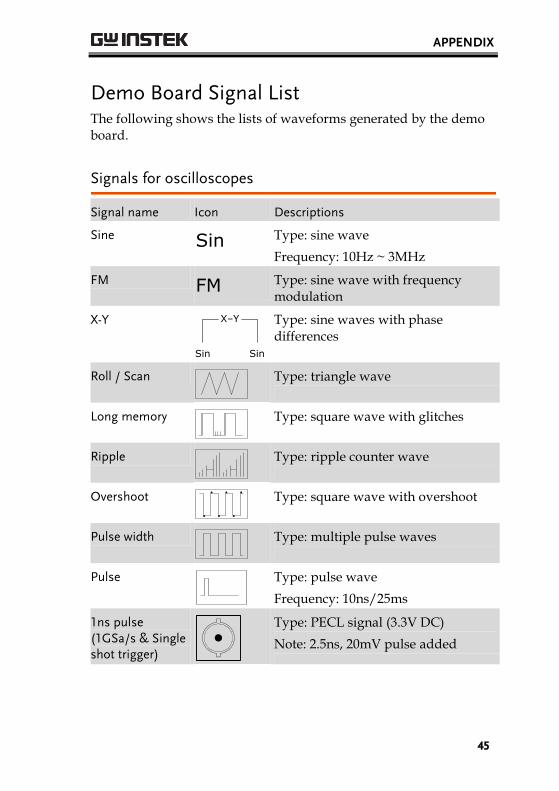
Demo Board Signal List The following shows the lists of waveforms generated by the demo board.
Signals for oscilloscopes
Signal name Icon Descriptions
Sine Sin
Type: sine wave
Frequency: 10Hz ~ 3MHz
FM FM
Type: sine wave with frequency modulation
X-Y
Sin
X–Y
Sin
Type: sine waves with phase differences
Roll / Scan
Type: triangle wave
Long memory
Type: square wave with glitches
Ripple
Type: ripple counter wave
Overshoot
Type: square wave with overshoot
Pulse width
Type: multiple pulse waves
Pulse
Type: pulse wave
Frequency: 10ns/25ms
1ns pulse (1GSa/s & Single shot trigger)
Type: PECL signal (3.3V DC)
Note: 2.5ns, 20mV pulse added

GDS-2000 Series Training Manual
46
Signals for logic analyzers
Signal name Icon Description
IIC SDA
SCLIIC
Type: I2C bus
I/O: Output
UART Tx
RxUART
Type: UART bus
I/O: Output
SPI SCK
SS
MOSI
MISO
SPI
Type: SPI bus
I/O: Output
LA_0 ~ LA_7 LA 0 ~
LA 7
Type: Counter signal
I/O: Output
T_0 T_0
Type: Trigger signal
I/O: Input
Gnd Gnd Type: Ground connector