digital literacy training to - csdindia.org · project director poornima m advisors ashok pankaj...
TRANSCRIPT


Project DirectorPoornima M
AdvisorsAshok PankajAnita Kaul
Research TeamSusmita MitraRamandeep KaurGitesh Sinha
Digital Literacy Training to Non-IT Literate CitizensImpact Assessment of the National Digital Literacy Mission

Foreword | iii
Foreword
The contemporary era of Information and Communication Technology (ICT) has been instrumental in transforming human lives in ways that one cannot possibly deny or overlook. The Government of India launched the ‘Digital India’ campaign for transforming India into a digitally empowered society and economy. One of the goals of this campaign is to empower those who are IT-illiterate so that they are competent enough to use IT and related applications for effectively participating in the democratic processes and enhancing their livelihood opportunities. In this context, the Ministry of Electronics and Information Technology has initiated the National Digital Literacy Mission (NDLM) as a means of realising the vision of ‘Digital India’.
The NDLM initiative was launched in 2014 with the aim of providing digital literacy to 52.5 lakh Indians, including one in every eligible household in selected blocks of every State and Union Territory (UT) of the country. In the first phase, 10 lakh citizens have been trained under NDLM while the remaining 42.5 lakh people will be trained in the second phase. The mission was implemented by CSC e-Governance Services Limited, the Special Purpose Vehicle (SPV) of the Ministry of Electronics and Information Technology, as the Programme Management Unit (PMU) of NDLM, along with the support of various partners and the active collaboration of the State governments and UT administrations.
The Council for Social Development (CSD) was chosen as the agency for assessing the impact of the training programme. The Impact assessment study undertaken by CSD was expected to highlight the overall outcome of the scheme and verify the extent to which the intended objectives have been met in making one person in every family digitally literate. Another objective was to make recommendations and offer pragmatic suggestions for helping improve the programme in its subsequent phases. CSD has done a commendable job in implementing the mandate of the study by identifying several good practices across states in India. This comprehensive National Report submitted by CSD provides a comprehensive assessment of the study and delineates its findings to facilitate more effective policy-making in addition to suggesting measures to the PMU for achieving further improvement in the future phases.
Dr. Dinesh Tyagi
CEO
CSC e-Governance Services India Ltd


Acknowledgements | v
Acknowledgements
The Council for Social Development (CSD) is pleased to submit this report, which highlights the key issues of concern in the NDLM. We believe that this report will be helpful in effecting further improvement in the programme. We also hope that this report will contribute in enhancing the achievements in the coming phases of the NDLM and help it attain the vision of digital India.
We extend our heartfelt gratitude to CSC e-Governance Services India Ltd. for assigning the study: Impact Assessment of the National Digital Literacy Mission (NDLM) to the Council. We are particularly grateful to Mr. Rishikesh Patankar and Ms. Surbhi Sharma of CSC e-Governance Services India Ltd. for providing valuable insights and suggestions throughout the duration of the assessment study.
Our sincere thanks are also due to Crux Management Services, Hyderabad, for successfully carrying out the telephonic interviews in various States/UTs across the country. In particular, CSD acknowledges the efforts of Ms. Hema Jain, CEO, and Ms. Siroja Mehta, Manager of Crux Management Solutions and their team for the timely completion of the telephonic interviews. We would also like to express our appreciation for the sample beneficiaries, training partners and trainers who spared their valuable time and effort for this study.
My personal thanks goes out to Professor Muchkund Dubey, President, CSD, who has always been a source of inspiration and moral support. Professor Ashok Pankaj, Director, CSD, offered immense support and valuable guidance for this study at every stage. I am also grateful to Professor R. Govinda, Distinguished Professor,
CSD, for his insightful comments in designing the NDLM study.
I express my sincere gratitude to Ms. Anita Kaul, former Director, CSD, for her constant encouragement, guidance and support throughout the period of this study, without which this study would not have been possible.
Special thanks are also due to Ms. Anupma Mehta for meticulously editing the report and Ms. Sushama Aich & Khemchandra Sahu, Macro Graphics Pvt.Ltd., for the design and layout of the report.
My colleagues, including both the academic and administrative staff of CSD, also deserve recognition for their contribution and the support in various ways. In particular, I would like to express my gratitude to Ms. Sheela Sabu, Administrative Officer of CSD, for making earnest efforts to help the research team achieve its goals. In addition, the project team extends its thanks to everyone, though not specifically mentioned here, who offered endless hours of help and support during the project.
Last but not the least, I am indebted to Dr. Susmita Mitra, Ms. Ramandeep Kaur and Mr. Gitesh Sinha, for their dedication, commitment and tireless efforts to ensure the successful completion of the report. The usual disclaimers apply.
Dr. Poornima MAssistant ProfessorCouncil for Social developmentNew Delhi.


Contents | vii
Contents
Foreword iii
Acknowledgements v
List of Tables viii
List of Figures ix
List of Boxes x
Acronyms xi
Executive Summary xiii
1. Introduction 1
2. Bridging the Digital Divide: Imparting Digital Literacy 7 Training to Non-IT Literate Citizens
3. Beneficiaries of NDLM 15
4. Training Component 31
5. Training Infrastructure and Classroom Processes 39
6. Training Outcome 49
7. Enhancing the Next Phase of Digital Literacy Mission 59
8. References 67
Annexes 69
Annex-1: Interview Schedule for Trainees 69
Annex-2: Status of Survey Response 73
viii | Digital Literacy Training to Non-IT Literate Citizens: Impact Assessment of the NDLM
List of Tables1.1 Sample Size across States/UTs 3
1.2 Checklist for Data Cleaning 4
1.3 Valid Data Set for NDLM Survey 4
2.1 Population (Aged 14 Years and above) Able to Operate a Computer (%) 9
2.2 Purpose of Usage of a Computer (%) (2013-14) 10
2.3 NDLM Course Module 12
2.4 State/UT-wise Break-up of the Training Targets 14
3.1 Demographic and Social Profile of the Sample Beneficiaries 16
3.2 Coverage of Beneficiaries: Age (Years) (%) 20
3.3 Coverage of Beneficiaries: Caste (%) 21
3.4 Beneficiaries of NDLM Training: BPL/non- BPL (%) 22
3.5 Beneficiaries Reporting about their Family’s Status Regarding Digital Literacy (%) 23
3.6 Trainee Benefiting per Family (%) 24
3.7 Beneficiaries Reporting about Freeships and Fees Paid (%) 26
3.8 BPL/non-BPL Beneficiaries Reporting about Freeships and Fees Paid (%) 28
4.1 Sources of Information on NDLM Training (%) 32
4.2 Form of Teaching Learning Material (TLM) of NDLM 35
5.1 Responses of the Beneficiaries on the Training Infrastructure–Multiple Responses (%) 40
5.2 Responses of the Beneficiaries on the Lessons Taught Under NDLM–Multiple Responses (%) 41
5.3 Trainees’ Assessment of the Trainers’ Knowledge (%) 42
5.4 Responses of the Beneficiaries on the Teaching Methods Practised (%) 43
5.5 Responses of the Beneficiaries on the Language of Training (%) 45
6.1 Responses of Beneficiaries on Purpose of Usage of Digital Device (%) 50
6.2 Responses of the Beneficiaries on Day-to-day Applications of Digital Devices (%) 52
6.3 Responses of the Beneficiaries on the Overall Benefits of NDLM Training (%) 54
7.1 Overall Performance of States/UTs on Dimensions and Indicators 61

List of Figures | ix
List of Figures1.1 Impact Assessment Framework Under NDLM 2
2.1 Uneven Access to the Digital Revolution 8
2.2 Digital Literacy and Formal Education as a Catalyst 8
2.3 Households with Access to Computers and Internet Facility (%) (2013-14) 11
2.4 Process of NDLM 12
3.1 Dimensions of Beneficiary Coverage 18
3.2 NDLM Target Group: Gender (%) 18
3.3 Financial Support to SC/ST and General/OBC Candidates (%) 25
3.4 Financial Support to BPL and non-BPL Beneficiaries 27
3.5 Ranking of States/UTs Based on Overall Performance: Coverage of Beneficiaries 29
4.1 Dimensions of Training Component 31
4.2 Sources of Information on NDLM Training (%) 32
4.3 Response of Beneficiaries on Regularity of NDLM Training (%) 34
4.4 Ranking of States/UTs Based on Overall Performance: Training Component 36
5.1 Dimensions of Training Infrastructure and Classroom Processes 39
5.2 Responses of the Beneficiaries on the Teaching Methods Practised (%) 44
5.3 Responses of the Beneficiaries on the Language of Training (%) 44
5.4 National Status of Examination and Certification 46
5.5 State-wise Scenario of Examination and Certification 47
5.6 Ranking of States/UTs Based on the Overall Performance: Training Infrastructure 48 and Classroom Processes
6.1 Dimensions of the Training Outcome 49
6.2 Application of Digital Training: Usage of e-mail, Facebook and Browsing 51
6.3 Application of Digital Training: Paint, Job Search, Games and Availing 51 Government Services
6.4 Overall Benefits of NDLM Training (Livelihood Based) 55
6.5 Ranking of States/UTs Based on the Overall Performance: Training Outcome 57
7.1 Overall Impact of NDLM Training 60

x | Digital Literacy Training to Non-IT Literate Citizens: Impact Assessment of the NDLM
List of Boxes3.1 Case Study of Mallamadugu, Telangana, Village with More Women Representatives 19
3.2 Empowerment of ST Community, Dindori District, Madhya Pradesh 21
4.1 Creative Initiatives to Increase Outreach of NDLM in Different Villages 33
4.2 Outreach Measures of Training Partners and Training Centres 33
5.1 Server Problem – A Major Constraint in the NDLM Training 46
5.2 Innovative Measures Used in the Villages to Tackle Infrastructure-related Constraints 47
6.1 Application of Digital Devices in Everyday Life in the Villages of Telangana 53
6.2 Training Outcome: Perception of Training Partners and Training Centres 53
6.3 Case Studies on Overall Benefit of NDLM for the Beneficiaries 56

Acronyms | xi
Acronyms
ACC Appreciation of Computer Concepts
AIIMS All India Institute of Medical Sciences
A & N Island Andaman & Nicobar Island
BPL Below Poverty Line
CEO Chief Executive Officer
CSC CSC-e governance Services India Limited
CSD Council for Social Development
CSR Corporate Social Responsibility
DEITY Department of Electronics and Information Technology
FGD Focus Group Discussion
ICT Information and Communication Technology
IGNOU Indira Gandhi National Open University
IRCTC Indian Railway Catering and Tourism Corporation Limited
IT Information Technology
ITI Industrial Training Institute
LANs Local Area Network
Ltd. Limited
MEITY Ministry of Electronics and Information Technology
MGNREGA Mahatma Gandhi National Rural Employment Guarantee Act
MHRD Ministry of Human Resource Development
NDLM National Digital Literacy Mission
NGOs Non-Governmental Organisations
NIELIT National Institute of Electronics and Information Technology
No. Number
NPIT National Policy on Information and Technology
NR No Response
NSS National Sample Survey
NSDC National Skill Development Corporation
OBC Other Backward Caste
PC Personnel Computer

xii | Digital Literacy Training to Non-IT Literate Citizens: Impact Assessment of the NDLM
PMU Programme Management Unit
PPP Public Private Partnership
Rs. Rupees
RSETI Rural Self Employment Training Institute
SC Scheduled Caste
Sl. No Serial Number
SPV Special Purpose Vehicle
ST Scheduled Tribe
TLM Teaching and Learning Material
UPS Uninterrupted Power Supply
UTs Union Territories
VLEs Village Level Entrepreneurs
WANs Wide Area Networks
WDR World Development Report

Executive Summary | xiii
Executive Summary
BaCkgROuND
As part of the Digital India Campaign, the National Digital Literacy Mission (NDLM) was implemented by CSC e-Governance Services India Ltd. to provide training in Information Technology (IT) to 10 lakh persons in every eligible household in each State/Union Territory (UT). The objective of this training was to enable the beneficiaries to use IT and IT-related applications for effective participation in democratic processes and enhancement of their livelihoods. With the completion of the first phase of this training, the Council for Social Development (CSD) was assigned the task of evaluating the impact of the training programme and of recommending improvements, suggestions and best practices. A total of 27,557 beneficiaries were interviewed from 22 states and 4 UTs. Following are the key findings of the survey at the national level in accordance with the dimensions and indicators identified for this impact assessment study:
I. Beneficiary Coverage
This dimension includes the following indicators: NDLM target groups, trainees benefited per family, digital literacy status of the families, and the financial support offered to the trainees. The key findings with respect to this dimension are delineated below.
(i) NDLM Target group
Gender:zz A substantial proportion of the candidates trained were women (38 per
cent), even though the male members were the major beneficiaries.
Age:zz The age-wise classification of the beneficiaries reveals that the youngest lot of respondents in the age group of 14 to 25 years, that is, approximately 80 per cent of the total, is the chief beneficiaries of the NDLM training.
Social Group:zz At the national level, a majority of the respondents belonged to the OBC category (comprising 44 per cent of the total), followed by those from the general category (27 per cent of the total). The proportions of beneficiaries from the SC and ST categories were 20 per cent and 7 per cent, respectively.
BPL/Non-BPL:zz In terms of reaching out to the BPL card-holders, the NDLM programme effectively achieved its target as 64 per cent of the candidates trained were found to belong to that category whereas the non-BPL card-holders accounted for 28 per cent of the trained population. While 5 per cent of the respondents did not have ration cards, 3 per cent did not respond to the question pertaining to possession of a ration card.
(ii) Digital Literacy Status of Trainee’s Family
The all-India picture reveals that 74.3 per zz
cent of the trained beneficiaries belong to families having one IT-literate member, and almost 12 states out of the 22 surveyed have crossed the national average.

xiv | Digital Literacy Training to Non-IT Literate Citizens: Impact Assessment of the NDLM
(iii) Trainee Benefitted Per Family
At the national level, 76.3 per cent of the zz
respondents stated that only one member from each of families attended the programme, whereas 24 per cent reported that more than one family member availed of this training.
(iv) Financial Support to Beneficiaries
The training was provided free of cost to zz
different candidates irrespective of their caste status though some of the training centres charged a fee from the different categories of candidates. An assessment of the national scenario reveals that more than 85 per cent of the respondents from both the Scheduled Caste (SC)/Scheduled Tribe (ST) communities and the General/Other Backward Caste (OBC) categories received free training. Only a small proportion of the sample beneficiaries from these communities were paying the prescribed fee of Rs.125, while some of the beneficiaries paid more than the prescribed amount. While all candidates belonging to the OBC and General categories were required to pay the stipulated fee of Rs.125, it was found that only 9.04 per cent of the total OBC and General candidates reported paying the prescribed fee.
Similarly, the training was provided free zz
of cost to 68 per cent and 31 per cent of the BPL and non-BPL trainees, respectively. However, excess fee was also charged from the candidates in some cases.
II. Training Component
The dimension pertaining to the training component covers the following aspects: the outreach mechanism of NDLM, regularity of training and form of Teaching Learning Material (TLM) used in the NDLM.
(i) Outreach Mechanism of NDLM
An examination of the national picture zz
shows that 39.22 per cent of the
candidates learnt about the training through friends and thereafter registered for the programme. Similarly, 26.44 per cent of the trainees stated that they came to know about the programme through advertisements released by training centres in the form of hoardings and banners in public places, and distribution of pamphlets, among other forms of publicity. Another 15.35 per cent of the respondents affirmed that they had obtained information on the programme from various schools.
(ii) Regularity of NDLM Training
At the national level, more than 90 per zz
cent of the respondents stated that the NDLM training used to take place on a regular basis, and only 6.39 per cent of the respondents complained of the irregularity of the training.
(iii) Form of Teaching Learning Material (TLM) of NDLM
On the whole, 65.24 per cent of the students zz
stated that the course materials were in the form of videos. Some of them reported that though the videos were interesting to watch, it was difficult for them to retain what was depicted in the videos for long and the latter were not available when revision of the material was required. About 49.40 per cent of the respondents stated that books were provided by the training centres. Further, 35.42 per cent of the respondents stated that they had access to e-books and 37.82 per cent reported that photocopies of the course material were made available by the training centre.
III. Training Infrastructure and Classroom Processes
(i) Facilities in the Training Centre
The respondents were questioned on the zz
availability and condition of basic facilities in the training centre such as computers,

Executive Summary | xv
Internet connection in the centre, power back-up in case of electricity failure and the condition of other equipment such as web cameras, printers and scanners. In almost all the states/UTs, more than 90 per cent of the respondents affirmed the good quality of the available equipment.
(ii) NDLM Lessons
In some of the states/UTs such as Daman zz
& Diu, Bihar, Madhya Pradesh, Chandigarh and Haryana, more than 80 per cent of the students reported having received lessons on computer application, the use of smartphones, tablets, Internet and accessing of government services.
(iii) knowledge of Trainers
Almost 100 per cent of the respondents in zz
many of the states averred that the trainers had appreciable knowledge of the course content. This finding is further emphasised by the fact that the national average for the extensive knowledge of the trainers on the course content is as high as 87 per cent.
(iv) Teaching Methods
The teaching methods consisted of theory, zz
practical and audio-visual classes. About 46 per cent of the trainees reported going through mixed methods of teaching, while 38 per cent stated that they primarily had theory classes and 10 per cent said that they had practical classes. The training was imparted in English, Hindi, the local language, and sometimes a mix of English and Hindi, or a mix of English and the local language.
(v) Examination and Certification
Overall, 63 per cent of the students stated zz
that they did not face any difficulty in giving the exam while 37 per cent of the respondents claimed to have faced difficulties. On further enquiry with regard to the difficulties faced, the trainees highlighted technical reasons such as slow
portals, too many hits by students at the same time, and poor Internet connection, among others.
IV. Training Outcome
The indicators concerning this dimension such as the purpose of digital device usage, day-to-day application, and the overall outcome of training, are discussed below.
(i) Purpose of Digital Device
On the whole, 63.03 per cent of the zz
respondents who underwent the training stated that they were able to use the digital devices to check and send emails. About 60 per cent of the students in the surveyed states/UTs said that they were using digital devices for browsing various websites. Nearly 30 per cent of the trainees also reported using the Internet for accessing government and other services like booking of railway tickets.
(ii) Day-to-day application of the Digital Device
At the national level, 51.9 per cent of the zz
respondents stated that they were able to use the digital devices after the training for day-to-day applications like doing office work, school/college work, or using it for general purposes like sending mails, and checking Facebook, among other applications. However, on the whole, 48 per cent of candidates reported irregular usage due to the unavailability of digital devices at home.
(iii) Overall Benefit of the NDLM Training
Out of the total number of candidates zz
trained, 63.54 per cent perceived of an improvement in their knowledge after the training. About 50 per cent of the respondents asserted an enhancement of their confidence levels after undergoing the IT literacy training. A few of them also found the training to be useful in securing

xvi | Digital Literacy Training to Non-IT Literate Citizens: Impact Assessment of the NDLM
new jobs or promotions in existing jobs, and in augmenting their incomes. Interestingly, about one-fourth of them also used their learning for imparting training to other people.
RECOMMENDaTIONS
Overall, the national performance in most of the indicators was good. However, gaps were identified in certain areas and it may be pointed out that corrective measures pertaining to those aspects would ensure better implementation during the next phase of the NDLM. Following are the key recommendations and suggestions made on the various components:
I. Beneficiary Coverage
In some states, more than one member zz
from the targeted family was trained. In a number of states, non-eligible families were also trained. Hence, there is need for more prudent and accurate selection of beneficiaries to ensure adequate coverage of the target population.
The educational backgrounds of the trainees zz
varied. Accordingly, it is recommended that different training modules should be designed for beneficiaries with different levels of education.
In a number of states, elderly people in the zz
age group of 60-plus years also showed an interest in the digital training for their day-to-day usage. The eligibility criteria should thus be modified to include the elderly population, but the training modules should be different for them.
A number of states adopted innovative zz
methods of targeting the Below the Poverty Line (BPL)/SC/ST and women beneficiaries. Elected representatives of the panchayats in the villages were also involved in identifying eligible beneficiaries. The best practices adopted in some of the states can, therefore, be replicated in the other states.
There is need for strict monitoring of the zz
implementation of programme for SC/ST and BPL candidates, especially in terms of the fee waiver for various groups. Further, proper mechanisms should be developed to ensure that the training partners and training centres do not charge extra fees from the candidates.
The outreach measures in a few states zz
included advertising in local newspapers and radios, campaigns in slum areas, meetings with panchayat leaders and working population groups (for example, farmers’ clubs, teachers, and MGNREGA workers), and the use of mobile vans. These practices should also be adopted by the other states.
II. Training Component
The training modules should be designed zz
as per the needs of the beneficiaries belonging to diverse age and educational groups. Accordingly, different modules of training need to be developed.
III. Training Infrastructure and Classroom Processes
There is need for proper scrutiny of zz
training partners and centres before the commencement of the training programme in order to ensure that the training centres are equipped with proper computers, Internet connectivity and other requisite infrastructure.
Due to the prevalence of server and zz
technical problems such as crowding on the portal, the examination was not conducted on time in some states. This highlights the need for enhancing the range of the bandwidth to prevent hanging of the portal due to multiple hits at a time. The examination can thus be conducted for different zones in different time slots.
The examination should be conducted zz
immediately after the training. There should be a minimum time gap between

Executive Summary | xvii
the closure of training and conduction of the examination.
The process of issuing of certificates should zz
be expedited.
IV. Training Outcome
Some of the students were not able to use zz
the digital devices due to lack of access to the equipments, especially after completion of their training. As a result, they also tend to forget their lessons. Hence, the PMU may instruct the training centres to allow the students to use the facilities at the
training centres for limited purposes, even after completion of the training period.
Students, who have taken the training, use zz
the digital devices mostly for applications like WhatsApp, Facebook and playing of games. The training should also orient them for using it for other purposes. Emphasis should also be laid on the usage of digital devices for accessing government services and other utility-based services such as booking of railway tickets, and applying for Pan Cards, passports, and Aadhaar Cards, among other services.


1 Introduction | 1
1 Introduction
BaCkgROuND
With the present era being characterised by a digital revolution, Information and Communication Technology (ICT) has been heralding a remarkable change in the way the world functions while also improving service delivery, increasing job and learning opportunities, and enhancing knowledge and skills. However, as stated by the World Development Report on ‘Digital Dividends’, for digital technologies to confer their full benefit on society, it is vital to close the digital divide by increasing the access of technology to all (World Bank, 2016) and also by enhancing the capability of both the Government and the citizens to optimally utilise digital technologies. In particular, generating greater awareness among citizens regarding the use of digital technology and building a corresponding human capital on its usage will not only bridge the digital divide, but also contribute to greater social progress of the country (Kapoor and Mathur, 2016).
In accordance with the endeavour to spread digital awareness, the National Digital Literacy Mission (NDLM) was implemented in 2014 by the then Department of Electronics and Information Technology (DEITY), which subsequently became the Ministry of Electronics and Information Technology (MEITY) in September 2016. The objective of NDLM was to impart training on Information Technology (IT) to 10 lakh persons in every eligible household in selected blocks in each state and Union Territory (UT), so as to offer beneficiaries greater livelihood opportunities and
to enable them use IT and IT-related applications for effectively participating in the democratic process. The beneficiaries were selected from households wherein none of the members in the age group of 14 to 60 years was IT-literate.
CSC e-Governance Services India Limited, as the Special Purpose Vehicle (SPV) for this programme, is engaged in the implementation of NDLM, with the active collaboration of the respective state governments/UTs and other key partners.
While Phase 1 of NDLM has already been implemented, the second phase of the programme is expected to reach out to 42.5 lakh persons across the country. However, it is imperative to evaluate the success of the first phase and the targets achieved under it before the commencement of the second phase of the programme. This evaluation is also likely to throw up suggestions for dealing with the challenges emerging in the first phase, and to implement some of the good practices observed in it. In view of its history and prior experiences, the Council for Social Development (CSD) was assigned the responsibility of assessing the impact of the first phase of the training programme, to recommend improvements and propound best practices.
OBjECTIVE OF ThE IMPaCT aSSESSMENT STuDy
This Impact Assessment Study highlights the overall outcome of NDLM, that is, the IT Mass Literacy Training programme implemented

2 | Digital Literacy Training to Non-IT Literate Citizens: Impact Assessment of the NDLM
across the country in different states. The main objectives of this study are to:
Examine the coverage of the targeted zz
beneficiaries as per the criteria of selection adopted by the NDLM;
Assess the training module and its zz
compatibility with the objectives of the programme;
Explore the availability and condition of zz
training infrastructure provided by the training centres;
Analyse the impact of the training outcome zz
on the beneficiaries; and
Suggest measures for improving zz
implementation of the programme to guarantee its better outcomes.
METhODOLOgy
The study was based on the information and data supplied by CSC and the primary survey conducted in collaboration with the trainees, training partners and training centres of the programme. The step-by-step process, which
entailed data collection, analysis and preparation of the report, has been elaborated below.
Impact assessment Framework
An Impact Assessment Framework was developed to facilitate an effective impact analysis based on the review of the existing documents discussing the implementation of NDLM. The Impact Assessment Framework covered the relevant dimensions and indicators of the programme, as depicted in Figure 1.1.
Sampling and Sample Size
This study proposed a sample size of 30,000, which is equivalent to 3 per cent of the total population trained. The study adopted the same state-wise break-up that was applied by the Programme Management Unit (PMU) of NDLM for identifying the training targets in different states. Stratified random sampling was undertaken in all the states/UTs to examine whether adequate representation was given to various sub-groups of the target population. The survey was undertaken during the period April 2016 to July 2016, covering
FIguRE 1.1: IMPaCT aSSESSMENT FRaMEwORk uNDER NDLM
Source: Prepared by authors.
Output
Bene�ciaryCoverage• NDLM Target
Group• Digital Literacy
Status of Family• Trainee Benefitted
per Family• Financial Support
to Beneficiaries
TrainingComponent• Outreach
Mechanism• Regularity of
Training• Form of NDLM
Content
• Facilities • NDLM Lessons• Knowledge of
Trainer• Teaching Method• Examination and
Certification
Purpose of Usage
Day-to-DayApplication ofDigital Device
Overall Bene�tof NDLMTraining
Impact Assessment Framework(Dimensions and Indicators)
Outcome andOverall Impact
TrainingInfrastructure andClassroomProcesses

1 Introduction | 3
approximately 10,000 samples each month, reaching a total of 27,557 by the end of three months. Interviews with the training partners and training centres across the identified states/UTs were held in July 2016.
The survey covers a total of 50 training partners and 50 training centres from various states/UTs. Although the total sample size of the intended target was 30,000 households, the programme could not achieve this target due to zero implementation in Lakshadweep Islands, and receipt of responses from an insignificant number of respondents in the states/UTs of Andaman and Nicobar Islands, Arunachal Pradesh, Assam, Dadra
and Nagar Haveli, Goa, Meghalaya and Sikkim. The survey data of Andhra Pradesh also includes Telangana, wherein the trainee beneficiaries were selected from Andhra Pradesh, while the training partners were selected from Telangana. In this way, a total sample of 27,557 respondents was surveyed from 22 states and 4 UTs, the details of which are presented in Table 1.1.
Survey Method
In view of the constraints of budget and time, and the need to maintain high quality of the survey, telephonic interviews were conducted to elicit information on the training from the respondents. The training partners and training centres across the country were also part of the interview process.
Designing of Survey Instruments
The survey instrument and coding format for filling the data were designed on the basis of the Impact Assessment Framework. The Inverted Funnel technique was adopted for framing the structured questionnaire, wherein a set of close-ended questions were posed in the beginning, followed by a few open-ended questions. A field visit was also undertaken in Delhi to pilot test the survey instruments.
Pilot Test
A pilot study of the survey instruments was held to explore the adequacy and acceptability of the questionnaire. This pilot comprised a telephonic survey in the five states/UTs of Delhi, Haryana, Punjab, Tamil Nadu and West Bengal, for assessing the suitability of the questionnaire in the different states. The questionnaire developed was further fine-tuned on the basis of the results obtained after the pilot study.
Data for the NDLM Survey
The data set for the NDLM survey of various states was supplied to CSD by the CSC-SPV. The data set contained the basic details of the people trained under NDLM, including the name of the
TaBLE 1.1: SaMPLE SIzE aCROSS STaTES/uTs
Sl. No. States Sample
Category a (10 States)
1. Andhra Pradesh 2,000
2. Bihar 2,000
3. Gujarat 2,000
4. Karnataka 2,000
5. Madhya Pradesh 2,000
6. Maharashtra 2,000
7. Rajasthan 2,000
8. Tamil Nadu 2,000
9. Uttar Pradesh 2,000
10. West Bengal 2,000
Category B (9 States/uTs)
11. Chhattisgarh 667
12. Delhi 667
13. Haryana 667
14. Jammu & Kashmir 667
15. Jharkhand 667
16. Kerala 667
17. Odisha 667
18. Punjab 667
19. Uttarakhand 667
Category C (7 States/uTs)
20. Chandigarh 222
21. Daman & Diu 222
22. Himachal Pradesh 222
23. Manipur 222
24. Nagaland 222
25. Puducherry 222
26. Tripura 222
all India 27,557

4 | Digital Literacy Training to Non-IT Literate Citizens: Impact Assessment of the NDLM
candidate along with names of the parents, and the mobile numbers, Aadhaar number and email id of the candidate. The data set also provided details on the gender, religion, community affiliation and educational qualifications of the
candidate. Before the initiation of the survey, the data set was subjected to several checks, as delineated in Table 1.2.
The data was thus cleaned up before commencement of the survey process. Hence, out of the total data set of 3,79,932 respondents that was supplied, 94,707 students were removed, due to inconsistencies. Table 1.3 presents a picture of the valid data set that was identified for the survey, after the data cleaning process.
TaBLE 1.3: VaLID DaTa SET FOR NDLM SuRVEy
Sl. No.
States Total No. of
Students
Total Invalid
Nos.
without Nos.
Students with Valid
Mobile Nos.
Total Duplicate
Nos.
Valid Data Set for
the Survey
1. Andhra Pradesh 18,023 21 0 18,002 7420 10,582
2. Bihar 26,282 47 8 26,227 15,605 10,622
3. Chandigarh 2086 6 2 2078 301 1777
4. Chhattisgarh 8538 482 1 8055 1116 6939
5. Daman & Diu 686 0 0 686 84 602
6. Delhi 4999 26 4 4969 631 4338
7. Gujarat 14,653 11 0 14,642 1923 12,719
8. Haryana 13,476 10 7 13,459 3081 10,378
9. Himachal Pradesh 3049 2 0 3047 308 2739
10. Jammu & Kashmir 2231 0 0 2231 440 1791
11. Jharkhand 1626 4 0 1622 268 1354
12. Karnataka 5650 6 16 5628 1098 4530
13. Kerala 3094 2 1 3091 711 2380
14. Madhya Pradesh 44,216 85 11 44,120 13,201 30,919
15. Maharashtra 9999 29 0 9970 2627 7343
16. Manipur 1152 1 0 1151 168 983
17. Nagaland 929 3 0 926 51 875
18. Odisha 15,988 137 13 15,838 4912 10,926
19. Puducherry 931 2 0 929 34 895
20. Punjab 15,563 24 0 15,539 2104 13,435
21. Rajasthan 49,129 79 4 49,046 16,283 32,763
22. Tamil Nadu 9002 5 0 8997 629 8368
23. Tripura 2946 2 0 2944 600 2344
24. Uttar Pradesh 59,791 181 2 59,608 9561 50,047
25. Uttarakhand 6143 3 0 6140 2606 3534
26. West Bengal 59,750 175 17 59,558 7516 52,042
all India 3,79,932 1343 86 3,78,503 93,278 2,85,225Source: Computed by the authors.
TaBLE 1.2: ChECkLIST FOR DaTa CLEaNINg
Duplicacy in telephone numbers √Invalid Numbers (numbers more or less than 10 digits)
√
Source: Prepared by the authors.

1 Introduction | 5
Out of the 3,78,503 valid mobile numbers, 2,85,225 were considered for the survey as there was repetition of the same numbers several times against different names.
Data analysis
In order to measure the performances of the states, a composite Digital Literacy Index was developed against the identified dimensions—beneficiary coverage, training component, training infrastructure, and classroom processes and training outcome. The aggregates of the individual dimensions were arrived at by giving equal weights and by normalising the values between 0 and 1. Thereafter data analysis was done by using advanced Excel, access and SPSS techniques. Statistical tools such as frequencies, and percentages were used to describe, summarise and interpret the findings of the study.
STRuCTuRE OF ThE REPORT
The report presents the findings with respect to the digital literacy training imparted to the non-IT literate citizens across the country. The report highlights the key issues and concerns pertaining to NDLM in the 22 states and 4 UTs covered under the study. The report is anticipated to offer valuable insight into the digital literacy efforts under NDLM and to contribute towards attaining the vision of digital India.
The report is organised into 7 chapters. Chapter 1, the introductory chapter, provides a brief outline of the Impact Assessment Study and the methodology adopted under the programme. It also lists the states/UTs selected for the study and discusses the methodology adopted for computing the digital literacy index.
Chapter 2 is a snapshot on the contribution that ICT can make in the development of the country and highlights the need for bridging the digital divide, by showcasing the NSS 2015 data on the ability of citizens to operate computers for different purposes. It also provides an overview of NDLM as implemented by the CSC-SPV.
Chapter 3 presents the findings of the survey against the dimension of ‘beneficiary coverage’, which verifies the extent to which the objectives of NDLM have been met. This entails a brief discussion on the demographic and social background of the beneficiaries of NDLM. In addition to the state-wise scenario relating to the beneficiaries covered, the other components of the programme discussed in this chapter include the beneficiary coverage per family, digital literacy status of the beneficiary’s family, and the financial support offered to the beneficiaries.
Chapter 4 evaluates the training component and covers various aspects such as the outreach mechanism used by different states/UTs under NDLM training, while also revealing the perceptions of the trainees on the need for regularity of NDLM training and the form of the NDLM content and material.
Chapter 5 analyses the infrastructure and the classroom processes of the training centres, which is believed to be critical for imparting appropriate digital literacy training to the beneficiaries. For this purpose, the chapter scrutinises the basic and secondary facilities available at the training centre, viz. computers, Internet connection, printer, scanner, and power back-up, and classroom processes such as the language used for the training, knowledge of the trainer, the teaching methods adopted, and the examination and certification process following the training.
The impact of the NDLM training on the beneficiaries is expounded in Chapter 6, which also examines the effect that the training has had in the lives of the trainees in terms of enhancing their knowledge and skills in the usage of digital devices.
Chapter 7 concludes the study with an exploration of the impact of the NDLM intervention on the beneficiaries. It presents a cross-country scenario on the overall effect of the training and classifies the performance of the participating states in the ‘good’, ‘moderate’ and ‘low’ categories. It then goes on to identify the gaps in the design and implementation of the training programme and provides suggestions and recommendations for improving the programme in its future phases.


2 Bridging the Digital Divide: Imparting Digital Literacy Training to Non-IT-Literate Citizens | 7
2 Bridging the Digital Divide: Imparting Digital Literacy Training to Non-IT-Literate Citizens
BaCkgROuND
History has witnessed two industrial revolutions associated with general purpose technology, the first driven by steam and the second by electricity. The third revolution, namely the Information Technology (IT) revolution, driven by computers and networks, is unfolding now (UNDP, 2015). For more than three decades now, Information and Communication Technology (ICT) or IT has been instrumental in transforming human lives in ways that one cannot possibly deny or overlook. The history of IT dates back to the landmark invention of the moveable typewriting machine by Guttenberg. Thereafter, it meandered its way through other iconic creations, starting from the giant calculator to the Personal Computer (PC), finally making way for laptops, tablets and smart phones. A major qualitative and quantitative leap occurred when PCs were connected to one another via Local Area Networks (LANs), and later on via Wide Area Networks (WANs) in case of long distance machines. During the mid-1970s, a computer was considered to be an extremely complex device that could be operated only by trained professionals. However, with the passage of time, the scenario is changing and different sections of society now have access to various kinds of digital devices, though this access is still not universal.
The digital boom revolutionised the lives of people in the developed countries by empowering them with increased access to information, government authorities and other services, and the creation of better livelihood opportunities, among many other advantages. However, critics argue that the other side of the coin of the ‘digital boom’ is the ‘digital divide’, not only between the rich and the poor people, but also between the developed and developing nations.
For instance, Figure 2.1 highlights the various forms of uneven accesses ranging from macro to micro aspects.
It is also argued that the digital divide is the outcome of not only the unavailability of IT services but also the lack of access to technology and the inability to use it effectively, resulting from a myriad economic, socio-political, institutional, as well as cultural context. However, IT can be the harbinger of development by facilitating the right
DIgITaL LITERaCy
“ Digital Literacy is the ability of individuals and communities to understand and use
digital technologies for meaningful actions within life situations.”
Source: www.ndlm.in

8 | Digital Literacy Training to Non-IT Literate Citizens: Impact Assessment of the NDLM
policies, and spreading digital literacy, which is
necessary to universalise its benefits.
Digital literacy is one of the many ways of
removing the so-called digital divide. It can help
farmers stay updated on weather forecasts, and
the latest fertilisers and farming techniques, while
also enabling patients in remote areas to book
their appointments with doctors online, instead
of having to travel for long hours to book these
appointments. Schoolteachers can also download
educational materials and lesson plans for their
students (Atkinson and Castro, 2008). In fact,
there are a number of examples in India as well as
other countries, where the digital revolution has
actually contributed in bringing about a positive
change in the life of the common man.
In Ethiopia, farmers use mobile phones to
check coffee prices while their Saudi Arabian
counterparts use wireless technologies to
carefully distribute scarce irrigated water for
wheat cultivation. In some villages in Bangladesh,
female entrepreneurs use their mobile phones
to provide paid services to their neighbours
(UNDP, 2015).
The 1999 project—Computer Access for Farmers
of Madhya Pradesh—addressed some of the
major concerns of the farmers, and also acted as
a social justice mechanism by handling local level
grievances and administrative matters through
Internet connections. In 2001, the Gyandoot Soochnalaya scheme of the Dhar district of Madhya Pradesh aimed to build a low-cost rural Intranet facility by joining 20 village information kiosks. This enabled villagers in the district to access the Internet and share information, which helped in increasing the prices of the farmers’ produce by 3–5 per cent, and saved them from having to pay commissions to middlemen. In 2008, computerised tea auctions and spot trading initiated by the Indian Tea Board allowed buyers to bid from anywhere in the world, with a view to ensuring more efficient services and fairer prices for the country’s tea farmers. The online booking of railway tickets through the Indian Railway Catering and Tourism Corporation Limited (IRCTC) and online appointment at the All India Institute of Medical Sciences (AIIMS), now help save a lot of time and energy.
Thus, for people to realise the benefits of IT revolution, it is important to interlink digital literacy with the strong foundation of formal
FIguRE 2.1: uNEVEN aCCESS TO ThE DIgITaL REVOLuTION
Source: Prepared by the authors based on Human Development Report, 2015.
Developed andDeveloping Countries
Urban and Rural Areas
Women and Men
In 2015, 81% of households in developed countries had internet access, compared to 34 % in developing countries and 7% in the least developed countries
•
In 2015, 89% of the world's urban population had 3G mobile broadband coverage, compared to 29% in rural population
•
In 2013, 1.3 billion women (37%) and 1.5 billion men (41%) used the internet
•
FIguRE 2.2: DIgITaL LITERaCy aND FORMaL EDuCaTION aS a CaTaLyST
Formaleducation
Digitalliteracy
Awareness
Knowledge
Self con�dence
Skill
Income
Innovation
Source: Prepared by the authors.
2 Bridging the Digital Divide: Imparting Digital Literacy Training to Non-IT-Literate Citizens | 9
education (Figure 2.2), which can enhance the capability of citizens to optimally utilise digital technologies.
Understanding the importance of digital technology, in recent years, a number of inclusion projects have been undertaken in different developing countries to bridge the digital gap. In 1994, a long-term community-based development project was initiated in the small town of Siyabuswa in South Africa, which provided supplementary tuition on Saturdays to secondary school learners. In 2001, telecentre projects were started in the city of Sao Paulo in Brazil and community telecentres were installed by government agencies (but operated by community leaders) to provide free Internet access and digital literacy courses (Madon, et al., 2009). The interventions on digital literacy in India have been discussed in the forthcoming section.
INDIa: ThE DIgITaL DISCOuRSE
India serves as a hub for providing technically qualified people to the IT sector worldwide. While continuing to be on the lower brackets in most United Nations (UN) developmental indicators, India has managed to maintain a more than respectable position in the world-wide race for technologies ever since IT became a popular economic development catchphrase. However, as observed by Kapoor and Mathur (2016), in spite of the appreciation received for providing IT services, India has been criticised for the huge digital divide being faced by the country. One of the ways of bridging digital divide is to make the citizens of the country competent by providing digital literacy and promoting awareness amidst
the people on the usage of digital devices. This Impact Assessment Study of the NDLM being implemented by the Indian government is a step in that direction.
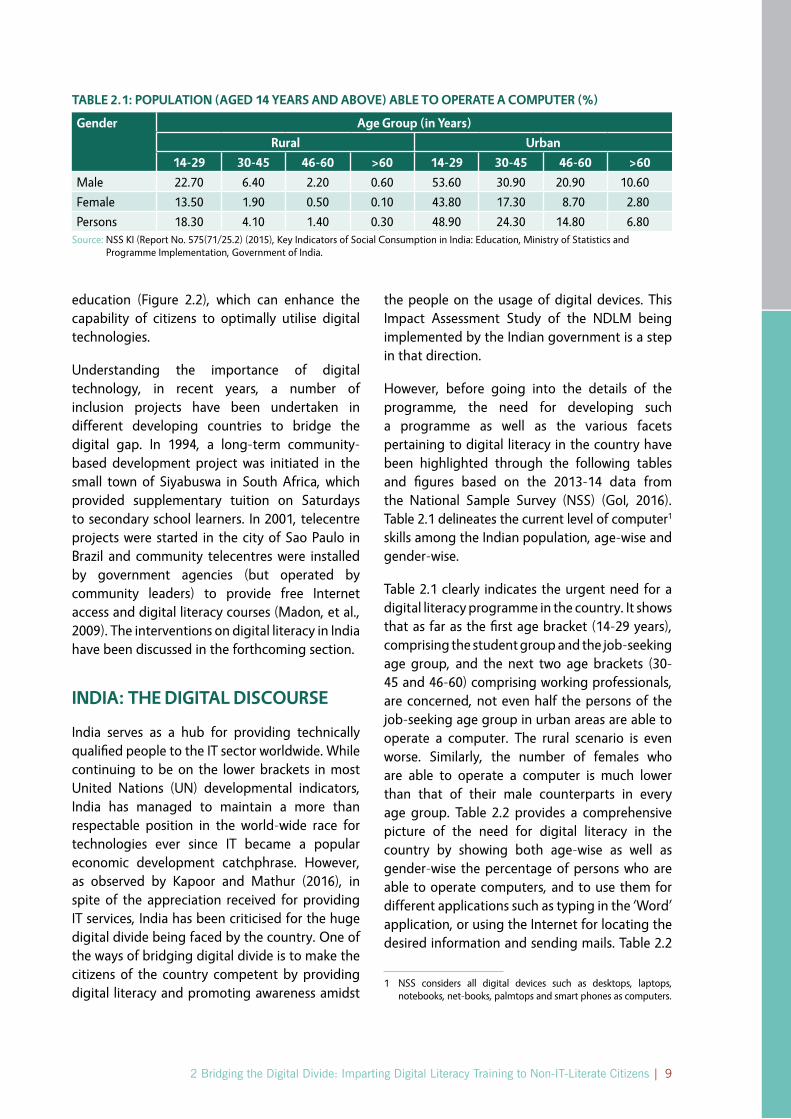
However, before going into the details of the programme, the need for developing such a programme as well as the various facets pertaining to digital literacy in the country have been highlighted through the following tables and figures based on the 2013-14 data from the National Sample Survey (NSS) (GoI, 2016). Table 2.1 delineates the current level of computer1 skills among the Indian population, age-wise and gender-wise.
Table 2.1 clearly indicates the urgent need for a digital literacy programme in the country. It shows that as far as the first age bracket (14-29 years), comprising the student group and the job-seeking age group, and the next two age brackets (30-45 and 46-60) comprising working professionals, are concerned, not even half the persons of the job-seeking age group in urban areas are able to operate a computer. The rural scenario is even worse. Similarly, the number of females who are able to operate a computer is much lower than that of their male counterparts in every age group. Table 2.2 provides a comprehensive picture of the need for digital literacy in the country by showing both age-wise as well as gender-wise the percentage of persons who are able to operate computers, and to use them for different applications such as typing in the ‘Word’ application, or using the Internet for locating the desired information and sending mails. Table 2.2
1 NSS considers all digital devices such as desktops, laptops, notebooks, net-books, palmtops and smart phones as computers.
TaBLE 2.1: POPuLaTION (agED 14 yEaRS aND aBOVE) aBLE TO OPERaTE a COMPuTER (%)
gender age group (in years)
Rural urban
14-29 30-45 46-60 >60 14-29 30-45 46-60 >60
Male 22.70 6.40 2.20 0.60 53.60 30.90 20.90 10.60
Female 13.50 1.90 0.50 0.10 43.80 17.30 8.70 2.80
Persons 18.30 4.10 1.40 0.30 48.90 24.30 14.80 6.80Source: NSS KI (Report No. 575(71/25.2) (2015), Key Indicators of Social Consumption in India: Education, Ministry of Statistics and
Programme Implementation, Government of India.

10 | Digital Literacy Training to Non-IT Literate Citizens: Impact Assessment of the NDLM
TaBLE 2.2: PuRPOSE OF uSagE OF a COMPuTER (%) (2013-14)
State/uT ability to Operate a Computer(Percentage in the Population of a
Particular age group)
ability to use a Computer for Various uses (Percentage of Respondents aged
14 years and above)
Male Female Male Female
age group (years) age group (years) Typing Internet for Typing Internet
14-2
9
30-4
5
45-6
0
60+
14-2
9
30-4
5
45-6
0
60+
Sear
ch
e-m
ails
sear
ch
e-m
ails
Andhra Pradesh 34 14 8 2 21 6 2 0 18 18 17 8 8 7
Arunachal Pradesh 30 13 8 0 21 5 1 0 18 16 15 11 10 9
Assam 21 7 9 2 16 3 2 2 11 10 10 7 6 5
Bihar 16 4 2 2 8 1 0 0 7 8 7 29 3 3
Chhattisgarh 14 5 4 2 9 3 1 0 7 7 6 4 3 3
Delhi 57 42 29 34 54 27 20 19 44 45 44 34 33 33
Goa 78 31 30 21 64 27 18 4 44 40 36 32 25 24
Gujarat 41 19 11 4 27 8 4 0 23 21 20 13 10 9
Haryana 42 16 7 8 30 10 4 1 23 23 20 15 13 11
Himachal Pradesh 51 20 13 3 40 9 5 1 26 24 23 16 15 14
Jammu & Kashmir 29 11 6 4 20 4 3 3 15 15 13 8 8 6
Jharkhand 22 5 6 0 11 2 1 0 11 11 10 5 4 4
Karnataka 41 19 9 2 30 10 3 2 22 21 19 14 12 11
Kerala 81 34 16 6 74 25 9 2 37 35 33 30 25 22
Madhya Pradesh 23 9 8 2 14 4 2 0 13 13 12 6 6 6
Maharashtra 45 24 14 8 35 13 7 3 26 27 25 17 16 16
Manipur 24 8 5 2 15 4 2 0 8 11 9 3 6 4
Meghalaya 30 12 7 9 30 9 3 1 18 16 11 16 13 9
Mizoram 49 32 20 5 43 25 16 2 31 23 19 26 19 15
Nagaland 77 42 38 8 63 23 14 0 48 45 44 35 29 33
Odisha 18 9 5 1 12 2 1 0 10 10 10 5 5 4
Punjab 49 19 9 4 39 11 2 0 25 24 22 17 15 13
Rajasthan 34 12 8 3 17 4 2 0 18 18 16 7 7 6
Sikkim 37 25 12 1 38 16 6 0 26 26 26 23 23 23
Tamil Nadu 53 23 9 5 46 11 4 1 26 25 23 18 16 15
Telangana 39 20 6 6 25 6 3 0 22 22 21 11 10 10
Tripura 13 5 5 1 7 2 1 0 7 6 6 3 3 2
Uttar Pradesh 23 9 5 2 13 3 2 1 12 12 10 6 6 5
Uttarakhand 40 18 6 1 21 7 1 0 21 22 21 10 10 10
West Bengal 26 11 7 3 18 5 1 0 14 12 11 8 7 6
A&N Islands 38 16 7 0 37 10 14 0 19 18 15 20 15 13
Chandigarh 73 33 49 28 65 25 33 0 51 48 46 44 37 36
Dadra & Nagar Haveli 27 32 28 0 27 15 14 0 28 28 28 19 17 17
Daman & Diu 30 43 5 2 50 15 5 0 31 32 28 28 29 22
Lakshadweep 65 47 30 17 57 22 3 0 47 45 44 28 26 24
Puducherry 61 42 22 16 57 18 15 1 39 41 38 27 27 25
all-India 32 14 8 4 23 7 3 1 18 17 16 11 10 9Source: National Sample Survey (NSS), Report No. 575(71/25.2/1) (2015), Government of India.

2 Bridging the Digital Divide: Imparting Digital Literacy Training to Non-IT-Literate Citizens | 11
therefore, reveals primarily two things: Firstly, the percentages are significantly low (for example, only approximately 17 per cent of the male and 10 per cent of the female respondents in the age group of 14–29 years can use computers for typing and browsing purposes); and secondly, there are large regional (state-wise) disparities. Both these findings call for the urgent implementation of a national level digital literacy programme.
On the other hand, Figure 2.3 reveals the existing digital base for such a programme, in terms of access to computers and Internet facility. On an average, only 14 per cent of the Indian households possess computers and 27 per cent have access to internet facility. However, there are significant disparities among the states/UTs. For instance, states like Bihar, Chhattisgarh, Jharkhand, Odisha and Tripura are far behind states/UTs like Goa, Chandigarh and Delhi in terms of the number of households having computers. At the same time, in states like Andhra Pradesh and Tamil Nadu, comparatively fewer households possess computers though access to the Internet is quite high.
It was in this backdrop of diverse digital capabilities and the dire need to augment these capabilities that the National Digital Literacy Mission was launched in August 2014. The programme is briefly described in the following sections.
FIguRE 2.3: hOuSEhOLDS wITh aCCESS TO COMPuTERS aND INTERNET FaCILITy (%) (2013-14)
Source: Prepared by the authors from NSSO data, Report No. 575 (71/25.2/1).
01020304050607080
% household having computer% of household having access to internet (at least one member of age 14 years and above)
And
hra
Prad
esh
Aru
nach
al P
rade
shA
ssam
Biha
rCh
hatt
isga
rhD
elhi
Goa
Guj
arat
Har
yana
Him
acha
l Pra
desh
Jam
mu
& K
ashm
irJh
arkh
and
Karn
atak
aKe
rala
Mad
hya
Prad
esh
Mah
aras
htra
Man
ipur
Meg
hala
yaM
izor
amN
agal
and
Odi
sha
Punj
abRa
jast
han
Sikk
imTa
mil
Nad
uTe
lang
ana
Trip
ura
Utt
ar P
rade
shU
ttar
akha
ndW
est B
enga
lA
&N
Isla
nds
Chan
diga
rhD
adra
& N
agar
Hav
eli
Dam
an &
Diu
Laks
hadw
eep
Pudu
cher
ry
NaTIONaL DIgITaL LITERaCy MISSION (NDLM)2
Gauging the importance of the usage of ICT for human development and the economy of the country, the National Policy on Information and Technology (NPIT), 2012, articulated the broad objective of digital literacy: making one person in every household of India e-literate in order to bridge the existing digital divide (Government of India, 2012). In line with the objective of the National IT Policy, NDLM was launched in August 2014 with the aim of providing digital literacy to 52.5 lakh Indians, that is, one in every eligible household in the selected blocks of every state and UT in the country. In the first phase, 10 lakh citizens have been trained under NDLM, while the remaining 42.5 lakh people are slated to be trained in the second phase.
NDLM OBjECTIVES
The primary objective of the scheme is to enable the beneficiaries to use IT and IT-related applications for effectively participating in the democratic processes and enhancing their
2 The forthcoming section on NDLM is based on the information available in http://www.ndlm.in.

12 | Digital Literacy Training to Non-IT Literate Citizens: Impact Assessment of the NDLM
FIguRE 2.4: PROCESS OF NDLM
Source: Prepared by the authors.
NDLM Objectives Input
Processes to reach outcome:
Output Expected Outcome
To impart basic ICT skill to SC/ST/ BPL/General Household
• Identi�cation of key partners
• Sharing of responsibilities
• Bene�ciaryIdenti�cation
• Financial Assistance• Training Centre• Training Components
(curriculum, content, module)
• Training Duration & Process
• Examination & Certi�cation
Citizens will:• Use IT & IT related
applications in day-to-day activities
• Participate in democracy
• Enhance livelihood using the acquired ICT skills
livelihood opportunities. The specific objectives of the scheme are to make IT-illiterate persons competent enough to operate digital devices like mobile phones, tablets, and computers so that they can send and receive emails, and search for information on the Internet. The process is briefly described in Figure 2.4.
TaRgETED BENEFICIaRIES
The targeted beneficiaries of NDLM were selected from households wherein no member in the age group of 14 to 60 years is IT-literate. Moreover, adequate representation was given to women, persons belonging to the disadvantaged groups (SCs/STs) and BPL households.
IMPLEMENTINg agENCy
CSC e-Governance Services Limited, the Special Purpose Vehicle (SPV) of the Ministry of Electronics and Information Technology (MEITY), is the implementing agency for NDLM. The programme is being implemented with the active collaboration of all the state governments and UT administrations.
COuRSE
The course entitled ‘Appreciation of Computer Concepts (ACC)’ was prescribed for the trainees of NDLM. The duration of the training course is for a total of 20 hours, to be logged between a minimum of 10 days and a maximum of 30 days. The details of the content under this module are presented in Table 2.3.
The medium of instruction of the NDLM training was any of the official languages of India. A
TaBLE 2.3: NDLM COuRSE MODuLE
Sl. No.
Module Name Learning hours
1. Introduction to Digital Devices 2
2. Operating Digital Devices 4
3. Introduction to the Internet 2
4. Communications using the Internet
6
5. Applications of Internet 6
Total 20 hours
Source: www.ndlm.in

2 Bridging the Digital Divide: Imparting Digital Literacy Training to Non-IT-Literate Citizens | 13
nominal fee of Rs. 125 was to be paid by candidates belonging to the ‘General’ category while SC, ST and BPL households were provided the training free of cost.
MODE OF TRaININg
The physical delivery of IT literacy training was designed in the Public–Private Partnership (PPP) mode, with support from various partner agencies. Each partner agency was assigned a specific area of operation and target by the respective state government/UT administration in consultation with CSC-SPV. The partners involved include:
Adult Literacy Centres, Department of zz
School Education and Literacy, MHRD;
Common Service Centres (CSCs);zz
National Institute of Electronics and zz
Information Technology (NIELIT) Centres and their accredited centres;
Indira Gandhi National Open University zz
(IGNOU) and its authorised centres;
Rural Self Employment Training Institutes zz
(RSETIs);
Non-Governmental Organisations (NGOs) zz
involved in spreading IT literacy
Industry partners;zz
Companies with Corporate Social zz
Responsibility (CSR) provisions; and
Others.zz
ExPECTED LEaRNINg OuTCOME
After attending the IT literacy training, it was expected that the trainees would be able to perform the following:
Explain the basics of digital devices;zz
Use digital devices for accessing, creating, zz
managing and sharing information;
Use the Internet to browse in an effective zz
and responsible manner;
Use technology to communicate zz
effectively; and
Appreciate the role of digital technology zz
in everyday life, in social life and at work.
aSSESSMENT aND CERTIFICaTION
After completion of the training programme, the trained candidates of the programme undergo a term-end online examination at the centre of the certifying agency. The duration for the online examination is one hour and it covers 25 questions. Successful candidates are issued a digital version of the certificate on the spot. After formal verification of the course completion, the original certificate in hard copy is distributed to the successful candidates.
TRaININg TaRgETS FOR DIFFERENT CaTEgORIES OF STaTES/uTs
In order to effectively implement the scheme across the country, the states and UTs were categorised into three broad categories (A, B and C) on the basis of their respective populations. The training targets of the first phase of NDLM for the states and UTs are expounded in Table 2.4.

14 | Digital Literacy Training to Non-IT Literate Citizens: Impact Assessment of the NDLM
TaBLE 2.4: STaTE/uT-wISE BREak-uP OF ThE TRaININg TaRgETS
Categories States/uTs Training Target per State Total Target
Category A (10 States)
Andhra PradeshBiharGujaratKarnataka Madhya PradeshMaharashtraRajasthanTamil Nadu Uttar PradeshWest Bengal
60,000 6,00,000
Category B (10 States)
AssamChhattisgarh DelhiHaryanaJammu & KashmirJharkhandKerala OdishaPunjabUttarakhand
20,000 2,00,000
Category C (15 States/UTs)
Andaman & Nicobar IslandsArunachal Pradesh ChandigarhDadra & Nagar HaveliDaman & Diu GoaHimachal PradeshLakshadweep ManipurMeghalayaMizoramNagaland PuducherrySikkimTripura
6666 1,00,000
Respondents supported by CSR, NGOs and others 1,00,000
Total 10,00,000
Source: Prepared by authors based on information from NDLM website – www.ndlm.in.
The subsequent chapters of the report present the findings and the analysis based on the
interviews held with the beneficiaries, training partners and training centres of NDLM.

3 Beneficiaries of NDLM | 15
3 Beneficiaries of NDLM
INTRODuCTION
This chapter presents the findings of the survey in juxtaposition to the dimension on ‘Beneficiary Coverage’ and verifies the extent to which the objectives of NDLM have been met in terms of targeting the beneficiaries. The detailed findings are preceded by a brief discussion on the demographic and social background of the NDLM trainees (covered in the sample). This is followed by a delineation of the state-wise scenarios emerging from the different findings in relation to the target group of NDLM in terms of age, gender, caste and BPL/Non-BPL category, other components such as the trainee benefiting per family, digital literacy status of the trainee’s family, and financial support offered to the beneficiaries.
DEMOgRaPhIC aND SOCIaL PROFILE OF SaMPLE BENEFICIaRIES
As per the sample selection procedure, about three-fourths of the sample beneficiaries are from the category A states, including Andhra Pradesh, Bihar, Gujarat, Karnataka, Madhya Pradesh, Maharashtra, Rajasthan, Tamil Nadu, Uttar Pradesh and West Bengal. The respondents surveyed in the B and C category states accounted for 21 per cent and 6 per cent, respectively, of the total respondents surveyed under NDLM (Table 3.1). Initially, a total sample consisting of 20,000, 6670 and 3330 from the A, B and C category states, respectively, was to be selected for the survey,
with the number of respondents selected being in proportion to the total population identified for training under NDLM in each of these states. However, due to the negligible number of trainees in the Andaman & Nicobar Islands, Assam, Dadra & Nagar Haveli, Goa, Meghalaya, Mizoram and Sikkim, these states were not covered for the survey. The Lakshadweep Islands too have been excluded from the survey, as NDLM training is not being imparted there. The survey data of Andhra Pradesh also includes Telangana, wherein the trainee beneficiaries were selected from Andhra Pradesh, while the training partners were selected from Telangana. Finally, therefore, a total of 27,557 beneficiaries were interviewed from 22 states and 4 Union Territories, with the majority of them being from the A category states.
The age-wise classification of the beneficiaries reveals that the youngest lot of respondents in the age group of 14 to 25 years are the chief beneficiaries of NDLM training followed by candidates in the age bracket of 26 to 35 years, (84 per cent and 11 per cent, respectively). Nearly 4 per cent of the respondents trained were in the age group of 36 to 45 years, while the corresponding proportion in the age group of 46 to 60 years was 1 per cent. A negligible proportion of candidates in the age groups of below 14 years and above 60 years have also benefited from this training programme.
In terms of gender, the target of NDLM was to provide adequate representation to women, and the survey reveals that a substantial proportion of

16 | Digital Literacy Training to Non-IT Literate Citizens: Impact Assessment of the NDLM
TaBLE 3.1: DEMOgRaPhIC aND SOCIaL PROFILE OF ThE SaMPLE BENEFICIaRIES
Beneficiaries (No.) Beneficiaries (%)
State wise Coverage A Category States 20,000 72.60
B Category States 6,003 21.80
C Category States 1,554 5.60
age <14 119 0.43
14-25 23,134 83.95
26-35 3,033 11.01
36-45 955 3.47
46-60 289 1.05
>60 27 0.10
gender Male 17,043 61.85
Female 10,514 38.15
Religion Hindu 22,903 83.11
Muslim 3,569 12.95
Christian 386 1.40
Others 699 2.54
Caste General 7,516 27.27
SC 5,538 20.10
ST 1,968 7.14
OBC 11,974 43.45
No Response 562 2.04
A Category States
B Category States
C Category States
State wise Coverage
73%
22%
5%
0.5%
11%4%
1%0.1%
Age
<1414-2526-3536-4546-60>60
84%
62%
38%
Gender
MaleFemale
83%
13%
1%3%
Religion
HinduMuslimChristianOthers
27%
20%
7%
44%
2%
Caste
GeneralSCSTOBCNo Response

3 Beneficiaries of NDLM | 17
the candidates trained were women (38 per cent), even though the male members were the major beneficiaries.
As regards religion, it can be observed that 83 per cent of the beneficiaries were Hindus, followed by Muslims (13 per cent), other categories (3 per cent) and Christians (1 per cent). The other categories include Sikhs, Jains, Parsis and Buddhists.
Although the NDLM training intends to offer higher representation to the SC and ST candidates, it can be observed that at the national level, a majority of the respondents were from the OBC category (44 per cent), followed by those from the general category (27 per cent). The proportion of beneficiaries from the SC and ST categories was quite low at 20 per cent and 7 per cent, respectively. About 2 per cent of the surveyed respondents did not want to reveal their caste identity.
In terms of reaching out to the BPL card-holders, the NDLM programme achieved its target in a remarkable manner, as it can be found that about 64 per cent of the candidates trained were from that category. However, the non-BPL card holders accounted for only 28 per cent of the trained population. While 5 per cent of the respondents
did not have ration cards, 3 per cent did not respond to the question asking about possession of a ration card.
As far as the educational status of the candidates is concerned, the programme was mostly beneficial to the group falling in the category of the higher secondary level of education, and 31 per cent of the people trained belonged to this group. The next in this order are the people at the college level and 24 per cent of the graduates benefited from the NDLM training. In addition, 15 per cent of the Diploma holders and 9 per cent of those who had completed standards 9 and 10 were the other beneficiaries of the training programme. It can also be observed that the training programme had benefited illiterates and neo-literates too, though their proportion was comparatively low.
Overall, the national scenario reveals that NDLM has been remarkably successful in reaching out to the intended beneficiaries, particularly the BPL card-holders. However, the participation of women and SC/ST candidates was found to be lagging behind the target, which calls for appropriate strategies for targeting these two categories of beneficiaries in the next phase of the programme. However, state level disparities were noticed and a number of good practices were also
Ration Card BPL 17,602 63.87
Non-BPL 7748 28.12
No Ration Card 1388 5.04
No Response 816 2.96
Education Status Illiterate 223 0.81
Neo Literate 410 1.49
Upto 7 1,306 4.74
Upto 10 5,115 18.56
Upto 12 8,529 30.95
ITI/Diploma 4,227 15.34
Graduate 6,578 23.87
No Response 1,169 4.24
Source: Survey.
64%
28%
5% 3%
Ration Card Status
BPL
No Ration Card
No Response
Non-BPL
5% 19%
31%
15%
24%
4%
Educational Status
IlliterateNeo LiterateUpto 7thUpto 10Upto 12ITI/ DiplomaGraduateNo Response
1%0.1%
18 | Digital Literacy Training to Non-IT Literate Citizens: Impact Assessment of the NDLM
observed in different villages in various states. The state-wise analysis is presented in the next section, highlighting both regional discrepancies as well as some good practices which can be replicated by the other states in the next phase for ensuring better outcomes.
gROuND REaLITIES: BENEFICIaRy COVERagE
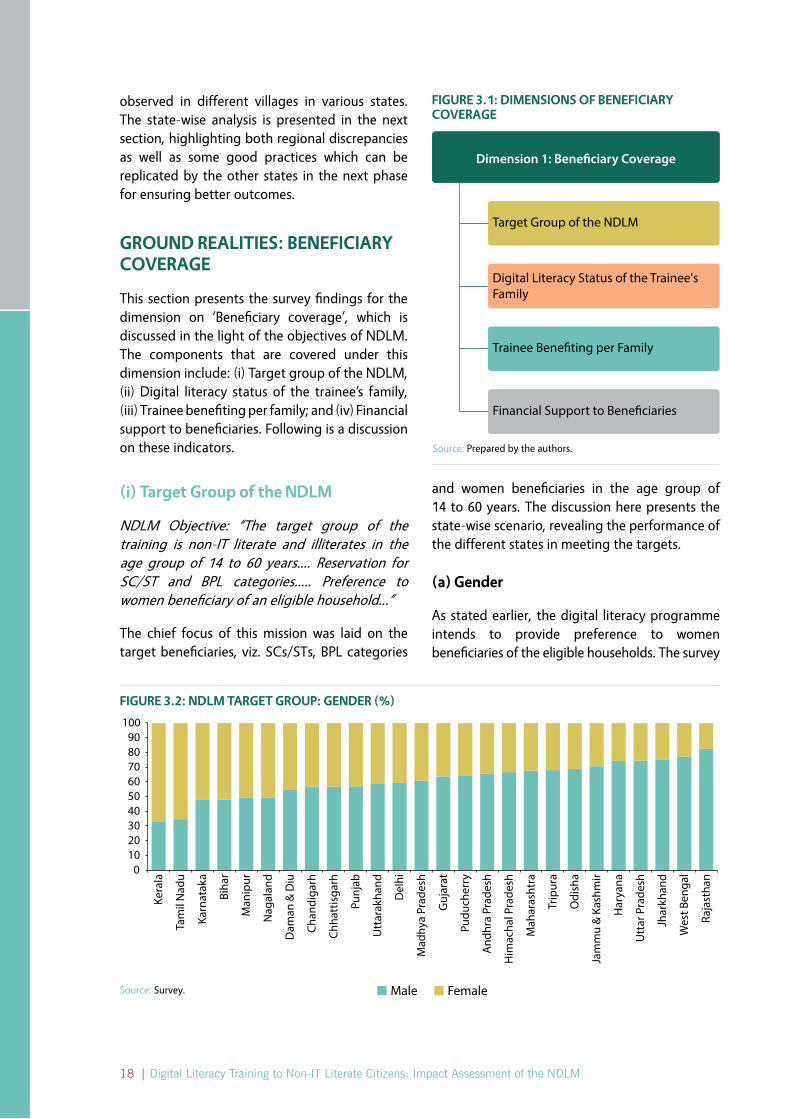
This section presents the survey findings for the dimension on ‘Beneficiary coverage’, which is discussed in the light of the objectives of NDLM. The components that are covered under this dimension include: (i) Target group of the NDLM, (ii) Digital literacy status of the trainee’s family, (iii) Trainee benefiting per family; and (iv) Financial support to beneficiaries. Following is a discussion on these indicators.
(i) Target group of the NDLM
NDLM Objective: “The target group of the training is non-IT literate and illiterates in the age group of 14 to 60 years…. Reservation for SC/ST and BPL categories….. Preference to women beneficiary of an eligible household…”
The chief focus of this mission was laid on the target beneficiaries, viz. SCs/STs, BPL categories
FIguRE 3.1: DIMENSIONS OF BENEFICIaRy COVERagE
Dimension 1: Beneficiary Coverage
Target Group of the NDLM
Trainee Bene�ting per Family
Digital Literacy Status of the Trainee's Family
Financial Support to Bene�ciaries
and women beneficiaries in the age group of 14 to 60 years. The discussion here presents the state-wise scenario, revealing the performance of the different states in meeting the targets.
(a) gender
As stated earlier, the digital literacy programme intends to provide preference to women beneficiaries of the eligible households. The survey
FIguRE 3.2: NDLM TaRgET gROuP: gENDER (%)
Source: Survey.
0102030405060708090
100
Kera
la
Tam
il N
adu
Karn
atak
a
Biha
r
Man
ipur
Nag
alan
d
Dam
an &
Diu
Chan
diga
rh
Chha
ttis
garh
Punj
ab
Utt
arak
hand
Del
hi
Mad
hya
Prad
esh
Guj
arat
Pudu
cher
ry
And
hra
Prad
esh
Him
acha
l Pra
desh
Mah
aras
htra
Trip
ura
Odi
sha
Jam
mu
& K
ashm
ir
Har
yana
Utt
ar P
rade
sh
Jhar
khan
d
Wes
t Ben
gal
Raja
stha
n
FemaleMale
Source: Prepared by the authors.

3 Beneficiaries of NDLM | 19
reveals that though male members were the major beneficiaries of the NDLM training, in some of the states, more than 50 per cent of the beneficiaries trained were women. In Kerala and Tamil Nadu, 67.3 per cent and 65.4 per cent of the trainees, respectively, were women, while the corresponding proportion in Karnataka, Bihar, Manipur and Nagaland was 50 per cent.
Female enrolment in the training is, however, low in the states of Rajasthan, West Bengal, Jharkhand and Uttar Pradesh. Gender disparity between states like Kerala, on one hand, and Haryana, Uttar Pradesh, Jharkhand, and Rajasthan, on the other hand, is indicative of the national scenario reflecting the male female literacy rate existing in our country as per NSS data. However, there are some states like Tripura and West Bengal, where the gender disparity as per NSS data is low, in contrast to our sample findings. Sex discrepancy in the coverage of NDLM can be attributed to many reasons, which need to be seen in tandem with the other findings. However, some states have taken innovative measures to increase women’s participation by taking some women-friendly measures like organising the training in convenient time slots like the noon or afternoon, particularly for housewives when they are relatively free.
(b) age
The target age group of this programme is 14 to 60 years. Similar to the national scenario, in almost all the states, young people in the age group of 14 to 25 were the chief beneficiaries (Table 3.2).
There are a number of states where more than 90 per cent of the trainees were found to be in
this age group, including Chandigarh, Bihar, Daman & Diu and Delhi. Since this is the age group where people generally complete their studies and apply for jobs, this skill development training programme attracted them the most. At the same time, targeting this age bracket is also much easier in different educational institutions like schools and colleges.
Regional variations were found among the group of young professionals (that is, the age bracket of 26-35 years), whereas in some states the ratios were found to be significant, for example, Himachal Pradesh (22 per cent), followed by Tripura (17 per cent), Nagaland (16 per cent) and Jammu & Kashmir (15 per cent). There were also some states/UTs where the ratios were much lower, such as Bihar (5 per cent) and Chandigarh (3 per cent).
If the low share of beneficiaries is due to the fact that the timing of the training clashed with their busy working hours, then a separate time slot for working people can help increase their participation. Some states witnessed a surprising trend in terms of the age category of the candidates: the proportion of participants from the non-target group—children below 14 years and adults above 60 years—was high. For instance, in Odisha, 8 per cent of the candidates surveyed were below 14 years, but in other states, the figure in this category was negligible. Elderly candidates above 60 years showed an interest in acquiring the NDLM training in some of the states, viz. Haryana, Maharashtra, and Andhra Pradesh, though their proportion was small. The elderly trainees were found to be using Skype and WhatsApp to get connected with their relatives who were staying abroad.
BOx 3.1: CaSE STuDy OF MaLLaMaDugu, TELaNgaNa: VILLagE wITh MORE wOMEN REPRESENTaTIVES
Strategic measures were visible in the efforts taken by the VLEs of Telangana. The appropriate candidates for the NDLM training were identified by carrying out a door-to-door survey, covering every household of the village. In the Mallamadugu village, out of 400 people who were trained, 98 per cent were women and most of them were in the age group of 25 to 35 years. Different batches of NDLM training with a time slot catering to the preference of women candidates were organised, which was critical for ensuring greater representation of women.
Source: Survey.

20 | Digital Literacy Training to Non-IT Literate Citizens: Impact Assessment of the NDLM
TaBLE 3.2: COVERagE OF BENEFICIaRIES: agE (yEaRS) (%)
Sl. No. States/uTs <14 14-25 26-35 36-45 46-60 >60
Category a States
1. Andhra Pradesh 0.45 81.55 12.90 3.80 1.15 0.15
2. Bihar 0.00 93.35 5.10 1.00 0.45 0.10
3. Gujarat 0.25 78.30 14.50 4.15 2.70 0.10
4. Karnataka 0.05 87.40 9.05 2.45 1.05 0.00
5. Madhya Pradesh 0.35 82.60 12.65 3.85 0.45 0.10
6. Maharashtra 0.35 82.35 11.50 4.65 0.85 0.30
7. Rajasthan 0.35 89.35 8.30 1.60 0.30 0.10
8. Tamil Nadu 0.35 78.95 13.95 5.40 1.25 0.10
9. Uttar Pradesh 0.25 88.10 9.65 1.60 0.35 0.05
10. West Bengal 0.25 83.40 11.35 3.85 1.05 0.10
Category B States/uTs
11. Chhattisgarh 0.00 85.31 10.94 3.30 0.45 0.00
12. Delhi 0.00 90.40 5.85 2.85 0.75 0.15
13. Haryana 0.15 81.71 14.99 2.10 0.75 0.30
14. Jammu & Kashmir 0.45 80.66 15.14 2.85 0.90 0.00
15. Jharkhand 0.30 84.71 10.34 3.90 0.75 0.00
16. Kerala 0.15 74.66 14.69 7.35 3.15 0.00
17. Odisha 8.40 76.91 9.00 4.50 1.05 0.15
18. Punjab 0.00 86.21 9.45 3.45 0.90 0.00
19. Uttarakhand 0.15 84.71 10.19 3.30 1.50 0.15
Category C States/uTs
20. Chandigarh 0.00 95.05 3.15 0.90 0.90 0.00
21. Daman & Diu 0.00 94.59 4.50 0.90 0.00 0.00
22. Himachal Pradesh 0.00 62.16 22.97 10.81 4.05 0.00
23. Manipur 0.45 83.78 8.11 6.31 1.35 0.00
24. Nagaland 0.00 69.82 16.22 10.81 3.15 0.00
25. Puducherry 0.45 85.14 10.36 2.70 1.35 0.00
26. Tripura 0.00 75.23 17.12 5.41 2.25 0.00
all India 0.43 83.95 11.01 3.47 1.05 0.10Source: Survey.
(c) Caste
One of the objectives of the NDLM training programme is to accord adequate representation to the SC and ST candidates, but this goal was attained only in some states. Overall, in most of the states, the representation of OBC candidates was the highest, followed by that of the General category candidates (Table 3.3).
Table 3.3 also reveals that the representation of the SC trainees was high in the states of
Rajasthan, followed by Punjab, Chandigarh and Tripura. On the other hand, this percentage was low in a few states like Jammu & Kashmir, Kerala and Daman & Diu. It was also observed that the proportion of ST candidates was high in Nagaland, followed by that in Chhattisgarh, Daman & Diu and Gujarat. In contrast, the states of Bihar, Punjab, Chandigarh and Tamil Nadu witnessed a very low percentage, of ST candidates, at only 1 per cent.

3 Beneficiaries of NDLM | 21
TaBLE 3.3: COVERagE OF BENEFICIaRIES: CaSTE (%)
Sl. No. States/uTs general SCs STs OBCs
Category a States
1. Andhra Pradesh 27.25 16.65 9.35 43.85
2. Bihar 13.15 16.10 0.95 69.10
3. Gujarat 35.45 12.75 15.35 35.30
4. Karnataka 39.95 18.00 6.50 34.65
5. Madhya Pradesh 19.55 23.00 8.45 48.50
6. Maharashtra 19.05 16.80 9.10 50.60
7. Rajasthan 10.35 45.05 6.80 37.60
8. Tamil Nadu 2.45 21.80 1.90 69.65
9. Uttar Pradesh 25.65 21.15 2.40 49.30
10. West Bengal 37.8 22.45 9.30 28.90
Category B States/uTs
11. Chhattisgarh 12.29 11.69 18.14 56.97
12. Delhi 52.77 17.39 3.90 24.89
13. Haryana 45.73 19.49 4.50 28.04
14. Jammu & Kashmir 69.72 5.85 2.10 12.29
15. Jharkhand 19.79 13.34 7.50 54.27
16. Kerala 44.53 7.50 6.45 41.38
17. Odisha 28.64 19.94 6.30 43.18
18. Punjab 39.13 35.38 1.05 23.99
19. Uttarakhand 56.07 10.94 5.85 23.84
Category C States/uTs
20. Chandigarh 44.14 33.33 1.80 19.37
21. Daman & Diu 31.08 9.91 18.02 40.99
22. Himachal Pradesh 41.89 23.87 11.71 20.72
23. Manipur 26.58 17.57 12.16 41.44
24. Nagaland 22.97 17.57 35.14 18.92
25. Puducherry 3.15 13.51 3.60 78.38
26. Tripura 30.18 27.93 4.95 34.68
all India 27.27 20.10 7.14 43.45Source: Survey.
BOx 3.2: EMPOwERMENT OF ST COMMuNITy, DINDORI DISTRICT, MaDhya PRaDESh
In the Dindori district of Madhya Pradesh, where the literacy rate of Scheduled Tribes (STs) is below 50 per cent, Narbadiya Maravi, a girl from the ST community opens her own Common Service Centre (CSC) in her small backward village, after clearing the NDLM training, as revealed by a training partner in Madhya Pradesh. This inspired other people from her tribal community to seek an opportunity for availing of the digital training even without moving out of the village. She is hopeful that other people from her tribal community will also become self-reliant economically in the near future after receiving the digital training. Source: Survey.

22 | Digital Literacy Training to Non-IT Literate Citizens: Impact Assessment of the NDLM
TaBLE 3.4: BENEFICIaRIES OF NDLM TRaININg: BPL/NON-BPL (%)
Sl. No. States/uTs BPL Non BPL No Ration Card No Response
Category a States
1. Andhra Pradesh 82.75 13.20 3.40 0.65
2. Bihar 79.35 14.05 5.50 1.10
3. Gujarat 58.45 29.50 7.35 4.70
4. Karnataka 82.05 14.00 3.55 0.40
5. Madhya Pradesh 61.65 25.35 5.80 7.20
6. Maharashtra 67.60 32.40 0.00 0.00
7. Rajasthan 57.25 40.25 1.60 0.90
8. Tamil Nadu 79.90 18.60 0.55 0.85
9. Uttar Pradesh 74.80 12.40 9.20 3.60
10. West Bengal 46.70 49.50 1.75 2.00
Category B States/uTs
11. Chhattisgarh 74.21 16.49 8.25 1.05
12. Delhi 43.78 29.84 14.54 11.84
13. Haryana 35.23 58.02 2.40 4.35
14. Jammu & Kashmir 46.03 51.42 1.20 1.35
15. Jharkhand 46.78 33.58 14.39 5.25
16. Kerala 51.27 47.83 0.75 0.15
17. Odisha 53.82 34.48 7.95 3.75
18. Punjab 63.87 25.94 6.15 4.05
19. Uttarakhand 51.87 41.08 3.60 3.45
Category C States/uTs
20. Chandigarh 57.66 14.86 17.57 9.91
21. Daman & Diu 45.95 32.43 9.01 12.61
22. Himachal Pradesh 45.95 48.65 1.80 3.60
23. Manipur 36.94 27.93 22.07 13.06
24. Nagaland 13.06 24.32 44.14 18.47
25. Puducherry 55.41 33.33 1.35 9.91
26. Tripura 50.45 45.50 2.70 1.35
all India 63.87 28.12 5.04 2.96Source: Survey.
(d) BPL/Non-BPL
One of the targets of the NDLM training is to provide adequate representation to the BPL card-holders in the digital training. The survey reveals that almost all the states have performed well in terms of meeting this target: more than 40 per cent of the respondents were BPL card-holders, as illustrated in Table 3.4.
As far as the state wise-scenario is concerned, Andhra Pradesh and Karnataka account for more than 80 per cent of the beneficiaries possessing BPL cards while the corresponding figure is 79 per cent and in Tamil Nadu and Bihar. On
the other hand, in Nagaland, only 13 per cent of the beneficiaries had a BPL background while 44 per cent of the respondents in these states said that they did not own a ration card. Manipur ranks second in terms of respondents with no ration card, followed by Chandigarh, Delhi and Jharkhand. The number of non-BPL cardholders, who received NDLM training, was the highest in Haryana, followed by Jammu & Kashmir, West Bengal and Himachal Pradesh.
On the whole, in terms of reaching the intended target groups, the performance of Karnataka, West Bengal, Andhra Pradesh, Rajasthan and Gujarat is quite good. While medium level

3 Beneficiaries of NDLM | 23
performance is exhibited by Bihar, Uttarakhand, Kerala and Punjab, some of the states and UTs still have to catch up with the remaining states in reaching the intended target groups. The states and UTs which have the lowest record for this parameter are Daman & Diu, Manipur, Nagaland and Himachal Pradesh.
(ii) Digital Literacy Status of Trainee’s Family
NDLM Objective: “All the households where none of the persons in the age group of 14 to 60 years is IT-literate would become eligible …”
The objective of NDLM is to provide digital literacy to a family wherein not a single member of the family has been introduced to IT. The survey reveals that this aim has been successfully fulfilled in most of the states/UTs. From Table 3.5, it can be observed that in Punjab, Uttarakhand, Kerala and Tripura, more than 90 per cent of the respondents stated that their respective families did not have digital literacy status before availing of the training. The all-India picture reveals that 74.3 per cent of the trained beneficiaries belong to families with one IT literate member, and almost 12 states have crossed the national average.
TaBLE 3.5: BENEFICIaRIES REPORTINg aBOuT ThEIR FaMILy’S STaTuS REgaRDINg DIgITaL LITERaCy (%)
Sl. No. States/uTs None Less than 2 Members
2-4 Members More than 4
Category a States
1. Andhra Pradesh 50.60 35.55 11.35 2.50
2. Bihar 24.80 15.00 57.20 3.00
3. Gujarat 29.25 51.35 17.35 2.05
4. Karnataka 66.25 22.85 9.35 1.55
5. Madhya Pradesh 31.05 28.40 30.15 10.40
6. Maharashtra 30.20 42.35 23.35 4.10
7. Rajasthan 63.00 18.05 15.70 3.25
8. Tamil Nadu 59.30 15.65 23.65 1.40
9. Uttar Pradesh 33.80 38.20 26.20 1.80
10. West Bengal 51.95 36.80 7.80 3.45
Category B States/uTs
11. Chhattisgarh 20.99 45.43 28.19 5.40
12. Delhi 19.94 37.33 38.68 4.05
13. Haryana 21.74 46.48 27.44 4.35
14. Jammu & Kashmir 49.18 27.74 21.74 1.35
15. Jharkhand 36.28 36.88 23.69 3.15
16. Kerala 66.87 23.84 6.30 3.00
17. Odisha 24.59 40.63 25.94 8.85
18. Punjab 13.49 69.87 15.14 1.50
19. Uttarakhand 52.47 40.18 3.90 3.45
Category C States/uTs
20. Chandigarh 34.68 49.10 13.96 2.25
21. Daman & Diu 19.82 22.07 56.76 1.35
22. Himachal Pradesh 21.17 48.20 17.12 13.51
23. Manipur 13.96 40.09 37.84 8.11
24. Nagaland 26.13 34.68 34.23 4.95
25. Puducherry 71.62 22.07 5.41 0.90
26. Tripura 49.10 44.59 5.41 0.90
all India 41.25 33.10 22.12 3.54Source: Survey.

24 | Digital Literacy Training to Non-IT Literate Citizens: Impact Assessment of the NDLM
However, it came to light that families with members having knowledge of IT have also benefited from the NDLM training. The survey revealed that 22.12 per cent of the beneficiaries belong to families with 2 to 4 members who already have digital literacy.
In some states/UTs like Kerala, Karnataka, and Puducherry, the norm of meeting the family with no digital literacy background was rightfully met, due to the measures taken by the Village Level Entrepreneurs (VLEs). The potential households for the training were properly verified through door-to-door surveys before their members were enrolled
enrolling the students into the training programme.
(iii) Trainee Benefiting per Family
NDLM Objective: “All the households where none of the persons in the age group of 14 to 60 years is IT-literate would become eligible…. Of the eligible households, one person would be selected for the training…”
The study reveals that at the national level, 76.3 per cent of the respondents had only one family member to attend the computer training programme, whereas, 24 per cent reported that
TaBLE 3.6: TRaINEE BENEFITINg PER FaMILy (%)
Sl. No. States/uTs One per Family More than one per Family
Category a States
1. Andhra Pradesh 79.65 20.35
2. Bihar 78.60 21.40
3. Gujarat 75.95 24.05
4. Karnataka 79.40 20.60
5. Madhya Pradesh 80.80 19.20
6. Maharashtra 85.20 14.80
7. Rajasthan 29.05 70.95
8. Tamil Nadu 85.80 14.20
9. Uttar Pradesh 71.25 28.75
10. West Bengal 79.00 21.00
Category B States/uTs
11. Chhattisgarh 69.27 30.73
12. Delhi 85.91 14.09
13. Haryana 86.21 13.79
14. Jammu & Kashmir 75.11 24.89
15. Jharkhand 82.01 17.99
16. Kerala 91.30 8.70
17. Odisha 86.66 13.34
18. Punjab 85.76 14.24
19. Uttarakhand 86.81 13.19
Category C States/uTs
20. Chandigarh 80.18 19.82
21. Daman & Diu 62.16 37.84
22. Himachal Pradesh 70.27 29.73
23. Manipur 84.23 15.77
24. Nagaland 81.08 18.92
25. Puducherry 50.45 49.55
26. Tripura 86.49 13.51
all India 76.33 23.67Source: Survey.

3 Beneficiaries of NDLM | 25
more members from their families had availed of the IT training.
In states such as Kerala, Uttarakhand, Odisha, Tripura, Haryana and Delhi, more than 80 per cent of the respondents stated that only one member from each of their respective families had attended the NDLM training. However, in several states/UTs such as Rajasthan, Puducherry and Daman & Diu, more than one member per family had been trained.
This particular finding has to be analysed in the cultural context of joint families. For instance, in Rajasthan, it was informed by several of the respondents that more than 2 to 3 members from their family has availed the NDLM training. When further inquiry was made, it was informed that they live in a joint family set up and by showing the separate ration cards of the cousin brothers and sisters they got enrolled into the programme.
(iv) Financial Support to Beneficiaries
NDLM Objective: “For SC/ST/BPL Households, no training fee payable and for General candidates, course fee of Rs. 125 applicable”.
The ground reality with respect to the fee structure and financial assistance was verified in the different states, and is depicted in Figure 3.3. At the national level, it can be observed that, more than 85 per cent of the respondents from both the SC/ST communities and the General/OBC categories have received free training. Only a
small proportion of the sample beneficiaries from these communities were paying the prescribed fee of Rs.125, while more than the prescribed amount was also paid by some.
Among the 27,557 respondents interviewed, the response to the question on the fee structure was received from 26,996 respondents. Although financial support was prescribed only for the SC/ST and BPL candidates, it was found that this financial support was also being availed of by 87.8 per cent of the total OBC and General candidates. While the OBC and General candidates students are supposed to be paying a fee of Rs.125, only 9.04 per cent of the total OBC and General candidates reported of paying the prescribed fee. Further, 3.13 per cent of the OBC/general candidates revealed that they were asked to pay more than the prescribed fee levied by the training centre.
(a) SC/ST and general Candidates
One of the surprising revelations of the Impact Assessment Study is that the intended fee structure was not maintained at every level of the NDLM programme. It was found that the training was provided free of cost to different candidates irrespective of their caste status while some of the training centres charged a fee from all the different categories of candidates irrespective of their caste status.
Table 3.7 presents the state-wise scenario regarding the financial assistance offered to
FIguRE 3.3: FINaNCIaL SuPPORT TO SC/ST aND gENERaL/OBC CaNDIDaTES (%)
Source: Survey.
85%
12%3%
SC/ST
No Fess
Rs.125
More than Rs. 125
General/OBC
No Fess
Rs.125
More than Rs. 125
88%
9%3%

26 | Digital Literacy Training to Non-IT Literate Citizens: Impact Assessment of the NDLM
different categories of beneficiaries. It can be observed that across the states, the NDLM course was offered free of cost to most of the candidates, irrespective of their caste categories. It can be further noticed that more than 90 per cent of the SC/ST respondents in the states/UT of Daman & Diu, Chandigarh, Odisha, Nagaland, Maharashtra, Puducherry, Tamil Nadu, Jharkhand and Tripura reported of availing this training free of cost. Although the stipulation of imparting
training free of cost to the marginalised groups had a relatively significant impact, as seen from Table 3.7, the corresponding impact on the respondents belonging to the general and OBC categories was also notably high.
In the states and UTs of Daman & Diu, Odisha, Nagaland, Maharashtra, Puducherry, Tamil Nadu, Chandigarh and Jharkhand, more than 90 per cent of the General category and OBC
TaBLE 3.7: BENEFICIaRIES REPORTINg aBOuT FREEShIPS aND FEES PaID (%)
Sl. No. States SC/ST general and OBC
No Fees Rs. 125 Fees above
Rs. 125
No Fess Rs. 125 Fees above
Rs. 125
Category a States
1. Andhra Pradesh 89.92 4.46 5.62 88.13 6.68 5.19
2. Bihar 34.55 63.38 2.07 55.54 41.75 2.71
3. Gujarat 94.26 4.55 1.19 94.67 4.03 1.30
4. Karnataka 81.41 14.46 4.13 80.67 16.01 3.32
5. Madhya Pradesh 84.65 7.01 8.34 84.47 6.58 8.95
6. Maharashtra 97.24 1.68 1.09 96.77 1.61 1.61
7. Rajasthan 84.26 11.89 3.85 87.03 9.68 3.29
8. Tamil Nadu 95.91 2.61 1.48 96.34 2.37 1.29
9. Uttar Pradesh 90.40 6.60 3.01 90.34 7.15 2.51
10. West Bengal 93.50 3.85 2.65 94.15 3.33 2.52
Category B States/uTs
11. Chhattisgarh 81.71 13.41 4.88 79.56 13.62 6.81
12. Delhi 90.53 3.16 6.32 84.40 10.70 4.90
13. Haryana 87.56 7.66 4.78 88.24 6.31 5.45
14. Jammu & Kashmir 93.75 3.13 3.13 94.17 3.10 2.73
15. Jharkhand 95.87 2.18 1.94 95.42 2.88 1.70
16. Kerala 92.04 5.73 2.23 94.98 4.29 0.73
17. Odisha 97.55 1.53 0.92 98.21 1.20 0.60
18. Punjab 73.05 22.16 4.79 79.83 16.14 4.03
19. Uttarakhand 88.89 10.10 1.01 88.71 8.64 2.65
Category C States/uTs
20. Chandigarh 97.83 0.00 2.17 95.54 3.82 0.64
21. Daman & Diu 99.24 0.00 0.76 98.97 0.69 0.34
22. Himachal Pradesh 81.69 14.08 4.23 79.67 14.75 5.57
23. Manipur 92.44 5.04 2.52 92.39 5.80 1.81
24. Nagaland 97.50 2.50 0.00 96.93 2.30 0.77
25. Puducherry 96.70 2.20 1.10 96.46 2.65 0.88
26. Tripura 95.45 3.41 1.14 94.72 2.82 2.46
all India 84.80 12.16 3.04 87.83 9.04 3.13Source: Survey.

3 Beneficiaries of NDLM | 27
FIguRE 3.4: FINaNCIaL SuPPORT TO BPL aND NON-BPL BENEFICIaRIES
69%
31%
No Fees
BPL Non-BPL
77%
23%
Fee ofRs. 125
BPL Non-BPL
66%
34%More than
Rs. 125
BPL Non-BPL
trainees revealed that they got free training. Further, a fee of Rs. 125 was also collected from the SC/ST candidates as alleged by them, and the percentage of such candidates was high in Bihar and Punjab. Similar was the case with the OBC and general candidates, and this proportion was high in the states of Bihar, Punjab and Karnataka.
There were also incidences of candidates reporting having paid extra fees and such candidates belonged to all the categories (SC/ST, OBC and General). The proportion of such students was particularly high in Madhya Pradesh and Delhi in the case of SC/ST candidates whereas the corresponding percentage was high for the General candidates in the states of Madhya Pradesh, Chhattisgarh, Himachal Pradesh and Haryana.
It can thus be concluded that the financial benefit often got diverted to groups other than the targeted beneficiaries. Other malpractices occurring at some of the training centres also came to light, pointing to the need for better monitoring and checking at all the training centres.
(b) BPL and non-BPL candidates
Figure 3.4 and Table 3.8 present the national scenario pertaining to the financial support provided to the BPL and non-BPL beneficiaries. It can be observed from the ‘No fee’ category that the training was provided free of cost to
68 per cent and 31 per cent of the BPL and non-BPL trainees, respectively.
Among the group of people who paid a fee of Rs. 125, 77 per cent belong to the BPL and 23 per cent to non-BPL categories. Further, among the candidates who reported paying extra fees, 66.1 per cent and 33.9 per cent belong to the BPL and non-BPL categories, respectively.
Overall, the state-wise picture as depicted in Table 3.8 indicates that in almost all the states, persons belonging to the BPL categories are the major beneficiaries, receiving free. In Andhra Pradesh, Chhattisgarh, Karnataka, Tamil Nadu and Uttar Pradesh, more than 80 per cent of the BPL students reported that they were provided free training. However, the survey also reveals that a fee of Rs. 125 was charged from candidates belonging to the BPL categories, and the proportion of such candidates was high in Nagaland, Bihar, Chandigarh, Chhattisgarh, Odisha, Karnataka and Uttar Pradesh.
Similarly, excess fee was also charged from the candidates is some cases, and this incidence was higher in the states of Andhra Pradesh, Gujarat, Karnataka and Uttar Pradesh, as also in the UTs of Chandigarh, Daman & Diu, Nagaland and Puducherry. There is thus a need to develop proper mechanisms to ensure that the training partners do not indulge in corrupt practices like charging of fees from candidates exempted from paying it.
Source: Survey.

28 | Digital Literacy Training to Non-IT Literate Citizens: Impact Assessment of the NDLM
OVERaLL SCENaRIO OF BENEFICIaRy COVERagE
Overall, the programme has covered the beneficiaries quite well, particularly the BPL targets. However, the implementation of some more appropriate measures like separate timings for housewives (noon or afternoon), and working people (late evening or weekend slots) could have further increased the coverage. It has also been observed that some more measures are required to adequately cover the SC population. The
socio-cultural context of the joint family makes it difficult to evaluate whether one person or more than one person can be trained in an eligible family. As regards financial assistance as well as the other indicators, there are significant regional variations. Hence, an overall composite index has been constructed to determine the standing and achievement levels of the individual states/UTs.
The index, covering the indicators of the target group of NDLM, digital literacy status of the beneficiary family, the trainee benefiting per
TaBLE 3.8: BPL aND NON-BPL BENEFICIaRIES REPORTINg aBOuT FREEShIPS aND FEES PaID (%)
Sl. No. States No Fees Rs. 125 More than Rs. 125
BPL Non-BPL BPL Non-BPL BPL Non-BPL
Category a States
1. Andhra Pradesh 86.91 13.09 78.57 21.43 84.00 16.00
2. Bihar 72.91 27.09 97.91 2.09 66.67 33.33
3. Gujarat 66.27 33.73 67.11 32.89 80.00 20.00
4. Karnataka 86.10 13.90 82.83 17.17 83.33 16.67
5. Madhya Pradesh 71.59 28.41 62.28 37.72 68.67 31.33
6. Maharashtra 67.85 32.15 51.43 48.57 70.37 29.63
7. Rajasthan 61.57 38.43 35.67 64.33 39.29 60.71
8. Tamil Nadu 81.97 18.03 53.33 46.67 45.83 54.17
9. Uttar Pradesh 86.02 13.98 83.64 16.36 80.49 19.51
10. West Bengal 48.72 51.28 38.81 61.19 56.82 43.18
Category B States/uTs
11. Chhattisgarh 81.93 18.07 80.49 19.51 80.00 20.00
12. Delhi 60.05 39.95 57.14 42.86 54.17 45.83
13. Haryana 39.08 60.92 32.61 67.39 20.69 79.31
14. Jammu & Kashmir 46.96 53.04 61.90 38.10 42.11 57.89
15. Jharkhand 58.56 41.44 50.00 50.00 50.00 50.00
16. Kerala 52.67 47.33 35.48 64.52 42.86 57.14
17. Odisha 60.73 39.27 83.33 16.67 60.00 40.00
18. Punjab 72.54 27.46 64.37 35.63 68.18 31.82
19. Uttarakhand 55.09 44.91 60.71 39.29 64.29 35.71
Category C States/uTs
20. Chandigarh 78.95 21.05 85.71 14.29 100.00 0.00
21. Daman & Diu 58.38 41.62 0.00 0.00 100.00 0.00
22. Himachal Pradesh 48.82 51.18 42.86 57.14 57.14 42.86
23. Manipur 59.40 40.60 33.33 66.67 0.00 100.00
24. Nagaland 33.33 66.67 100.00 0.00 100.00 0.00
25. Puducherry 62.11 37.89 66.67 33.33 100.00 0.00
26. Tripura 53.47 46.53 16.67 83.33 60.00 40.00
all India 68.70 31.30 77.00 23.00 66.14 33.86Source: Survey

3 Beneficiaries of NDLM | 29
FIguRE 3.5: RaNkINg OF STaTES/uTs BaSED ON OVERaLL PERFORMaNCE: COVERagE OF BENEFICIaRIES
Source: Computed by the authors.
Notes: The cumulative index includes the target group of NDLM, Digital Literacy Status of the Trainee’s Family, Trainee Benefiting per Family, and Financial Support to the Beneficiaries. In the table, the green light indicates ‘good performing’ states while the yellow and red lights have been used to mark the ‘moderate performers’ and ‘low performing states’, respectively.
Madhya Pradesh
Karnataka
Tamil Nadu
Andhra Pradesh
West Bengal
Gujarat
Maharashtra
Uttar Pradesh
Rajasthan
Bihar
Chhattisgarh
Kerala
Uttarakhand
Punjab
Haryana
Delhi
Jharkhand
Odisha
Jammu & Kashmir
Tripura
Nagaland
Himachal Pradesh
Chandigarh
Manipur
Puducherry
Daman & Diu
National Average
Category AStates
Category BStates
Category CStates
0.71
0.70
0.67
0.66
0.66
0.63
0.59
0.51
0.49
0.44
0.76
0.71
0.64
0.62
0.60
0.57
0.53
0.53
0.52
0.72
0.72
0.70
0.64
0.59
0.55
0.50
0.61
family and financial support to the beneficiaries, shows a value of 0.61. The states/UTs have been grouped into three categories on the basis of their performance derived from the index value, that is, the ‘good, ‘moderate’ and ‘low’ performing states/UTs.
Figure 3.5 shows that five states/UTs, categorised as the ‘good states’ have performed well in reaching out to the target beneficiaries, that
is, including Kerala, Tripura, Chandigarh, Tamil
Nadu and Uttarakhand. Their performance
was commendable in terms of reaching the
target beneficiaries, especially in identifying the
appropriate families for NDLM training and in
targeting women candidates for the programme.
In targeting the BPL families, the performance of
West Bengal, Tamil Nadu and Karnataka was good.
States/UTs that fall in the ‘moderate’ performing

30 | Digital Literacy Training to Non-IT Literate Citizens: Impact Assessment of the NDLM
category include Karnataka, Puducherry, Gujarat, and Maharashtra, among others.
States/UTs such as Madhya Pradesh, Rajasthan, Daman & Diu, Bihar and Chhattisgarh fall in the low performing category, as they lag behind the others in terms of the indicators of ‘gender’, digital literacy status, and the trainee benefiting per family.
Of all the states in the ‘good performing’ category, Tamil Nadu belongs to the category A states, Kerala and Uttarakhand belong to the category B states, while Chandigarh and Tripura fall under the category C states. Similarly in the low performing category, Rajasthan, Madhya Pradesh and Bihar belong to the A category states, while Chhattisgarh and Daman & Diu belong to the B and C categories, respectively.
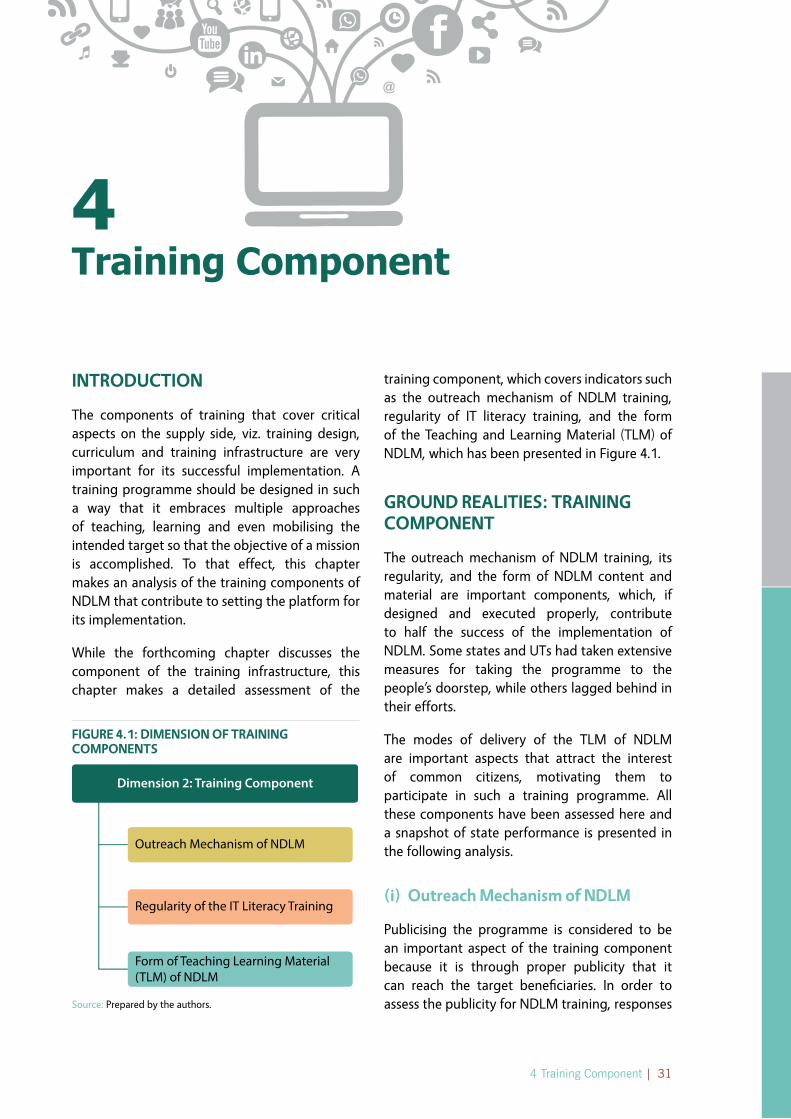
4 Training Component | 31
4 Training Component
INTRODuCTION
The components of training that cover critical aspects on the supply side, viz. training design, curriculum and training infrastructure are very important for its successful implementation. A training programme should be designed in such a way that it embraces multiple approaches of teaching, learning and even mobilising the intended target so that the objective of a mission is accomplished. To that effect, this chapter makes an analysis of the training components of NDLM that contribute to setting the platform for its implementation.
While the forthcoming chapter discusses the component of the training infrastructure, this chapter makes a detailed assessment of the
training component, which covers indicators such as the outreach mechanism of NDLM training, regularity of IT literacy training, and the form of the Teaching and Learning Material (TLM) of NDLM, which has been presented in Figure 4.1.
gROuND REaLITIES: TRaININg COMPONENT
The outreach mechanism of NDLM training, its regularity, and the form of NDLM content and material are important components, which, if designed and executed properly, contribute to half the success of the implementation of NDLM. Some states and UTs had taken extensive measures for taking the programme to the people’s doorstep, while others lagged behind in their efforts.
The modes of delivery of the TLM of NDLM are important aspects that attract the interest of common citizens, motivating them to participate in such a training programme. All these components have been assessed here and a snapshot of state performance is presented in the following analysis.
(i) Outreach Mechanism of NDLM
Publicising the programme is considered to be an important aspect of the training component because it is through proper publicity that it can reach the target beneficiaries. In order to assess the publicity for NDLM training, responses
FIguRE 4.1: DIMENSION OF TRaININg COMPONENTS
Dimension 2: Training Component
Outreach Mechanism of NDLM
Regularity of the IT Literacy Training
Form of Teaching Learning Material(TLM) of NDLM
Source: Prepared by the authors.

32 | Digital Literacy Training to Non-IT Literate Citizens: Impact Assessment of the NDLM
response from 15.46 per cent, only 3.53 per cent of the respondents stated that they got the information online.
TaBLE 4.1: SOuRCES OF INFORMaTION ON NDLM TRaININg (%)
Sl. No. States advertisement Friends web School No ResponseCategory a States
1. Andhra Pradesh 17.75 36.25 3.35 24.05 18.602. Bihar 26.80 60.70 1.90 2.80 7.803. Gujarat 16.80 33.90 4.00 21.80 23.50
4. Karnataka 33.50 18.50 0.90 9.65 37.455. Madhya Pradesh 29.50 45.90 5.70 6.00 12.906. Maharashtra 27.65 36.30 2.60 22.25 11.207. Rajasthan 56.25 32.95 1.45 2.55 6.808. Tamil Nadu 6.25 24.35 1.00 40.00 28.409. Uttar Pradesh 34.45 49.75 4.45 3.10 8.25
10. West Bengal 28.65 43.80 3.90 16.80 6.85Category B States/uTs
11. Chhattisgarh 29.54 41.38 4.80 18.14 6.1512. Delhi 23.84 44.53 6.00 7.35 18.2913. Haryana 30.88 41.38 5.10 4.95 17.6914. Jammu & Kashmir 21.14 49.63 1.80 14.39 13.0415. Jharkhand 25.64 45.73 3.45 6.30 18.8916. Kerala 5.70 37.33 0.45 38.08 18.4417. Odisha 35.38 43.33 6.75 3.30 11.2418. Punjab 17.39 25.19 15.44 31.33 10.6419. Uttarakhand 29.54 63.12 1.95 1.65 3.75
Category C States/uTs20. Chandigarh 22.97 15.77 2.70 40.09 18.4721. Daman & Diu 30.18 50.45 4.95 7.21 7.2122. Himachal Pradesh 10.81 56.76 8.11 2.25 22.0723. Manipur 22.97 43.69 1.35 10.81 21.1724. Nagaland 8.11 6.76 6.31 63.51 15.3225. Puducherry 8.56 30.18 5.41 46.40 9.4626. Tripura 19.37 43.69 8.56 15.32 13.06
all India 23.83 39.28 4.32 17.70 14.87Source: Survey.
31%
47%
4%
18%AdvertisementFriendsWebSchool
FIguRE 4.2: SOuRCES OF INFORMaTION ON NDLM TRaININg: aLL INDIa (%)
Source: Survey.
were sought from the trainees on the outreach mechanism and the sources of information for their registration in the programme.
The national picture, as depicted in Figure 4.2, shows that 39.22 per cent of the candidates got to know about the training through friends, and they registered for the programme on the basis of this information. Similarly, 26.44 per cent of the trainees stated that they came to know about the programme through the advertisements released by training centres in the forms of hoardings and banners in public places, and distribution of pamphlets, among other forms of publicity. Another 15.35 per cent of the respondents affirmed that they had obtained information on the programme from schools. While there was no

4 Training Component | 33
The influence of friends seemed to be the main reason for registration under NDLM in almost all states, which is visible from the national average of 39.28 per cent (Table 4.1), and this proportion was high in Uttarakhand, Bihar, Himachal Pradesh and Daman & Diu. As far as the state-wise scenario is concerned, more than 13 states attained a figure above the national average of 23.83 per cent in terms of spreading information through advertisements. As reported by the beneficiaries, in Rajasthan, Odisha, Uttar Pradesh, Karnataka and Haryana advertisements in newspapers, television, radio, and other media were the main source through which the students got to know about the training.
Registration through website played a very small role in attracting the students for training as per the survey response, which is reflected in the low national average (4.32 per cent). However, states like Punjab, Tripura, Himachal Pradesh and Odisha were found to be spreading the information on the NDLM training through websites. The influence of schools was higher in Nagaland, Puducherry, Tamil Nadu, Chandigarh and Kerala.
The study illustrated that the success of registration had a significant connection with the outreach measures taken by the training centres and the training partners to spread information about the NDLM training. Wherever the training
BOx 4.1: CREaTIVE INITIaTIVES TO INCREaSE OuTREaCh OF NDLM IN DIFFERENT VILLagES
Madhya Pradesh:
Village Level Entrepreneurs (VLEs) ensured mass advertisement ythrough Nukkad Natak (street theatre) and printing materials.
VLEs belonging to particular communities were involved in yincreasing the outreach among those communities.
Telangana:
VLEs conducted door-to-door visits to convince and motivate ythe people to undergo NDLM training by carrying laptops to explain the advantages of digital literacy.
The Village Development Committee chairperson, along with ythe CSC VLE, conducted awareness camps involving every single eligible household.
Source: Survey.
BOx 4.2: OuTREaCh MEaSuRES OF TRaININg PaRTNERS aND TRaININg CENTRES
Source: Field Survey with Training Partners and Training Centres.
PamphletsBannersPostersAwareness campsDoor to door canvassingWorkshops in schools CampaignsMeeting in Gram PanchayatMeeting with MandalsContacted local leadersCounselling at school levelAdvertisement in local newspapersApproaching Farmers Club Sending messages
BannersPostersSeminarsPersonal callsWorkshop in schoolsContacting social groupCamps in slumsBenefit awareness camps
TRaININg PaRTNERS
TRaININg CENTRES

34 | Digital Literacy Training to Non-IT Literate Citizens: Impact Assessment of the NDLM
centres had played a proactive role in promoting the programme and spreading the message of free training in schools, there was a higher rate of registration for the programme.
(ii) Regularity of NDLM Training
Regular training is integral to enhancement of the level of understanding among candidates. Participants of the NDLM training programme were questioned on the regularity component. At the national level, more than 90 per cent of the respondents stated that the training used to take place on a regular basis and only 6.39 per cent of them stated that it was irregular. Only 1.54 per cent of the total respondents did not respond on this component.
Figure 4.3, which presents the cross-state scenario of the regularity of the NDLM training, indicates that most of the states were successful in maintaining this component. However, irregularity of training was visible in some of the states/UTs, viz. Jammu & Kashmir, Manipur, Kerala, West Bengal, Puducherry and Tripura. Interaction with the training centres revealed that some of the students were irregular in attending the class, and the centres had to take extra measures to motivate the students. It was also observed that hilly areas and conflict zones faced the problem of irregularity of training. Regions with frequent power cuts also faced problems in conducting regular trainings.
(iii) Form of TLM of NDLM
The form of delivery of the course content and material is very important for the success of a training programme. Hence, the TLM was analysed for assessing the NDLM content. The respondents of the survey revealed that videos of the course material were shown in classrooms, which taught the fundamentals of computers. On the whole, 65.24 per cent of the students stated that the course materials were in the form of videos (Table 4.2). Some of them reported that though the videos were interesting to watch, it was difficult to retain the thoughts for long and they were not available when revision of the material was required.
At the national level, about 49.40 per cent of the respondents stated that books were provided by the training centres, with the corresponding proportion crossing 70 per cent in Bihar, Uttarakhand, Chandigarh, Gujarat and Uttar Pradesh. The survey and interaction with the training centres indicated that provision of written materials in book form was not part of the NDLM training. Since they had already run many other computer courses, including the National Skill Development Corporation (NSDC) course on computers, they were able to provide other materials to the students while 35.42 per cent of the respondents stated that they also had access to the e-book. Booklets for the course on Appreciation of Computer Concepts (ACC) were
FIguRE 4.3: RESPONSE OF BENEFICIaRIES ON REguLaRITy OF NDLM TRaININg (%)
Source: Survey.
0102030405060708090
100
And
hra
Prad
esh
Biha
r
Chan
diga
rh
Chha
ttis
garh
Dam
an &
Diu
Del
hi
Guj
arat
Har
yana
Him
acha
l Pra
desh
Jam
mu
& K
ashm
ir
Jhar
khan
d
Karn
atak
a
Kera
la
Mad
hya
Prad
esh
Mah
aras
htra
Man
ipur
Nag
alan
d
Odi
sha
Pudu
cher
ry
Punj
ab
Raja
stha
n
Tam
il N
adu
Trip
ura
Utt
ar P
rade
sh
Utt
arak
hand
Wes
t Ben
gal

4 Training Component | 35
provided in e-form to the students by the training centres, though not everyone had access to them, due to the lack of digital devices at home. However, 37.82 per cent of the trainees stated that photocopies of the course material were also made available by the training centres.
Table 4.2 shows that more than 85 per cent of the respondents in Daman & Diu, Gujarat, Himachal Pradesh, Rajasthan, Tripura and Uttarakhand were taught via the audio-video mode. Students from Bihar, Chandigarh and Uttarakhand stated
that course materials were given to them in the book form. Among the trained population, about 75 per cent in Bihar and 60 per cent of the respondents in Madhya Pradesh stated that the e-book of the course material was provided by the training centre. On the other hand, the use of photocopies of the material was the maximum in the states of Himachal Pradesh, Bihar and Gujarat.
On the whole, the key point to be observed here is that though e-Books were provided by
TaBLE 4.2: FORM OF TEaChINg LEaRNINg MaTERIaL (TLM) OF NDLM*
Sl. No. State/uTs audio-Video Mode Booklets e-Book Photocopy
Category a States
1. Andhra Pradesh 65.45 50.65 16.95 19.50
2. Bihar 84.00 85.15 75.80 66.10
3. Gujarat 89.00 79.25 57.95 65.15
4. Karnataka 44.90 32.50 39.20 34.25
5. Madhya Pradesh 65.95 65.05 59.10 48.25
6. Maharashtra 73.30 39.55 44.05 32.85
7. Rajasthan 90.00 62.25 44.85 38.10
8. Tamil Nadu 24.30 19.05 9.30 29.90
9. Uttar Pradesh 82.95 70.20 30.45 36.25
10. West Bengal 23.40 1.80 1.80 28.35
Category B States/uTs
11. Chhattisgarh 79.46 34.93 30.88 32.08
12. Delhi 73.46 51.42 34.48 20.39
13. Haryana 84.86 59.07 45.73 33.73
14. Jammu & Kashmir 61.62 60.72 15.44 49.48
15. Jharkhand 38.38 10.19 9.60 29.69
16. Kerala 35.38 59.37 43.33 56.97
17. Odisha 77.51 55.32 35.83 26.54
18. Punjab 81.11 31.63 9.45 8.25
19. Uttarakhand 86.96 83.81 34.18 5.10
Category C States/uTs
20. Chandigarh 73.42 82.43 51.35 40.99
21. Daman & Diu 98.65 6.31 54.50 32.88
22. Himachal Pradesh 89.64 43.69 35.59 75.68
23. Manipur 37.84 19.82 29.28 40.09
24. Nagaland 19.82 10.36 9.01 35.59
25. Puducherry 34.23 20.27 10.81 48.65
26. Tripura 90.99 54.50 10.36 41.44
all India 65.24 49.40 35.42 37.82Note: *Multiple Responses.Source: Survey.

36 | Digital Literacy Training to Non-IT Literate Citizens: Impact Assessment of the NDLM
the training centres, the students were not able to access them due to the non-availability of computers and Internet facilities at home. With the distribution of photocopies, it was thus easier for them to revise the material, when required. As highlighted by the students of the programme, if teaching learning material is provided in hard copy, it will be very much helpful for the beneficiaries for future references.
OVERaLL SCENaRIO OF ThE TRaININg COMPONENT
Overall, the composite index for this dimension, covering indicators like the outreach mechanism of NDLM, regularity of training, and form of content and material shows an index value of 0.55. The states/UTs have been grouped into three based on the value
FIguRE 4.4: RaNkINg OF STaTES/uTs BaSED ON OVERaLL PERFORMaNCE: TRaININg COMPONENT
Note: Cumulative index of this dimension include outreach mechanism of NDLM, regularity of IT Literacy Training, Form of TLM of NDLM. In the table, the green light indicates ‘good performing’ states while the yellow and red lights have been used to mark the ‘moderate performers’ and ‘low performing states’, respectively.
Source: Computed by authors.
National Average
Category AStates
Category BStates
Category CStates
0.79
0.72
0.72
0.70
0.69
0.56
0.54
0.43
0.35
0.32
0.70
0.67
0.66
0.63
0.59
0.58
0.52
0.38
0.37
0.71
0.68
0.63
0.52
0.33
0.24
0.23
0.55
Madhya Pradesh
Karnataka
Tamil Nadu
Andhra Pradesh
West Bengal
Gujarat
Maharashtra
Uttar Pradesh
Rajasthan
Bihar
Chhattisgarh
Kerala
Uttarakhand
Punjab
Haryana
Delhi
Jharkhand
Odisha
Jammu & Kashmir
Tripura
Nagaland
Himachal Pradesh
Chandigarh
Manipur
Puducherry
Daman & Diu

4 Training Component | 37
obtained as ‘good, ‘moderate’ and ‘low’ performing states.
Figure 4.4 shows that the performance of Bihar has been particularly high in this dimension. The states/UTs of Rajasthan, Gujarat, Himachal Pradesh, and Uttar Pradesh have performed well in terms of establishing the basic requirements that are required for providing the training. In particular, in spreading the message of NDLM training, Odisha, Uttar Pradesh and Uttarakhand played a vital role. These states were also regular in conducting the training programme. Although the material was not available in book form in
these states, a majority of the respondents said that notes and photocopies were supplied by the training centres. All these factors enabled these states to perform well in this dimension.
States such as Punjab, Delhi and Maharashtra recorded a moderate performance. All these states have registered an average performance in all the three indicators of this dimension. West Bengal, Puducherry, Tamil Nadu, Nagaland and Manipur fall under the low performing category, and it is thus critical for these states/UTs to devise strategies for better implementation of the next phase of NDLM.


5 Training Infrastructure and Classroom Process | 39
5 Training Infrastructure and Classroom Process
INTRODuCTION
The NDLM programme stipulated certain requirements for the training centres, which are critical for imparting digital literacy training. Therefore, some of the key requirements, including physical facilities and classroom processes in the training centres have been assessed in this evaluation study. This chapter presents the findings of the survey with regard to the dimension on ‘Training Infrastructure and Classroom Process’. The findings pertaining to various indicators under this dimension are depicted in Figure 5.1.
(i) Facilities in the Training Centre
The availability of adequate and appropriate physical facilities is important in any digital training programme. Thus, the respondents were questioned on the availability and condition of primary facilities in the training centres, namely computers, Internet connection, and power back-up in case of electricity failure, as well as secondary or supportive facilities like conditions of other equipment such as web cameras, printers and scanners. Given that the computer training programmes are of a short duration, the availability and conditions of basic facilities like toilets and drinking water were not included in the assessment.
The respondents were asked whether these facilities were good, average or low in their respective training centres. Thereafter, in order to translate those micro level responses for the states at a macro level, a ‘facilities matrix’ was constructed (Table 5.1). The national averages for all the facilities were calculated separately against the ‘good’, ‘moderate’ and ‘low’ indicators. The responses were rated as ‘good’ if they were above 10 per cent of the national average, ‘moderate’ if they were 10 per cent above and below the national average, and ‘low’ if they were below 10 per cent of the national average.
From the matrix, it can be observed that on an average, most of the states have similar conditions of both primary and secondary facilities, except
FIguRE 5.1: DIMENSION OF TRaININg INFRaSTRuCTuRE aND CLaSSROOM PROCESSES
Dimension 3: Training Infrastructureand Classroom Process
Facilities in Training Centres
NDLM Lessons
Knowledge of Trainer
Teaching Methods
Examination and Certi�cation
Source: Prepared by the authors.

40 | Digital Literacy Training to Non-IT Literate Citizens: Impact Assessment of the NDLM
for a few states like Bihar, Haryana, Jammu and Kashmir, Odisha and West Bengal.
States/UTs like Chhattisgarh, Delhi, Gujarat, Punjab, Rajasthan, Uttar Pradesh, Uttarakhand and West Bengal have good facilities at both the primary and secondary levels. In states/UTs like Andhra Pradesh, Chandigarh and Himachal Pradesh, the essential computer facilities are
better than the supportive secondary facilities. However, in the case of Jharkhand and Kerala, a completely opposite picture can be noticed, as here the condition of facilities like web cameras and scanners is better than that of the essential facilities like Internet and power back-up. Further, states like Bihar, Manipur, Nagaland, Odisha, Puducherry and Tripura lack both primary and secondary facilities in their training centres
TaBLE 5.1: RESPONSES OF ThE BENEFICIaRIES ON ThE TRaININg INFRaSTRuCTuRE – MuLTIPLE RESPONSES (%)
States Primary Facilities Secondary Facilities
Computers Internet Connectivity
Power Back-up
Printer web-Cam Scanner
Category a States
Andhra Pradesh 95.20 61.65 60.75 58.35 71.20 57.00
Bihar 67.30 45.36 34.88 41.27 64.32 61.32
Gujarat 94.63 88.12 86.11 84.31 91.44 79.50
Karnataka 82.40 77.70 72.25 62.35 57.25 57.25
Madhya Pradesh 78.61 86.35 71.10 63.21 68.31 61.23
Maharashtra 83.40 77.90 73.95 73.90 60.60 60.60
Rajasthan 93.25 90.85 85.70 82.25 73.60 72.90
Tamil Nadu 74.45 63.90 60.70 61.75 50.50 49.40
Uttar Pradesh 92.30 91.85 91.35 91.20 90.40 89.35
West Bengal 92.15 51.70 61.70 38.95 11.80 17.25
Category B States/uTs
Chhattisgarh 88.46 86.21 86.66 85.91 85.31 84.71
Delhi 90.10 91.30 85.79 90.40 88.32 83.70
Haryana 74.63 84.31 68.03 51.29 49.63 49.38
Jammu & Kashmir 73.31 37.93 41.68 41.53 25.04 24.89
Jharkhand 86.66 68.22 70.01 75.41 70.01 65.97
Kerala 73.31 68.37 63.12 76.76 68.67 79.16
Odisha 22.19 13.34 15.14 20.69 11.69 11.69
Punjab 93.40 94.75 92.50 90.40 88.91 87.41
Uttarakhand 98.95 99.10 98.05 97.00 97.75 96.25
Category C States/uTs
Chandigarh 92.79 76.88 79.31 88.12 89.32 86.13
Daman & Diu 87.21 72.51 74.23 74.21 87.21 81.21
Himachal Pradesh 95.05 91.89 45.50 40.54 35.14 27.48
Manipur 57.66 50.45 50.00 54.95 39.64 53.15
Nagaland 66.67 40.09 45.50 62.16 35.14 35.14
Puducherry 65.32 70.27 59.46 59.46 40.09 44.14
Tripura 65.32 39.19 35.14 44.14 17.57 18.47
Good
Moderate
Low
Source: Survey.

5 Training Infrastructure and Classroom Process | 41
whereas in the states of Andhra Pradesh, Bihar, Jharkhand, and Karnataka the conditions of facilities in the training centres can be rated as ‘moderate’.
(ii) NDLM Lessons
The NDLM course—Appreciation of Computer Concepts (ACC)—was intended to provide basic
knowledge to the trainees for operating different kinds of digital devices, browsing the Internet, communicating with people through the Internet, and using it for day-to-day purposes.
The responses of the trainees clearly show that the lessons taught in the class covered basic computer applications, use of smartphones and tablets, accessing the Internet, and government
TaBLE 5.2: RESPONSES OF ThE BENEFICIaRIES ON ThE LESSONS TaughT uNDER NDLM - MuLTIPLE RESPONSES (%)
States Basic Computer
application
use of Mobile/Smart Phones for Internet Browsing
use of Tablets for Internet
Browsing
use of Internet
accessing Online government
Services
Category a States
Andhra Pradesh 87.25 86.45 84.90 91.25 70.10
Bihar 97.75 96.15 95.80 96.80 85.05
Gujarat 67.95 66.30 65.90 94.15 85.80
Karnataka 79.45 77.40 49.45 75.25 42.95
Madhya Pradesh 93.95 89.80 90.00 90.90 89.35
Maharashtra 84.50 61.70 49.95 52.60 56.20
Rajasthan 69.35 84.80 72.35 67.85 47.75
Tamil Nadu 78.45 80.70 44.95 72.90 19.45
Uttar Pradesh 82.20 79.10 78.00 84.15 70.30
West Bengal 73.35 73.35 4.90 61.80 9.90
Category B States/uTs
Chhattisgarh 80.66 47.53 46.63 87.41 35.68
Delhi 90.25 84.86 84.56 82.61 80.96
Haryana 97.60 94.15 90.25 79.31 78.11
Jammu & Kashmir 61.17 77.06 63.12 81.56 13.34
Jharkhand 93.40 93.40 30.13 88.91 16.04
Kerala 82.31 79.61 46.93 64.02 35.38
Odisha 92.95 91.75 85.46 81.71 81.11
Punjab 75.41 22.64 17.39 67.77 15.44
Uttarakhand 91.00 84.86 90.25 89.51 38.98
Category C States/uTs
Chandigarh 97.30 93.24 81.98 98.20 59.46
Daman & Diu 99.55 99.10 99.10 99.55 99.10
Himachal Pradesh 70.27 43.69 43.24 86.49 81.53
Manipur 80.18 75.23 34.68 45.05 29.73
Nagaland 71.17 76.13 26.13 62.61 19.82
Puducherry 85.14 86.94 35.14 65.77 20.72
Tripura 82.43 79.28 3.15 44.14 4.05
Good
Moderate
Low
Source: Survey.

42 | Digital Literacy Training to Non-IT Literate Citizens: Impact Assessment of the NDLM
services. A matrix has been developed for the lessons taught under NDLM (Table 5.2), which includes all these components. The micro level responses for particular training centres have been translated into a macro picture at the state level in the same way as discussed above for facilities in the training centres.
Larger state-wise disparities have been found in terms of the lessons provided. In states/UTs like Bihar, Chandigarh, Daman & Diu, Madhya Pradesh Gujarat and Madhya Pradesh, a majority of the respondents stated that all types of lessons, viz. computer applications, usage of tablets, smartphones, accessing government services, and using the Internet were taught in class. As regards the lessons on computer applications, the response of the beneficiaries was moderate in
Andhra Pradesh, whereas in Haryana and Odisha, the response on the lessons on Internet usage was moderate. The remaining states presented a mixed picture. However, the common trend was that most of these states laid greater focus on computer training and different usages of the Internet.
On the whole, the respondents expressed satisfaction with the different lessons taught under NDLM. However, most of the respondents in the school- and college-going category stated that it would be more useful for the students if advanced lessons were included in the curriculum. Similarly, the working group requested for a different content that could contribute to career advancement. The students exhibited a preference for programmes like tally, MS Office, and web designing.
TaBLE 5.3: TRaINEES’ aSSESSMENT OF ThE TRaINERS’ kNOwLEDgE (%)
Sl. No. States good Bad averageCategory a States
1. Andhra Pradesh 89.30 9.05 1.65
2. Bihar 98.05 1.80 0.153. Gujarat 98.60 1.40 0.004. Karnataka 62.70 33.05 4.255. Madhya Pradesh 85.05 7.30 7.656. Maharashtra 95.45 3.75 0.807. Rajasthan 97.80 2.15 0.058. Tamil Nadu 63.60 32.5 3.909. Uttar Pradesh 96.90 2.55 0.55
10. West Bengal 73.95 22.80 3.25Category B States/uTs
11. Chhattisgarh 96.25 3.45 0.3012. Delhi 87.86 11.69 0.4513. Haryana 95.20 2.55 5.1014. Jammu & Kashmir 69.27 25.04 5.7015. Jharkhand 76.61 18.89 4.5016. Kerala 80.06 13.34 6.6017. Odisha 86.06 9.30 4.6518. Punjab 98.95 1.05 0.0019. Uttarakhand 99.10 0.60 0.30
Category C States/uTs20. Chandigarh 98.2 0.90 0.9021. Daman & Diu 100.00 0.00 0.0022. Himachal Pradesh 99.55 0.00 0.4523. Manipur 55.41 24.77 19.8224. Nagaland 67.57 22.07 10.3625. Puducherry 72.07 12.61 15.3226. Tripura 81.08 15.32 3.60
all India 87.48 11.13 2.69Source: Survey.

5 Training Infrastructure and Classroom Process | 43
(iii) knowledge of the Trainer
Trainers constitute the soul of any training programme. Therefore, responses were also solicited from the students on the knowledge of the trainers. In most states, the respondents gave positive responses about the knowledge of the trainers, which pointed to the apt selection of the training partners and also that the students were happy with the training being imparted by their trainers.
Almost 100 per cent of the respondents in many of the states averred that the knowledge of trainers on the course content was good (Table 5.3) . This finding is further emphasised by the fact that the national average with regard to the appreciable knowledge of the trainers on the course content is as high as 87 per cent.
(iv) Teaching Methods
Apart from physical facilities and knowledge of the trainer, there is another significant parameter that decides the quality of a training programme, which is a well-balanced combination of effective methods like theory, hands-on-training on digital devices, audio–video learning tools and use of projectors. From the national picture relating to the various teaching methods practised (Table 5.4) it can be observed that various initiatives have been taken to create a well-balanced combination of methods.
However, an analysis of the different teaching methods throws up state-wise disparities. In states like Andhra Pradesh and Chhattisgarh, emphasis had been laid on practical training
TaBLE 5.4: RESPONSES OF ThE BENEFICIaRIES ON ThE TEaChINg METhODS PRaCTISED (%)
Sl. No. States/uTs Theory Practical by using Devices
audio-visual/Projectors
Category a States1. Andhra Pradesh 11.07 31.23 8.082. Bihar 18.22 4.66 2.633. Gujarat 43.48 8.59 2.584. Karnataka 60.74 4.87 2.215. Madhya Pradesh 24.47 11.23 2.856. Maharashtra 46.20 7.97 5.027. Rajasthan 60.59 4.71 1.698. Tamil Nadu 54.68 12.03 10.229. Uttar Pradesh 23.20 8.28 2.30
10. West Bengal 71.07 5.02 4.71Category B States/uTs
11. Chhattisgarh 14.88 26.53 3.3712. Delhi 9.63 6.81 4.4913. Haryana 7.02 9.01 4.7314. Jammu & Kashmir 60.42 8.61 2.7215. Jharkhand 21.74 9.90 2.4016. Kerala 56.54 8.57 7.9717. Odisha 21.52 15.17 2.9418. Puducherry 49.09 14.09 5.9119. Uttarakhand 49.63 19.79 6.30
Category C States20. Chandigarh 38.64 10.91 2.7321. Daman & Diu 2.26 0.00 1.3622. Himachal Pradesh 32.41 8.80 3.7023. Manipur 54.75 9.95 9.9524. Nagaland 67.27 9.55 7.7325. Punjab 21.67 8.94 0.7626. Tripura 36.82 22.27 10.00
all India 38.75 10.52 4.27Source: Survey.

44 | Digital Literacy Training to Non-IT Literate Citizens: Impact Assessment of the NDLM
FIguRE 5.3: RESPONSES OF ThE BENEFICIaRIES ON ThE LaNguagE OF TRaININg (%)
Source: Survey.
01020304050607080
0
20
40
60
80
100
Mix of Local Language and English (right axis)
English Hindi and other local language (line diagrams in left axis)
And
hra
Prad
esh
Biha
r
Chan
diga
rh
Chha
ttis
garh
Dam
an &
Diu
Del
hi
Guj
arat
Har
yana
Him
acha
l Pra
desh
Jam
mu
& K
ashm
ir
Jhar
khan
d
Karn
atak
a
Kera
la
Mad
hya
Prad
esh
Mah
aras
htra
Man
ipur
Nag
alan
d
Odi
sha
Pudu
cher
ry
Punj
ab
Raja
stha
n
Tam
il N
adu
Trip
ura
Utt
ar P
rade
sh
Utt
arak
hand
Wes
t Ben
gal
sessions but Nagaland, West Bengal, Karnataka and other states focused on theoretical lessons.
(v) Language
Language plays an important role in any training programme as it is the medium through which a lesson is taught and absorbed to a large extent. In a multi-lingual country like India, which is characterised by the existence of many vernacular
languages, the issue of language becomes very critical.
Table 5.5 and Figure 5.3 show that in states like Chhattisgarh, Kerala, Karnataka, Rajasthan, Tamil Nadu and Tripura, the training was mostly conducted in local languages. In other states where English was used as the medium of training, the approach needs to be modified. A mix of English and vernacular languages would be more conducive for better absorption of the course content by the students.
FIguRE 5.2: RESPONSES OF ThE BENEFICIaRIES ON ThE TEaChINg METhODS PRaCTISED (%)
Source: Survey.
01020304050607080
More of theory More of practical including audio-visual/projectors
And
hra
Prad
esh
Biha
r
Chan
diga
rh
Chha
ttis
garh
Dam
an &
Diu
Del
hi
Guj
arat
Har
yana
Him
acha
l Pra
desh
Jam
mu
& K
ashm
ir
Jhar
khan
d
Karn
atak
a
Kera
la
Mad
hya
Prad
esh
Mah
aras
htra
Man
ipur
Nag
alan
d
Odi
sha
Punj
ab
Pudu
cher
ry
Raja
stha
n
Tam
il N
adu
Trip
ura
Utt
ar P
rade
sh
Utt
arak
hand
Wes
t Ben
gal

5 Training Infrastructure and Classroom Process | 45
TaBLE 5.5: RESPONSES OF ThE BENEFICIaRIES ON ThE LaNguagE OF TRaININg (%)
Sl. No. States/uTs hindi Local Language English
Category a States
1. Andhra Pradesh 3.15 36.41 20.72
2. Bihar 30.23 0.35 4.30
3. Gujarat 15.44 26.14 8.32
4. Karnataka 7.43 61.85 17.47
5. Madhya Pradesh 43.12 1.14 7.37
6. Maharashtra 15.12 15.54 9.89
7. Rajasthan 77.39 1.18 3.13
8. Tamil Nadu 2.32 86.88 4.49
9. Uttar Pradesh 32.81 0.72 4.55
10. West Bengal 5.79 49.43 9.93
Category B States/uTs
11. Chhattisgarh 67.33 0.31 8.28
12. Delhi 31.69 0.00 17.97
13. Haryana 29.15 0.16 20.53
14. Jammu & Kashmir 11.79 8.58 13.02
15. Jharkhand 52.32 2.85 5.70
16. Kerala 0.45 68.43 26.74
17. Odisha 8.70 23.10 14.24
18. Punjab 12.58 6.67 9.39
19. Uttarakhand 47.38 0.60 10.04
Category C States/uTs
20. Chandigarh 50.45 0.45 13.18
21. Daman & Diu 53.39 7.24 6.33
22. Himachal Pradesh 53.99 0.47 16.90
23. Manipur 3.60 37.39 15.32
24. Nagaland 1.81 35.29 38.01
25. Puducherry 5.43 29.41 40.27
26. Tripura 8.64 60.45 14.09
all India 24.58 24.54 10.75Source: Survey.
(vi) Examination and Certification
Any training programme is incomplete unless the trainees can pass the examination/evaluation process confidently and receive the acknowledgement of their learning in the form of certificates. During the survey, it was found that nationally 63 per cent of the students faced no difficulty in giving the exam while 37 per cent of the respondents claimed to face multiple difficulties. After completing the training, 43 per cent of the students received certificates and 56 per cent did
not receive it in any form, whereas 1 per cent did not respond to this question.
The state-wise scenario presents a diverse picture (Figure 5.5). In terms of difficulties faced in giving the exam, the states can be classified into the following two broad categories: a) most of the states where the respondents hardly faced any difficulties, and b) a few states like Kerala, Karnataka, Tamil Nadu, West Bengal and Maharashtra, where the respondents faced multiple problems while appearing for the exam.

46 | Digital Literacy Training to Non-IT Literate Citizens: Impact Assessment of the NDLM
When the respondents were questioned about the reasons for these problems, it was found that the problems were mostly technical, such as slow portals, and too many people trying to open the website at the same time.
The state-wise status of certification was also diverse. For example, in Daman and Diu, candidates did not face any problem in giving the exam, but they did not receive certificates in any form. Similarly, certification emerged as a problem in Tripura too. On the other hand, in states like Kerala, Karnataka and West Bengal, where the examination process was delayed due to technical reasons, the
certification process was comparatively better. Rajasthan and Himachal Pradesh are the two states which performed well on both the indicators.
(vii ) Overall Scenario of Training Infrastructure and Classroom Process
The findings regarding the above-mentioned indicators under this particular dimension have been combined together to get a composite index. Overall, the composite index for this dimension, covering the indicators of physical infrastructure and classroom processes, shows an index value of 0.55.
FIguRE 5.4: NaTIONaL STaTuS OF ExaMINaTION aND CERTIFICaTION
Examination
Certification
70605040302010
0No difficulty faced ingiving examination
Difficulty faced ingiving examination
Provisional/online
Original Certificate
Not received in any form
No Response
BOx 5.1: SERVER PROBLEM — a MajOR CONSTRaINT IN ThE NDLM TRaININg
We faced server problems while opening the site for exam.- Interview with Training Centre, Andhra Pradesh
Servers stopped functioning in the middle of the exams.- Focus Group Discussion (FGD) with students of NDLM, South-west Delhi
The portal was so slow that we had to wait for more than five hours to complete the online exam.- Interview with students, Delhi
There is long gap between the date of completion and the date of examination, and we lost interest in giving the exam because of the long waiting period.
- Telephonic Interview with Beneficiaries, PuducherrySource: Survey.

5 Training Infrastructure and Classroom Process | 47
FIguRE 5.5: STaTE-wISE SCENaRIO OF ExaMINaTION aND CERTIFICaTION
Source: Survey.
0102030405060708090
100Ch
andi
garh
Dam
an &
Diu
Har
yana
Del
hi
Biha
r
Utt
arak
hand
Jam
mu
& K
ashm
ir
Utt
ar P
rade
sh
Odi
sha
Mad
hya
Prad
esh
And
hra
Prad
esh
Punj
ab
Chha
ttis
garh
Raja
stha
n
Guj
arat
Him
acha
l Pra
desh
Trip
ura
Nag
alan
d
Kera
la
Karn
atak
a
Jhar
khan
d
Pudu
cher
ry
Tam
il N
adu
Wes
t Ben
gal
Man
ipur
Mah
aras
htra
Respondents having no di�culty in examinationRespondents who received certi�cate in either original or provisional
The di�culties faced by the trainees at the time of giving examination in these states are mostly technical, e.g. slow portal, too many people trying to open the website at a same time etc.
Figure 5.6 shows that states/UTs such as Uttarakhand, Uttar Pradesh, Chhattisgarh, and Delhi perform well in this dimension and the training centres in all these states have performed well in terms of providing appreciable physical infrastructure and classroom processes. The responses of the survey participants clearly show that they were mostly happy with the training facilities, lessons taught and the manner of teaching. The states of Himachal
Pradesh, Odisha, and Punjab, among others fall under the category of moderate performers. On the other hand, states such as Manipur, Nagaland, West Bengal, and Tamil Nadu have not performed well in this dimension. In most of these states, secondary facilities such as the quality and condition of printers, web-cams and scanners were better than those of the primary facilities like computers and Internet connection. The common issue mostly faced
BOx 5.2: INNOVaTIVE MEaSuRES uSED IN ThE VILLagES TO TaCkLE INFRaSTRuCTuRE-RELaTED CONSTRaINTS
Telangana
Most of the villages did not have Internet connectivity. The VLEs thus set up Hotspots using 3g/4G dongle yfor the Internet.
In order to accommodate a large number of ytrainees, different timings were scheduled by forming different groups. In some villages, the classes were scheduled in the morning for students, in the evenings for youth, and in the afternoons for women. Further, in order to accommodate farmers, who are busy throughout the day, even late night classes were conducted during the time slot of 9 p.m. to 11 p.m.
Madhya Pradesh
VLEs arranged for mobile vans equipped with necessary training infrastructure to organise training yprogrammes in the remote villages.
Examinations were conducted during early morning or late evening to avoid portal problems. y
Source: Survey.

48 | Digital Literacy Training to Non-IT Literate Citizens: Impact Assessment of the NDLM
across the state is the problem of a slow portal due which caused a delay in the examination and certification processes. Different measures can be adopted to deal with the problem and
one common solution can be the conduction of the examination during different time slots for different regions to ensure that the portal does not get frequent hits at the same time.
FIguRE 5.6: RaNkINg OF STaTES/uTs BaSED ON ThE OVERaLL PERFORMaNCE: TRaININg INFRaSTRuCTuRE aND CLaSSROOM PROCESSES
Note: The Cumulative index for this dimension include facilities in the training centre, knowledge of the trainer, teaching methods, examination and certification. In the table, the green light indicates ‘good performing’ states while the yellow and red lights have been used to mark the ‘moderate performers’ and ‘low performing states’, respectively.
Source: Computed by the authors.
National Average
Category AStates
Category BStates
Category CStates
0.75
0.72
0.70
0.69
0.68
0.65
0.49
0.39
0.29
0.28
0.76
0.72
0.72
0.71
0.59
0.53
0.49
0.44
0.35
0.71
0.71
0.63
0.46
0.34
0.24
0.22
0.55
Madhya Pradesh
Karnataka
Tamil Nadu
Andhra Pradesh
West Bengal
Gujarat
Maharashtra
Uttar Pradesh
Rajasthan
Bihar
Chhattisgarh
Kerala
Uttarakhand
Punjab
Haryana
Delhi
Jharkhand
Odisha
Jammu & Kashmir
Tripura
Nagaland
Himachal Pradesh
Chandigarh
Manipur
Puducherry
Daman & Diu

6 Training Outcome | 49
6 Training Outcome
INTRODuCTION
The purpose of the Impact Assessment Study was to determine the overall outcome of this training for the beneficiaries and their lives in terms of knowledge and skill enhancement in the usage of digital devices, which has been covered in this chapter.
gROuND REaLITIES: TRaININg OuTCOME
This chapter presents an analysis made on three indicators such as the extent of usage of digital devices by the beneficiaries after completion of the training programme, application of the
training in their day-to-day lives, and the overall benefits enjoyed by them.
(i) Purpose of usage of the Digital Device
The IT literacy training can be claimed to be successful only if the trained candidates are able to use digital devices effectively. According to the responses of the trainees, after the completion of the programme, they were able to use different digital devices such as computers/laptops, smartphones, and tablets for one or the other purpose, as depicted in Table 6.1. Most of the respondents were found to be using a device for various purposes such as sending e-mails, browsing the website, checking Facebook, chatting in WhatsApp, playing games, accessing government and other services, and playing games.
On the whole, 63.03 per cent of the respondents who underwent the training, stated that they were able to use the digital device to check and send emails. The response rate for this particular usage was high in the states of Rajasthan, Gujarat, Delhi, Punjab, Kerala and Maharashtra. However, the response was medium in Manipur, Jharkhand, Odisha and Tamil Nadu, as the beneficiaries in these states claimed that they were unable to perform email-related activities mainly due to the lack of availability of computers at home to practise the digital skills they had learnt during the NDLM training. About 60 per cent of the
FIguRE 6.1: DIMENSION OF ThE TRaININg OuTCOME
Dimension 4: Training Outcome
Purpose of Usage of Digital Device
Overall Bene�t of NDLM Training
Day-to-day Usage of Digital Device
Source: Prepared by the author.

50 | Digital Literacy Training to Non-IT Literate Citizens: Impact Assessment of the NDLM
students in the surveyed states/UTs said that they were using digital devices for browsing various websites. The proportion of this category of respondents was the highest in Gujarat, Rajasthan, Punjab and Delhi.
The all-India picture is quite interesting in terms of the usage of applications like Facebook and WhatsApp. The usage of WhatsApp is relatively high as compared to any other usage, and the respondents were seen to be using smartphones
more for WhatsApp than for any other purpose. Figure 6.2 indicates that the purpose of usage of digital devices varied to a greater extent even in the same state. In Andhra Pradesh, Gujarat, Rajasthan and Uttarakhand, the beneficiaries were found to be using the digital devices for various purposes. However, in Karnataka, the beneficiaries were more interested in using the devices for sending mails, WhatsApp and for browsing, while they elicited considerably less interest in using Facebook and Twitter.
TaBLE 6.1: RESPONSES OF BENEFICIaRIES ON PuRPOSE OF uSagE OF DIgITaL DEVICE (%)
States/uTs Sending/Receiving
Browsing Facebook/Twitter
whats-app
Paint jobs Search
availing of govt. Services
games
Category a States
Andhra Pradesh 72.30 71.40 76.50 73.80 67.75 36.15 43.25 50.65
Bihar 59.85 49.35 65.55 66.15 5.55 26.35 17.05 51.05
Gujarat 80.40 79.65 79.70 85.20 65.00 43.50 41.80 58.75
Karnataka 72.30 49.45 12.90 72.95 33.55 23.90 12.90 63.45
Madhya Pradesh 61.10 59.90 63.55 70.20 9.20 47.95 34.35 54.05
Maharashtra 76.20 72.85 49.25 68.45 55.85 24.90 23.35 43.80
Rajasthan 80.45 78.15 75.80 65.95 69.80 34.85 30.00 47.65
Tamil Nadu 47.75 39.70 34.35 71.60 44.35 22.90 27.25 44.45
Uttar Pradesh 66.60 71.90 69.35 70.30 65.70 31.05 24.85 56.80
West Bengal 50.85 39.35 7.80 71.65 17.30 6.90 5.55 6.90
Category B States/uTs
Chhattisgarh 64.17 61.47 70.01 69.87 67.92 27.29 26.39 61.02
Delhi 80.06 73.31 78.41 77.51 7.65 39.13 39.43 70.76
Haryana 56.52 59.82 61.17 68.22 1.20 42.58 45.13 58.32
Jammu & Kashmir 58.02 43.03 34.03 86.66 52.62 31.93 29.54 56.67
Jharkhand 45.28 30.58 15.14 70.16 35.23 12.74 9.90 31.78
Kerala 76.31 53.37 46.78 71.51 64.02 20.24 10.19 38.83
Odisha 45.54 47.53 54.87 51.12 2.40 19.79 13.94 29.69
Punjab 79.31 74.81 67.77 76.61 57.42 25.19 28.64 38.68
Uttarakhand 75.86 67.32 64.92 91.00 66.27 11.84 6.75 44.98
Category C States/uTs
Chandigarh 62.16 59.01 57.21 72.52 8.56 37.85 35.14 55.86
Daman & Diu 64.86 59.46 61.26 59.91 6.31 35.14 21.62 36.49
Himachal Pradesh 71.62 63.96 62.16 58.11 57.66 22.07 29.73 37.39
Manipur 42.79 20.27 15.32 73.42 39.19 21.62 20.27 39.64
Nagaland 64.86 40.09 20.72 52.70 38.74 3.60 4.05 44.59
Puducherry 71.17 40.09 26.13 77.03 26.13 10.81 15.32 15.32
Tripura 57.21 30.18 30.18 67.57 44.14 5.41 3.60 40.09
all India 66.03 59.29 52.94 71.74 41.87 28.35 25.02 47.25Source: Survey.

6 Training Outcome | 51
Nearly 50 per cent of the trainees also asserted that they use digital devices for playing games while 40 per cent claimed to be using them for the application Paint. While 28.35 per cent of the trainees affirmed that they were using the Internet for job searches, a majority of them, that is, 65.87 per cent averred that they were not using it for this purpose.
Since most of the trainees were in the age group of 14-25 years, their interests mostly lay in using the device for playing games and using
the paint application in computers, while less interest was shown in job searches and accessing government services. The proportion of students using the Internet for job searches was high in Madhya Pradesh, Gujarat, Haryana and Delhi. Nearly 30 per cent of the trainees also stated that they were using the Internet for accessing government and other services like booking of railway tickets, and online shopping, and the proportion of such respondents was high in the states of Haryana, Andhra Pradesh, Gujarat, Delhi and Chandigarh.
FIguRE 6.2: aPPLICaTION OF DIgITaL TRaININg: uSagE OF EMaIL, FaCEBOOk aND BROwSINg
FIguRE 6.3: aPPLICaTION OF DIgITaL TRaININg: PaINT, jOB SEaRCh, gaMES, aVaILINg gOVERNMENT SERVICES
Source: Survey.
Source: Survey.
Sending/ Email Browsing Facebook /twitter Whats-App
And
hra
Prad
esh
Biha
r
Chan
diga
rh
Chha
ttis
garh
Dam
an &
Diu
Del
hi
Guj
arat
Har
yana
Him
acha
l Pra
desh
Jam
mu
& K
ashm
ir
Jhar
khan
d
Karn
atak
a
Kera
la
Mad
hya
Prad
esh
Mah
aras
htra
Man
ipur
Nag
alan
d
Odi
sha
Pudu
cher
ry
Punj
ab
Raja
stha
n
Tam
il N
adu
Trip
ura
Utt
ar P
rade
sh
Utt
arak
hand
Wes
t Ben
gal0
102030405060708090
100
01020304050607080
And
hra
Prad
esh
Biha
r
Chan
diga
rh
Chha
ttis
garh
Dam
an &
Diu
Del
hi
Guj
arat
Har
yana
Him
acha
l Pra
desh
Jam
mu
& K
ashm
ir
Jhar
khan
d
Karn
atak
a
Kera
la
Mad
hya
Prad
esh
Mah
aras
htra
Man
ipur
Nag
alan
d
Odi
sha
Pudu
cher
ry
Punj
ab
Raja
stha
n
Tam
il N
adu
Trip
ura
Utt
ar P
rade
sh
Utt
arak
hand
Wes
t Ben
gal
Paint Jobs Search Avail Govt. Services Games

52 | Digital Literacy Training to Non-IT Literate Citizens: Impact Assessment of the NDLM
(ii) Day-to-day application of Digital Devices
This section deals with the day-to-day application of digital devices by the beneficiaries. Out of the total number of trainees who responded for the survey, 6.22 per cent did not respond to this question, and 48.07 per cent stated that they were unable to use the applications on a day-to-day basis due to the unavailability of digital devices at home. They also said that since they got the opportunity to use digital devices only
occasionally, they could not use them proficiently due to lack of practice.
Regarding the usage of digital devices on a day-to-day basis, Table 6.2 shows that, 29.63 per cent of the respondents, stated that they use it for school/college work, while 8 per cent were found to be using it for official purposes. The survey revealed that the beneficiaries improved significantly in terms of IT knowledge and started using digital devices in schools after the training.
TaBLE 6.2: RESPONSES OF ThE BENEFICIaRIES ON ThE Day-TO-Day aPPLICaTIONS OF DIgITaL DEVICES (%)
Sl. No. States Doing School/College work
Doing Office work
Not able to use/No access to
Digital Devices
Others
Category a States
1. Andhra Pradesh 48.90 16.70 24.15 8.75
2. Bihar 86.15 3.30 4.35 4.80
3. Gujarat 43.50 8.05 28.70 6.70
4. Karnataka 7.25 4.45 65.10 22.90
5. Madhya Pradesh 41.70 19.9 14.15 10.60
6. Maharashtra 11.75 9.45 68.10 7.90
7. Rajasthan 33.30 5.30 27.00 2.80
8. Tamil Nadu 6.10 6.05 75.65 11.05
9. Uttar Pradesh 29.70 5.25 58.20 4.85
10. West Bengal 4.45 2.25 85.60 4.45
Category B States/uTs
11. Chhattisgarh 14.99 9.75 59.07 12.44
12. Delhi 42.73 14.69 24.89 8.40
13. Haryana 39.58 22.94 27.44 6.15
14. Jammu & Kashmir 18.29 4.80 67.02 8.10
15. Jharkhand 7.35 2.10 78.86 11.09
16. Kerala 2.85 3.15 90.10 2.70
17. Odisha 35.08 4.80 34.93 11.54
18. Punjab 34.03 8.55 51.57 3.30
19. Uttarakhand 13.34 5.10 67.47 10.34
Category C States/uTs
20. Chandigarh 95.95 0.90 0.90 0.00
21. Daman & Diu 84.68 11.26 3.60 0.00
22. Himachal Pradesh 14.86 10.36 68.47 3.60
23. Manipur 14.86 3.60 79.28 1.80
24. Nagaland 15.32 5.41 69.82 4.05
25. Puducherry 3.60 1.80 92.79 0.90
26. Tripura 5.41 4.95 82.43 5.41
all India 29.63 8.00 48.07 8.07Source: Survey.

6 Training Outcome | 53
It can also be seen from Table 6.2 that the states of Bihar and Andhra Pradesh top the list in terms of the use of digital devices for school work, while a relatively high proportion of trainees from Haryana, Madhya Pradesh, Andhra Pradesh, and Delhi use the devices for office work.
A housewife from Andhra Pradesh pointed out that she uses digital devices for helping her children with their homework and project work. She said that she had started browsing the website to find information related to school assignments as that way she would be better able to guide her children. Similarly a farmer stated that he had started using digital devices to check
the agricultural market price. On the whole, therefore, it was observed that the beneficiaries were able to use the digital devices for a variety of purposes based on their requirements.
(iii) Overall Benefit of the NDLM Training
This indicator under the dimension of training outcomes highlights the benefits of the NDLM training for the beneficiaries in terms of improvement in confidence levels, knowledge and awareness. Apart from these aspects, the outcome of the training was also assessed in terms of the other benefits generated by it such as getting jobs, promotions, and increase in incomes. The
BOx 6.1: aPPLICaTION OF DIgITaL DEVICES IN EVERyDay LIFE IN ThE VILLagES OF TELaNgaNa
akoli Village:
Akoli village serves as a model village, where there is 100 per cent digital literacy. Innovative outreach measures and household surveys helped identify the potential trainee per family. Training programmes in the village were customised to suit the needs of different stakeholders, viz., students, housewives and farmers. Trainees are not only theoretically aware of the advantages of the computer and Internet but have also started applying digital devices in day-to-day life. For instance, the trainees form part of a WhatsApp group created by the training centre. Career or farming-related information is shared in the group and more than 70 members are very active in this group.
Mukhra Village:
Like Akoli, Mukhra has also achieved 100 per cent digital literacy. Moreover, every villager in Mukhra has opened Jan Dhan bank accounts, and 100 per cent of the farmers are registered for MKisan, a portal they use for crop advisories on a regular basis. Village youth are active on the Facebook page and the WhatsApp group, not only for the socialisation process but also for using it as platform for sharing useful information.
Source: Survey.
BOx 6.2: TRaININg OuTCOME: PERCEPTION OF TRaININg PaRTNERS aND TRaININg CENTRES
Source: Field survey with training partners and training centres.
Awareness about digital literacyMotivation and confidence level enhancementMotivation to housewives and aged peopleEnabling people to use Android phonesBenefitting Anganwadi people in jobsBuilding awareness about technology among illiterate people
Improving knowledge base Enabling people to communicate using WhatsAppOffering job opportunity with certificateEnabling people to book tickets onlineTeaching workers the basics of ITDigital Awareness to all Able to teach to peersAble to use net for browsing
TRaININg PaRTNERS
TRaININg CENTRES

54 | Digital Literacy Training to Non-IT Literate Citizens: Impact Assessment of the NDLM
responses of some of the candidates clearly show that the beneficiaries were able to realise higher benefits in their personal and professional lives after attending the training.
The survey results as depicted in Table 6.3 show that about 60 per cent of the respondents at the
national level reported improvements in general awareness, ICT knowledge and confidence levels.
The trainees reported that the NDLM training was beneficial to them as they were able to learn something new, which is necessary for everyday life. Out of the total candidates trained,
TaBLE 6.3: RESPONSES OF ThE BENEFICIaRIES ON ThE OVERaLL BENEFITS OF NDLM TRaININg (%)
Sl. No.
States/uTs Improved general
awareness
Improved My ICT
knowledge
Increased My
Confidence Level
got a job
got Promotion
in job
got More
Income
able to Teach
Others on Computer
application
Category a States
1. Andhra Pradesh
91.65 83.45 77.45 30.30 16.4 15.70 40.60
2. Bihar 66.55 69.35 69.70 18.20 9.75 5.05 40.70
3. Gujarat 78.75 82.85 78.50 22.90 20.50 20.55 38.90
4. Karnataka 57.45 67.40 63.55 3.450 2.20 1.95 11.10
5. Madhya Pradesh
61.20 61.05 55.10 10.65 2.35 1.10 50.55
6. Maharashtra 72.30 67.85 45.05 2.80 2.25 1.75 7.80
7. Rajasthan 70.85 69.20 61.35 14.40 12.65 11.80 33.60
8. Tamil Nadu 49.85 49.85 36.65 2.70 1.10 1.40 2.10
9. Uttar Pradesh 74.40 63.45 53.85 9.75 7.60 8.45 24.60
10. West Bengal 32.70 34.90 21.65 2.85 1.95 1.15 2.05
Category B States/uTs
11. Chhattisgarh 68.52 56.22 44.53 5.25 2.85 3.60 14.39
12. Delhi 74.66 73.01 74.81 16.19 13.34 13.64 58.32
13. Haryana 59.52 57.57 49.63 7.20 4.20 3.60 44.23
14. Jammu & Kashmir
28.04 40.63 25.34 2.85 0.90 1.35 10.19
15. Jharkhand 63.27 68.52 23.69 7.35 3.45 2.40 2.70
16. Kerala 55.32 54.72 57.57 1.20 0.60 0.90 6.75
17. Odisha 49.93 52.32 34.03 4.05 1.95 2.85 47.68
18. Punjab 72.11 63.87 50.67 5.70 3.45 4.95 17.39
19. Uttarakhand 68.37 62.52 95.80 2.70 1.80 1.20 10.04
Category C States/uTs
20. Chandigarh 71.17 72.52 77.93 6.31 2.70 4.05 56.31
21. Daman & Diu 72.52 63.51 68.02 0.00 0.90 0.45 48.65
22. Himachal Pradesh
54.95 57.66 42.34 2.70 0.90 0.90 1.35
23. Manipur 43.69 71.17 55.41 1.35 0.90 0.90 15.32
24. Nagaland 44.14 65.32 44.14 3.60 2.25 2.25 8.11
25. Puducherry 63.96 77.48 45.95 2.70 1.35 0.90 20.27
26. Tripura 70.72 39.19 39.19 0.00 0.00 0.00 15.32
all India 64.05 63.54 54.89 9.97 6.43 5.91 24.75Source: Survey.

6 Training Outcome | 55
63.54 per cent felt that the NDLM training helped them enhance their knowledge. The proportion of trainees who claimed to have augmented their knowledge with the help of the training was high in Andhra Pradesh, Gujarat, Puducherry, and Delhi, among other states/UTs. About 50 per cent of the respondents stated that the IT literacy training had boosted confidence levels while 24.75 per cent of them affirmed that they were also able to teach their family members to use digital devices after attending the programme. More than 90 per cent of the respondents in Himachal Pradesh, West Bengal, Tamil Nadu, Jharkhand, Kerala, Maharashtra and Nagaland revealed that they could not engage in teaching, as they were neither so familiar with nor well-versed in the usage of digital devices to be able to teach other family members at home.
Though providing job opportunities or income generation was not the main objective of NDLM, Figure 6.4 shows that some of the trainees benefited from this training in terms of livelihood opportunities. In Andhra Pradesh, Gujarat and Delhi, more than 15 per cent of the respondents said that they were able to get jobs after attending the training.
Again in Gujarat, Delhi and Rajasthan, some of the respondents informed that they had managed to increase their incomes after undergoing the
training. In Gujarat, Rajasthan and Uttar Pradesh, some beneficiaries also stated that they had succeeded in getting promotions at work after acquiring digital literacy.
(iv) Overall Scenario of Training Outcome
Overall, the composite index for this dimension shows an index value of 0.41. On the basis of the index value obtained, the states/UTs have been grouped into three categories: good, moderate, and low performing states.
Under the dimension of Training Outcome, some states/UTs like Andhra Pradesh, Delhi, and Chandigarh performed better than the other states and UTs. On the other hand, states/UTs like Chandigarh, Madhya Pradesh, and Rajasthan fall in the category of moderate performance whereas West Bengal, Tripura, and Jharkhand registered a low performance with regard to this dimension. The responses of the trainees in these states indicate that the respondents were not using the digital device much on a day-to-day basis.
(v) Overall assessment
The analysis undertaken on various dimensions in the previous chapters thus throws light on the extent of implementation of the NDLM training
FIguRE 6.4: OVERaLL BENEFITS OF NDLM TRaININg (LIVELIhOOD BaSED)
Source: Survey.
0
5
10
15
20
25
30
Got Job Income Promotion
And
hra
Prad
esh
Biha
r
Chan
diga
rh
Chha
ttis
garh
Dam
an &
Diu
Del
hi
Guj
arat
Har
yana
Him
acha
l Pra
desh
Jam
mu
& K
ashm
ir
Jhar
khan
d
Karn
atak
a
Kera
la
Mad
hya
Prad
esh
Mah
aras
htra
Man
ipur
Nag
alan
d
Odi
sha
Punj
ab
Pudu
cher
ry
Raja
stha
n
Tam
il N
adu
Trip
ura
Utt
ar P
rade
sh
Utt
arak
hand
Wes
t Ben
gal

56 | Digital Literacy Training to Non-IT Literate Citizens: Impact Assessment of the NDLM
BOx 6.3: CaSE STuDIES ON OVERaLL BENEFITS OF NDLM FOR ThE BENEFICIaRIES
Case Study 1: job opportunity after NDLM training in New Delhi
Anita, a 21-year old girl from Neb Sarai, New Delhi, said that she was able to get a job in the training centre where she was provided the training. Although she had a B.Pharm degree, she could not opt for computer training classes due to her family background. She thus enrolled herself for the NDLM training, when she got to know of the free training for non-IT literates. After completing the training, she was recruited by the training partner to take care of the maintenance of the training centre. She stated that this training provided her the opportunity to realise her interests in digital technologies and later she registered herself for a web designing course to acquire another skill. Currently Anita has been absorbed as a trainer in the same centre.
Case Study 2: Improvement in confidence for a locomotive disabled women, Tamil Nadu
From a rural village of Virudhunagar district, Amudha, a 34-year old locomotive disabled woman revealed that she enrolled in the training after being motivated by her friends who suggested that this government certified programme would bring job opportunities. After undertaking the basic training under NDLM, she enrolled herself for advanced programmes in computers and is now confident of getting a job.
Case Study 3: Democratic participation of a shepherd in Telangana
A shepherd from Gimma village in the Jainath block of Adilabad district, after undertaking the NDLM training, started using a smartphone and has been an active user of WhatsApp. He took a picture of a damaged road of his locality and uploaded the photograph in the ‘WhatsApp group on Grievance Redressal’ of a local newspaper. Three days after the photo got published in the newspaper, road repair activities were initiated and the road was repaired in a day. The boy thus expressed his happiness for making his contribution in a small way towards the betterment of his locality.
Source: Survey.Road After Road Before
in different states/UTs and the impact on the beneficiaries. It was observed that no state or UT was constantly at the top or bottom in all the indicators. Some of the states/UTs performed better in implementing the designed formats of the programme while others showed efficiency in installing the required logistics for providing the training. Despite their low performance in terms of training component and infrastructure, several states were able to ensure a better impact on the overall outcome. For instance, in Madhya
Pradesh, quiz competitions and rapid tests were conducted among students on emailing content and sending information on WhatsApp, and the student, who was able to do it at a faster pace was rewarded with a tablet. On the other hand, in Andhra Pradesh, a WhatsApp group was created with the students, wherein information related to their village or job or education opportunities were shared. Such innovative measures initiated by different states contributed to a strong overall impact on the beneficiaries.

6 Training Outcome | 57
Overall, the performances of various states with regard to most of the indicators were good. However, gaps were identified in certain areas and corrective measures on those aspects will
help in enhancing the work to be undertaken in the next phase of the NDLM, as discussed in the concluding chapter.
FIguRE 6.5: RaNkINg OF STaTES/uTs BaSED ON ThE OVERaLL PERFORMaNCE: TRaININg OuTCOME
Note: The cumulative index for this dimension include: purpose of usage of digital devices, day-to-day usage of digital devices and overall benefit of training to beneficiaries. In the table, the green light indicates ‘good performing’ states while the yellow and red lights have been used to mark the ‘moderate performers’ and ‘low performing states’, respectively.
Source: Computed by authors.
National Average
Category AStates
Category BStates
Category CStates
0.78
0.61
0.60
0.58
0.53
0.48
0.39
0.31
0.24
0.10
0.73
0.59
0.50
0.41
0.40
0.33
0.28
0.26
0.19
0.62
0.58
0.35
0.25
0.22
0.21
0.17
0.41
Madhya Pradesh
Karnataka
Tamil Nadu
Andhra Pradesh
West Bengal
Gujarat
Maharashtra
Uttar Pradesh
Rajasthan
Bihar
Chhattisgarh
Kerala
Uttarakhand
Punjab
Haryana
Delhi
Jharkhand
Odisha
Jammu & Kashmir
Tripura
Nagaland
Himachal Pradesh
Chandigarh
Manipur
Puducherry
Daman & Diu

Jammu & Kashmir
Himachal Pradesh
PunjabUttarakhand
Sikkim
Arunachal Pradesh
Assam
Tripura
Nagaland
Mizoram
ManipurMeghalaya
Gujarat West Bengal
Odisha
Jharkhand
Bihar
Tamil Nadu
Puducherry
Kerala
Andhra Pradesh
0.67
0.65
0.630.63
0.57
0.55
0.46
0.55
0.62
0.64
0.56
0.44
0.66
0.62
0.45
0.40
0.640.63
0.60
0.52
0.45
0.39
0.44
0.35
0.33
0.31
Chhattisgarh
Telangana
Karnataka
Goa
MaharashtraDaman & Diu
Rajasthan
Haryana
Chandigarh
Delhi
Uttar Pradesh
Madhya Pradesh
Good PerformerModerate PerformerLow PerformerStates not Covered
Digital Literacy IndexState wise Map of Digital Literacy Status
Map may not be accurate to scale. These are mere representations; States are shaded based on index value.

7 Enhancing the Next Phase of Digital Literacy Mission | 59
7 Enhancing the Next Phase of Digital Literacy Mission
INTRODuCTION
The preceding chapters analysed the various aspects of NDLM training provided to citizens across the country, viz. the chief beneficiaries of the training programme, the components of training, the training outreach mechanism, regularity of training, the content of the training, facilities of the training centre, and the lessons taught, as also and the outcome of the NDLM training. The chapters outlined the impact of the intervention across the states and Union Territories, in varying degrees in different states. Even in the same state/UTs, the performance of the states was good, moderate or low on different indicators.
This chapter presents a cross-country scenario on the overall effect of the training and highlights the states registering good, moderate and low performances. This chapter highlights the gaps in the design and implementation of the training programme on the basis of this assessment, and provides suggestions and recommendations for improving outcomes in the next phase of the digital literacy training.
OVERaLL IMPaCT OF NDLM TRaININg
The study found positive impacts of the NDLM in varying degrees in different states/UTs. The performance of each state varied from ‘good’, ‘moderate’ to ‘low’ in terms of different indicators.
The key findings of this study are presented below.
Figure 7.1 and Table 7.1 present a composite index of the overall impact of the NDLM training across different dimensions and indicators on a scale of 0 to 1. Overall, it can be observed that the performance at the national level was positive, with an index value of 0.53. The states/UTs of Andhra Pradesh, Chandigarh and Gujarat appear in the category of ‘good’ performers in terms of the overall impact of the NDLM. On the other hand, Punjab, Maharashtra and Kerala are moderate performers, while Manipur, Nagaland and West Bengal rank low on the performance scale in terms of the overall impact.
Andhra Pradesh, which tops the list, has good performances in two of the dimensions, viz., training infrastructure and classroom processes, and the training outcome. In Andhra Pradesh, 86 per cent of the respondents stated that the NDLM training had contributed to increasing their knowledge and awareness, and in building their confidence.
Although Kerala, Karnataka, Tamil Nadu and West Bengal are the states with better human, social and economic development, their performance seems to be moderate or low in terms of NDLM training due to various reasons. For instance, the state government of Kerala did not show any interest in implementing NDLM in the beginning. It was only at a later stage that the implementation of NDLM was initiated by

60 | Digital Literacy Training to Non-IT Literate Citizens: Impact Assessment of the NDLM
the Common Service Centres (CSCs) of Kerala. However West Bengal, Tamil Nadu and Karnataka performed well in targeting BPL families. Further, strong outreach measures were not initiated in these states to publicise about the NDLM training. According to the perception of the beneficiaries, the infrastructure and training components such as regularity and the form in which the NDLM content and materials were available, were not up to the mark in these states. All these aspects also impacted the training outcome.
The key findings with respect to the dimensions and indicators are detailed below.
(i) Beneficiary Coverage
In terms of meeting the targeted group under NDLM, the programme had attained its objectives by adhering to the norms and standards fixed for catering to the different sections of the society to whom the IT training was meant for. However, there are certain outliers, in terms of both good and low performances. The good practices of
the best performing states can be replicated in the low- performing states to enable the latter to take corrective actions. The key findings on specific indicators are as follows:
Gender:zz NDLM gives adequate representation to women candidates for the digital literacy training. Although at the national level, 39 per cent of the target beneficiaries were women, the representation was low in some states. Target-specific interventions are thus needed to increase the enrolment of women in the low-performing states.
Age: zz The programme reaches out to people in the age group of 14 to 60 years. However, in most of the states/UTs, senior citizens above the age of 60 years had shown an interest in pursuing the digital literacy training and some of the senior citizens were also found to be active users. For instance, one of the senior citizens was found to be making Skype calls to Dubai to talk to her son. More than 80 per cent of
FIguRE 7.1: OVERaLL IMPaCT OF NDLM TRaININg
Source: Computed by authors.
BeneficiaryCoverage
TrainingComponent
TrainingInfrastructure &
ClassroomProcesses
TrainingOutcome
Overall Impact
NDLM Target Group: Gender 0.43
0.34 Performances of States
Good Moderate Low
Kerala
Tripura
Chandigarh
Jharkhand
Punjab
Uttar Pradesh
Madhya Pradesh
Rajasthan
Daman & Diu
Bihar
Rajasthan
Gujarat
Maharashtra
Andhra Pradesh
Jharkhand
Manipur
Nagaland
Tamil Nadu
Uttarakhnd
Uttar Pradesh
Chhattisgarh
Odisha
Punjab
Maharashtra
Manipur
Nagaland
West Bengal
Andhra Pradesh
Delhi
Chandigarh
Uttar Pradesh
Chhattisgarh
Uttarakhand
West Bengal
Tripura
Jharkhand
Andhra Pradesh
Chandigarh
Gujarat
Punjab
Maharashtra
Kerala
Manipur
Nagaland
West Bengal
0.21
0.62
0.63
0.77
0.60
0.40
0.75
0.50
0.56
0.680.380.54
0.52
0.34
0.37
0.53
0.59
NDLM Target Group: SC
NDLM Target Group: ST
NDLM Target Group: BPL
Digital Literacy Status of Trainee’s Family
Trainee Bene�tted per Family
Finacial Support to Bene�ciaries
Outreach Mechanism of NDLM
Regularity of NDLM Training
Form of NDLM Content and Material
Facilities in Training Centre
NDLM Lessons
Knowledge of Trainer
Teaching Methods
Examination and Certi�cation
Usage of Digital Device
Day-to-day Application of Digital Device
Overall Bene�t of NDLM Training

7 Enhancing the Next Phase of Digital Literacy Mission | 61
TaBL
E 7.
1: O
VER
aLL
PER
FORM
aN
CE
OF
STa
TES
/uT
s O
N D
IMEN
SIO
NS
aN
D IN
DIC
aT
ORS
Stat
esBe
nefi
ciar
y C
over
age
Trai
ning
Com
pon
ent
Trai
ning
Infr
astr
uctu
re &
Cla
ssro
om P
roce
sses
Trai
ning
Out
com
eO
vera
ll In
dex
Val
ue1
23
45
67
89
1011
1213
1415
And
hra
Prad
esh
0.47
0.81
0.86
0.51
0.32
0.91
0.39
0.57
0.78
0.76
0.71
0.76
0.82
0.65
0.86
0.67
Cha
ndig
arh
0.47
0.82
0.82
0.74
0.22
0.96
0.71
0.81
0.85
0.96
0.37
0.58
0.66
0.67
0.53
0.66
Guj
arat
0.41
0.75
0.76
0.71
0.31
0.98
0.85
0.85
0.63
0.97
0.32
0.72
0.25
0.49
0.85
0.65
Utt
arak
hand
0.33
0.93
0.98
0.67
0.52
1.00
0.57
1.00
0.74
0.98
0.37
0.70
0.63
0.19
0.37
0.64
Del
hi0.
320.
910.
320.
550.
470.
790.
480.
850.
780.
730.
500.
740.
870.
600.
730.
64Bi
har
0.48
0.80
0.00
0.64
0.49
0.97
0.92
0.30
0.94
0.96
0.44
0.59
0.50
0.66
0.57
0.63
Utt
ar P
rade
sh0.
370.
680.
600.
660.
530.
960.
610.
890.
700.
930.
450.
800.
670.
290.
470.
63
Har
yana
0.23
0.92
0.53
0.49
0.47
0.92
0.63
0.48
0.84
0.89
0.54
0.80
0.69
0.70
0.39
0.63
Raja
stha
n0.
450.
000.
770.
630.
510.
970.
670.
790.
530.
950.
180.
970.
780.
410.
590.
62
Dam
an &
Diu
0.41
0.53
0.04
0.75
0.52
1.00
0.54
0.72
1.00
1.00
0.50
0.33
0.57
0.77
0.40
0.62
Mad
hya
Prad
esh
0.45
0.83
0.36
0.28
0.51
0.87
0.68
0.60
0.88
0.66
0.46
0.79
0.70
0.71
0.41
0.60
Chh
atti
sgar
h0.
510.
650.
490.
470.
460.
950.
480.
820.
480.
920.
670.
730.
620.
300.
300.
57H
imac
hal P
rade
sh0.
390.
660.
550.
570.
500.
930.
710.
430.
500.
990.
390.
820.
590.
270.
190.
56O
dish
a0.
340.
930.
470.
730.
550.
890.
530.
220.
820.
690.
520.
700.
320.
380.
290.
55
Punj
ab0.
500.
341.
000.
570.
520.
940.
320.
900.
210.
980.
320.
250.
750.
380.
370.
55M
ahar
asht
ra0.
400.
900.
610.
710.
370.
780.
520.
620.
460.
900.
280.
170.
630.
250.
300.
52Ke
rala
0.44
1.00
0.94
0.71
0.18
0.36
0.55
0.59
0.49
0.55
0.21
0.38
0.51
0.04
0.22
0.46
Karn
atak
a0.
540.
810.
910.
620.
260.
620.
400.
570.
530.
160.
180.
490.
430.
170.
310.
45
Jhar
khan
d0.
250.
850.
620.
690.
430.
930.
200.
630.
600.
480.
470.
260.
210.
080.
260.
45
Trip
ura
0.38
0.92
1.00
0.66
0.49
0.52
0.54
0.11
0.26
0.58
0.45
0.33
0.23
0.11
0.18
0.44
Pudu
cher
ry0.
310.
910.
810.
730.
270.
430.
290.
380.
470.
370.
470.
630.
410.
020.
330.
44
Jam
mu
& K
ashm
ir0.
190.
740.
690.
620.
390.
230.
510.
170.
420.
310.
220.
640.
560.
210.
080.
40
Tam
il N
adu
0.59
0.91
0.65
0.71
0.12
0.66
0.18
0.44
0.47
0.18
0.24
0.14
0.40
0.15
0.15
0.39
Wes
t Be
ngal
0.31
0.80
0.91
0.64
0.45
0.51
0.09
0.28
0.28
0.42
0.10
0.32
0.21
0.05
0.05
0.35
Nag
alan
d0.
490.
840.
390.
730.
150.
420.
160.
250.
340.
270.
150.
190.
200.
200.
230.
33
Man
ipur
0.41
0.89
0.26
0.69
0.35
0.00
0.33
0.28
0.36
0.00
0.22
0.25
0.26
0.13
0.26
0.31
all
Ind
ia0.
400.
770.
630.
630.
400.
750.
490.
560.
590.
680.
370.
540.
520.
340.
370.
53
Not
e: 1
. ND
LM T
arge
t G
roup
; 2. D
igit
al L
iter
acy
Stat
us o
f Tra
inee
’s Fa
mily
; 3. T
rain
ee B
enefi
tted
per
Fam
ily; 4
. Fin
anci
al S
uppo
rt t
o Be
nefic
iarie
s; 5
. Out
reac
h M
echa
nism
of N
DLM
; 6. R
egul
arit
y of
ND
LM T
rain
ing;
7.
For
m o
f ND
LM C
onte
nt a
nd M
ater
ial;
8. F
acili
ties
in T
rain
ing
Cen
tre;
9. N
DLM
Les
sons
; 10.
Kno
wle
dge
of T
rain
er; 1
1. T
each
ing
Met
hods
; 12.
Exa
min
atio
n an
d C
erti
ficat
ion;
13.
Usa
ge o
f Dig
ital
Dev
ice;
14
. Day
-to-
day
App
licat
ion
of D
igit
al D
evic
e; 1
5. O
vera
ll Be
nefit
of N
DLM
Tra
inin
g.
Sour
ce: C
ompu
ted
by a
utho
rs.

62 | Digital Literacy Training to Non-IT Literate Citizens: Impact Assessment of the NDLM
the beneficiaries in all the states/UTs are in the age group of 14-35 years. Next in this order are people in the age group of 36 to 45 years.
Social Groups: zz The proportion of SC users was high only in a few states such as Rajasthan, Chhattisgarh and Punjab. Similarly, the proportion of STs was high in Nagaland and Chhattisgarh. In the other states, however, the SC and ST enrolment is quite low in spite of the provision of financial assistance to these categories. It was reported by Madhya Pradesh that establishing training kiosks for the SC and adivasi communities and the hiring of SC and ST trainers from their localities boosted the interest of the SC/ST candidates.
BPL/Non-BPL:zz More than 60 per cent of the beneficiaries across the states/UTs are from a BPL background and the NDLM programme had achieved one of its major goals by reaching out to the target group in this category. However, the maximum numbers of non-BPL card holders were seen to have benefited from the programme in the states of Jammu & Kashmir, West Bengal and Himachal Pradesh.
Financial Support to the Beneficiaries:zz Out of the total SC/ST and BPL candidates, more than 80 per cent of the respondents stated that financial assistance by way of complete fee waiver was provided to these beneficiaries. However, it also came to light that in most of the states, the programme was also being offered free to members of the general and non-BPL categories. It was also observed that some of the training partners and centres were charging fees from the SC/ST and BPL communities, and that fee higher than the stipulated amount was also charged by the training centres.
Digital Literacy Status of Trainee’s Family:zz More than 70 per cent of the respondents at the national level stated that no one in their families had acquired digital literacy before registering for NDLM. The programme was thus successful in meeting
the mandates with respect to digital literacy status. However, in states/UTs such as Bihar, Delhi, and Manipur, the respondents that some of the members in the family had computer knowledge even before of availing the training under NDLM.
One per Family Norm:zz At the national level, 76 per cent of the respondents reported that only one member from their family attended the NDLM training. However, in Rajasthan, Punjab and Daman & Diu, a larger proportion of students reported that more than one member from their family attended the training. As reported in Rajasthan, many such families, who have availed of this training, are living in a joint family set-up.
(ii) Training Components
Good performances under this dimension were visible in about 12 states, while 6 fall under the category of moderate performers and 8 in the low performing category. Overall, most of the states/UTs exhibited positive outcomes in terms of both designing and implementing the basic components necessary for the programme. Under this dimension too, there were variations across states/UTs. The key findings are as follows:
Sources of Information on NDLM Training: zz
Different kinds of outreach measures were initiated in states such as Andhra Pradesh and Madhya Pradesh, such as advertisements in televisions, approaching farmers’ clubs, consultation with gram panchayats, mandals, and camps in slums, among other initiatives. In almost all the states, friends constituted the chief source through which many students got to know about the NDLM training, while advertisements and schools were the major sources of information.
Regularity of Training:zz At the national level, more than 90 per cent of the respondents stated that the NDLM training used to take place on a regular basis and only 6.39 per cent complained about any irregularity in

7 Enhancing the Next Phase of Digital Literacy Mission | 63
the training. The main states/UTs where the training was not regular included Jammu & Kashmir (29.99 per cent), Manipur (29.28 per cent), and Kerala (23.24 per cent). It was observed that hilly areas and conflict zones largely faced the problem of irregularity of training. Regions with frequent power cuts also faced problems with regard to the conduction of regular trainings. Another reason for irregularity of training was the lack of interest exhibited by the students in attending the training on a regular basis.
Teaching Learning Material under NDLM: zz
The Teaching Learning Material (TLM) of NDLM was in audio-video mode while the e-book of the same was also available. Some of the students reported that though the videos were interesting to watch, it was difficult to retain the lessons for long as the videos were not handy for revision.
(iii) Training Infrastructure and Classroom Processes
In the dimension on ‘Training Infrastructure and Classroom Processes’, the performances of most of the states seem to be good and states/UTs such as Uttarakhand, Uttar Pradesh, Chhattisgarh and Delhi fall in the category of good performers. Himachal Pradesh, Punjab, and Maharashtra, among others, are the states with moderate performance whereas the states with low performance include Manipur, Nagaland, West Bengal and Tamil Nadu. The key highlights are as follows:
Facilities in the Training Centre:zz In Andhra Pradesh, Chandigarh, Himachal Pradesh and West Bengal, the essential computer facilities are better than the supportive secondary facilities. In the case of Jharkhand and Kerala, however, a completely opposite picture is seen as here, facilities like web cameras and scanners are in better condition than the essential facilities like Internet and power back-up.
NDLM Lessons:zz While 83 per cent of the respondents said that lessons were taught
on computers, 77 per cent reported having lessons on the usage of smart phones, 58 per cent stated that they had received lessons on the usage of tablets, Internet (77 per cent) and accessing government services (49 per cent). Some of the students also recommended that advanced computer courses be offered in the near future based on the education levels of the students.
Teaching Methods: zz In Andhra Pradesh and Chhattisgarh, emphasis has been laid on the adoption of practical teaching methods as compared to states like Nagaland, West Bengal, Karnataka and many others where classes have been more theoretical.
Knowledge of Trainer:zz In many of the states, 100 per cent of the respondents asserted that the trainers had appreciable knowledge of the course content, and the national average for such respondents is as high as 87 per cent.
Examination and Certification:zz It was observed that 63 per cent of the students faced no difficulty in giving the exam while 37 per cent claimed to be of facing difficulties, and 40 per cent stated that they had received the certificate either in original or through online. The issue of certificates was prompt in the states of Rajasthan, Himachal Pradesh, and Uttar Pradesh, as revealed by 55 per cent of the respondents. In Kerala, Karnataka and West Bengal, where the examination process was delayed due to technical reasons, the certification process was comparatively better.
(iv) Training Outcome
The key highlights in the dimension of ‘Training Outcome’ are as follows:
Usage of Digital Device: zz As many as 63.03 per cent of the respondents who received the training stated that they are able to use the digital devices to check and send emails. The response rate for this was high in the states of Rajasthan, Gujarat,

64 | Digital Literacy Training to Non-IT Literate Citizens: Impact Assessment of the NDLM
Delhi, Punjab, Kerala and Maharashtra. In Manipur, Jharkhand, Odisha and Tamil Nadu, however, some of the students trained stated that they were unable to use digital devices due to the lack of practice at home.
Day-to-day Application of Digital Device:zz It was found that 51.9 per cent of the respondents were able to use digital devices for day-to-day applications like doing office work, and school/college work, while 48 per cent are not able to use the devices as they do not have them at home.
Overall Benefit of NDLM Training: zz As many as 64.05 per cent of the respondents across the states/UTs averred that the NDLM training had contributed in improving their awareness, while this proportion was high in Andhra Pradesh and Gujarat. Some of the respondents also reported about getting jobs, promotions and increase in incomes.
Recommendations
Overall, the performances of various states with regard to most of the indicators were good. However, gaps were identified in certain areas and corrective measures on those aspects will help in improving the next phase of the NDLM. Following are the key suggestions made on the various components.
(i) Beneficiary Coverage
In some states, more than one member zz
from the targeted family was selected. In a number of states, non-eligible families were also selected. Hence, there is need for more prudent and accurate selection of beneficiaries to ensure adequate coverage of the target population.
The educational backgrounds of the zz
trainees varied. Some of them were graduates while others had only studied up to the 10th standard. Both their levels
of understanding as well as the levels of use of the training acquired by them varied. Accordingly, it is recommended that different training modules should be designed for beneficiaries with different levels of education.
In a number of states, elderly people in the zz
age group of 60 plus years also showed an interest in the digital training for their day-to-day usage. The eligibility criteria should thus be modified to include the elderly population, but the training modules should be different for them.
A number of states adopted innovative zz
methods of targeting the BPL/SC/ST and women beneficiaries. Elected representatives of the panchayats in the villages were also involved in identifying eligible beneficiaries. The best practices adopted in some of the states can, therefore, be replicated in the other states.
There is need for strict monitoring of the zz
implementation of programme for SC/ST and BPL candidates, especially in terms of fee waiver for various groups. Further, proper mechanisms should be developed to ensure that the training partners and training centres do not charge extra fees from the candidates.
The outreach measures in a few states zz
included advertising in local newspapers and radios, campaigns in slum areas, meetings with panchayat leaders and working population groups (for example, farmers’ clubs, teachers, and MGNREGA workers), and the use of mobile vans. These practices should also be adopted by the other states.
(ii) Training Component
The training modules should be designed zz
as per the needs of the beneficiaries belonging to diverse age and educational groups. Accordingly, different modules of training need to be developed.

7 Enhancing the Next Phase of Digital Literacy Mission | 65
(iii) Training Infrastructure and Classroom Processes
Proper scrutiny of training partners and zz
centres, before the commencement of the training programme is essential, in order to ensure that the training centres are equipped with proper computers, internet connectivity and other requisite infrastructure.
Due to the prevalence of server and zz
technical problems such as crowding on the portal, the examination was not conducted on time in some states. This indicates that the range of the bandwidth should be enhanced to prevent the portal from hanging due to multiple hits at a time. The examination can thus be conducted for different zones in different time slots.
The examination should be conducted zz
immediately after the training. There should be a minimum time gap between the closure of training and conduction of the examination.
The process of issuing of certificates should zz
be expedited.
(iv) Training Outcomes
Some of the students were not able to zz
use the digital devices due to lack of access to the equipments, especially after completion of their training. As a result, they also forget their lessons. Hence, the PMU may instruct the training centres to allow the students to use the facilities at the training centres for limited purposes, even after training period.
Students, who have taken training, zz
mostly use digital devices for WhatsApp, Facebook and playing of games. The training should also orient them for using it for other purposes. Emphasis should also be laid on the usage of digital devices for accessing government services and other utility based services such as booking of railway tickets, applying for pan-card, passport, aadhaar card, etc.


8 References | 67
8 References
Atkinson, R. D., and Castro, D. 2008. ‘Digital Quality of Life: Understanding the Personal and Social Benefits of the Information Technology Revolution’. available at. http://www.itif.org/files/DQOL.pdf, accessed on 14 July 2016.
Government of India. 2016. Education in India – NSS 71st Round (January – June 2014) – Report No. 575(71/25.2/1), New Delhi: Ministry of Statistics and Programme Implementation and National Sample Survey Office.
Government of India. 2012. National Policy on Information Technology, 2012, available athttp://deity.gov.in/sites/upload_files/dit/files/National_20IT_20Policyt%20_20(1).pdf, accessed on 18 April 2016.
Kapoor, Amit and Mathur, Deepti. 2016. “Bridging the Digital Divide”, The Hindu, July 28,
2016, Available at: http://www.thehindu.com/opinion/op-ed/bridging-the-digital-divide/article8907625.ece, Accessed on 5 August 2016.
Madon S., Reinhard N., Roode D. & Walsham G. 2009. “Digital Inclusion Projects in Developing Countries: Processes of Institutionalization”, Information Technology for Development, vol. 15 (2), 95-110.
UNDP. 2015. Human Development Report 2015: Work for Human Development, New York: UNDP.
World Bank. 2016. World Development Report 2016: Digital Dividends, Washington: International Bank for Reconstruction and Development.
www.ndlm.in


Annexes | 69
Annexes
NDLM SuRVEyInterview Schedule for Trainees
aNNEx-1
QuaLIFyINg CRITERIa Particulars Response
Have you attended the computer course under NDLM project?
(If yes, proceed further)
INSTRuCTIONS
1. Please read carefully the following notes as well as note(s) against each question.
2. Please tick (√) the appropriate box against each question/information sought, unless mentioned otherwise. Tick (√) indicates ‘Yes’ (means positive selection). Please make multiple selections, if needed. If a box is not ticked, it will be treated as ‘No’ filled in that box.
3. The respective codes for each response have been mentioned within the relevant section. Where the respondents have other answers
apart from the given choice, the answer can be elaborated under ‘others’ under ‘code 9’.
4. Please give explanatory notes/observations wherever required.
5. In the course of the conversation with the respondents, special aspects that can be covered under ‘case study’ can be highlighted.
6. The information sought in this exercise is for research and survey purposes only.
7. Section I is a qualifying question to initiate the survey. Please assess and proceed further.

70 | Digital Literacy Training to Non-IT Literate Citizens: Impact Assessment of the NDLM
1. SECTION I: gENERaL INFORMaTIONSl. No. Questions Responses
1. What is your age?
2. What type of ration card do you have?
BPL (1)
Non-BPL(2)
No ration Card (3)
No Response(4)
3. What is your community?
SC (1)
ST (2)
OBC (3)
General (4)
No response (5)
4. What is your educational qualification?
Illiterate (1)
Neo literate (2)
up to 7th standard (3)
up to 10th standard (4)
up to 12th standard (5)
Diploma (6)
Graduation (7)
Other (9)
5. How many members in your family are digitally literate?
None (1)
Less than 2 members (2)
2 to 4 members (3)
5 to 6 members (4)
more than 6 members (5)
6. How did you get registered in the NDLM programme?
Advertisements (1)
Friends (2)
Websites (3)
School (4)
Others (9)
7. Do other members of your family attend this training program?
Yes (1), No (2)
8. When did you enroll in this course? (MM/YYYY)
9. When did you appear for final examination? (MM/YYYY)
10. Was there a gap in giving the exam? If yes, mention reason(s)No (1), Yes (9)
11. Mode in which you have received your certificate?
Provisional Online/Print version (1)
Certificate in original (2)
not received in any form (3)
12. How much fee did you pay for the course?
No fees (1)
Rs. 125 (2)
More than Rs. 125 (3)

Annexes | 71
2. SECTION II: SaTISFaCTION IN TRaININgSl. No. Questions Responses
1. Did you have your classes on a regular basis?
Always regular (1)
Mostly regular (2)
Irregular (3)
2. What is your opinion on the basic IT facilities in the training centre?
gOOD (1)
aVERagE (2)
BaD (3)
a. Computers
b. Internet Connectivity
c. Power Back-Up
d. Printer
e. Web-Cam
f. Scanner
3. What was taught in class?
a. Basic computer application (Yes-1, No-2)
b. Use of mobile/Smartphones for internet browsing (Yes-1, No-2)
c. Use of tablet for internet browsing (Yes-1, No-2)
d. Use of internet (Yes-1, No-2)
e. Accessing online government service (Yes-1, No-2)
f. Others (9)
4. What were the ways in which the course material was supplied under NDLM?
a. Through projectors/Audio-video mode (Yes-1, No-2)
b. Booklet (Yes-1, No-2)
c. e-Content of Book (Yes-1, No-2)
d. Photocopy of Study Materials (Yes-1, No-2)
e. Others (Yes-1, No-2)
5. What is your opinion on the knowledge of your trainer? gOOD (1)
aVERagE (2)
BaD (3)
6. What were the teaching methods practiced?
More of theory (1)
More of practical by using devices (2)
More of audio-visual/Projectors (3)
Mix of all (4)
7. What is the language of instruction in class?
Hindi (1)
Local language (2)
English (3)
Mix of all (4)
8. Did you face difficulty in giving online examination?
If yes, give reasons
yes (1) No (2)

72 | Digital Literacy Training to Non-IT Literate Citizens: Impact Assessment of the NDLM
3. SECTION III: TRaININg OuTCOMESl. No. Questions Responses
1. Which device can you operate effectively after the NDLM training?
gOOD (1)
aVERagE (2)
BaD (3)
a. Computer/Laptop
b. Tablets
c. Mobile/Smartphones
d. Others
2. For what purpose do you use the digital device?
a. Sending/receiving mail (Yes-1, No-2)
b. Search internet for information (Yes-1, No-2)
c. Facebook/twitter (Yes-1, No-2)
d. Paint (Yes-1, No-2)
e. Searching for jobs (Yes-1, No-2)
f. Availing of Government services (for example, Aadhar card, booking of tickets, etc.) (Yes-1, No-2)
g. Games (Yes-1, No-2)
h. Others (Yes-1, No-2)
3. In what ways is the training helpful in day-to-day activities?
a. Doing School/College Work (1)
b. Doing Office Work (2)
c. Not able to use/No access to digital device (3)
d. Other (9)
4. What is the overall benefit of the NDLM training?
a. Improved General Awareness (Yes-1, No-2)
b. Improved my ICT knowledge (Yes-1, No-2)
c. Increased my confidence level (Yes-1, No-2)
d. Got a job (Yes-1, No-2)
e. Got promotion in Job (Yes-1, No-2)
f. Got more income (Yes-1, No-2)
g. Able to teach others on computer application (Yes-1, No-2)
h. Others (Yes-1, No-2)
5. What is your suggestion on infrastructure, course material, exam pattern, course duration, trainers, etc. of the NDLM training/course?
(kindly provide answer to the section sheet/column/row)

Annexes | 73
aN
NEx
2: S
TaT
uS
OF
SuRV
Ey R
ESPO
NSE
Sl. N
o.St
ates
Busy
/No
Resp
onse
/N
o a
nsw
er
Swit
ched
O
ff/N
ot
Reac
hab
le
wro
ng
Nos
.C
all
Back
Not
a
vaila
ble
On
Trai
ning
Oth
ers
Not
a
tten
ded
Inco
mp
lete
Com
ple
ted
In
terv
iew
sTo
tal
1.A
ndhr
a Pr
ades
h94
979
722
414
0924
082
548
99
2000
8292
2.Bi
har
3229
1789
188
7915
490
823
93
2000
9084
3.C
hand
igar
h89
229
337
546
20
085
422
220
00
4.C
hhat
tisg
arh
1074
182
1658
547
90
016
90
667
3172
5.D
aman
& D
iu18
161
71
270
02
222
250
3
6.D
elhi
684
402
145
5745
50
362
266
724
77
7.G
ujar
at20
3828
218
286
331
590
8825
620
2000
8888
8.H
arya
na45
224
565
2621
50
18
066
716
79
9.H
imac
hal P
rade
sh72
433
217
926
822
90
143
022
218
99
10.
Jam
mu
& K
ashm
ir46
689
3242
161
156
266
713
72
11.
Jhar
khan
d52
391
1218
122
248
91
667
1817
12.
Karn
atak
a18
9012
9912
113
5512
232
225
898
2000
1048
9
13.
Kera
la15
6786
114
812
4211
353
316
897
667
7322
14.
Mad
hya
Prad
esh
2098
1321
410
220
1123
015
310
920
0075
06
15.
Mah
aras
htra
1876
917
512
1792
1489
44
2985
820
0011
587
16.
Man
ipur
188
5812
158
11
361
222
542
17.
Nag
alan
d12
858
1417
60
059
122
250
5
18.
Odi
sha
935
678
108
1818
40
042
166
726
33
19.
Pudu
cher
ry11
284
1616
120
065
122
252
8
20.
Punj
ab88
927
513
312
724
90
436
566
723
85
21.
Raja
stha
n19
1470
067
152
231
03
3440
520
0085
12
22.
Tam
il N
adu
3197
1012
338
1222
1212
54
1985
720
0010
982
23.
Trip
ura
123
988
42
11
231
222
483
24.
Utt
ar P
rade
sh30
5121
2622
817
6828
00
068
33
2000
1013
9
25.
Utt
arak
hand
473
733
5513
00
1012
066
722
96
26.
Wes
t Be
ngal
5467
1245
455
1689
988
44
2248
920
0014
109
a
ll In
dia
3512
015
368
3660
1304
516
959
3414
919
200
109
2755
713
1201


