digital city models in urban design
TRANSCRIPT

Jurnal Alam Bina, Jilid 13: No.4, 2008.
DIGITAL CITY MODELS IN URBAN DESIGN Michihiko Shinozaki
1 and Kei Saito
2
1 Department of Architecture & Environment Systems, Shibaura Institute of Technology, Japan.
Department of Landscape Architecture, Universiti Teknologi Malaysia.81310 UTM Skudai, Johor Bahru 2Department of Landscape Architecture, Universiti Teknologi Malaysia, 81310 UTM Skudai,
Johor Bahru E-mail: [email protected]
ABSTRACT: This paper describes a virtual city model of Tokyo Yaesu area that is created by a model study undertaken for the Urban Renaissance Project promoted by the Japanese government. The model is generated using the technique of fabricating a physical urban model developed by the author’s group. The virtual model facilitates the navigation, simulation and visualization of the urban landscape and even the invisible environmental issues. However, the traditional physical model is still an effective tool for understanding the urban forms and scale in the practical design process. Consequently, we decided to build a physical model to start a dialogue with the stakeholders in this area. A notable feature of this study is that the data prepared for the physical model can be used in the development of the virtual model. We discuss data sharing and the cost-reduction issues for multiple types of models. It is confirmed that spatial data for use in urban design can be converted into Google Earth data and that virtual city models have potential to provide the powerful functions for sharing images of urban environments. Keywords: Urban Design, Digital City Model, Environmental Simulation, Design Process Introduction The design process involves numerous civic bodies and citizens, and therefore, a common platform is needed to share urban forms and study environmental impacts. Information technology is expected to encourage the visualization of imagery of urban space and unnoticed environmental issues that emerge in the design process. We have been involving the development of virtual city models for the platform of collaborative urban design [Shinozaki (2007a), (2007b), (2008), Saito (2007)]. This paper presents a case study of virtual city model of Tokyo Yaesu area. We discuss data sharing and the cost-reduction issues for multiple types of models, and apply the models in community meeting to get the feedback from stakeholders in the district.
DIGITAL CITY MODELS IN URBAN DESIGN
26
Urban Restructuring in Central Tokyo Urban Renewal Strategies in Japan The Urban Renaissance Headquarter is established in the government in 2001 to promote urban renewal for creating the vital, safe and sustainable cities as well as for stimulating Japanese economy. The government has designated several critical development districts and gave taxation incentive and the non-interest loan for the development bodies as well as the mitigation of planning regulations. Under these political measures, Tokyo has been playing a central role in urban restructuring [Morishita (2006)].
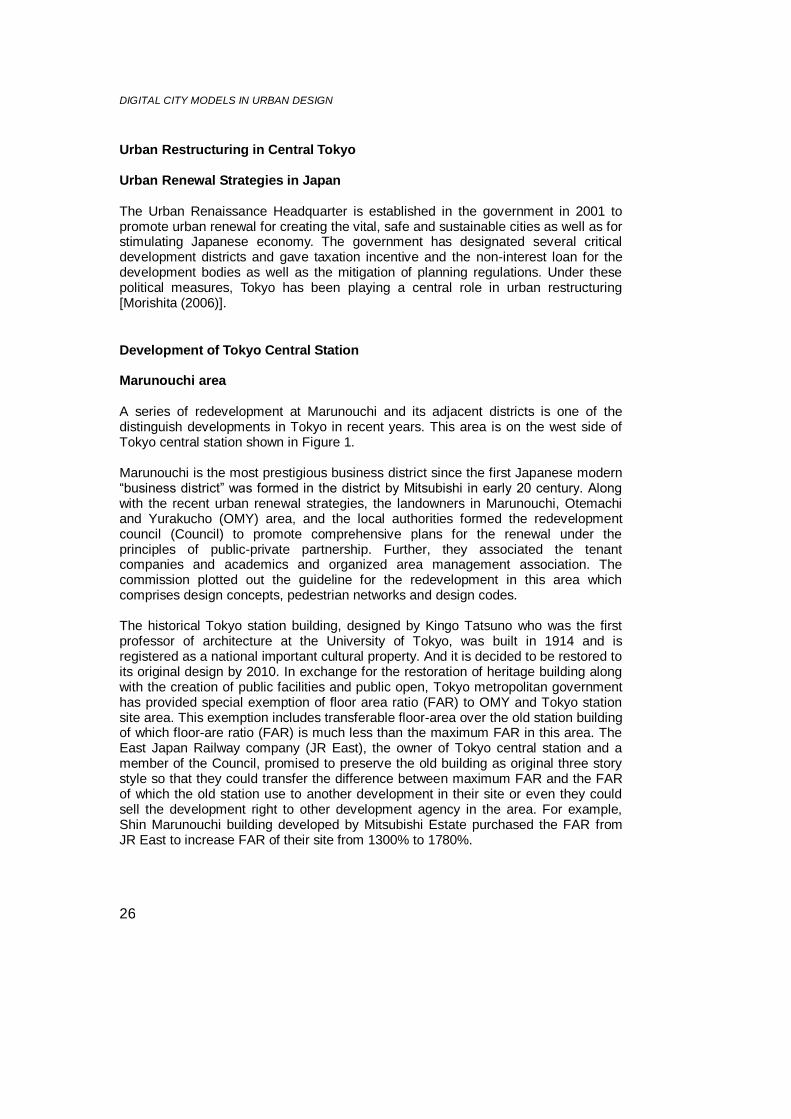
Development of Tokyo Central Station Marunouchi area A series of redevelopment at Marunouchi and its adjacent districts is one of the distinguish developments in Tokyo in recent years. This area is on the west side of Tokyo central station shown in Figure 1. Marunouchi is the most prestigious business district since the first Japanese modern “business district” was formed in the district by Mitsubishi in early 20 century. Along with the recent urban renewal strategies, the landowners in Marunouchi, Otemachi and Yurakucho (OMY) area, and the local authorities formed the redevelopment council (Council) to promote comprehensive plans for the renewal under the principles of public-private partnership. Further, they associated the tenant companies and academics and organized area management association. The commission plotted out the guideline for the redevelopment in this area which comprises design concepts, pedestrian networks and design codes. The historical Tokyo station building, designed by Kingo Tatsuno who was the first professor of architecture at the University of Tokyo, was built in 1914 and is registered as a national important cultural property. And it is decided to be restored to its original design by 2010. In exchange for the restoration of heritage building along with the creation of public facilities and public open, Tokyo metropolitan government has provided special exemption of floor area ratio (FAR) to OMY and Tokyo station site area. This exemption includes transferable floor-area over the old station building of which floor-are ratio (FAR) is much less than the maximum FAR in this area. The East Japan Railway company (JR East), the owner of Tokyo central station and a member of the Council, promised to preserve the old building as original three story style so that they could transfer the difference between maximum FAR and the FAR of which the old station use to another development in their site or even they could sell the development right to other development agency in the area. For example, Shin Marunouchi building developed by Mitsubishi Estate purchased the FAR from JR East to increase FAR of their site from 1300% to 1780%.
Michihiko Shinozaki & Kei Saito
27
Nihonbashi area Nihonbashi area is also drastically changing. This area was a commercial center since early 17 century and it has become a predominant financial district in Japan in these days. The Bank of Japan and Tokyo Stock Exchange are located in this area. Mitsui group has been playing an essential role for developing this area since their family based their business there in Edo period. One of the notable redevelopments in recent year is undertaken to preserve their heritage administration building, the Mitsui Honkan, along with the redevelopment of adjacent site. Unused FAR over the heritage building is transferred to the new development building that includes offices, museum and luxury hotel. Ginza Area Ginza area is the most famous shopping district and is known as the highest land price district in Japan. The streetscape of this area is formed by 1960’s until when the building height is limited less than 31m, and nowadays, the local authority regulates the limit of maximum height of the building to 56m in their ordinance to avoid diminishing the prestigious ambient of this area. Despite this height limit, the area is very active and a lot of super brand shops stand in a row one after another along the main street. Yaesu Area Yaesu area is a commercial and business district located on the eastern side of Tokyo Central Station where several urban mega-developments, such as the Marunouchi and Nihonbashi areas, have been completed in recent years or are currently being undertaken as mentioned above. Despite the expectation of the urban renewal in the near future, the redevelopment in this area has not proceeded yet. There are large landowners in Marunouchi and Nihonbashi such as Mitsubishi group and Mitsui group conglomerate respectively. Unlike these areas, the ownership of the lands in Yaesu is subdivided and there are a large number of stakeholders in each block, therefore the consensus building is very tough and the comprehensive urban design policy has not agreed yet.
DIGITAL CITY MODELS IN URBAN DESIGN
28
Figure 1: Map around Tokyo central station
Yaesu Models Project
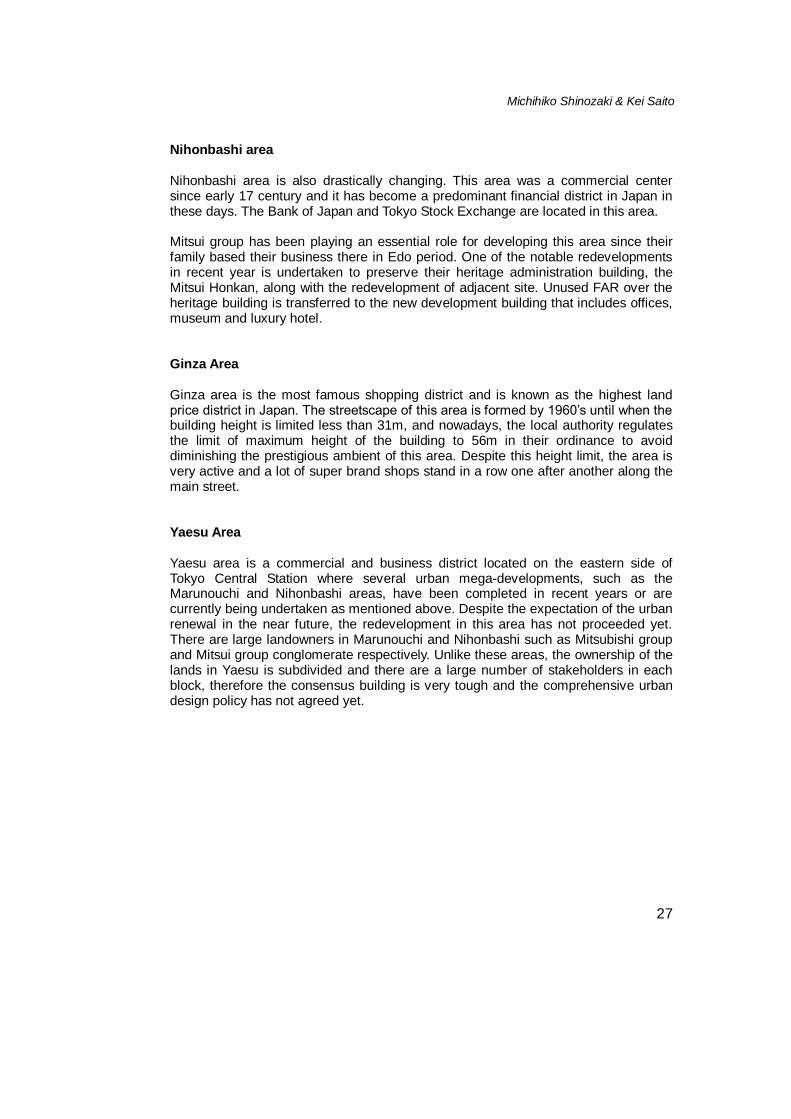
Preface of the Project In accord with these backgrounds, the author’s group launched the development of open platform for the dialogue and the collaboration process in urban design toward the future redevelopment in Yaesu area. This work constituted one of the model studies undertaken by the Urban Renaissance Project promoted by the government. Making Models Physical Model Models are abstracts of the physical world and are traditional tools for understanding architectural and urban forms and scales. They often initiate a dialogue about planning and design. We have been developing a technique for fabricating urban models as well as digital model development. Consequently, we decided to build a physical model of the Yaesu area to start a dialogue with landowners and leaseholders. Figure 2 shows the physical model of this area. We can instantly notice
Michihiko Shinozaki & Kei Saito
29
the contrast between the Yaesu area (left part) and the Tokyo Station, the Marunouchi and Otemachi areas (middle and right part). The data on the outlines of the buildings and their heights, facades and signage are acquired through a precise field survey. A notable feature of this work is that the data acquired for the physical model is also usable for the virtual model, and therefore, the cost would be reduced if we have to create both types of models.
Figure 2: Physical model of Tokyo’s Yaesu area
Virtual Model The virtual model was first made by Urban Simulation Lab. (USL), Tokyo., using LightWave3D and converted into SOLA VR System. This model is composed of high-end graphics including pavements, street furniture and greenery shown if Figure 3. Next, data was converted to Google Earth data using the same conversion process described in previous paper [Shinozaki (2007.5)]. The spatial data is converted to COLLADA format files which is an XML-based language and is available for the 3D modeling in Google Earth. Each building is associated with a dataset comprising object, UV and texture data. Self-made Perl scripts are used in this process for converting 3D model to COLLADA format file. The model uses a relative coordinate system instead of map coordinates. Therefore, positions ware adjusted manually.

DIGITAL CITY MODELS IN URBAN DESIGN
30
Figure 3: Virtual model of Tokyo’s Yaesu Area
(C) Urban Simulation Lab., Tokyo
Figure 4: Virtual models of Yaesu, Tokyo, in Google Earth
Michihiko Shinozaki & Kei Saito
31
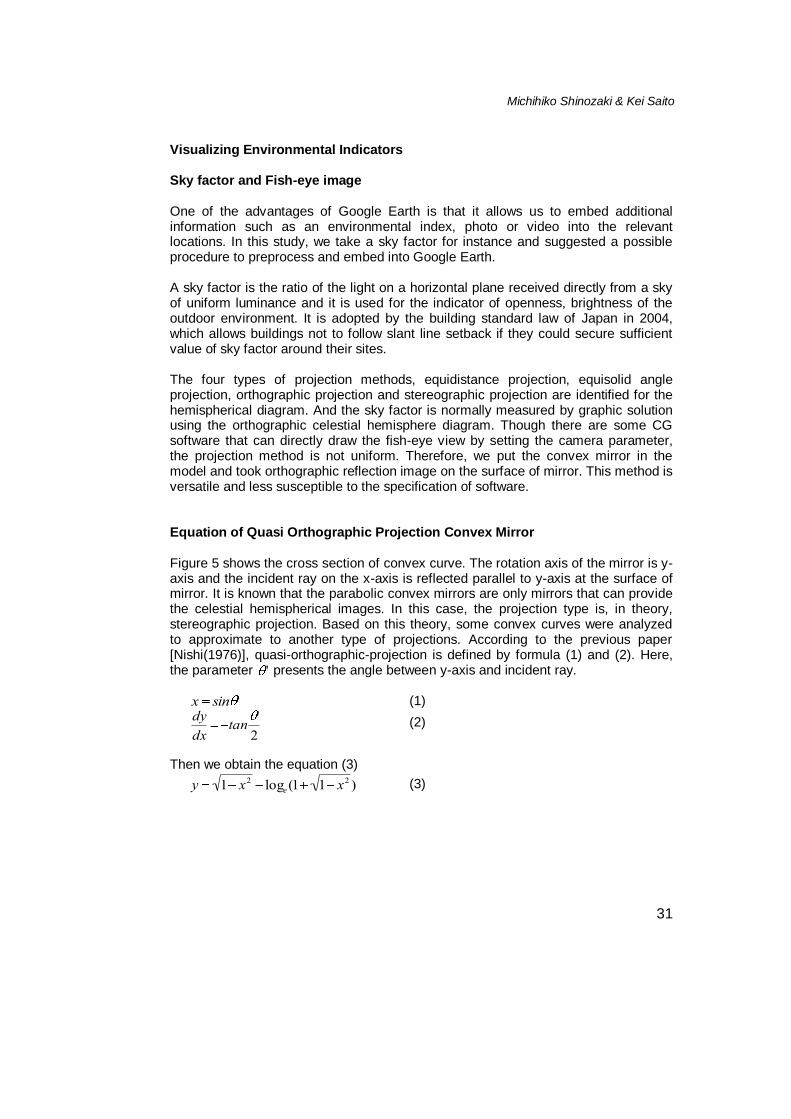
Visualizing Environmental Indicators Sky factor and Fish-eye image One of the advantages of Google Earth is that it allows us to embed additional information such as an environmental index, photo or video into the relevant locations. In this study, we take a sky factor for instance and suggested a possible procedure to preprocess and embed into Google Earth. A sky factor is the ratio of the light on a horizontal plane received directly from a sky of uniform luminance and it is used for the indicator of openness, brightness of the outdoor environment. It is adopted by the building standard law of Japan in 2004, which allows buildings not to follow slant line setback if they could secure sufficient value of sky factor around their sites. The four types of projection methods, equidistance projection, equisolid angle projection, orthographic projection and stereographic projection are identified for the hemispherical diagram. And the sky factor is normally measured by graphic solution using the orthographic celestial hemisphere diagram. Though there are some CG software that can directly draw the fish-eye view by setting the camera parameter, the projection method is not uniform. Therefore, we put the convex mirror in the model and took orthographic reflection image on the surface of mirror. This method is versatile and less susceptible to the specification of software. Equation of Quasi Orthographic Projection Convex Mirror Figure 5 shows the cross section of convex curve. The rotation axis of the mirror is y-axis and the incident ray on the x-axis is reflected parallel to y-axis at the surface of mirror. It is known that the parabolic convex mirrors are only mirrors that can provide the celestial hemispherical images. In this case, the projection type is, in theory, stereographic projection. Based on this theory, some convex curves were analyzed to approximate to another type of projections. According to the previous paper [Nishi(1976)], quasi-orthographic-projection is defined by formula (1) and (2). Here, the parameter ' presents the angle between y-axis and incident ray. x sin ' (1)
dy
dxtan
'
2 (2)
Then we obtain the equation (3)
y 1 x2 loge(1 1 x2 ) (3)
DIGITAL CITY MODELS IN URBAN DESIGN
32
Figure 5: Quasi-Orthographic Projection
Generate Convex Mirror in Blender In this process, the digital model is converted to the Blender to generate the convex mirror and to take orthographic celestial hemisphere image (Figure 6). The convex mirror was generated by Python script following the equation (3). Figure7 shows some reflected celestial hemisphere images obtained in this process.

Michihiko Shinozaki & Kei Saito
33
Figure 6: Digital models in Blender
Figure 7: Quasi-orthographic-projection fish-eye images
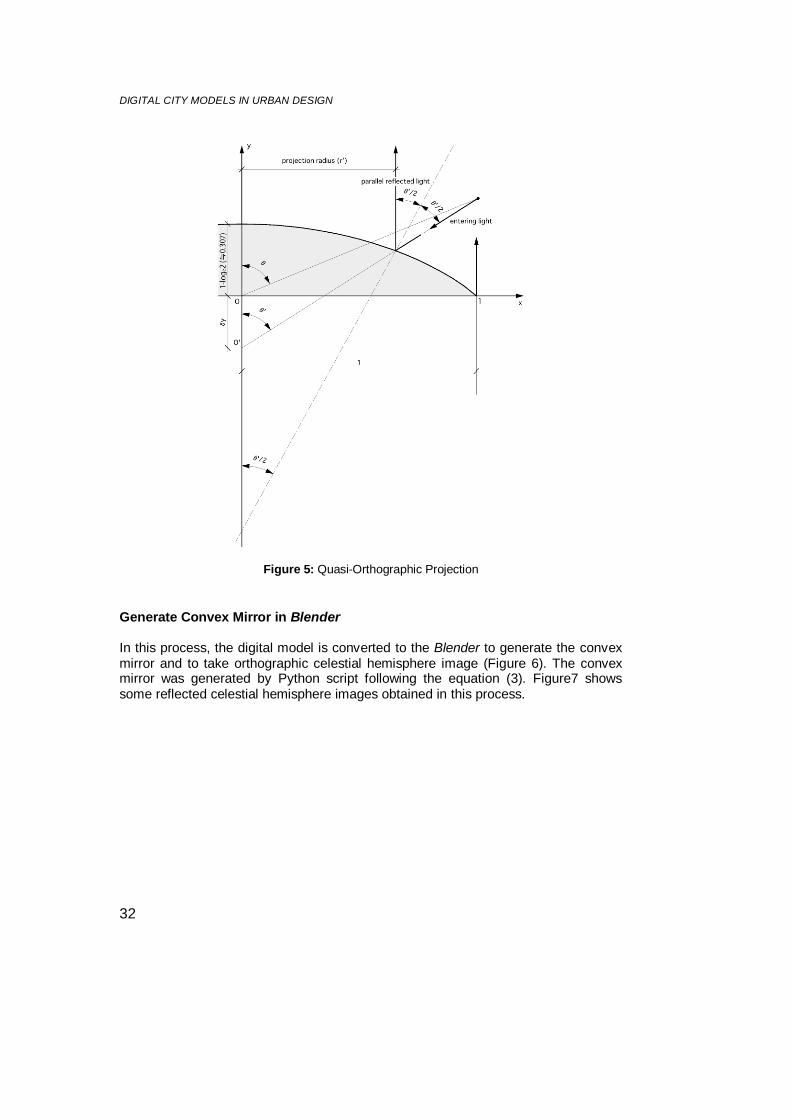
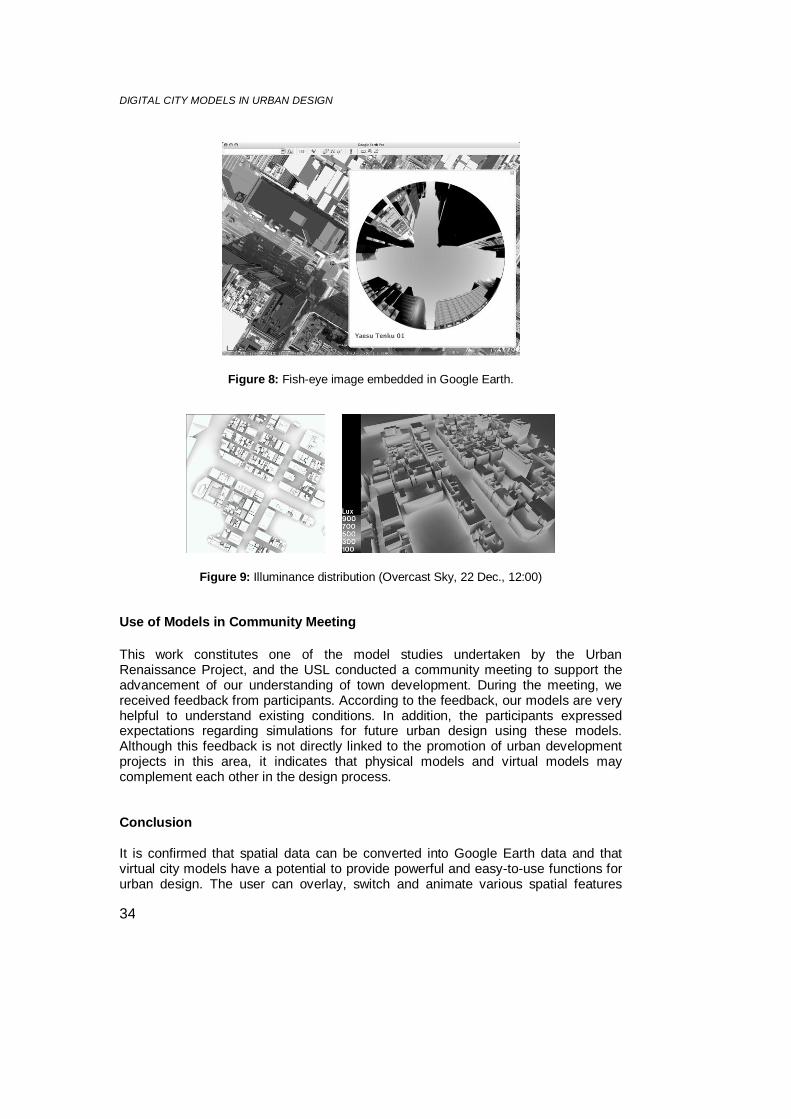
Figure 8 shows the celestial hemisphere embedded in Google Earth. The image was generated in Blender and was linked to the location data of the measurement point. The data is converted to KML format, and then, the images would be shown when the user click the camera icon appeared in Google Earth. Adding to the sky factor, we have measured the values of illuminance, sunshine duration and solar energy in this area and have drawn the distribution of these indicators (partly shown in Figure 9). The digital 3D model was converted to Radiance for this simulation. It is confirmed that the digital model is transferable among Google Earth, Blender and Radiance, and that the model is very useful for these kinds of environmental Google Earth works well to visualize the embedded environmental indicators as well as to navigate the urban landscape.
DIGITAL CITY MODELS IN URBAN DESIGN
34
Figure 8: Fish-eye image embedded in Google Earth.
Figure 9: Illuminance distribution (Overcast Sky, 22 Dec., 12:00)
Use of Models in Community Meeting
This work constitutes one of the model studies undertaken by the Urban Renaissance Project, and the USL conducted a community meeting to support the advancement of our understanding of town development. During the meeting, we received feedback from participants. According to the feedback, our models are very helpful to understand existing conditions. In addition, the participants expressed expectations regarding simulations for future urban design using these models. Although this feedback is not directly linked to the promotion of urban development projects in this area, it indicates that physical models and virtual models may complement each other in the design process. Conclusion It is confirmed that spatial data can be converted into Google Earth data and that virtual city models have a potential to provide powerful and easy-to-use functions for urban design. The user can overlay, switch and animate various spatial features
Michihiko Shinozaki & Kei Saito
35
along with navigating in virtual urban space. Further the digital models are helpful for the environmental simulation. Google Earth can embed these invisible environmental issues and visualize them along with the landscape simulation. The models are presented in a community meeting and the favorable feedback was obtained for their use in the design process. A follow-up evaluation would examine the practical design process in the case study areas.
Acknowledgments The Tokyo Yaesu model is part of joint study undertaken by the SIT and the Urban Simulation Lab., Tokyo (USL). The authors acknowledge USL for their contribution. This work is part of the model studies of the Urban Renaissance Project promoted by the Urban Renaissance Headquarters in the Japanese government. References Morishita, N. et. al, (2006). “Trends in Urban redevelopment in Central Tokyo”, City
Planning Institute Japan, News Letter No.25. Shinozaki, M. (2008). “Virtual 3D Models in Urban Design”, Virtual Geographic
Environment 2008, Hong Kong. Saito, K., Shinozaki, M. and Hitaka, K. (2007). “A Technological Study of Multiple
Application as Common Platform for Time-Space Data Using Google Earth”, Journal of Architecture and Building Science, Architectural Institute of Japan, Vol.13, No.25, pp.317-320, (in Japanese).
Shinozaki, M., Saito, K. and Hitaka, K. (2007a). “Digital Platform for Collaborative
Urban Landscape Design using Google Earth”, REALCORP 007, Proceedings, ISBN:978-39502139-3-5, ISBN:978-39502139-2-8 (CD), Vienna.
Shinozaki, M., Saito, K. and Hitaka, K., “Virtual Fukuoka” (2007b). The 1st
SEATUC Symposium Proceedings, South East Asia Technical University Consortium, Bangkok.
Nishi, Y., Kozima, T., et. Al (1976). “Studies on the Photographing Devices of
Various Projections with Convex Mirrors”, J. Archit. Plann. Environ. Eng., AIJ, No.239, pp.83-91.
Banes, M. and Sony Computer Entertainment Inc. Ed. (2006). COLLADA – Digital
Asset Schema 1.4.1 Specification, Khronos Group. Arnaud, R. and Barnes, C. M. (2006). COLLADA: Sailing the Gulf of 3d Digital
Content Creation, A K Peters Ltd,.