digital analytics lecture - nyu
TRANSCRIPT

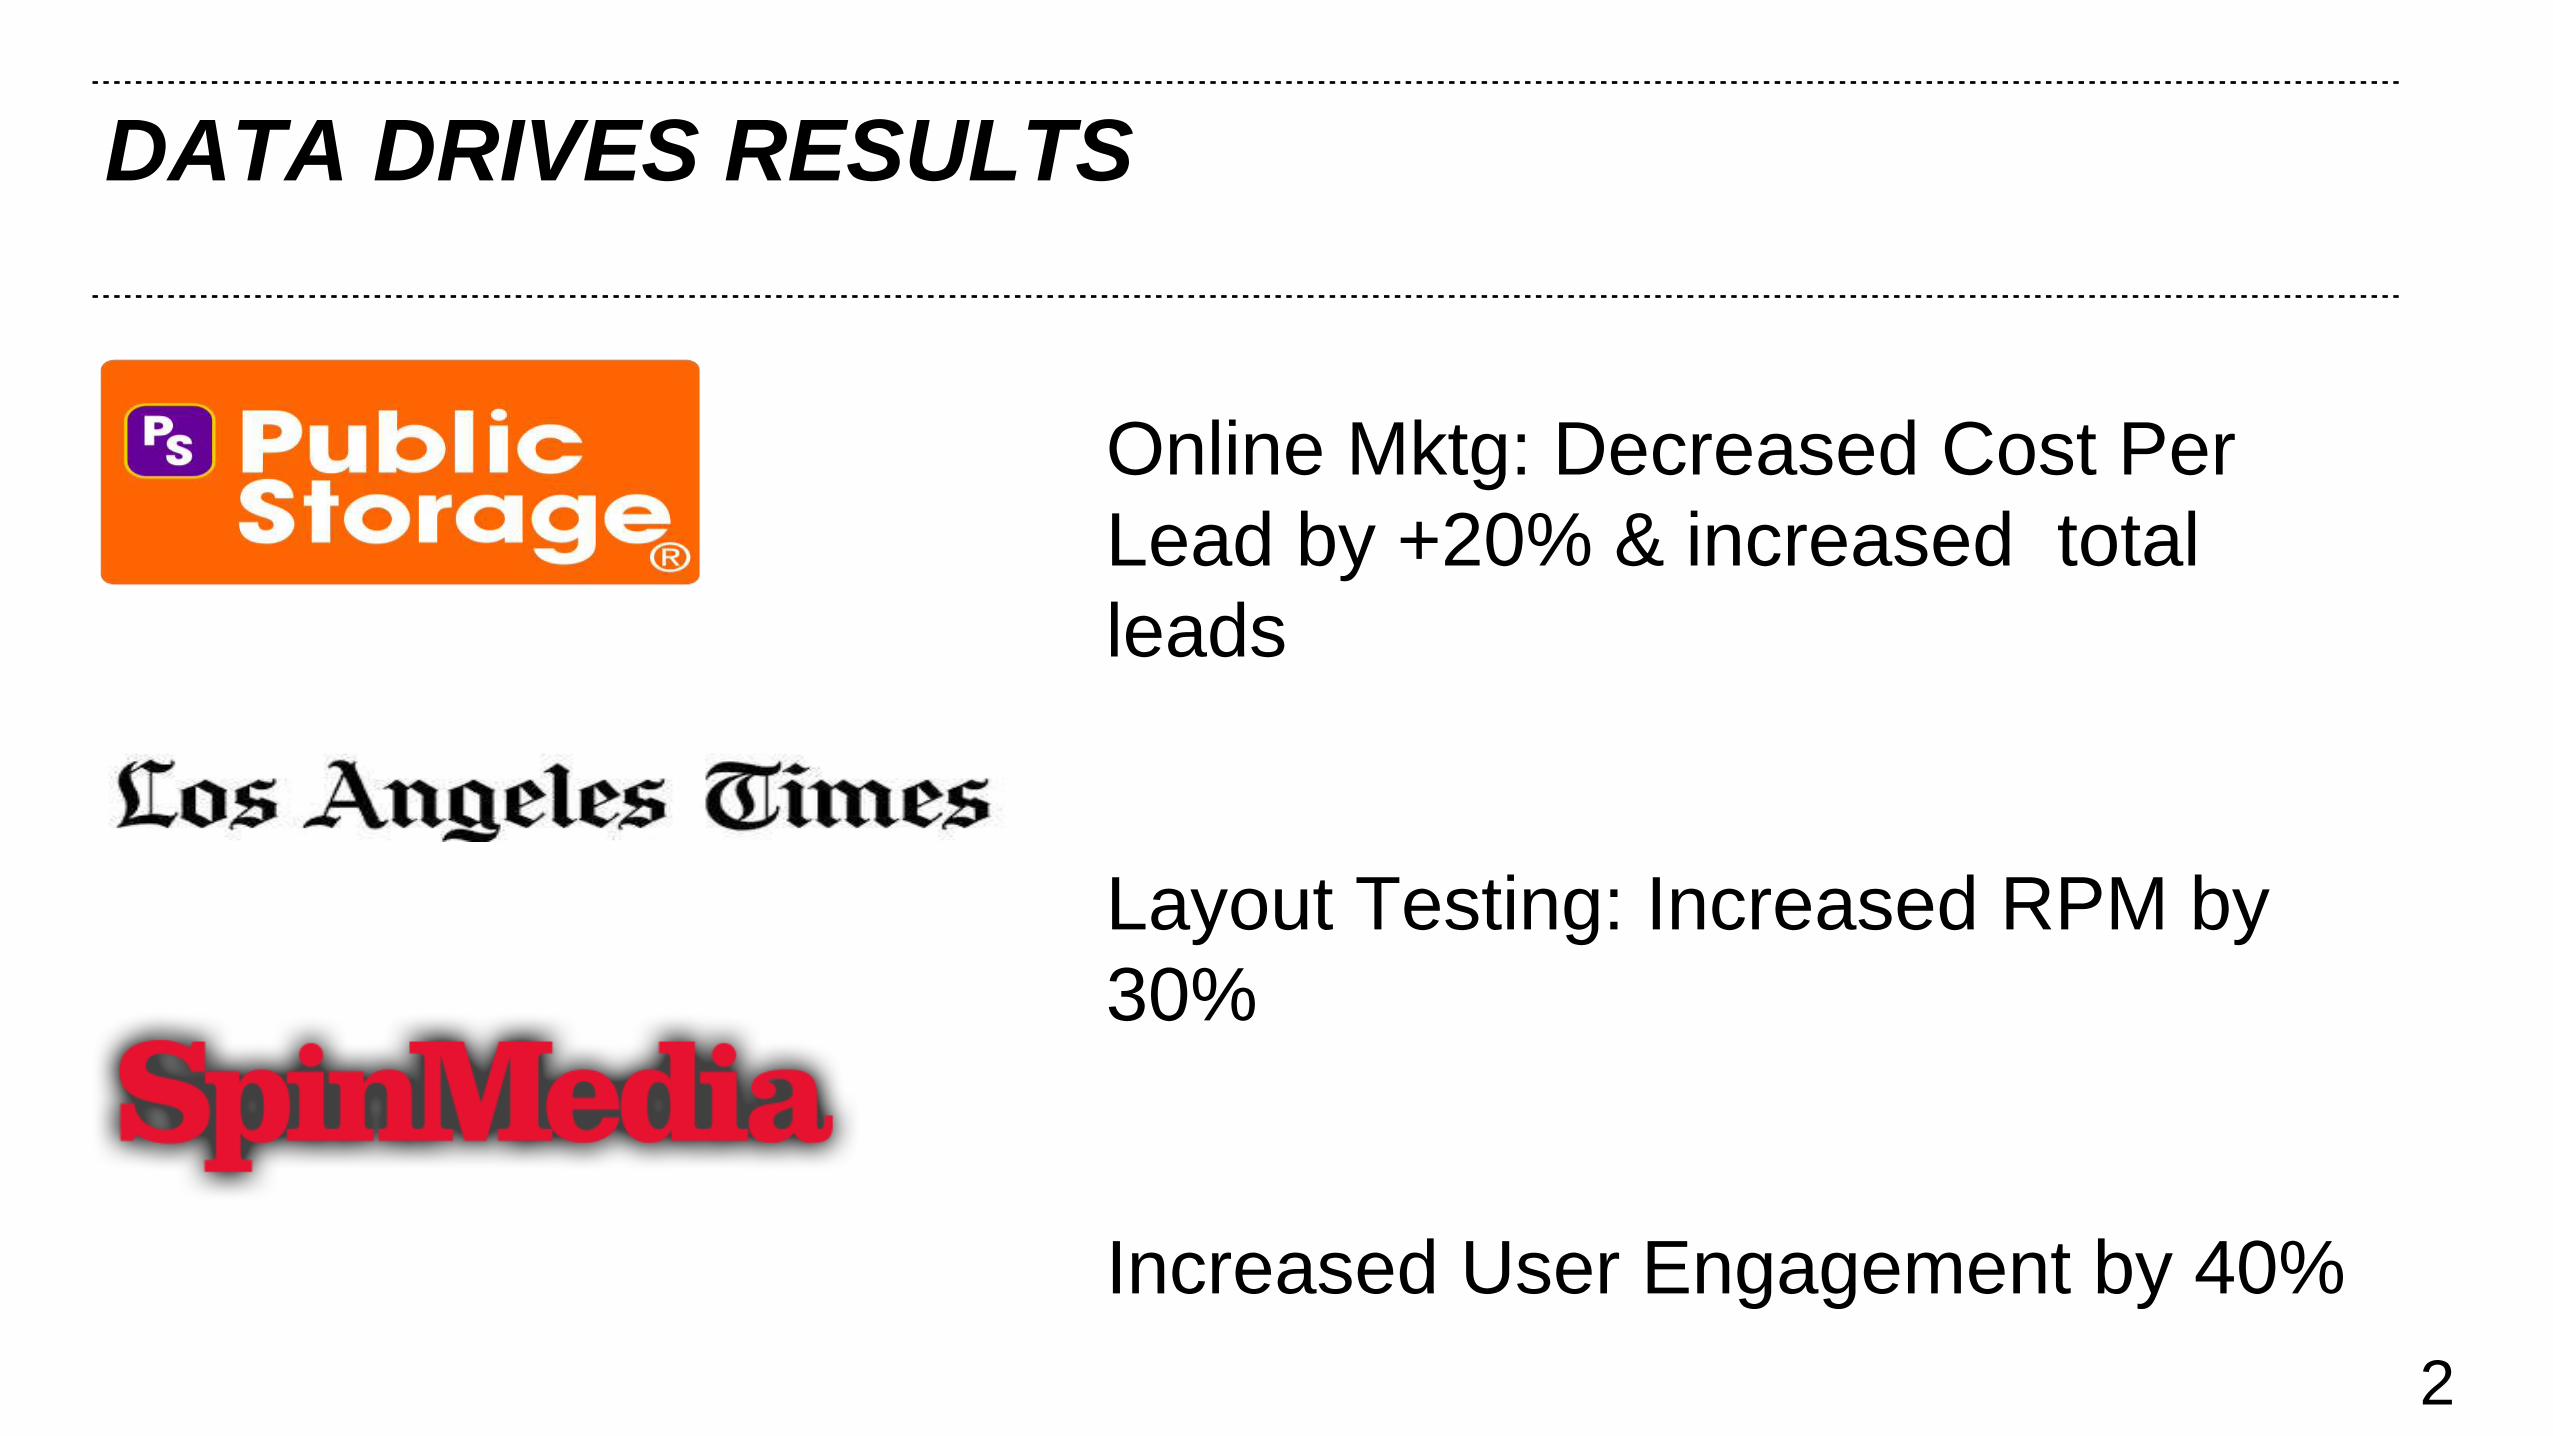
DATA DRIVES RESULTS
2
Online Mktg: Decreased Cost Per
Lead by +20% & increased total
leads
Layout Testing: Increased RPM by
30%
Increased User Engagement by 40%
CharleneDipaola
@CharleneDipaola
+CharleneDipaola
m
@CharleneDipaola
Sr. Director, Data & Growth – SPIN MEDIA GROUP

‹#›
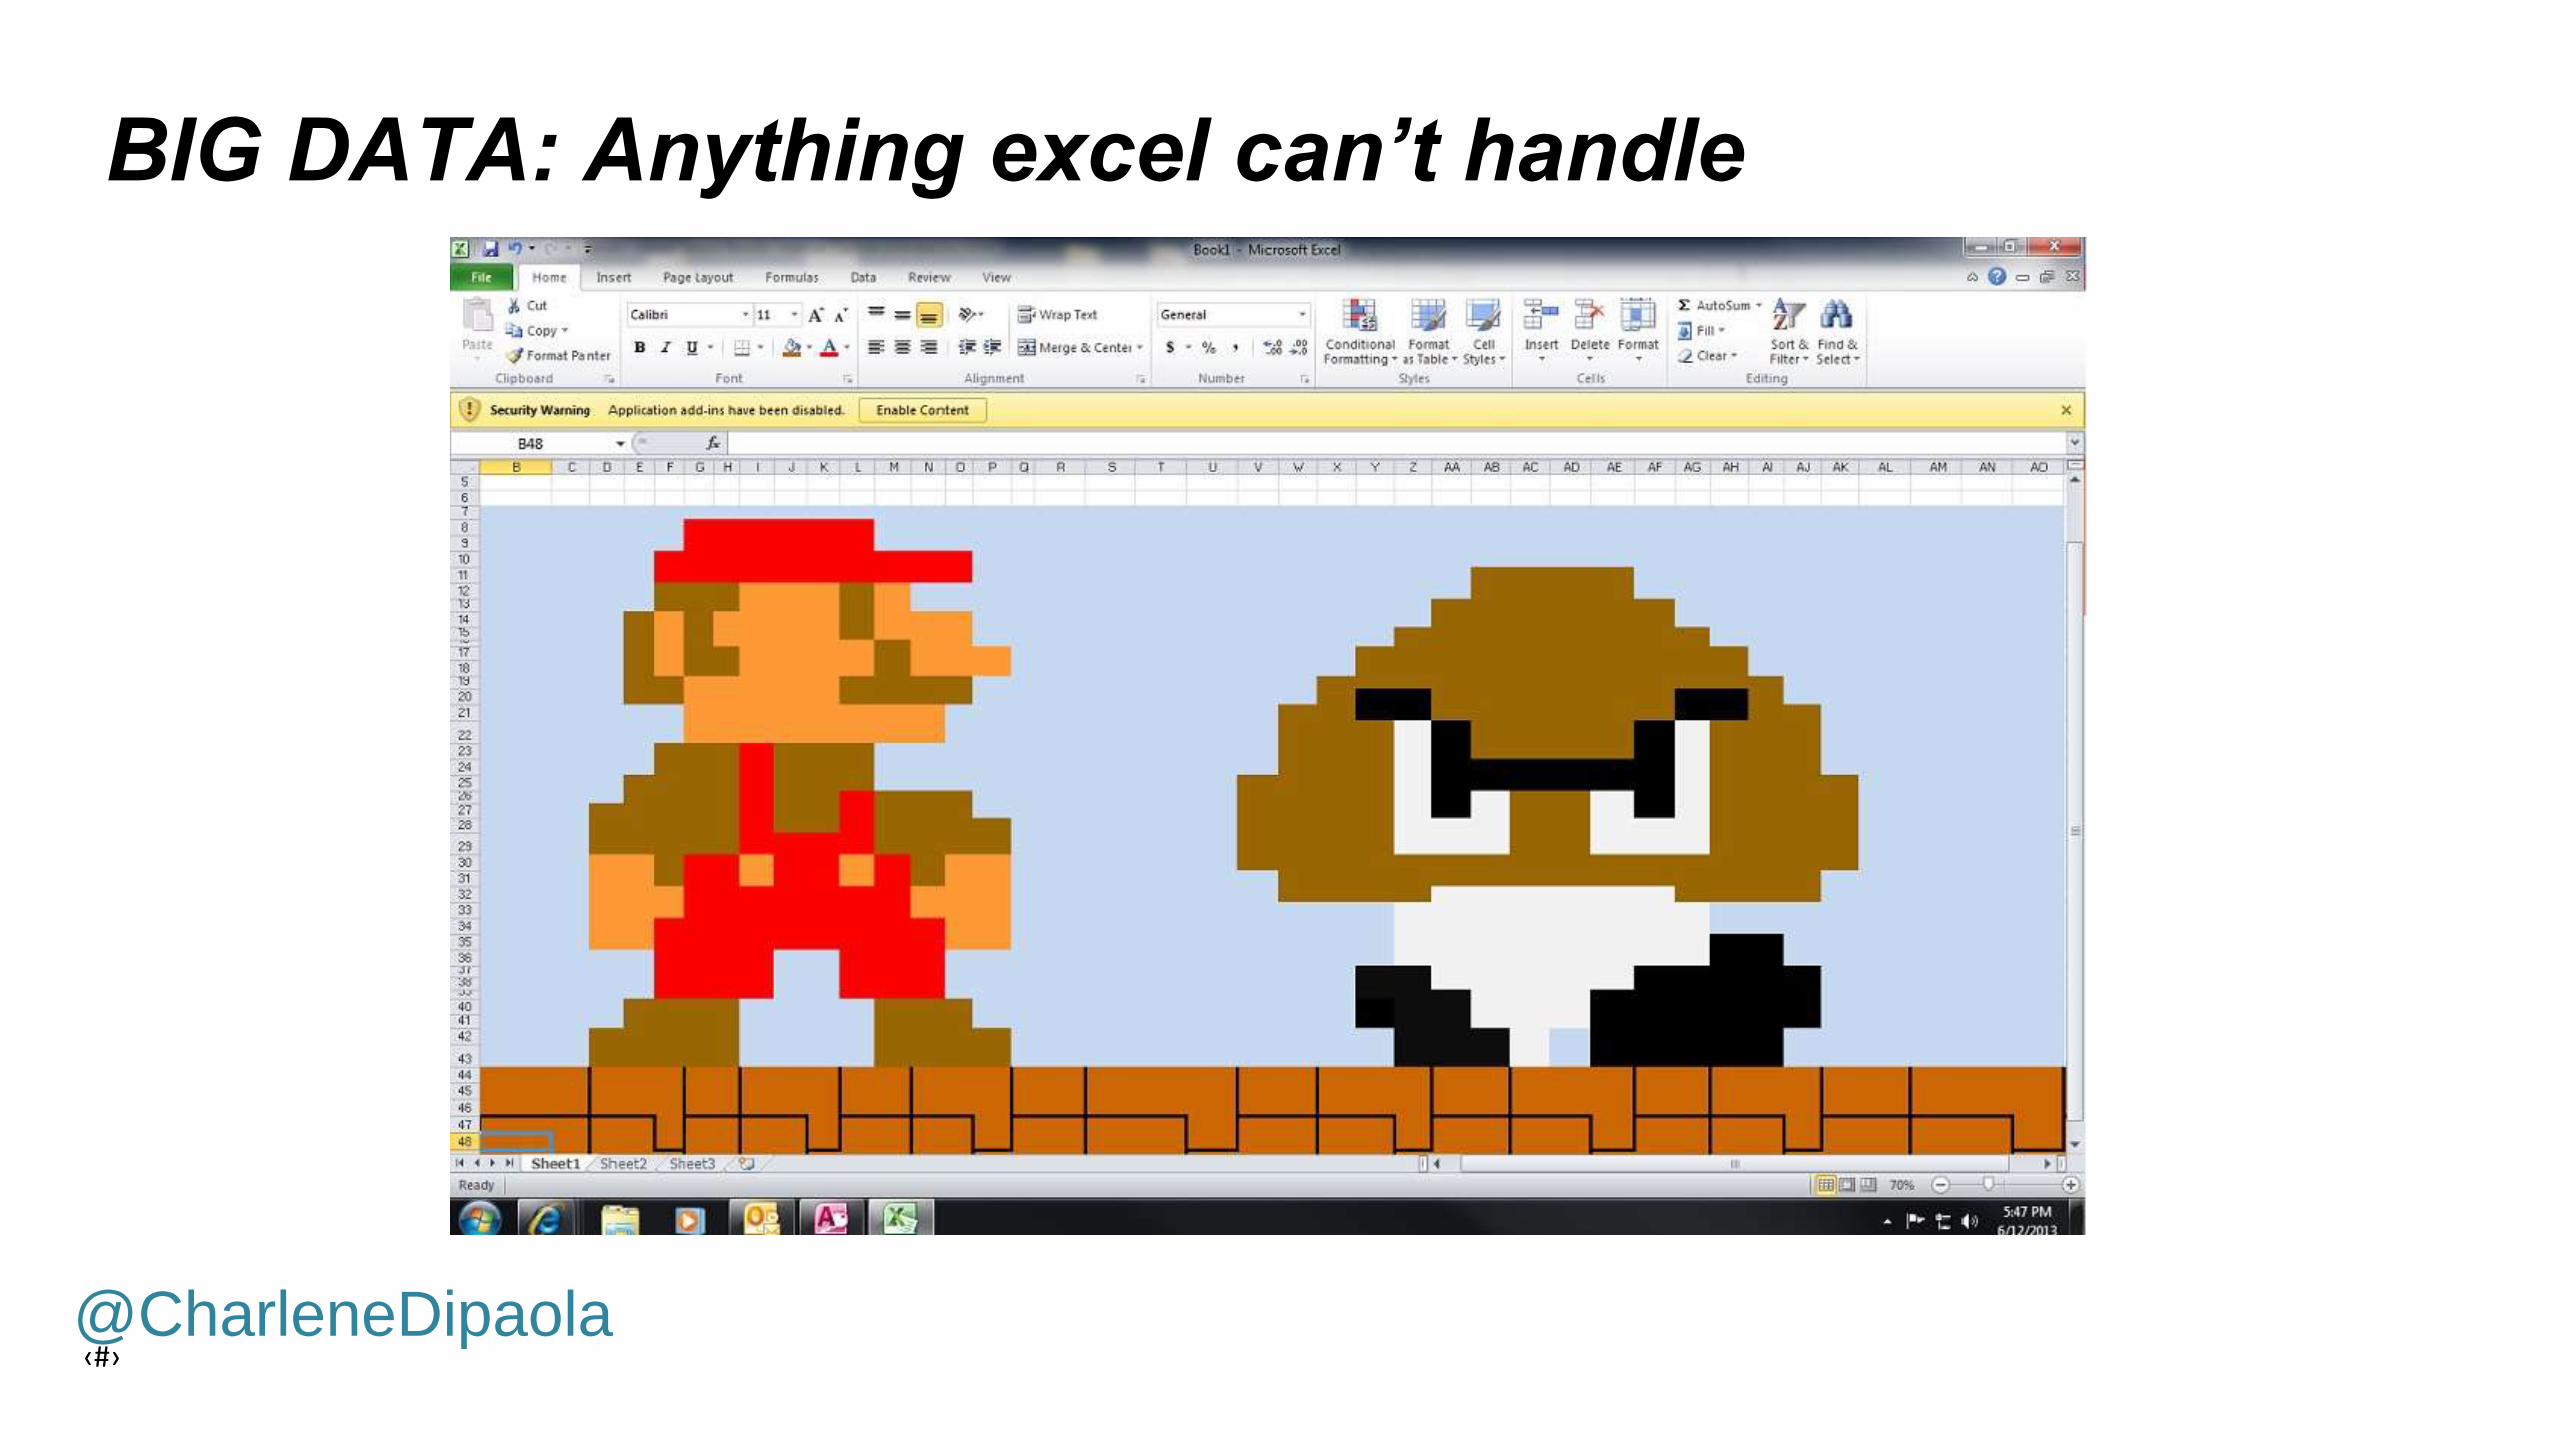
What is BIG DATA?
@CharleneDipaola
‹#›
BIG DATA: Anything excel can’t handle
@CharleneDipaola

‹#›
All the da
ta Data you need
@CharleneDipaola
‹#› PROBLEM DEFINITION > BIG DATA
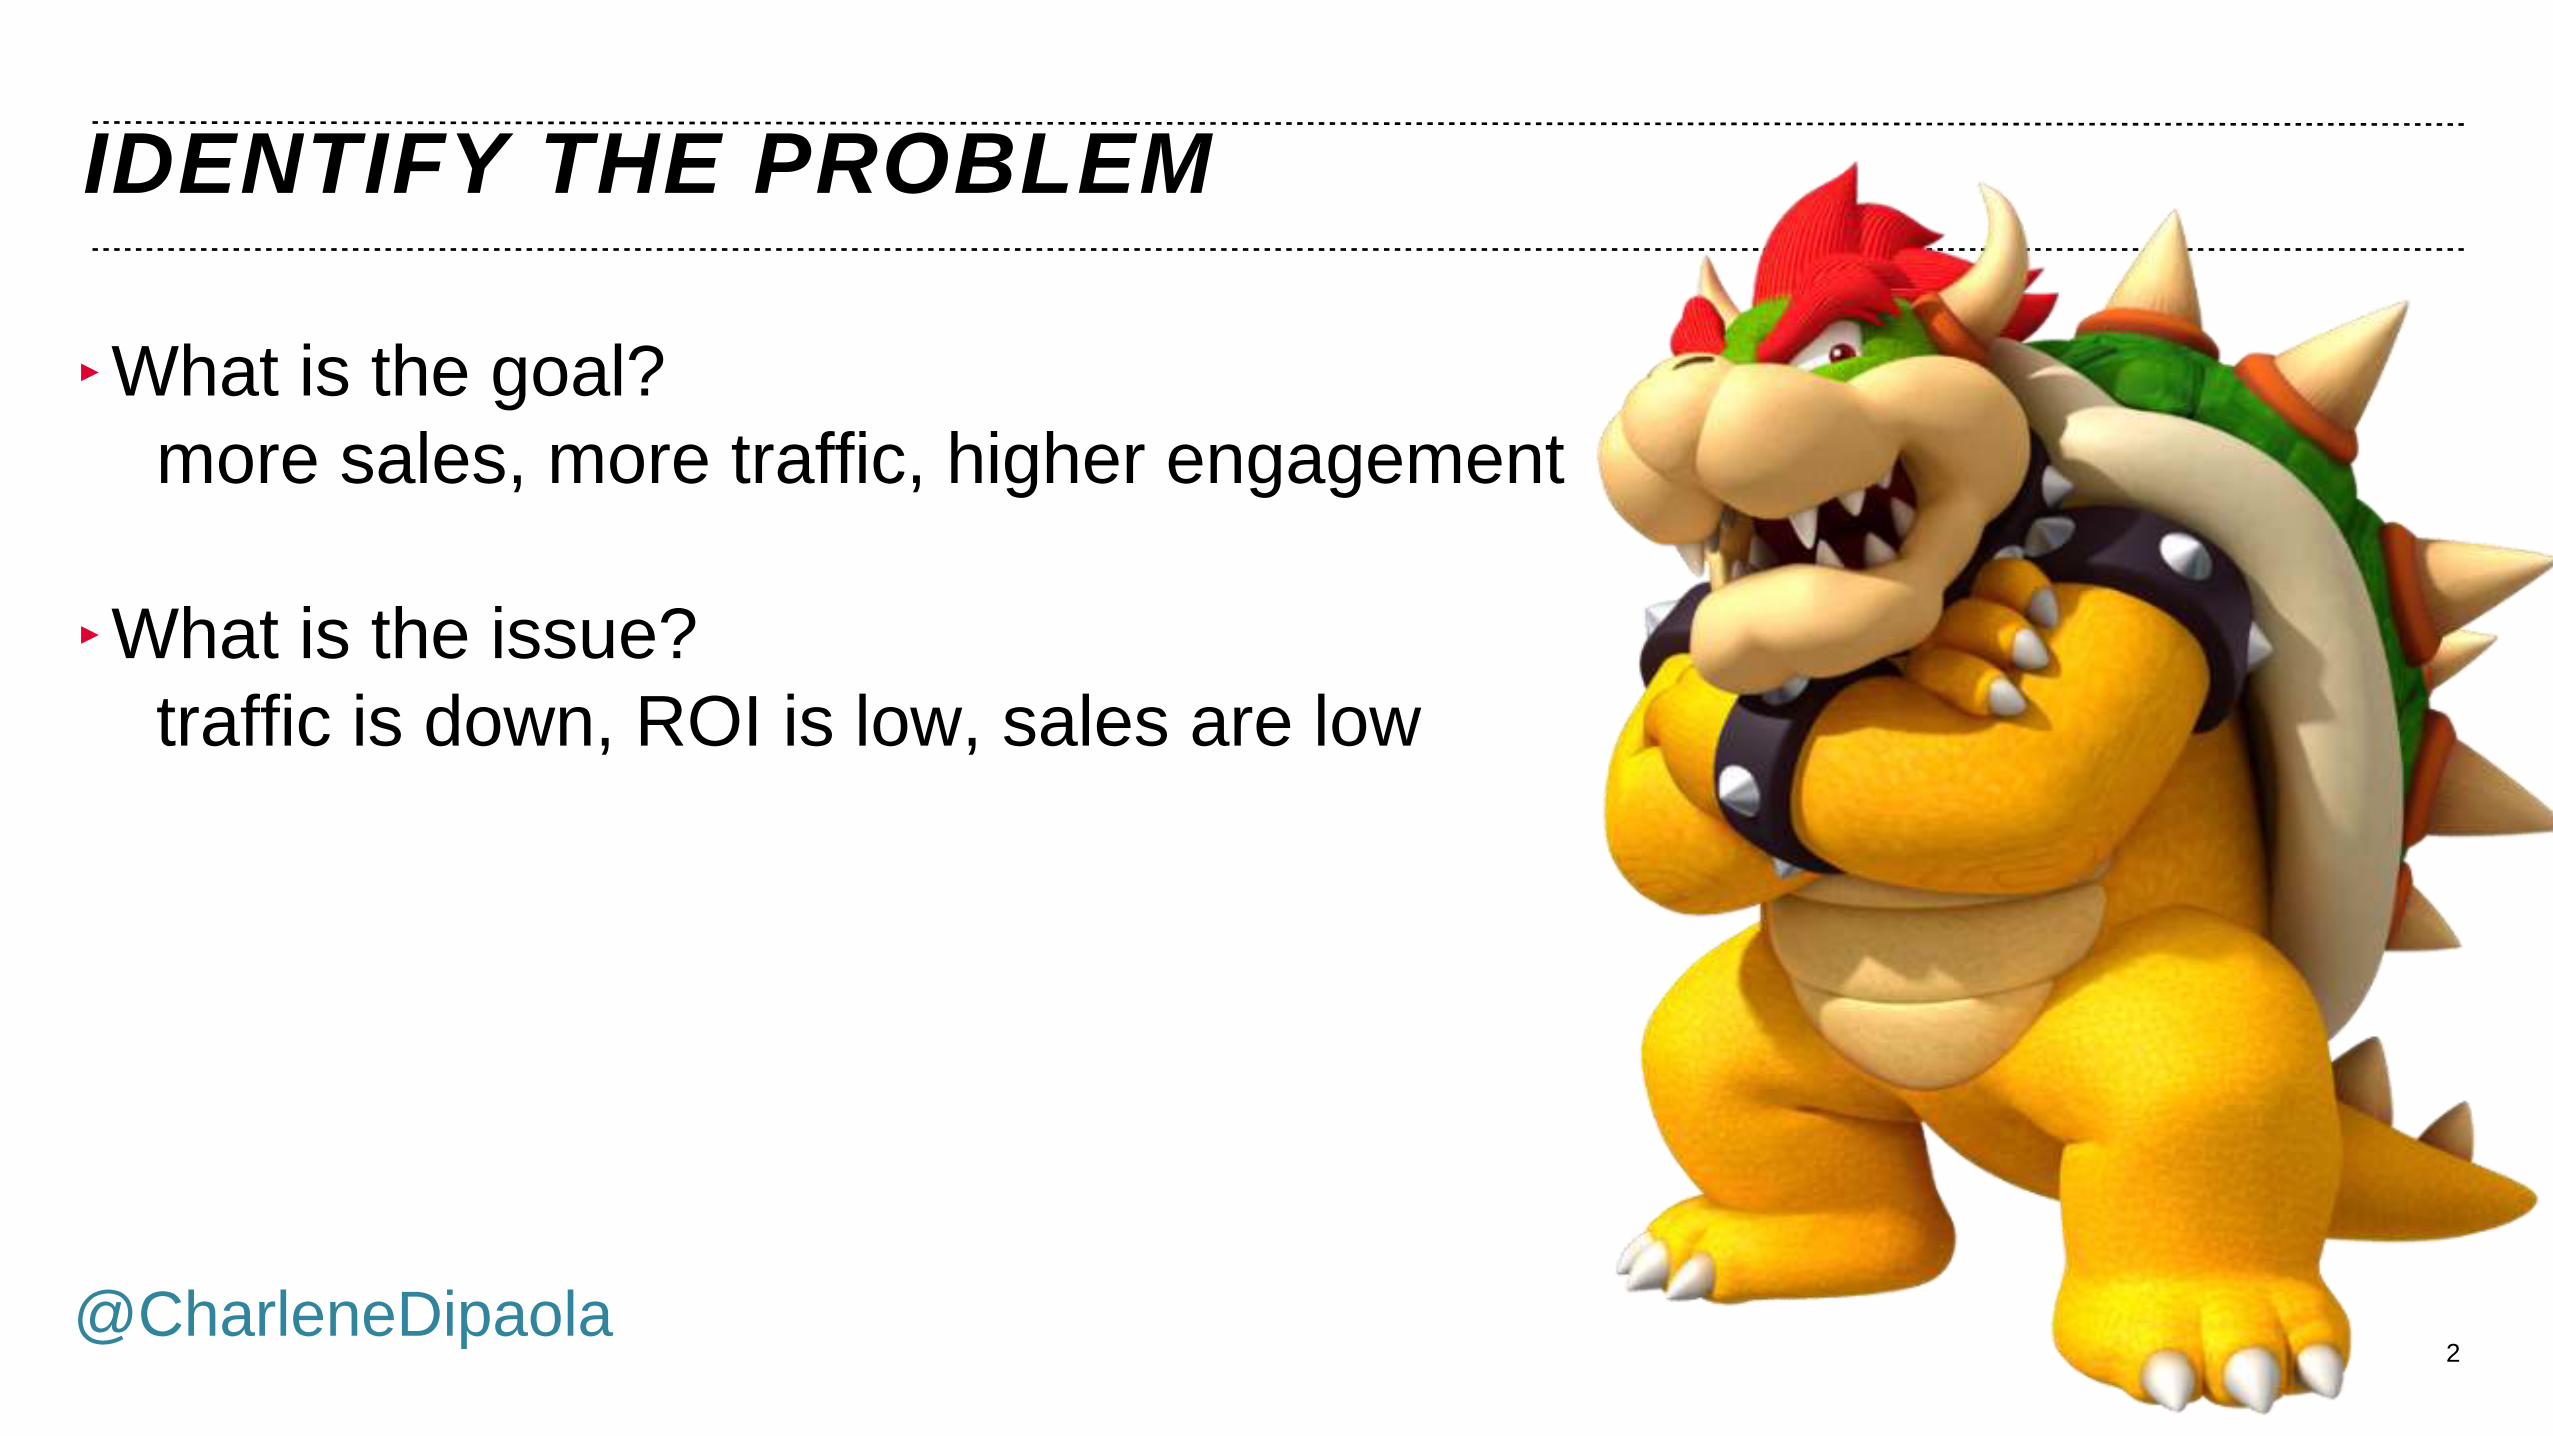
IDENTIFY THE PROBLEM
2
‣What is the goal?
more sales, more traffic, higher engagement
‣What is the issue?
traffic is down, ROI is low, sales are low
@CharleneDipaola

DEFINE KPI’s (Key Performance Indicators)
2
GOAL: MORE TRAFFIC
‣ Users (unique cookies)
‣ Sessions (30 minute increments)
‣ Pageviews
‣ What are the sources of traffic?
(Google, Facebook, Email)
‣ What devices are used?
(desktop, mobile, tablet)
@CharleneDipaola
‹#›
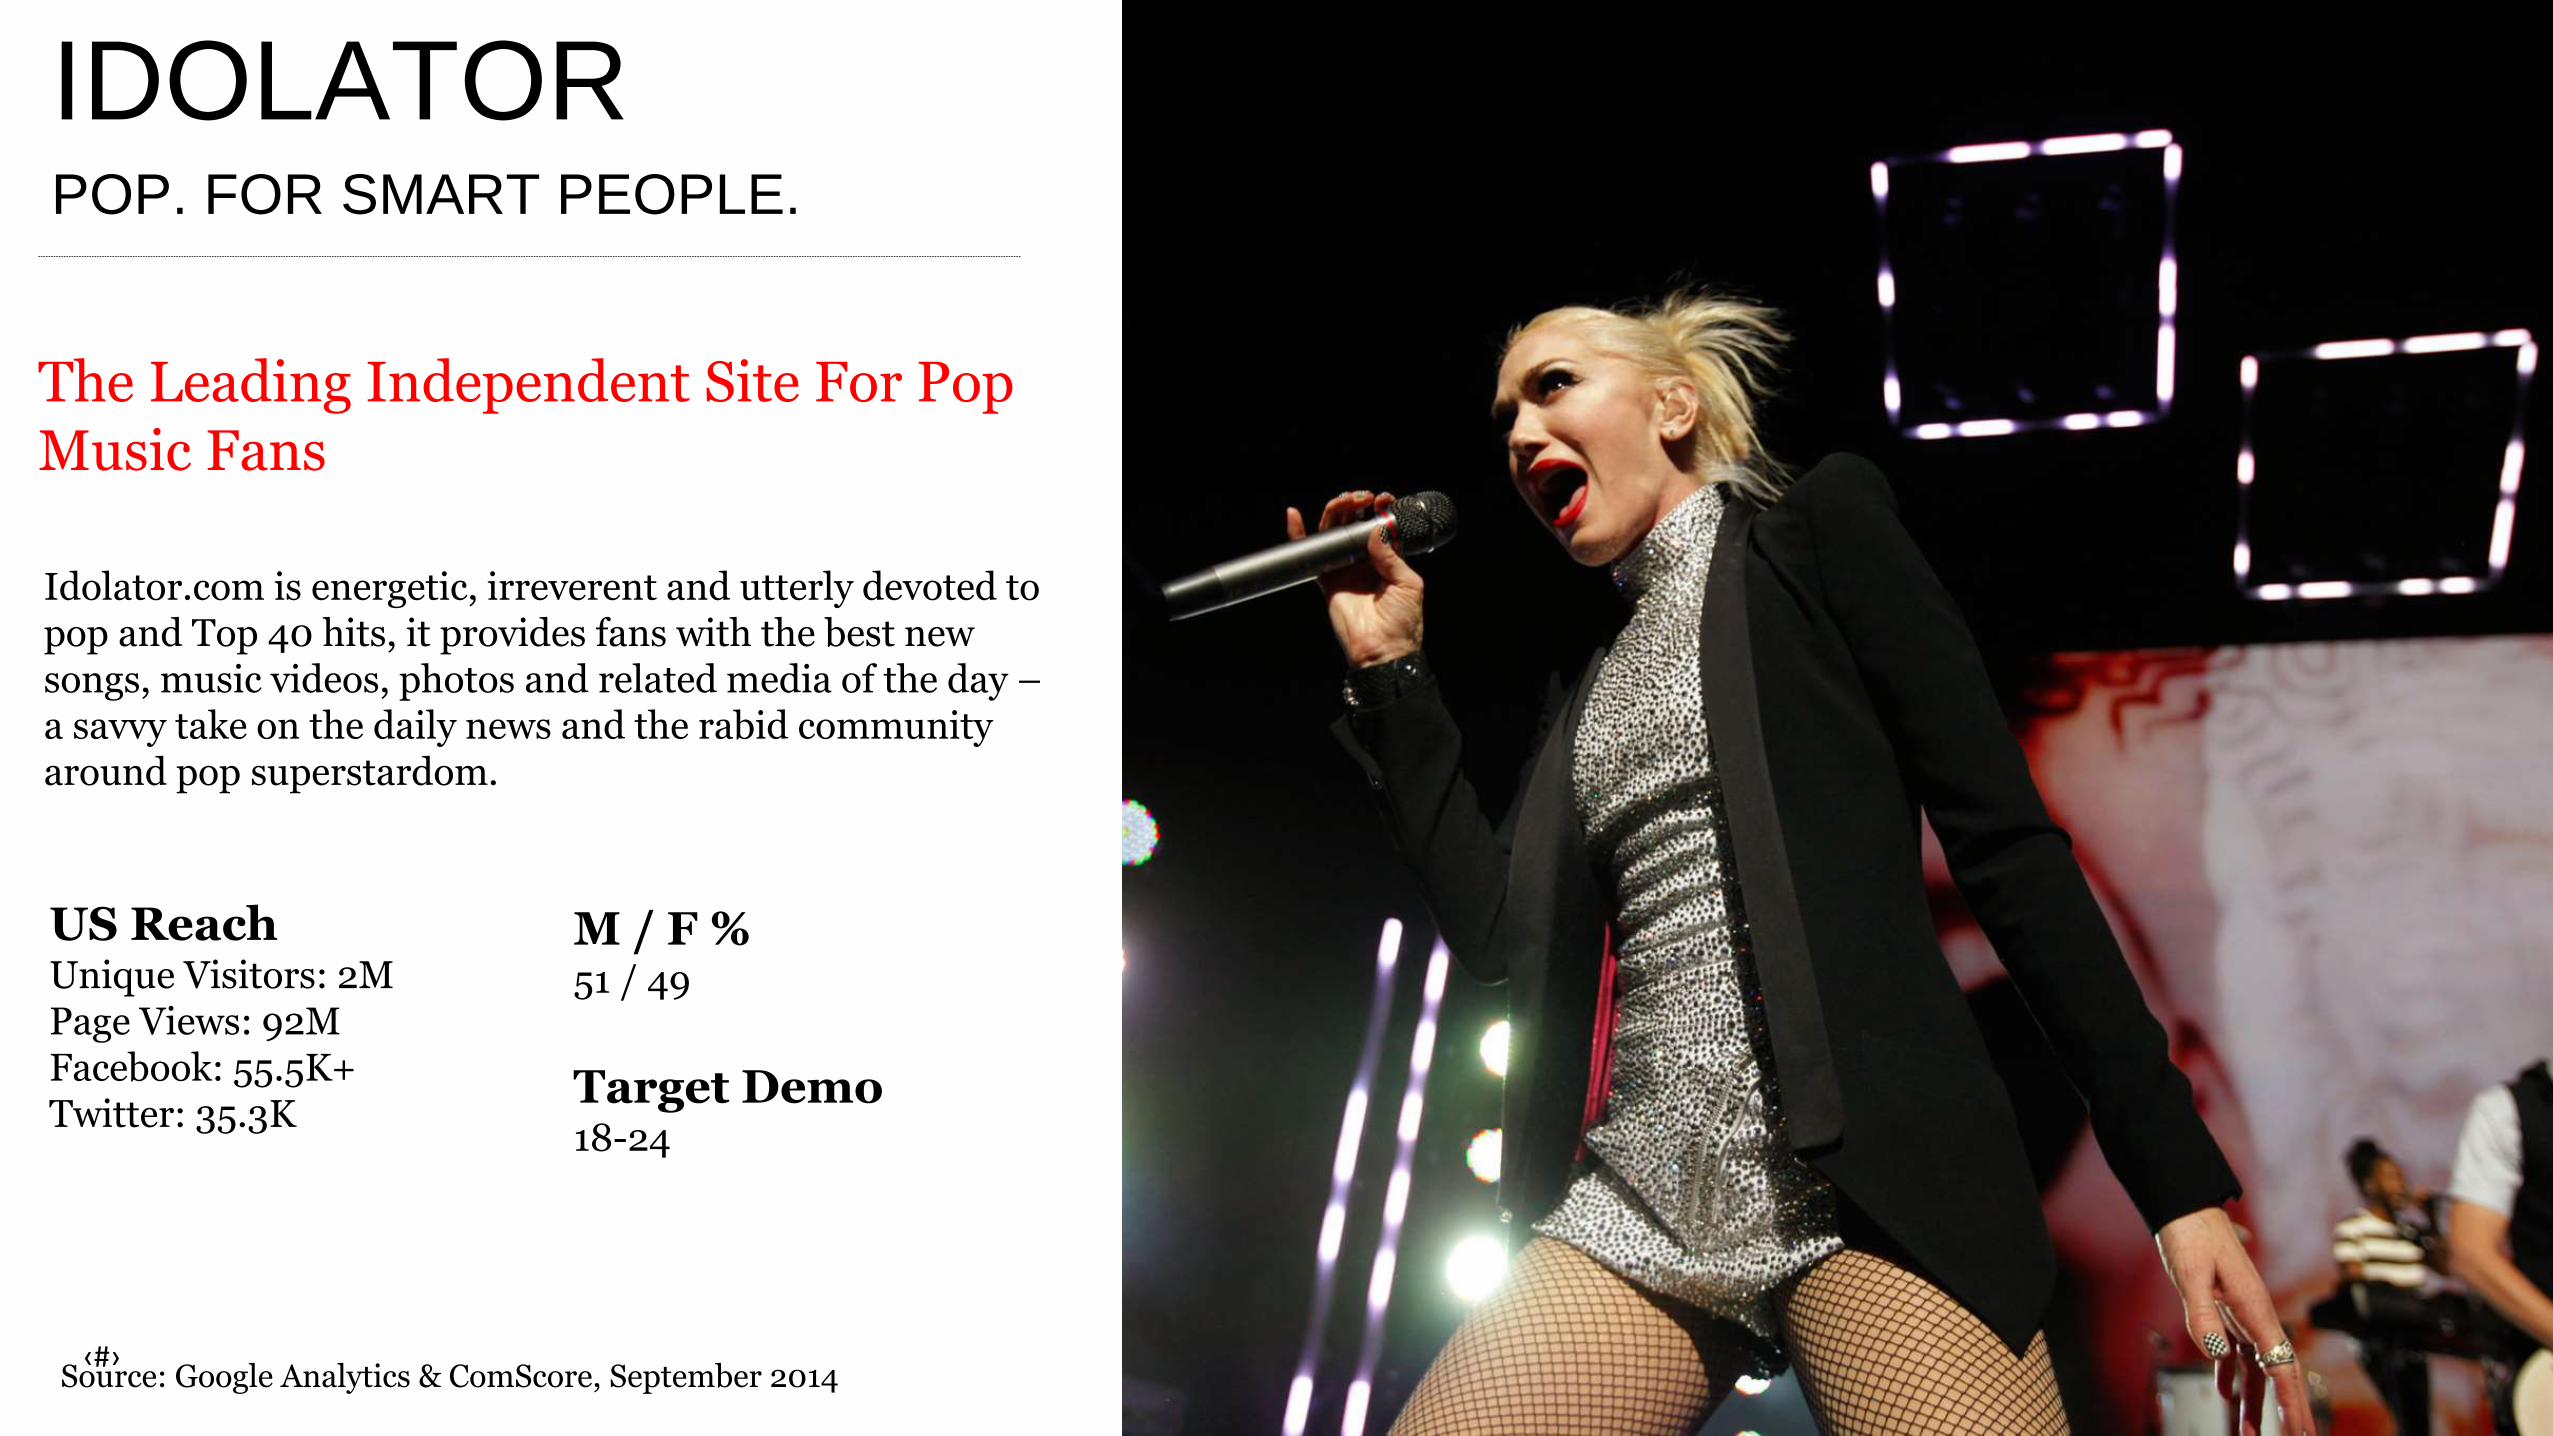
The Leading Independent Site For Pop Music Fans
IDOLATORPOP. FOR SMART PEOPLE.
Idolator.com is energetic, irreverent and utterly devoted to pop and Top 40 hits, it provides fans with the best new songs, music videos, photos and related media of the day –a savvy take on the daily news and the rabid community around pop superstardom.
US ReachUnique Visitors: 2MPage Views: 92MFacebook: 55.5K+Twitter: 35.3K
Source: Google Analytics & ComScore, September 2014
M / F % 51 / 49
Target Demo18-24

PROBLEM
NO TRAFFIC GROWTH FROM FACEBOOK PAGE
‣ Traffic = Sessions
Sessions: 30 minutes of
activity
‣ Traffic from Facebook Page
UTM (Urchin Traffic Monitor)
Segregate Traffic From
Facebook Page ONLY
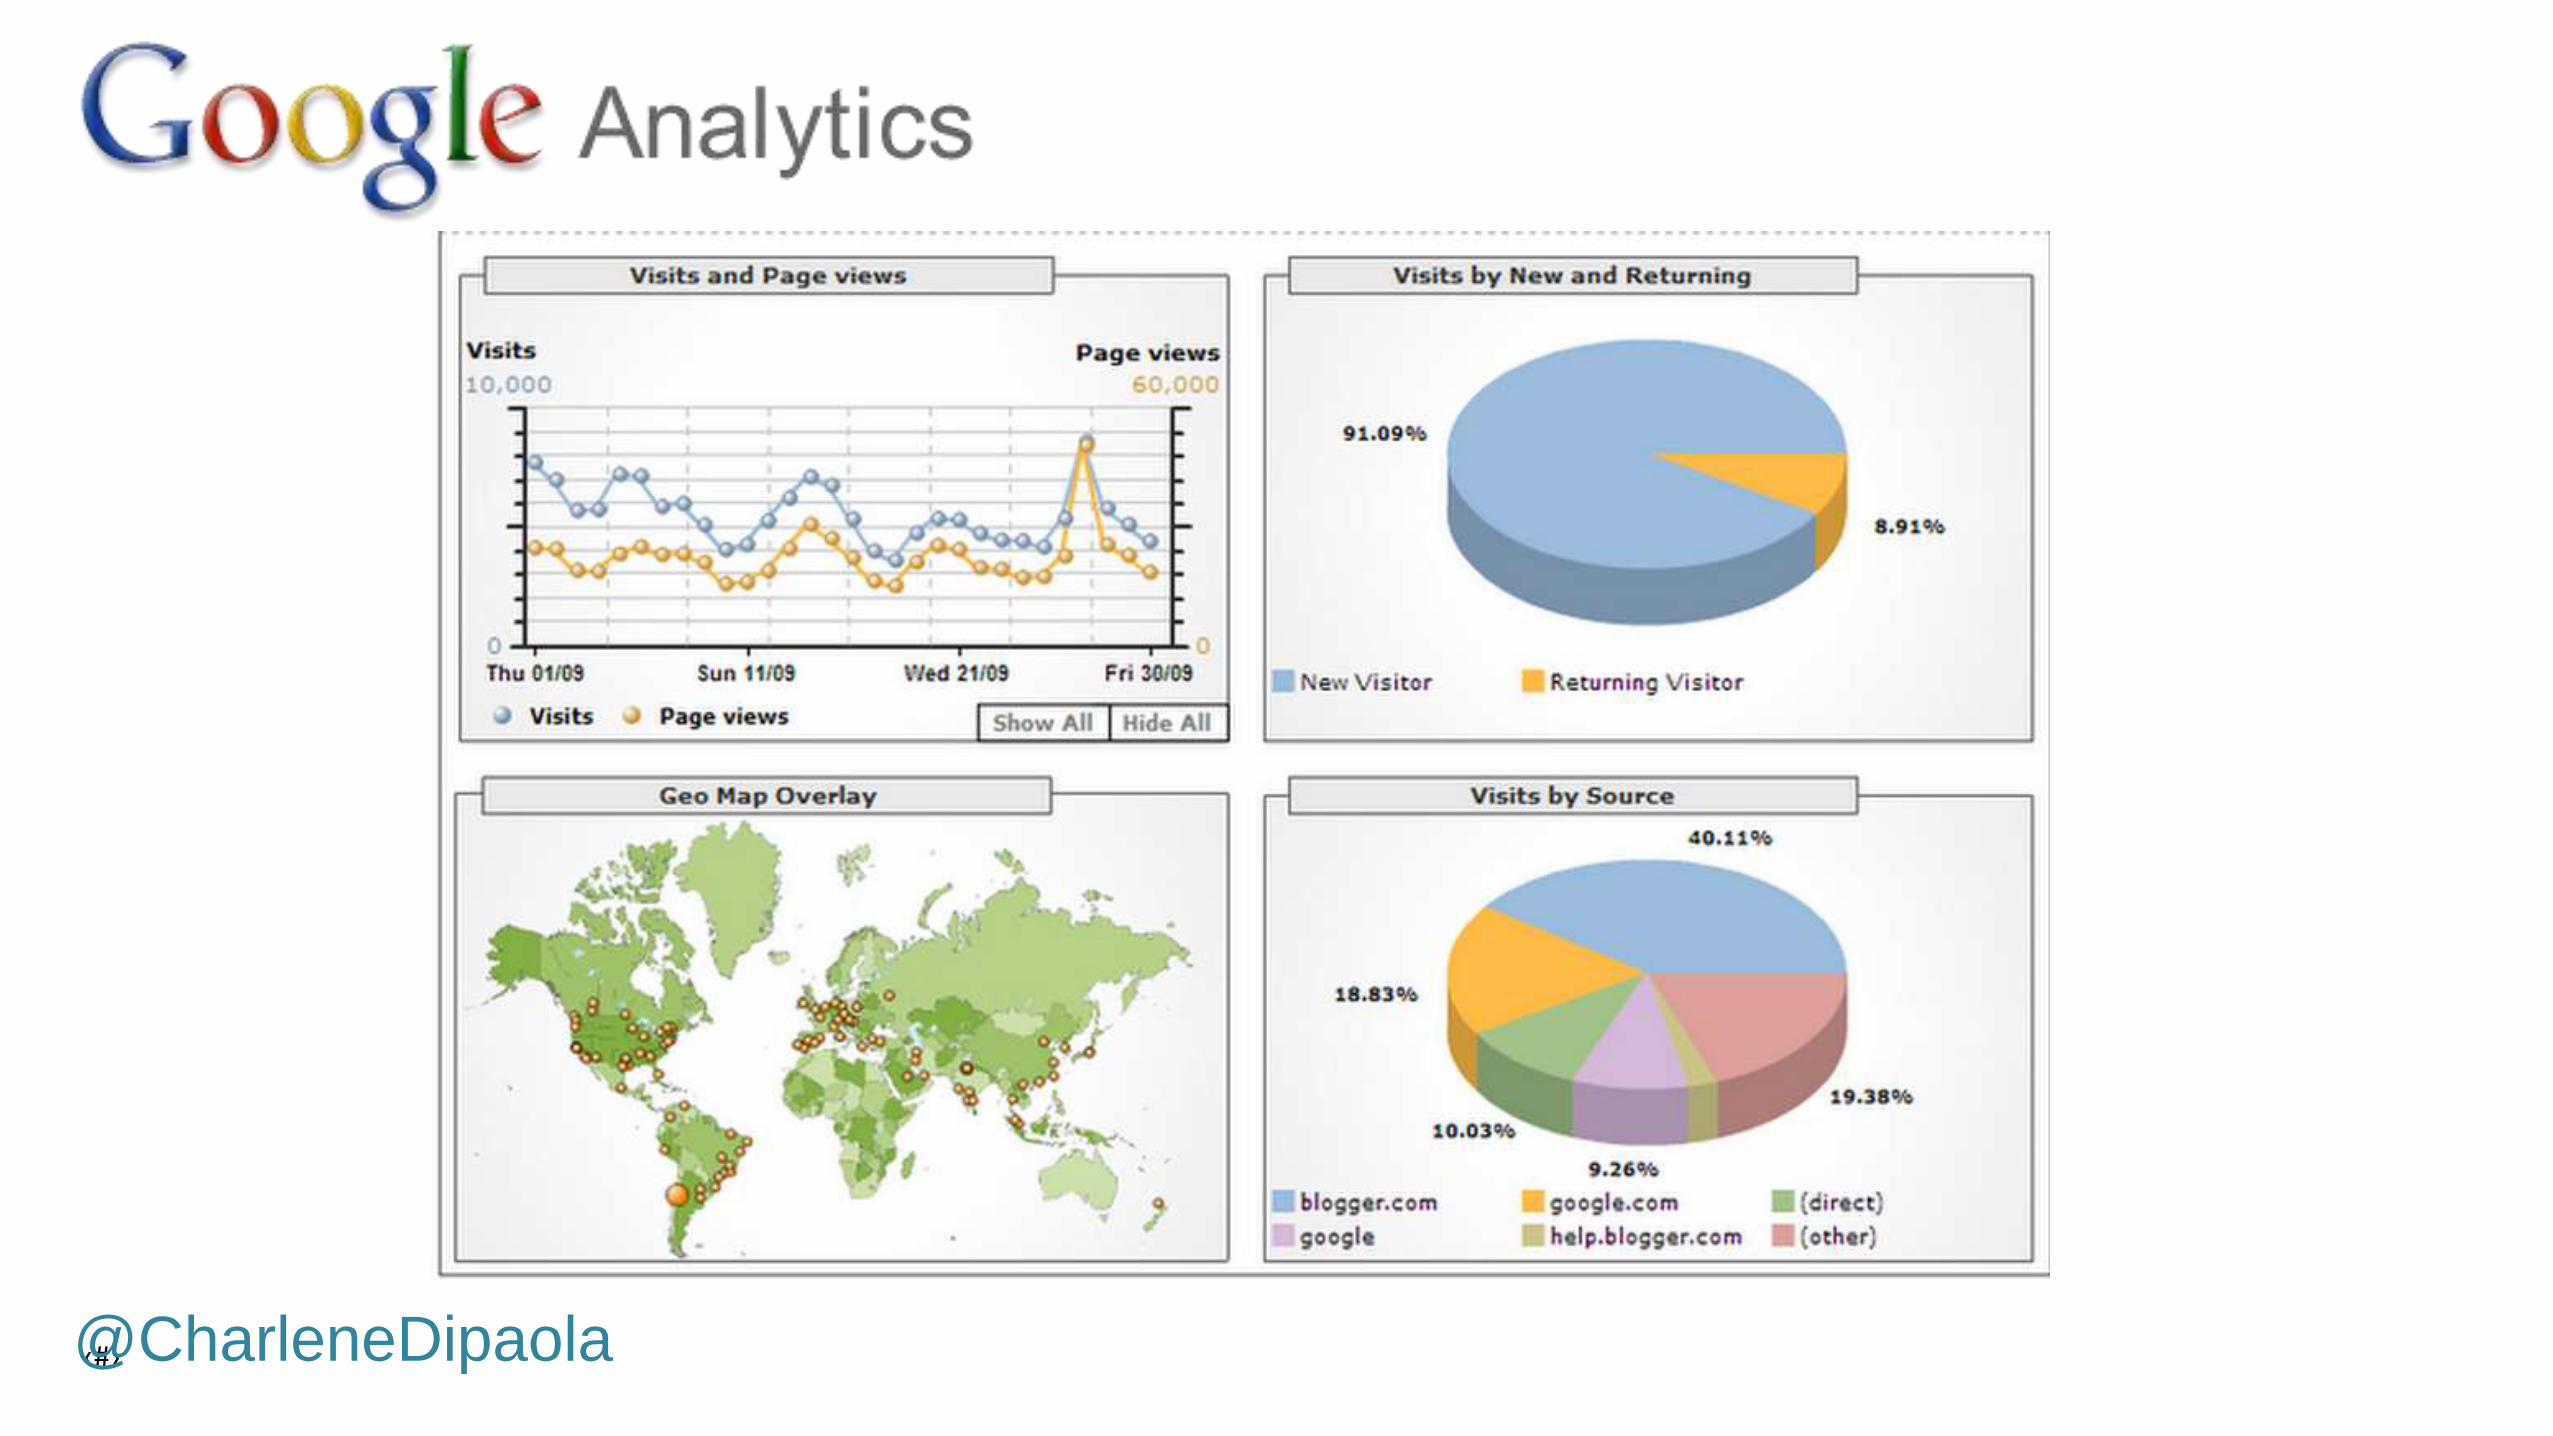
‣ Data Sources
Google Analytics
Facebook Insights0
2,000
4,000
6,000
8,000
10,000
12,000
14,000
week 1 week 2 week 3 week 4 week 5 week 6 week 7
Weekly Sessions Coming From Facebook Page
@CharleneDipaola
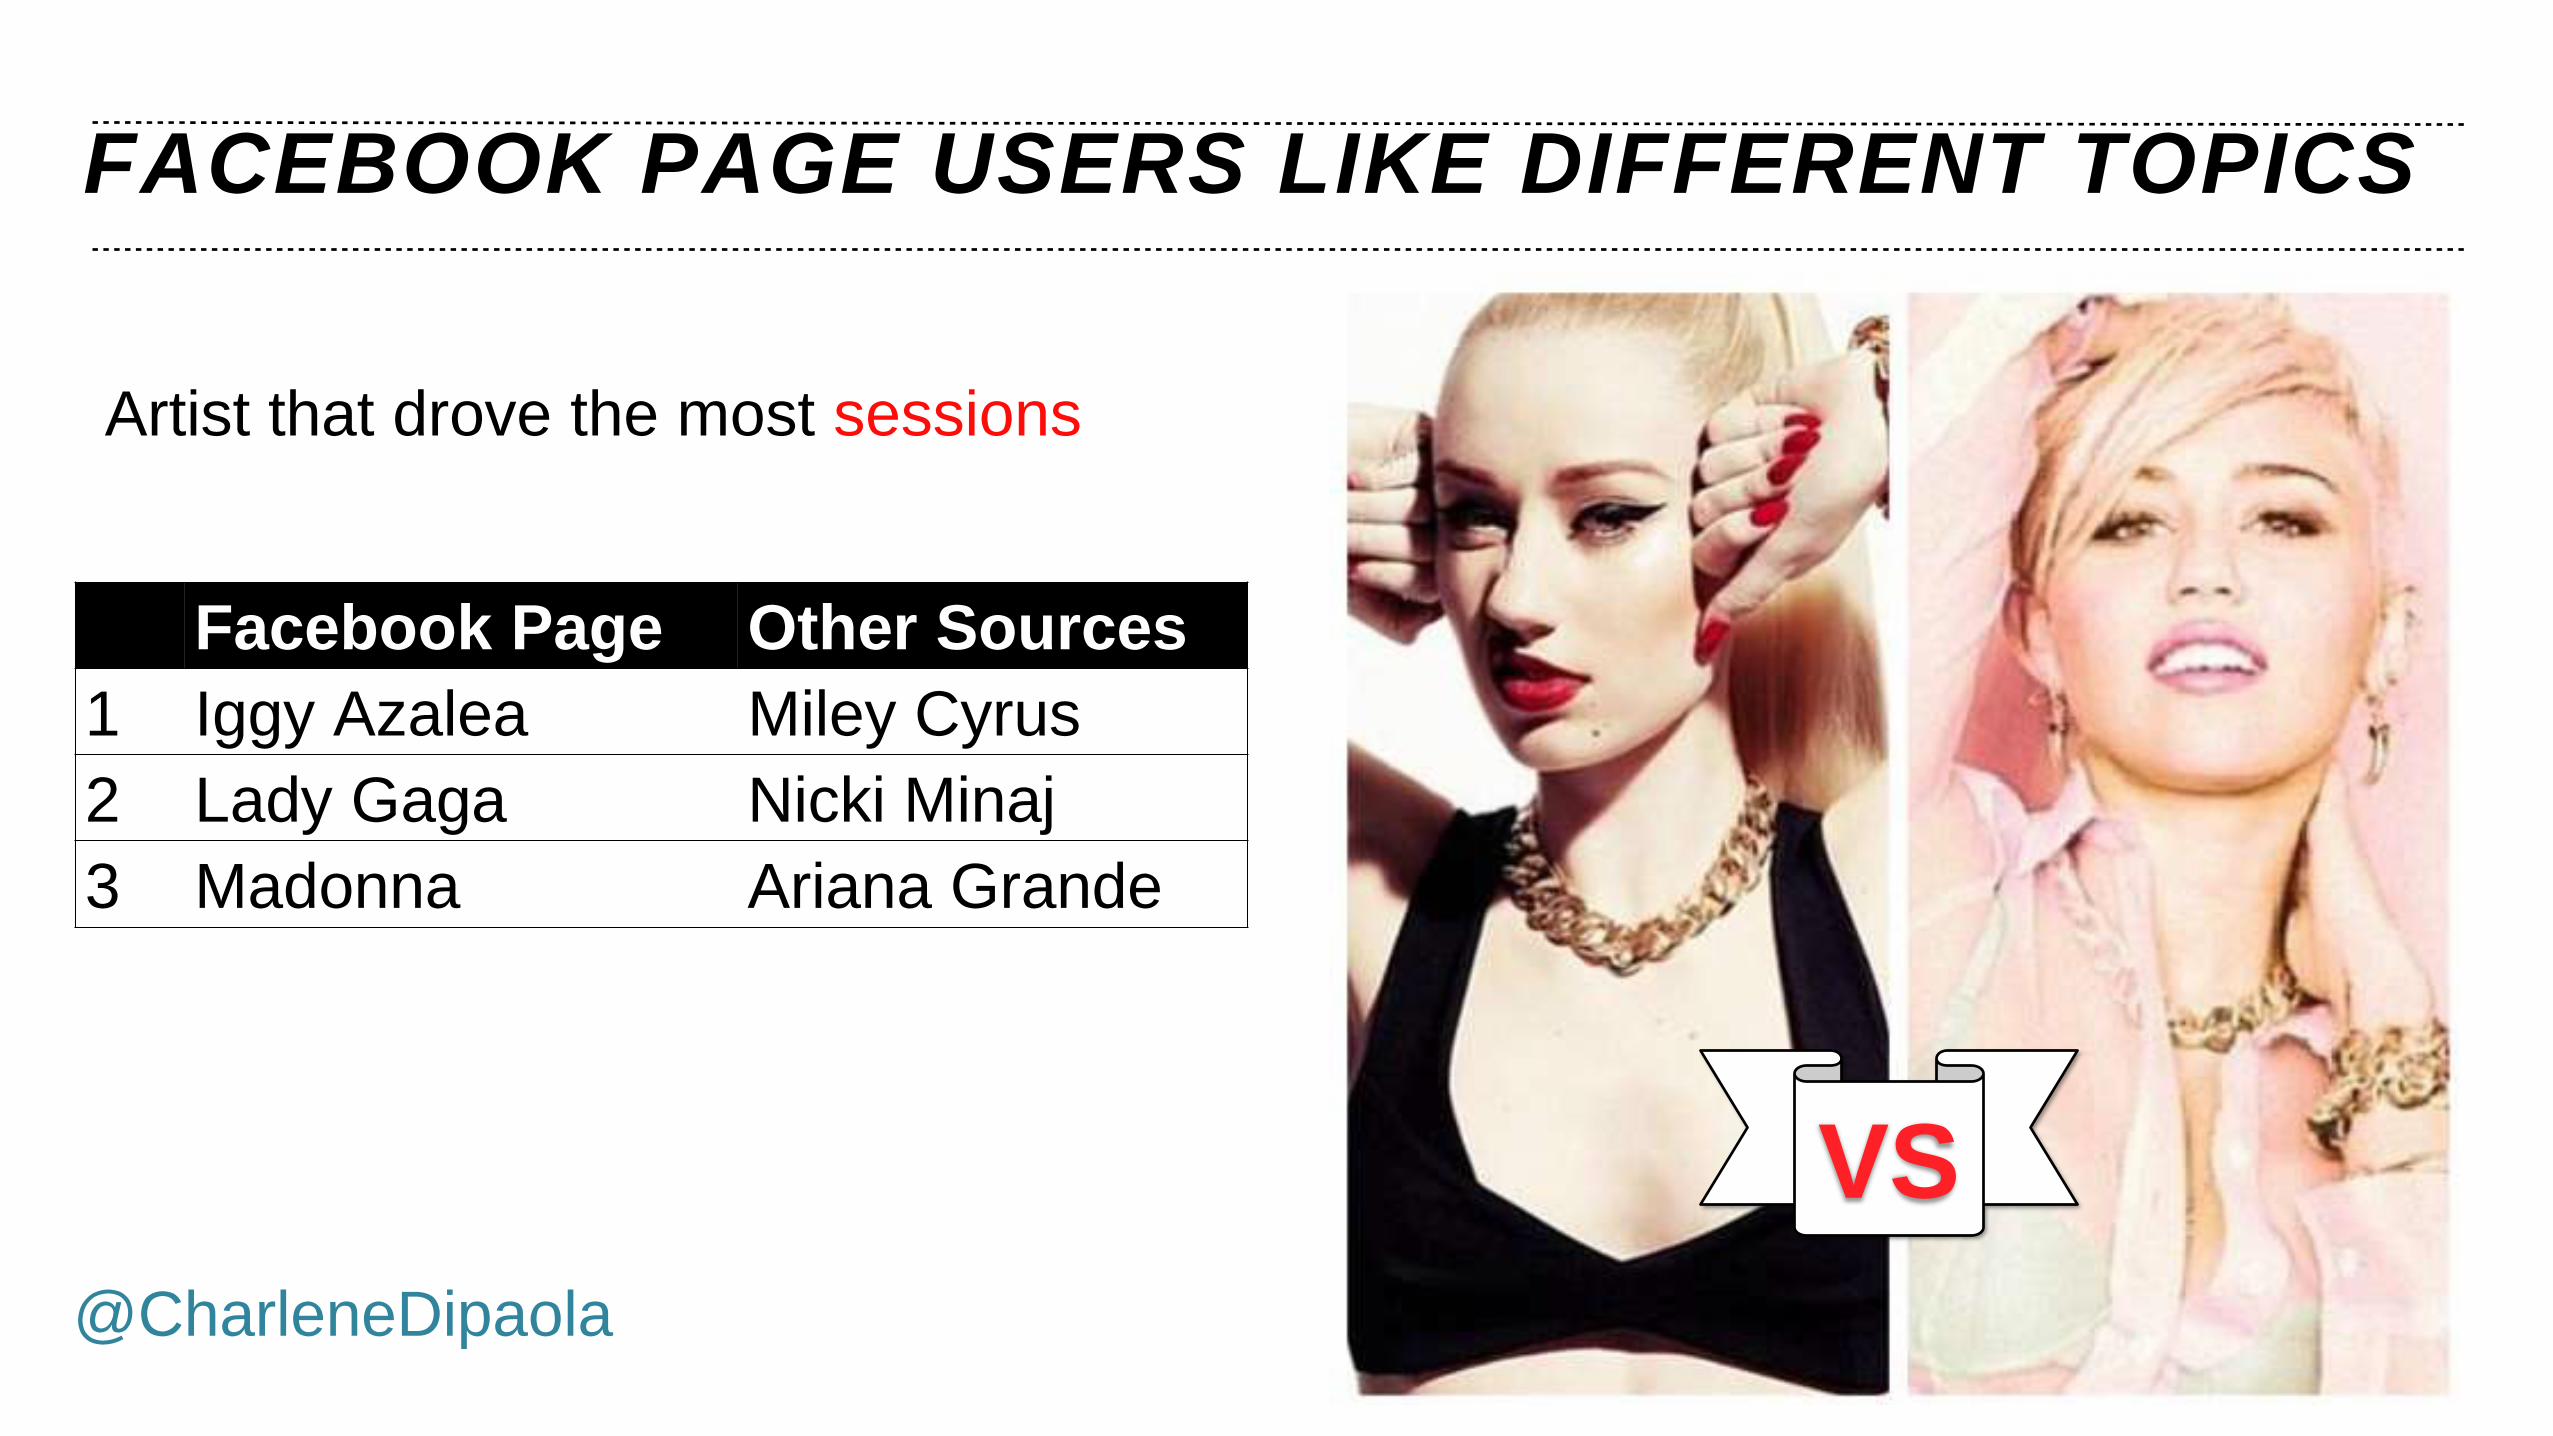
FACEBOOK PAGE USERS LIKE DIFFERENT TOPICS
2
VS
Facebook Page Other Sources
1 Iggy Azalea Miley Cyrus
2 Lady Gaga Nicki Minaj
3 Madonna Ariana Grande
Artist that drove the most sessions
@CharleneDipaola
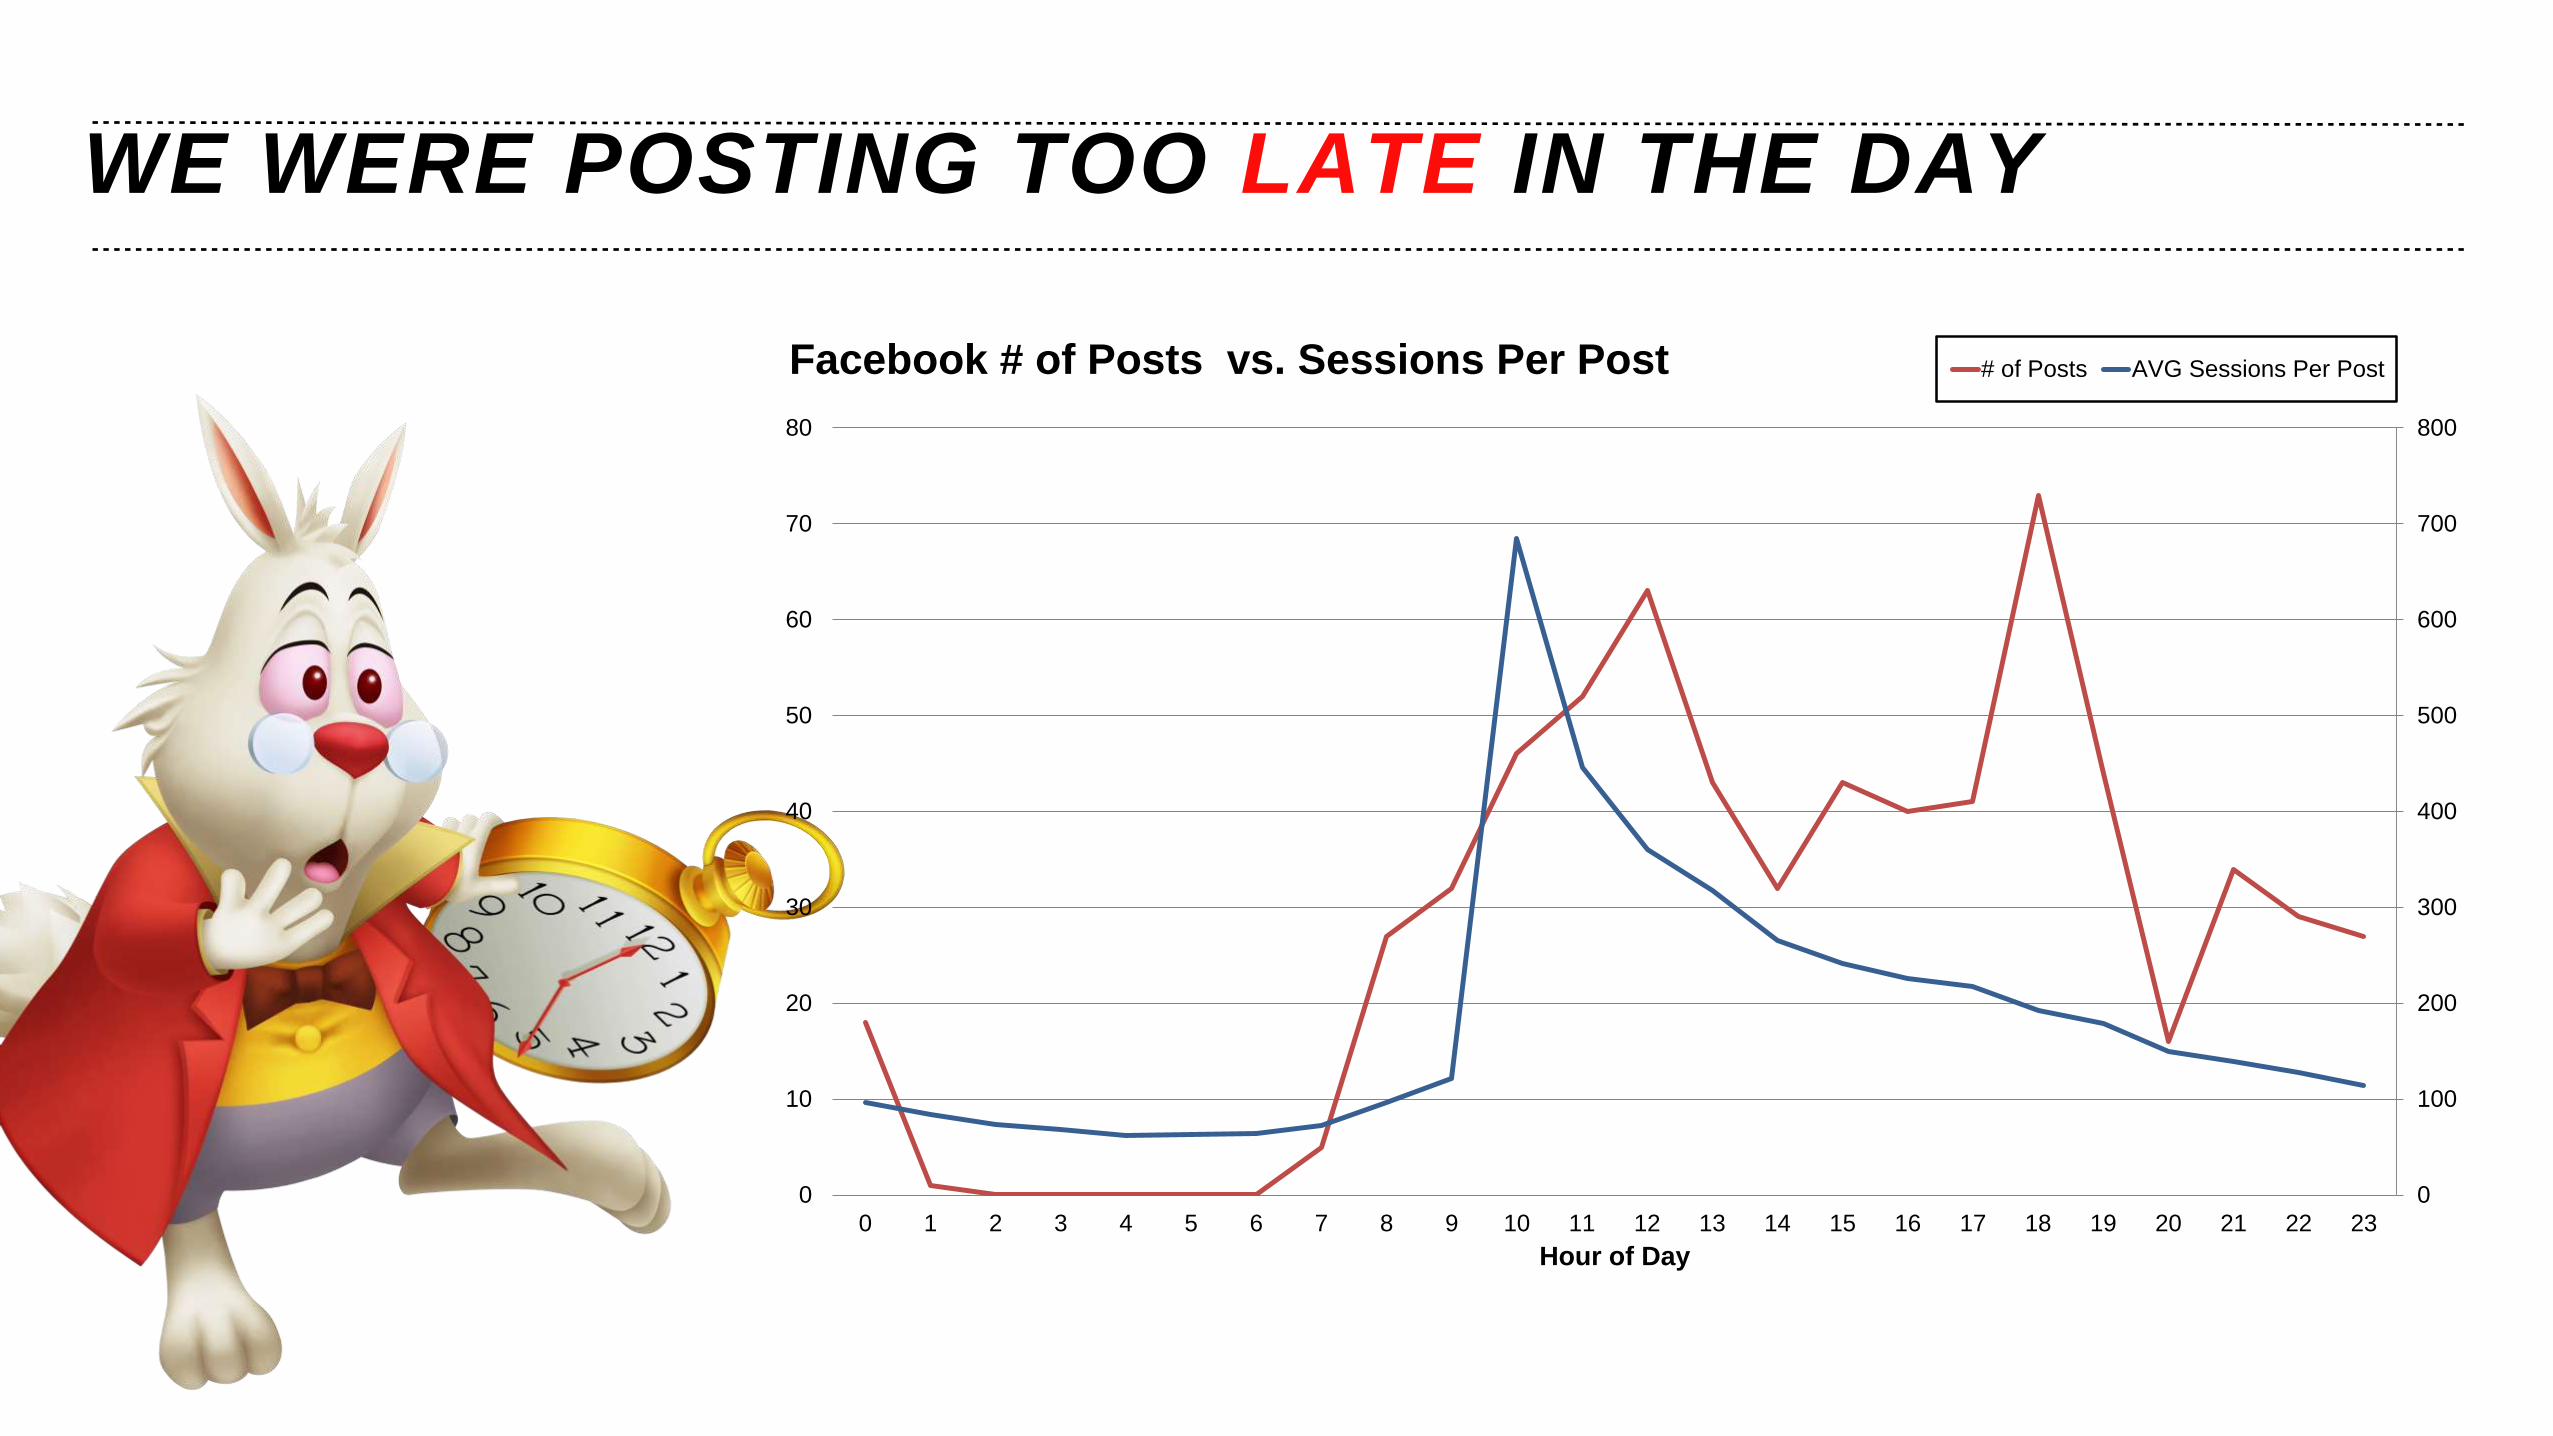
WE WERE POSTING TOO LATE IN THE DAY
0
100
200
300
400
500
600
700
800
0
10
20
30
40
50
60
70
80
0 1 2 3 4 5 6 7 8 9 10 11 12 13 14 15 16 17 18 19 20 21 22 23
Hour of Day
Facebook # of Posts vs. Sessions Per Post # of Posts AVG Sessions Per Post
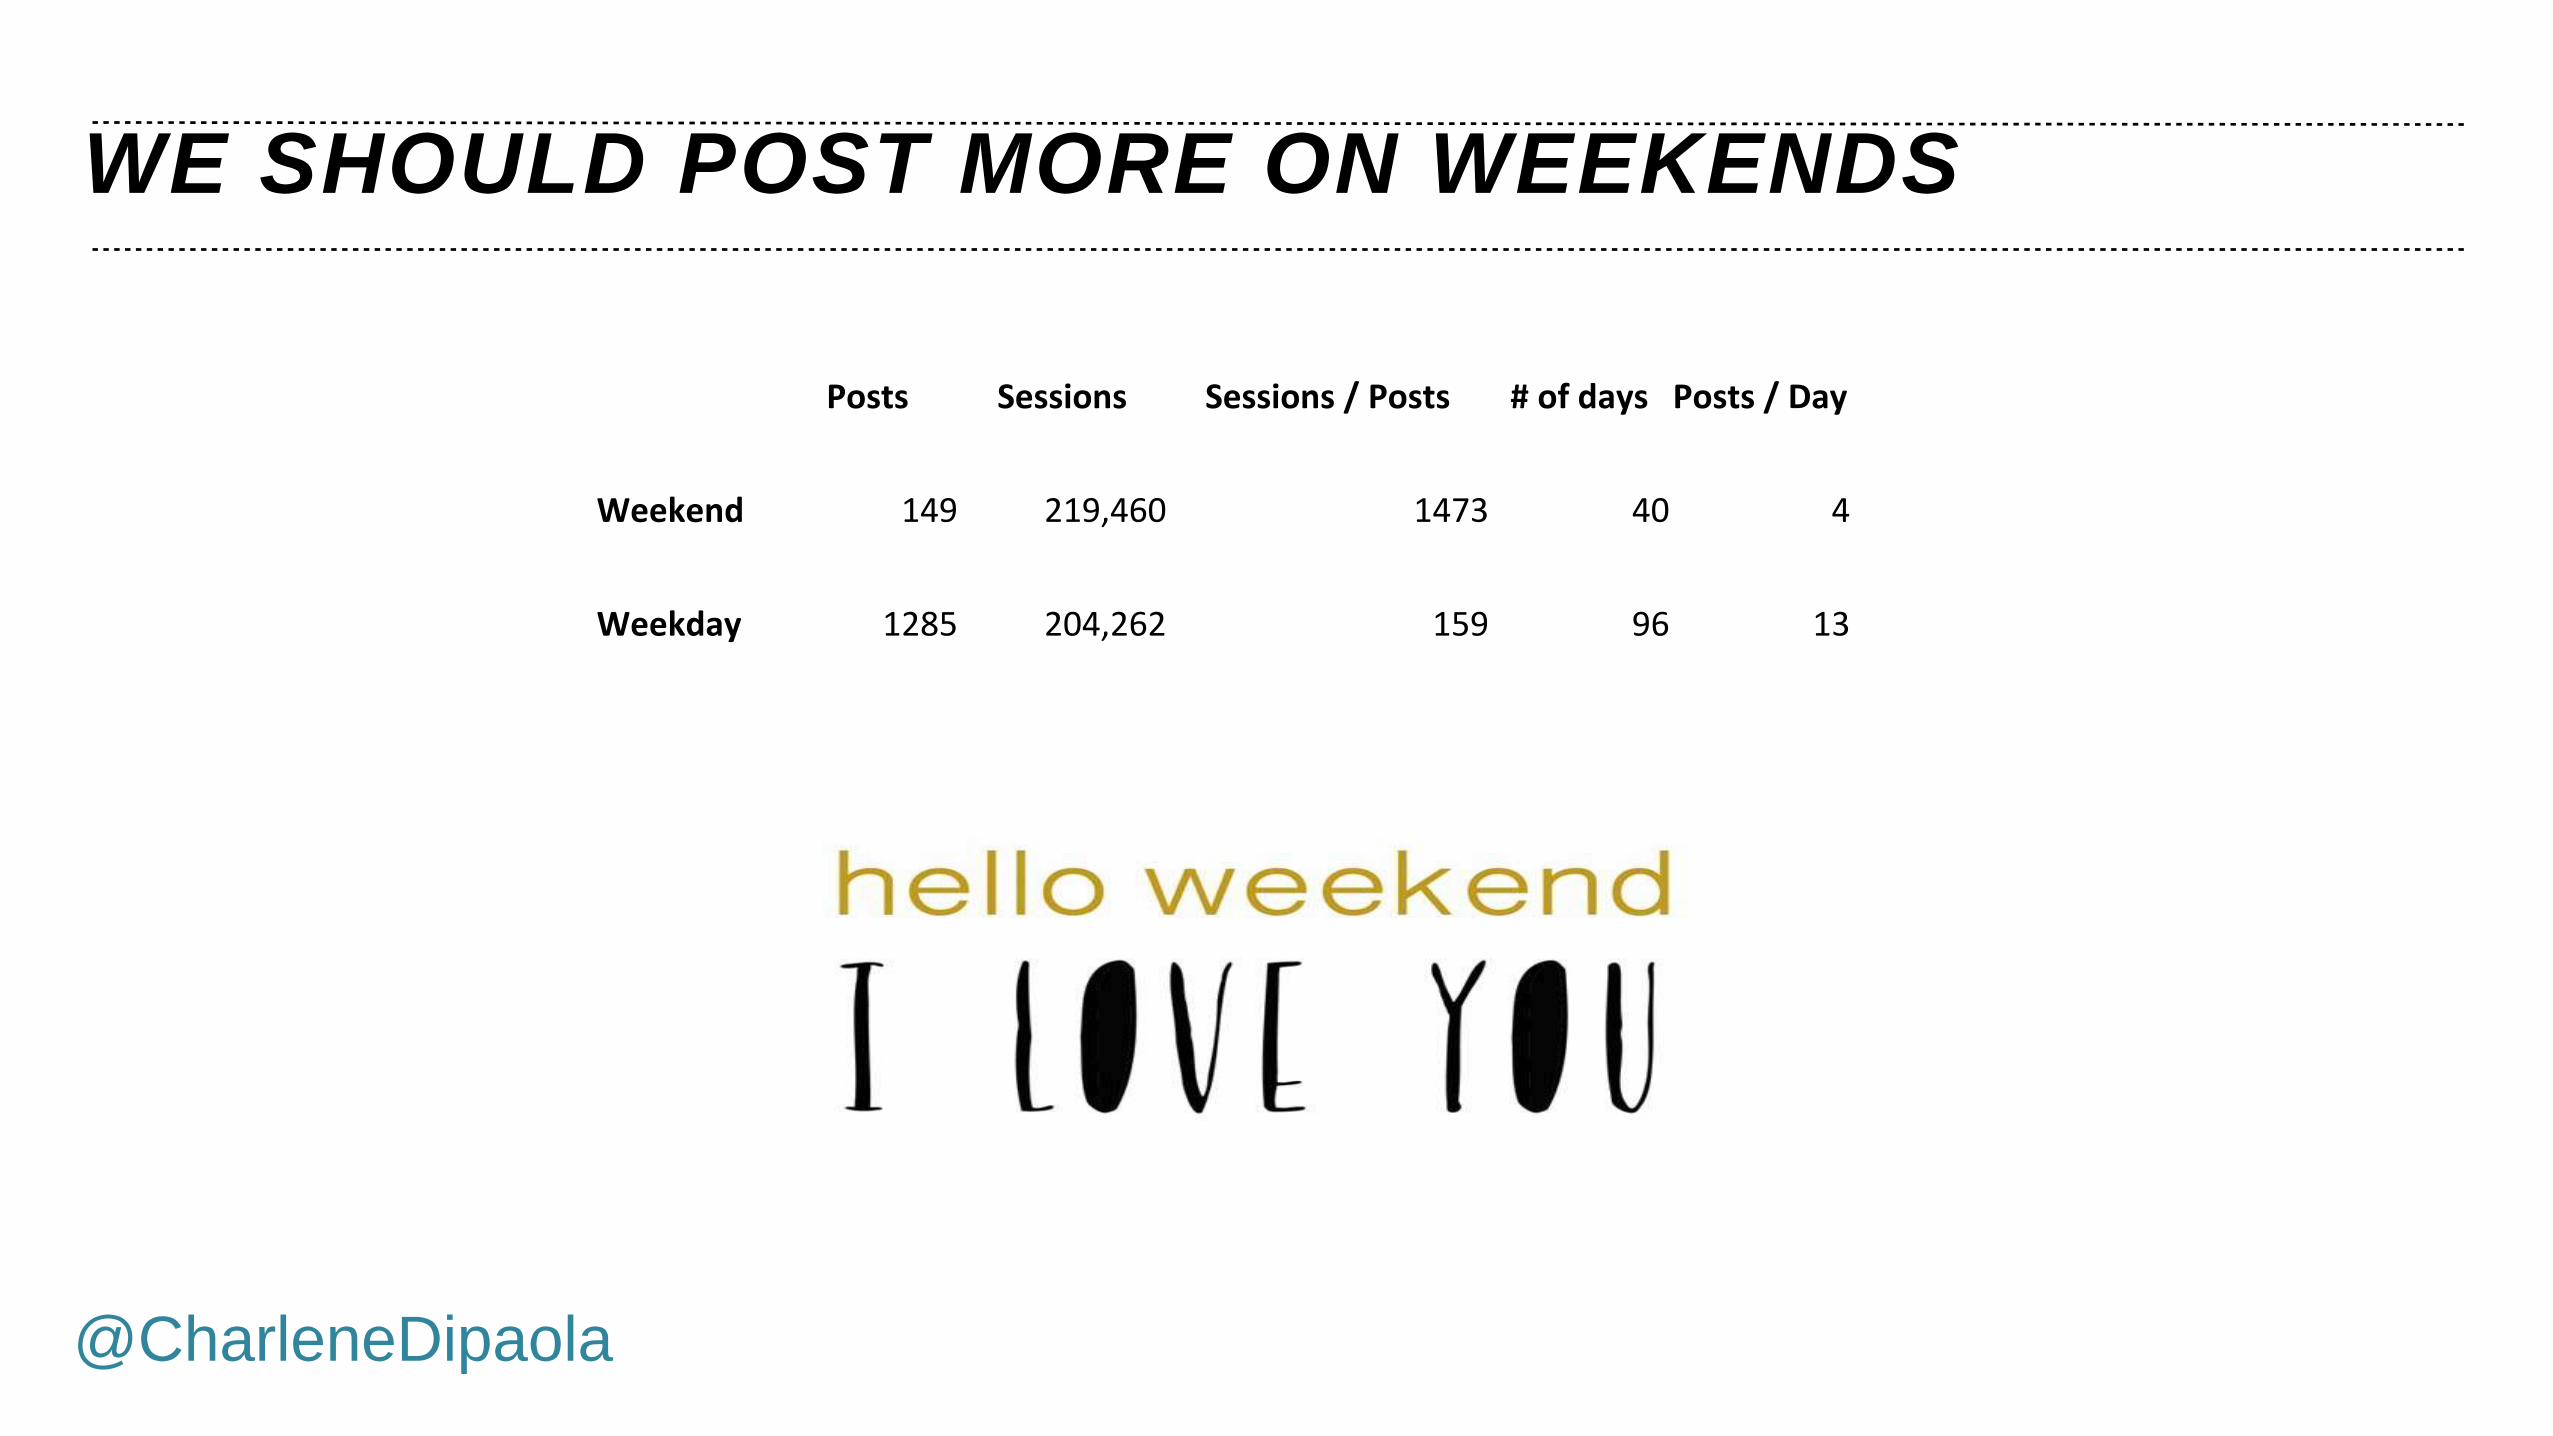
WE SHOULD POST MORE ON WEEKENDS
@CharleneDipaola
Posts Sessions Sessions / Posts # of days Posts / Day
Weekend 149 219,460 1473 40 4
Weekday 1285 204,262 159 96 13

AVERAGE WEEKLY SESSIONS UP BY 14%
3 WEEKS AFTER…
0
5,000
10,000
15,000
20,000
25,000
week 1 week 2 week 3 week 4 week 5 week 6 week 7 week 8 week 9 week 10
Weekly Sessions Coming From Facebook Page
@CharleneDipaola
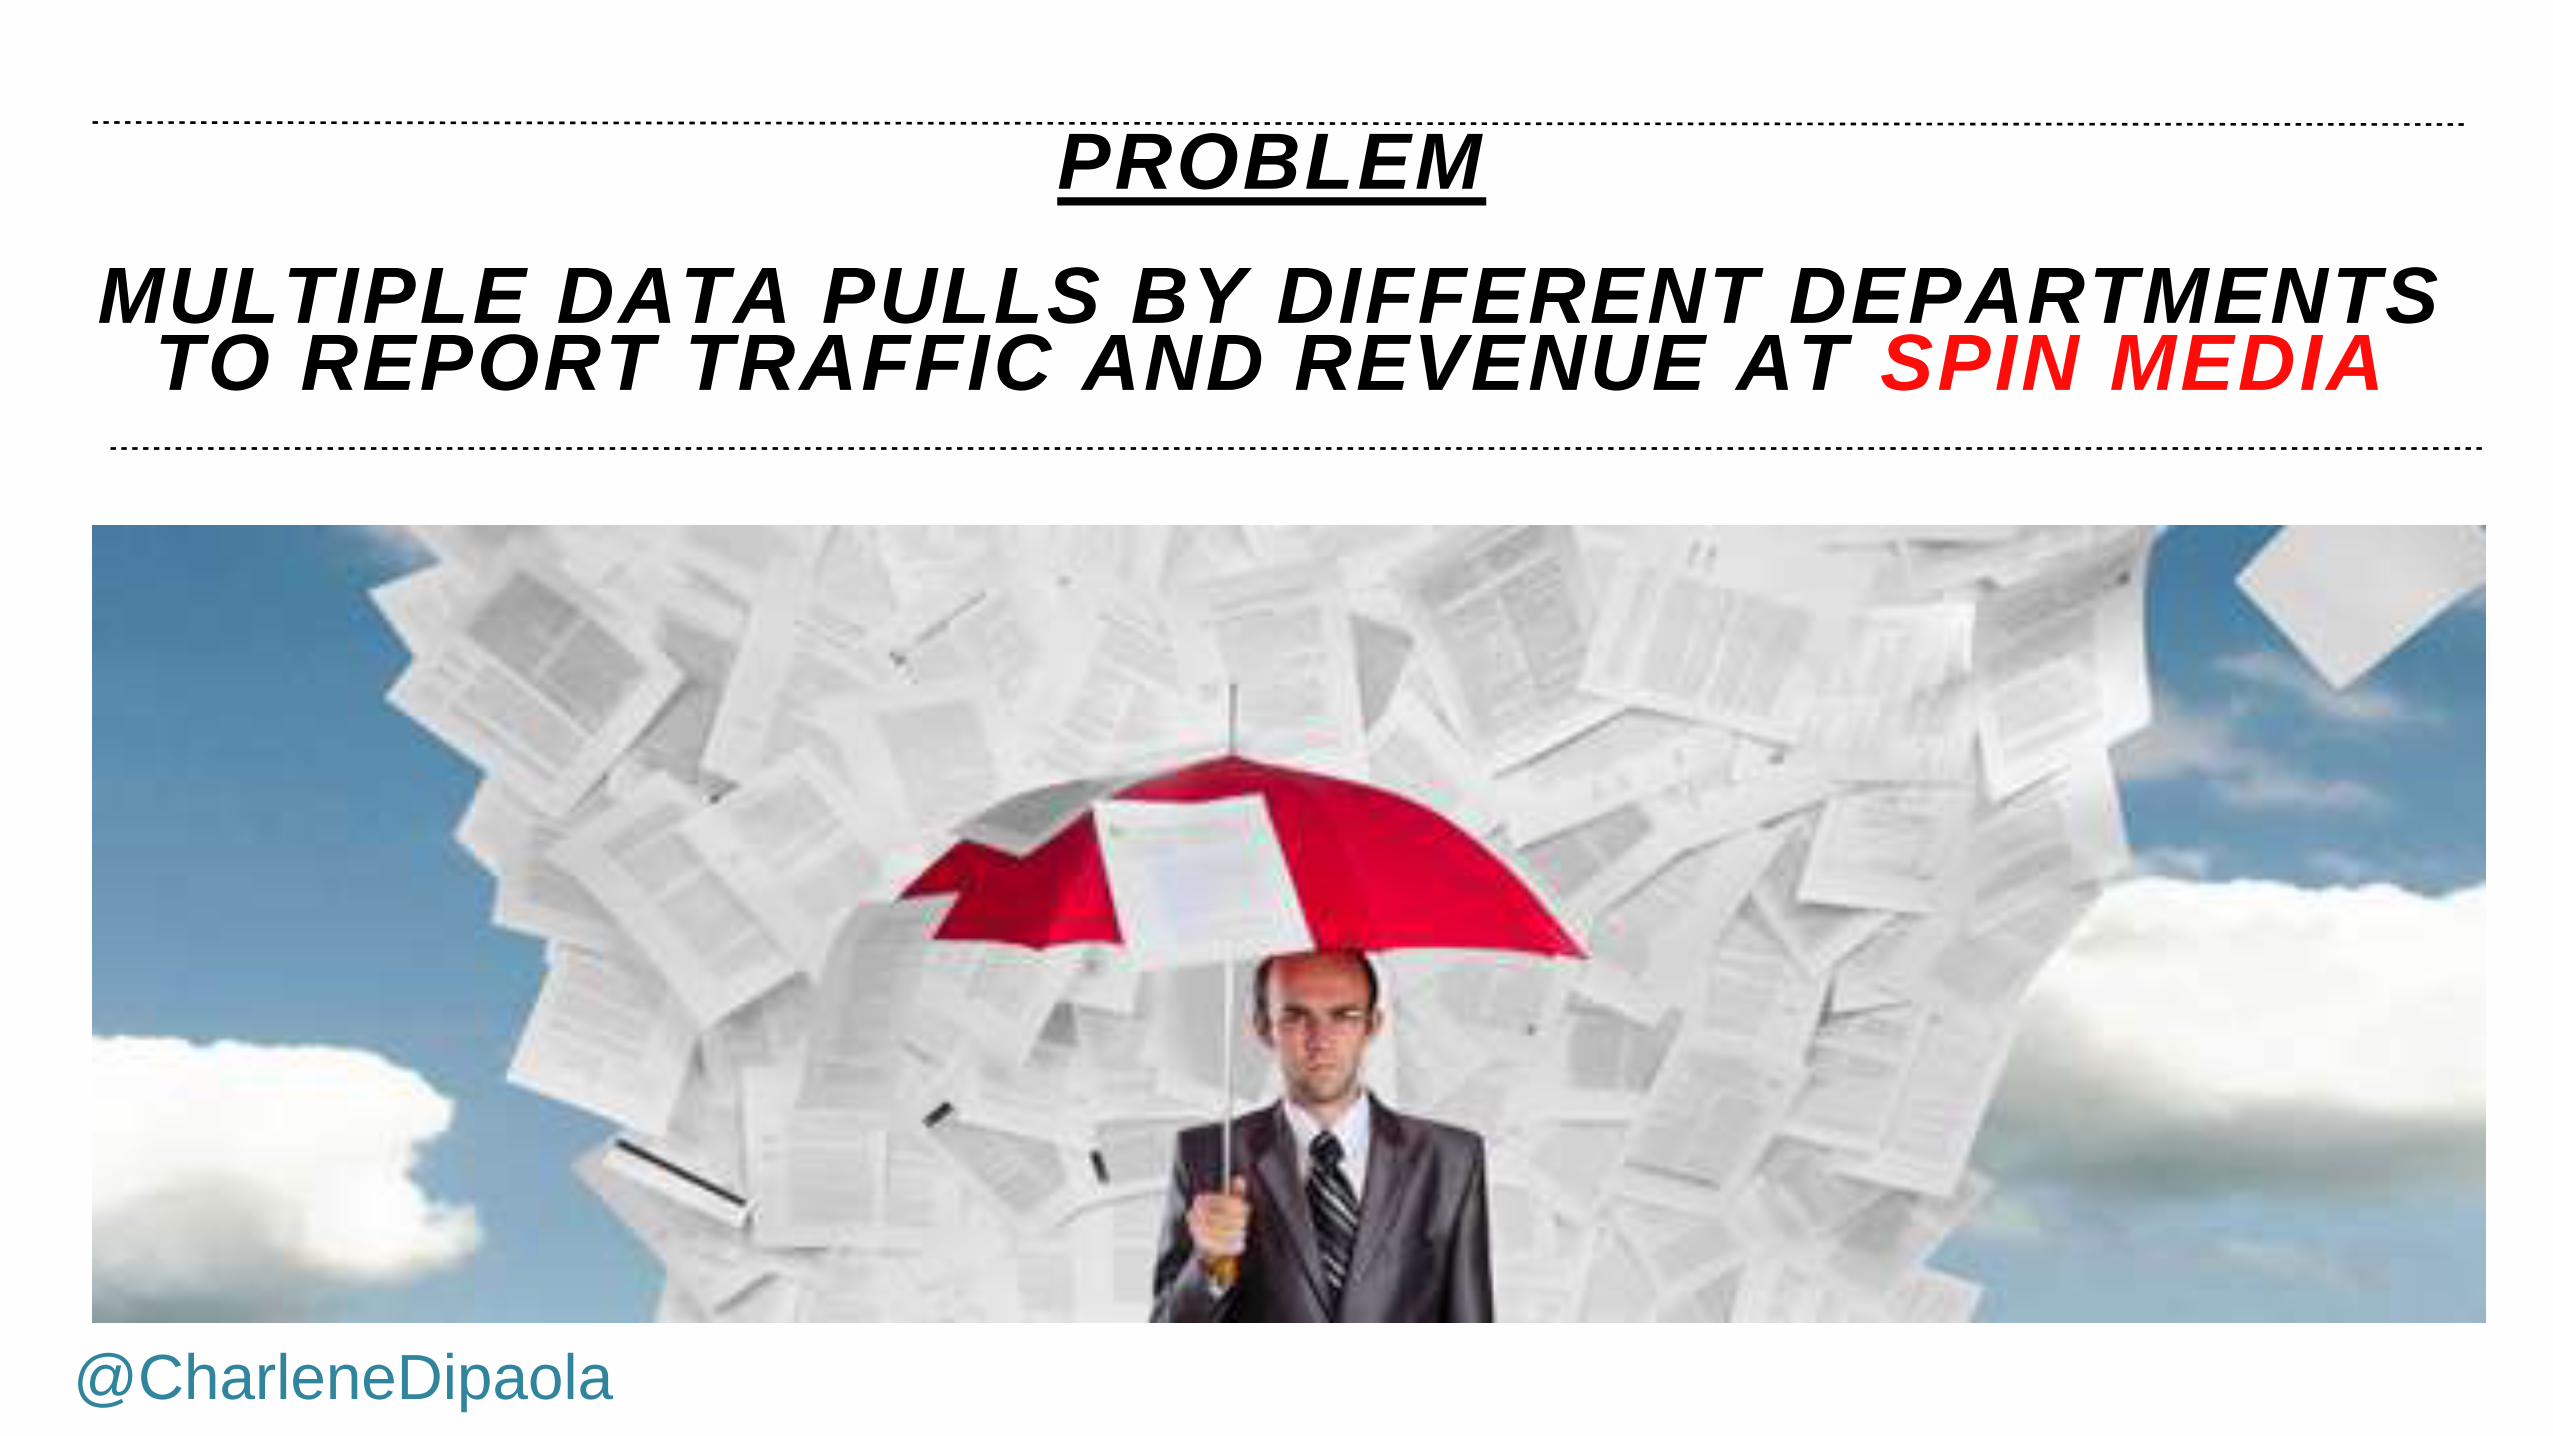
PROBLEM
MULTIPLE DATA PULLS BY DIFFERENT DEPARTMENTS TO REPORT TRAFFIC AND REVENUE AT SPIN MEDIA
@CharleneDipaola
‹#›@CharleneDipaola
‹#›
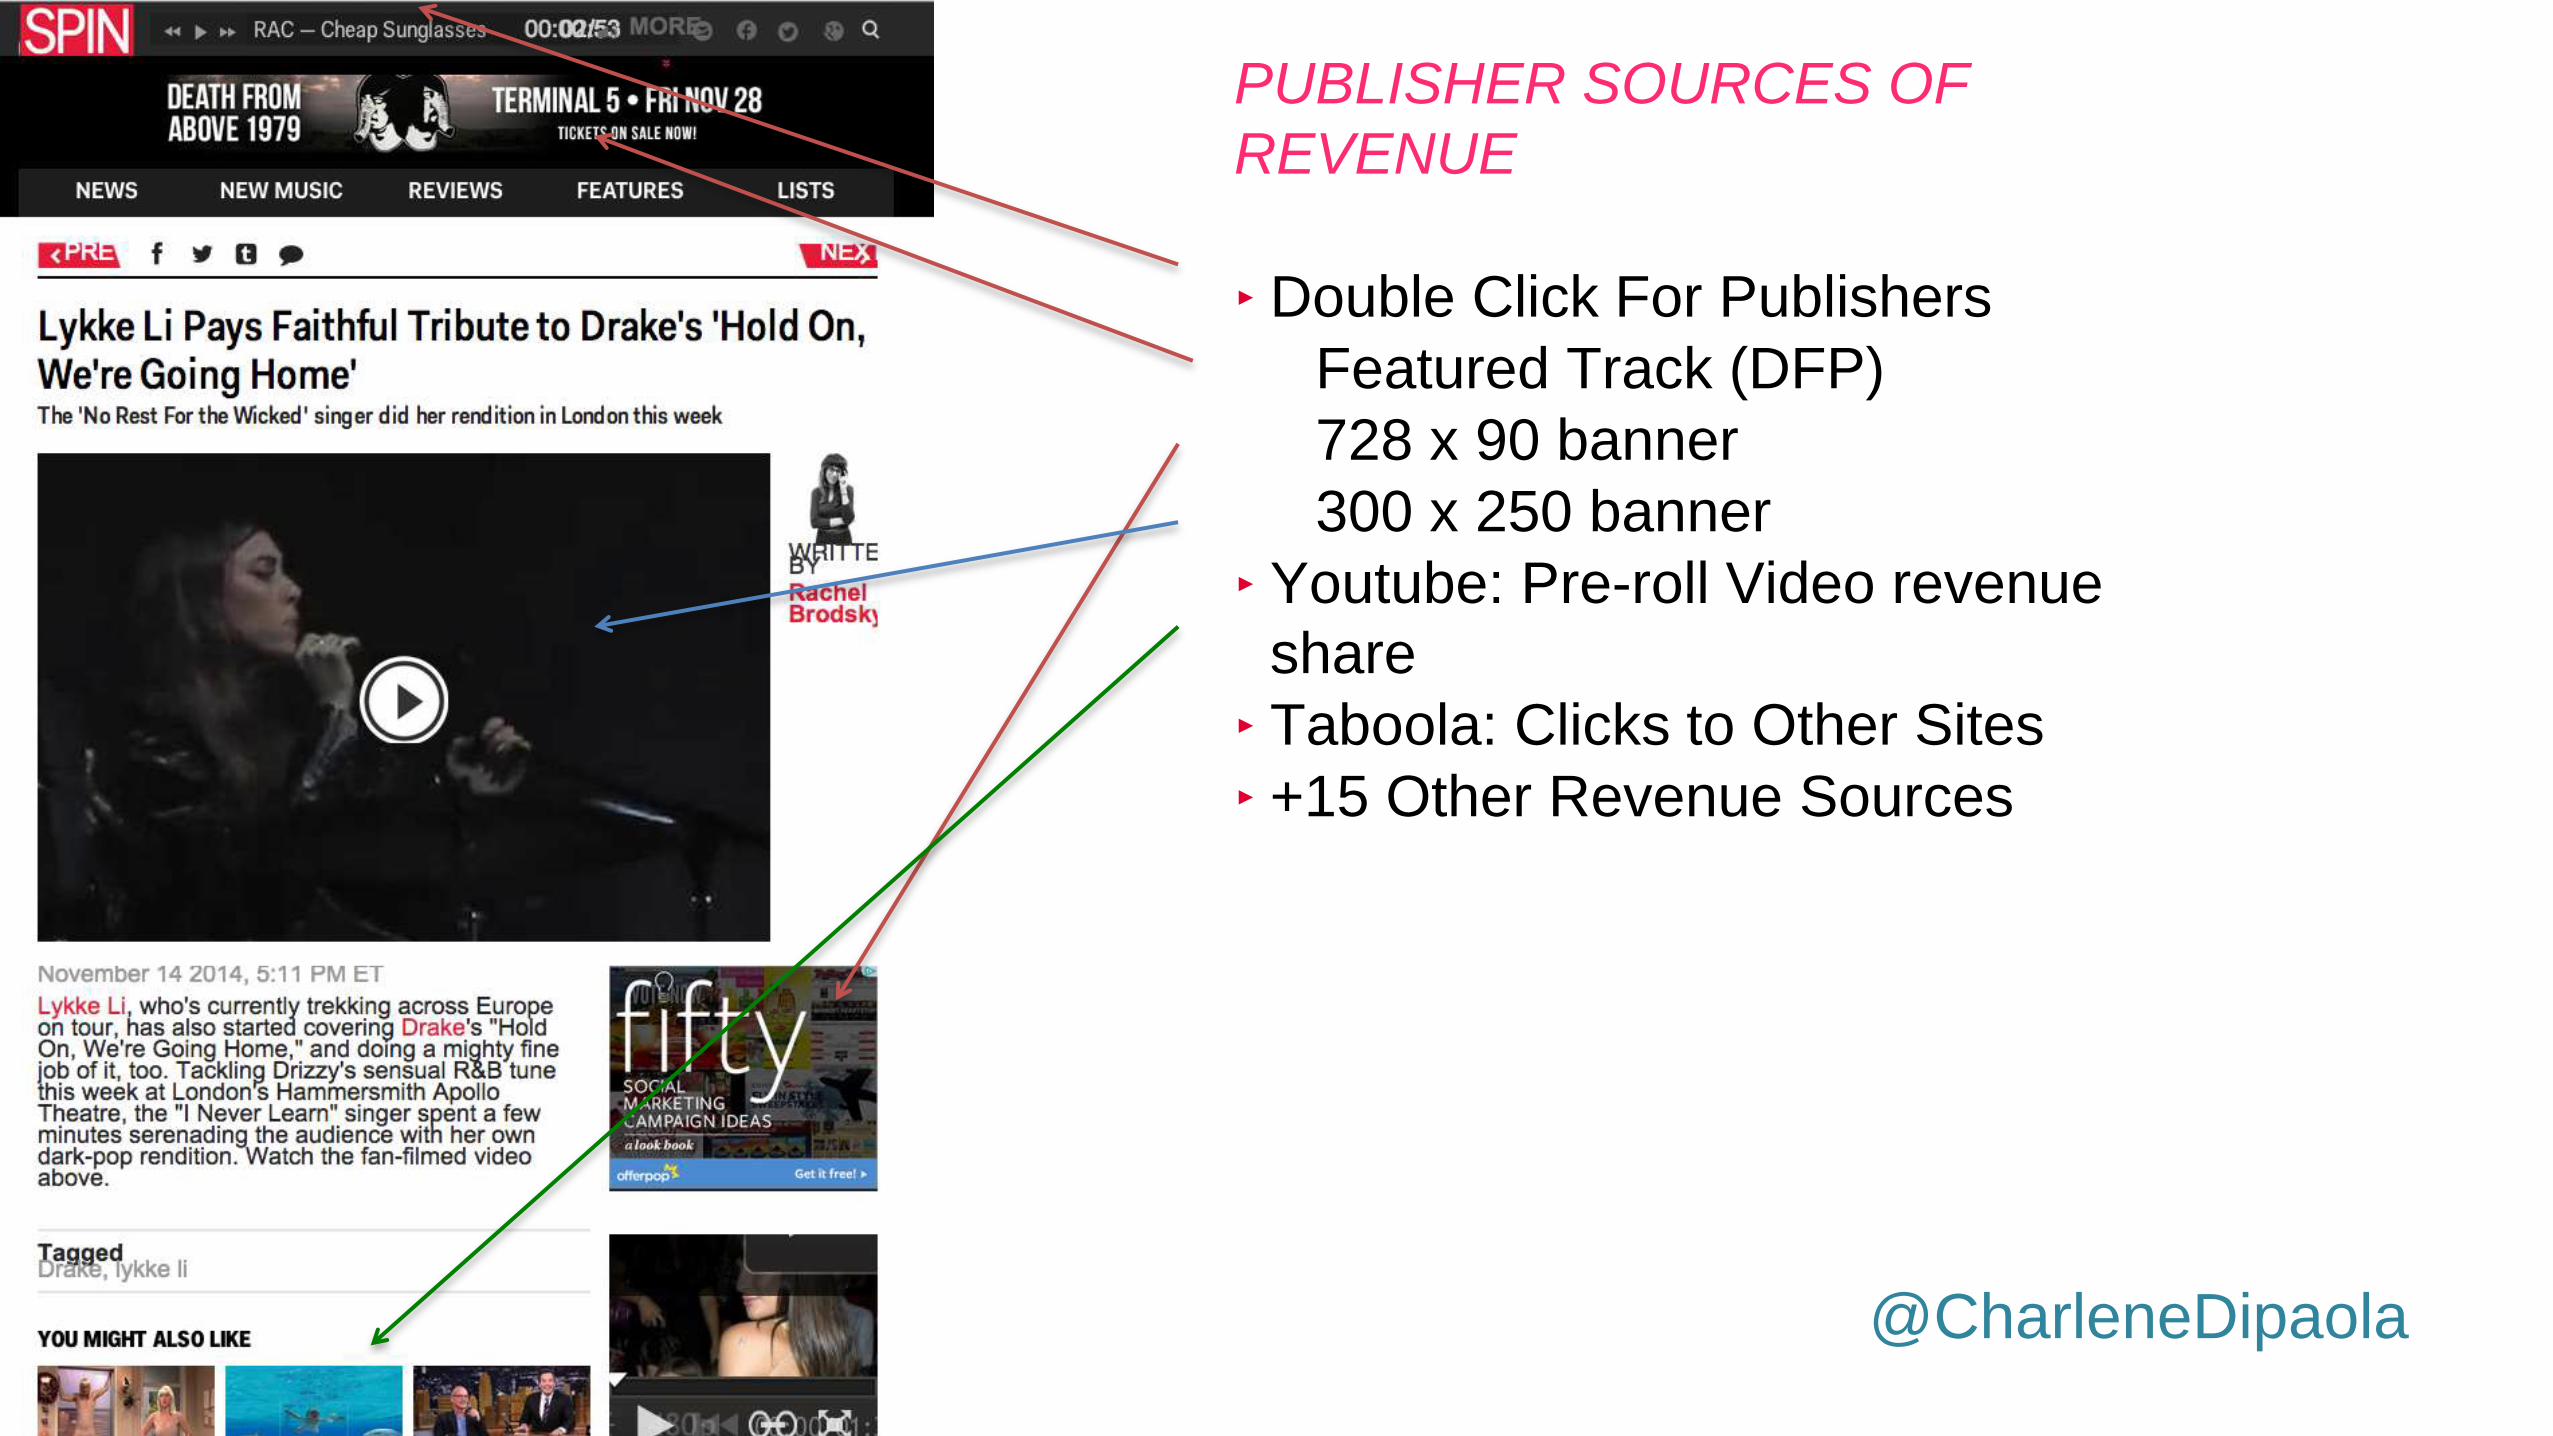
PUBLISHER SOURCES OF
REVENUE
‣ Double Click For Publishers
Featured Track (DFP)
728 x 90 banner
300 x 250 banner
‣ Youtube: Pre-roll Video revenue
share
‣ Taboola: Clicks to Other Sites
‣ +15 Other Revenue Sources
@CharleneDipaola

MULTIPLE SOURCES
@CharleneDipaola
Traffic:
Google Analytics
Revenue:
Double Click For Publishers – Internally Sold Revenue
Youtube – Internally Sold Revenue
Taboola – Other Revenue
Comission Junction – Other Revenue
Open X – Other Revenue
+ 15 other revenue sources

DATA WAREHOUSE INFRASTRUCTURE
@CharleneDipaola
DoubleClick FP MySQL

SITE REVENUE PER 1000
PAGEVIEW
Site A $35.02
Site B $20.34
Site C $15.31
Site D $6.51
Site E $2.00
Site F $0.90
INSIGHT: Huge disparity in revenue performance per site
ACTION: Focus on sites that make more Revenue per PV
@CharleneDipaola

My friends and I we’ve
cracked the code…
2@CharleneDipaola