digestate and compost as fertilisers: risk assessment and risk … · 2019-11-04 · for compost we...
TRANSCRIPT

European Commission
Digestate and compost as fertilisers:
Risk assessment and risk management options
Final Report
Wood Environment & Infrastructure Solutions UK Limited – February 2019


3 © Wood Environment & Infrastructure Solutions UK Limited
February 2019
Doc Ref. 40039CL003i3
Executive summary
Purpose of this report
This is the final report for a project on ”Digestate and compost as organic fertilisers – Risk assessment and risk
management options” (reference FC/2015/0010 - SR3 under Framework Contract ENV.A.3/FRA/2015/0010),
prepared by Wood with partners Peter Fisk Associates and Ramboll for the European Commission, DG
Environment.
The aim of the project was to prepare an environmental and human health risk assessment and a risk
management options analysis (RMOA) to provide a sound basis for decision making on the need to propose
any regulatory measures to control the risks associated with contaminants in compost and digestate
(hereafter referred to as C/D) used as a fertiliser and soil improver. This included a socio-economic analysis of
the impacts of possible risk management action.
Market analysis
Approach
The market analysis involved collecting available information on all uses and related tonnages of digestate
and compost in the European Union, as well as their input materials. The analysis involved a combination of a
targeted stakeholder consultation and a review of relevant literature and statistical sources.
Results
For compost we estimate that the current annual EU production of compost amounts to 17.3 million
tonnes per year as a central estimate (with a possible range of 13-18 million tonnes). The vast majority of this
(ca 14 million tonnes) is derived from green waste and separately collected biowaste, while some 800,000
tonnes are produced from sewage sludge1. Some sources suggest that compost is (or at least has been)
produced from mechanical biological treatment (MBT) of mixed MSW in some smaller countries, but a
current EU-wide figure could not be derived. It is estimated that the majority (ca. 85%) of compost is used as
a fertiliser or soil improver in agriculture, gardening, horticulture and landscaping.
For digestate, our analysis suggests that around 180 million tonnes of digestate are produced in the EU28
per year, almost half of this in Germany. With 120 million tonnes, the majority of digestate produced in the
EU is agricultural digestate (typically a mix of manure and plants, particularly energy crops). About 46 million
tonnes are produced from the organic fraction of mixed MSW (mechanical biological treatment – MBT), at
least 7 million tonnes from source separated biowaste and smaller quantities (ca. 1.7 million tonnes each)
from sewage sludge and agro/food industry by-products. The vast majority of digestate is used directly as a
fertiliser.
1 It should be noted that the sum of compost produced across input materials is lower than the total quantity of compost produced in
Europe estimated above. This is due to different data sources available for quantities by country and by input material. The mismatch
suggests that either the quantities of compost by country (and in sum for the whole EU) are somewhat overestimated, and/or the
quantities of compost by feedstock are somewhat underestimated.

4 © Wood Environment & Infrastructure Solutions UK Limited
February 2019
Doc Ref. 40039CL003i3
Substance identification
Approach
The objective of the substance identification was to identify potential critical contaminants in C/D for the
subsequent risk assessment and risk management options analysis (RMOA).
A set of criteria was developed to decide whether a substance (or a group of similar substances) present in
compost or digestate should be further investigated. These criteria include “presence in specific substance
lists”, “human toxicity”, “environmental toxicity”, “harmonised classification”, “mobility in water bodies”,
“concentration found in compost/digestate”, “intrinsic properties” and “limit values exceeded”. A matrix was
created to collect relevant information from scientific literature. The substances were then classified into one
of three priority levels based on a combination of the above criteria.
Results
17 substance groups were identified, covering more than 94 single substances and 4 sub-groups2, based on
the information retrieved from 50 relevant publications. Based on the priority levels and discussion with the
project steering group, the following substances were then taken forward for further risk assessment:
Heavy metals – represented by cadmium, nickel, lead, copper, zinc and mercury.
Bisphenol-A.
Phthalates – represented by di(2-ethylhexyl)phthalate (DEHP).
Pharmaceuticals – represented by 17α-Ethinylestradiol (EE2).
Hexabromocyclododecane (HBCDD).
Dioxins, furans and dioxin-like PCBs – represented by 2,3,7,8-tetrachlorodibenzodioxin (2,3,7,8-
TCDD) and 2,3,4,7,8-pentachlorodibenzofuran (2,3,4,7,8-PCDF).
Other PCB – represented by 2,4,4’-Trichlorobiphenyl (PCB-28).
Nonylphenol isomers and ethoxylates – represented by nonylphenol.
Polycyclic aromatic hydrocarbons (PAH) – represented by benzo[a]pyrene, chrysene,
benz[a]anthracene, benzo[b]fluoranthene and indeno[,2,3-cd]pyrene.
Perfluoralkyl substances (PFAs) – represented by perfluoroctanesulfonic acid (PFOS) and
undecafluorohexanoic acid (PFHxA).
Physical impurities – represented by microplastics.
Risk assessment
Approach
Realistic worst case risk assessments3 have been carried out for selected priority contaminants. The focus of
the exposure assessments was the environment and humans exposed via food and drinking water. Exposure
2 Sub-group = two or more individual substances are addressed together, e.g. PAH-16 or PCB7. 3 It is important to note that a relatively simplistic realistic worst-case approach has be used in the risk assessment in order to simplify
the process, and the results are subject to a number of uncertainties considered and discussed in the risk assessment.
5 © Wood Environment & Infrastructure Solutions UK Limited
February 2019
Doc Ref. 40039CL003i3
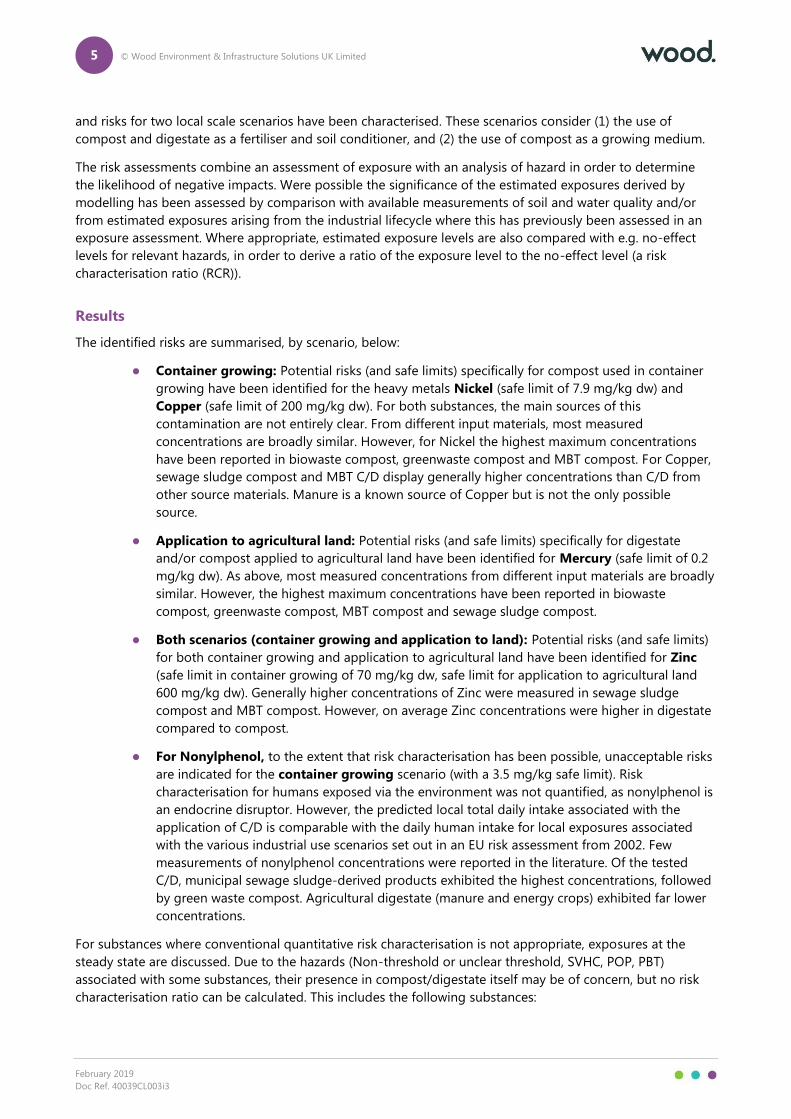
and risks for two local scale scenarios have been characterised. These scenarios consider (1) the use of
compost and digestate as a fertiliser and soil conditioner, and (2) the use of compost as a growing medium.
The risk assessments combine an assessment of exposure with an analysis of hazard in order to determine
the likelihood of negative impacts. Were possible the significance of the estimated exposures derived by
modelling has been assessed by comparison with available measurements of soil and water quality and/or
from estimated exposures arising from the industrial lifecycle where this has previously been assessed in an
exposure assessment. Where appropriate, estimated exposure levels are also compared with e.g. no-effect
levels for relevant hazards, in order to derive a ratio of the exposure level to the no-effect level (a risk
characterisation ratio (RCR)).
Results
The identified risks are summarised, by scenario, below:
Container growing: Potential risks (and safe limits) specifically for compost used in container
growing have been identified for the heavy metals Nickel (safe limit of 7.9 mg/kg dw) and
Copper (safe limit of 200 mg/kg dw). For both substances, the main sources of this
contamination are not entirely clear. From different input materials, most measured
concentrations are broadly similar. However, for Nickel the highest maximum concentrations
have been reported in biowaste compost, greenwaste compost and MBT compost. For Copper,
sewage sludge compost and MBT C/D display generally higher concentrations than C/D from
other source materials. Manure is a known source of Copper but is not the only possible
source.
Application to agricultural land: Potential risks (and safe limits) specifically for digestate
and/or compost applied to agricultural land have been identified for Mercury (safe limit of 0.2
mg/kg dw). As above, most measured concentrations from different input materials are broadly
similar. However, the highest maximum concentrations have been reported in biowaste
compost, greenwaste compost, MBT compost and sewage sludge compost.
Both scenarios (container growing and application to land): Potential risks (and safe limits)
for both container growing and application to agricultural land have been identified for Zinc
(safe limit in container growing of 70 mg/kg dw, safe limit for application to agricultural land
600 mg/kg dw). Generally higher concentrations of Zinc were measured in sewage sludge
compost and MBT compost. However, on average Zinc concentrations were higher in digestate
compared to compost.
For Nonylphenol, to the extent that risk characterisation has been possible, unacceptable risks
are indicated for the container growing scenario (with a 3.5 mg/kg safe limit). Risk
characterisation for humans exposed via the environment was not quantified, as nonylphenol is
an endocrine disruptor. However, the predicted local total daily intake associated with the
application of C/D is comparable with the daily human intake for local exposures associated
with the various industrial use scenarios set out in an EU risk assessment from 2002. Few
measurements of nonylphenol concentrations were reported in the literature. Of the tested
C/D, municipal sewage sludge-derived products exhibited the highest concentrations, followed
by green waste compost. Agricultural digestate (manure and energy crops) exhibited far lower
concentrations.
For substances where conventional quantitative risk characterisation is not appropriate, exposures at the
steady state are discussed. Due to the hazards (Non-threshold or unclear threshold, SVHC, POP, PBT)
associated with some substances, their presence in compost/digestate itself may be of concern, but no risk
characterisation ratio can be calculated. This includes the following substances:

6 © Wood Environment & Infrastructure Solutions UK Limited
February 2019
Doc Ref. 40039CL003i3
Lead is a non-threshold neurotoxic substance and the contribution from C/D to the total
background levels of lead in soil from all sources is significant. On the other hand, the realistic
worst case has yielded no risk characterisation ratios (RCRs) >1 for the endpoints where
conventional quantitative risk characterisation is appropriate (soil, sediment, water and
secondary poisoning). Generally higher concentrations of lead were measured in compost
(compared to digestate in general), with MBT compost exhibiting the highest reported average
and maximum concentrations.
BPA and DEHP are reprotoxins and endocrine disruptors (SVHCs).
For BPA, the regional scale predicted environmental concentration (PEC) in agricultural soil
is well below the background concentration arising from the industrial life cycle. The
predicted local total daily intake for humans does not exceed the DNEL used by EFSA and
RAC, and the PNECs adopted in the 2010 ESR risk assessment are not exceeded. BPA in C/D
can therefore be considered a lower priority for further risk management.
For DEHP, the highest reported concentrations in composts and digestates (sewage sludge
compost, biowaste-food and garden waste digestate) already appear to exceed the national
limit values for C/D for several member states and the local total daily intake for humans
associated with container growing slightly exceeds the DNEL defined by Danish EPA. With
regards to application to land, the regional scale predicted environmental concentration
(PEC) in agricultural soil and grassland is below the background concentration arising from
the industrial life cycle. Upcoming risk management for DEHP (amendment of the REACH
Authorisation List entry and proposed REACH restriction on DEHP in articles) may lead to a
reduction of DEHP in input materials used for composting and AD. Hence, further
monitoring of the development of DEHP concentrations in C/D is required to judge the
need for further risk management in the future.
17α-ethinylestradiol is an endocrine disruptor with unclear safe limit thresholds. The total
mass in the region + continent at steady state is low (approximately 7 tonnes), but the local
total daily intake is only about four times below the therapeutic pharmaceutical dose. The only
concentration measurements identified in the literature are for C/D from sewage sludge and
given 17α-ethinylestradiol is a pharmaceutical, it appears likely that sewage from waste water
treatment is the main source of the substance into C/D.
HBCDD, the assessed representative PCBs (PCB28) and of dioxins and furans (TCDD,
PCDF), as well as PFOA and PFOS are POPs. That they have been detected in freshly-
produced composts and digestates at several locations in recent years is itself a concern.
For HBCDD, very few literature sources have identified HBCDD in C/D and the estimated
regional scale exposures arising from the application of C/D are well below the
anthropogenic background concentrations. Furthermore, following the expiry of the only
REACH authorisation, any contribution to HBCDD concentrations in compost in digestate
resulting from industrial release of HBCDD should be eliminated. HBCCD in C/D can
therefore be considered a lower priority for further risk management.
For the assessed PCB, the highest reported concentrations in composts and digestates
already appear to exceed the national limit value for C/D in several Member States
(although only in a very small share of samples) and the estimated exposures are high
compared with reported mean/median levels in foodstuffs. A clear distinction of PCB
concentration levels between C/D from different input materials could not be established,
with a wide variation of values reported for most.
For the assessed dioxins and furans, the highest reported concentrations in composts and
digestates already appear to exceed the national limit value for C/D in several Member
7 © Wood Environment & Infrastructure Solutions UK Limited
February 2019
Doc Ref. 40039CL003i3
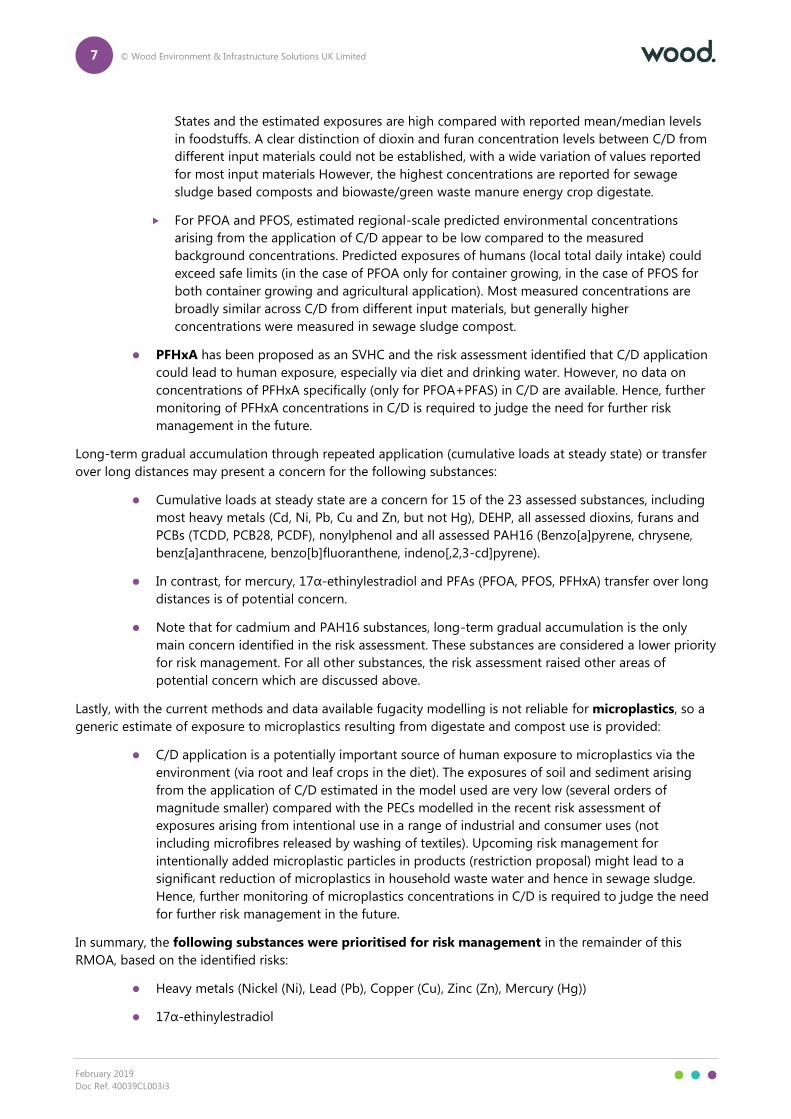
States and the estimated exposures are high compared with reported mean/median levels
in foodstuffs. A clear distinction of dioxin and furan concentration levels between C/D from
different input materials could not be established, with a wide variation of values reported
for most input materials However, the highest concentrations are reported for sewage
sludge based composts and biowaste/green waste manure energy crop digestate.
For PFOA and PFOS, estimated regional-scale predicted environmental concentrations
arising from the application of C/D appear to be low compared to the measured
background concentrations. Predicted exposures of humans (local total daily intake) could
exceed safe limits (in the case of PFOA only for container growing, in the case of PFOS for
both container growing and agricultural application). Most measured concentrations are
broadly similar across C/D from different input materials, but generally higher
concentrations were measured in sewage sludge compost.
PFHxA has been proposed as an SVHC and the risk assessment identified that C/D application
could lead to human exposure, especially via diet and drinking water. However, no data on
concentrations of PFHxA specifically (only for PFOA+PFAS) in C/D are available. Hence, further
monitoring of PFHxA concentrations in C/D is required to judge the need for further risk
management in the future.
Long-term gradual accumulation through repeated application (cumulative loads at steady state) or transfer
over long distances may present a concern for the following substances:
Cumulative loads at steady state are a concern for 15 of the 23 assessed substances, including
most heavy metals (Cd, Ni, Pb, Cu and Zn, but not Hg), DEHP, all assessed dioxins, furans and
PCBs (TCDD, PCB28, PCDF), nonylphenol and all assessed PAH16 (Benzo[a]pyrene, chrysene,
benz[a]anthracene, benzo[b]fluoranthene, indeno[,2,3-cd]pyrene).
In contrast, for mercury, 17α-ethinylestradiol and PFAs (PFOA, PFOS, PFHxA) transfer over long
distances is of potential concern.
Note that for cadmium and PAH16 substances, long-term gradual accumulation is the only
main concern identified in the risk assessment. These substances are considered a lower priority
for risk management. For all other substances, the risk assessment raised other areas of
potential concern which are discussed above.
Lastly, with the current methods and data available fugacity modelling is not reliable for microplastics, so a
generic estimate of exposure to microplastics resulting from digestate and compost use is provided:
C/D application is a potentially important source of human exposure to microplastics via the
environment (via root and leaf crops in the diet). The exposures of soil and sediment arising
from the application of C/D estimated in the model used are very low (several orders of
magnitude smaller) compared with the PECs modelled in the recent risk assessment of
exposures arising from intentional use in a range of industrial and consumer uses (not
including microfibres released by washing of textiles). Upcoming risk management for
intentionally added microplastic particles in products (restriction proposal) might lead to a
significant reduction of microplastics in household waste water and hence in sewage sludge.
Hence, further monitoring of microplastics concentrations in C/D is required to judge the need
for further risk management in the future.
In summary, the following substances were prioritised for risk management in the remainder of this
RMOA, based on the identified risks:
Heavy metals (Nickel (Ni), Lead (Pb), Copper (Cu), Zinc (Zn), Mercury (Hg))
17α-ethinylestradiol

8 © Wood Environment & Infrastructure Solutions UK Limited
February 2019
Doc Ref. 40039CL003i3
PCBs (PCB28)
Dioxins and furans (TCDD, PCDF)
Nonylphenol
PFAs (PFOA, PFOS)
Cadmium and PAH16 substances (as a lower priority)4
Risk management option analysis (including socio-economic
considerations)
Justification for risk management at EU-level
Realistic worst case risk assessments have identified potential risks from the use of C/D as fertiliser arising
from several contaminants. Existing risk management includes notably restrictions on input materials and
limit values on a range of contaminants for CE-marked fertilisers under the proposed Fertilising Products
Regulation, the European Compost Network (ECN) Assurance Scheme for Compost and Digestate (non-
binding) and national legislation in several Member States. However, it lacks binding and coherent
requirements for all types of C/D and all EU Member States. Moreover, the production of digestate as a
fertiliser is expected to increase significantly in the short to medium term. Existing risk management is
therefore unlikely to adequately control the identified risks. Coherent rules across the EU could improve user
confidence and help support a common market for C/D use as a fertiliser. Hence, further risk management at
EU-level may be required.
Comparison of the assessed risk management options
The main risk management measures considered in this RMOA are the introduction of (further) concentration
limits, restrictions on input materials, conditions of use, or the application of specific processes and
techniques to reduce the concentration of contaminants in input materials (before composting/AD) or C/D
itself (during composting/AD or post-treatment).
Based on the results of the risk assessment and the market analysis, as well as an assessment of the likely
effectiveness, practicality, monitorability and socio-economic impacts, the following initial considerations
on the potential scope for each measure were developed:
Option 1) Concentration limits: It seems appropriate to set limit values for nickel, copper,
zinc, mercury and nonylphenol equal to safe limits calculated in the risk assessment. However,
due to the large share of compost currently exceeding these levels for nickel and zinc for use in
container growing, it is unclear if these specific limits would be proportionate. Additional limit
values could be set for PCBs, PCDD/F, lead, PFAs and PAHs based on existing limit values,
unless the risks from these substances can be addressed by other types of risk management or
costs for sampling of PCBs, PCDD/F and PFAs are considered prohibitive.
The proposed limits are listed in the table below:
Substance Safe limit concentration in C/D for
application to agricultural land
Safe limit concentration in compost for
container growing
Cadmium * *
4 Lower priority than the above, because the only main concern identified in the risk assessment was long-term gradual
accumulation through repeated application.

9 © Wood Environment & Infrastructure Solutions UK Limited
February 2019
Doc Ref. 40039CL003i3
Nickel * 7.9 mg/kg dry weight
Copper * 200 mg/kg dry weight
Zinc 600 mg/kg dry weight 70 mg/kg dry weight
Mercury 0.2 mg/kg dry weight *
Nonylphenol * 3.5 mg/kg dry weight
For pollutants where safe limits cannot be defined:
Substance
(group)
Range of existing limits Considered most appropriate if EU-wide
limits were to be set based on existing
limits
PCBs PCB6: 0.1-1.2 mg/kg d.m.
PCB7: 0.15-0.8 mg/kg d.m.
PCB7: 0.8 mg/kg d.m.
Dioxins and
furans
17 PCDD/F: 20-100 ng TEQ/kg d.m.
PCDD/F + dl-PCB: 30 ng TEQ/kg d.m.
for the
17 PCDD/F: 20 ng TEQ/kg d.m.
Lead 100-150 mg/kg d.m 120 mg/kg d.m.
PFAS PFOA+PFOS: 100 µg/kg d.m. PFOA+PFOS: 100 µg/kg d.m.
PAHs PAH16: 3-10 mg/kg d.m.
PAH11: 3 mg/kg d.m.
PAH16: 6 mg/kg d.m.
Option 2) Restriction on input materials: It seems appropriate to consider prohibiting the
use as fertiliser of C/D made with sewage sludge5, with an option to allow its use in the future
given improvements to its treatment at waste water treatment plants. The direct application of
sewage sludge to agricultural land would have to be restricted to be coherent with the
restriction of sewage sludge C/D.
Option 3) Conditions of use: It appears appropriate to consider a restriction for container
growing (if C/D made from sewage sludge is not restricted for use as fertiliser in general as
discussed above).
Option 4) Obligation to use specific processes: An obligation to use two-stage anaerobic
digestion6 could be appropriate for MBT digestate and sewage sludge digestate, and an
obligation to apply post-composting7 could be appropriate for sewage sludge digestate (if C/D
made from sewage sludge is not restricted for use as fertiliser in general).
The main advantages and disadvantages identified for each option and for the specific measures proposed
under each option are summarised in the table below:
5 Addressing the following prioritised contaminants which have been found in high concentrations in sewage sludge:
Copper, Zinc, Mercury, 17α-ethinylestradiol, dioxins and furans, PFAS, PAH16. 6 Addressing the following priority contaminants which can be reduced by two-stage AD: Nickel, Lead, Copper, Zinc,
Cadmium, PAH16. 7 Addressing the following priority contaminants which can be reduced by post-composting: PCBs, PAH16.
10 © Wood Environment & Infrastructure Solutions UK Limited
February 2019
Doc Ref. 40039CL003i3
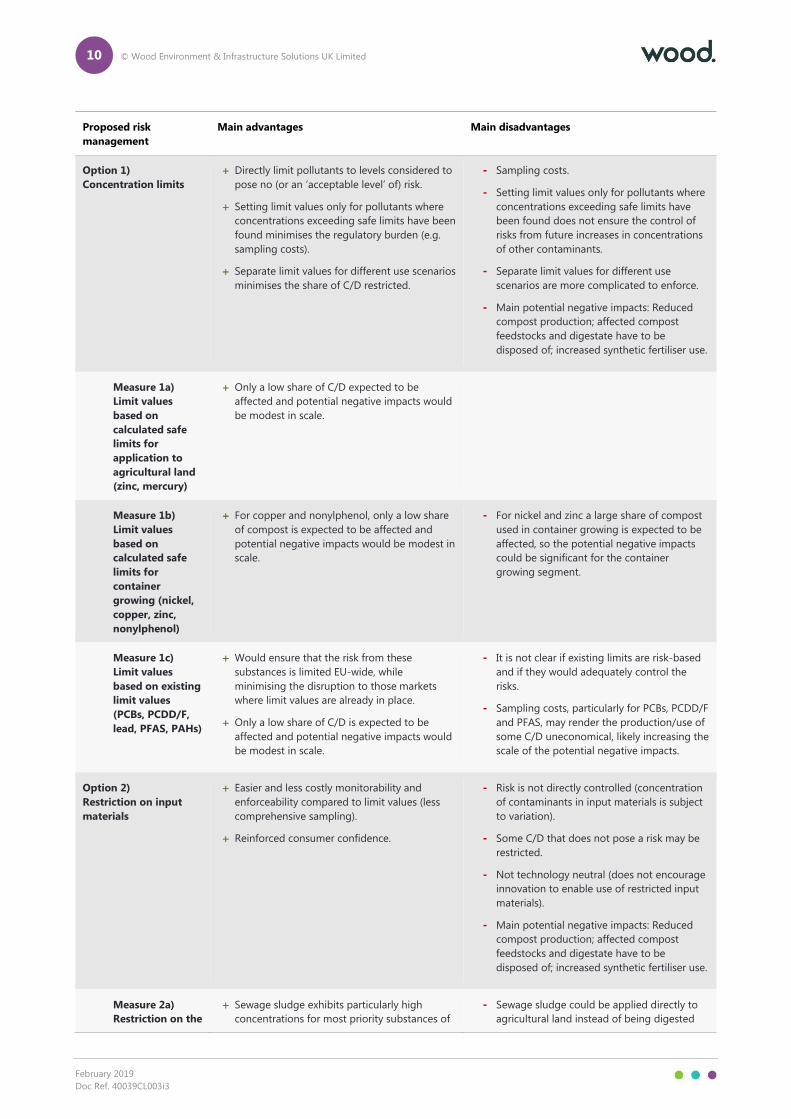
Proposed risk
management
Main advantages Main disadvantages
Option 1)
Concentration limits
Directly limit pollutants to levels considered to
pose no (or an ‘acceptable level’ of) risk.
Setting limit values only for pollutants where
concentrations exceeding safe limits have been
found minimises the regulatory burden (e.g.
sampling costs).
Separate limit values for different use scenarios
minimises the share of C/D restricted.
- Sampling costs.
- Setting limit values only for pollutants where
concentrations exceeding safe limits have
been found does not ensure the control of
risks from future increases in concentrations
of other contaminants.
- Separate limit values for different use
scenarios are more complicated to enforce.
- Main potential negative impacts: Reduced
compost production; affected compost
feedstocks and digestate have to be
disposed of; increased synthetic fertiliser use.
Measure 1a)
Limit values
based on
calculated safe
limits for
application to
agricultural land
(zinc, mercury)
Only a low share of C/D expected to be
affected and potential negative impacts would
be modest in scale.
Measure 1b)
Limit values
based on
calculated safe
limits for
container
growing (nickel,
copper, zinc,
nonylphenol)
For copper and nonylphenol, only a low share
of compost is expected to be affected and
potential negative impacts would be modest in
scale.
- For nickel and zinc a large share of compost
used in container growing is expected to be
affected, so the potential negative impacts
could be significant for the container
growing segment.
Measure 1c)
Limit values
based on existing
limit values
(PCBs, PCDD/F,
lead, PFAS, PAHs)
Would ensure that the risk from these
substances is limited EU-wide, while
minimising the disruption to those markets
where limit values are already in place.
Only a low share of C/D is expected to be
affected and potential negative impacts would
be modest in scale.
- It is not clear if existing limits are risk-based
and if they would adequately control the
risks.
- Sampling costs, particularly for PCBs, PCDD/F
and PFAS, may render the production/use of
some C/D uneconomical, likely increasing the
scale of the potential negative impacts.
Option 2)
Restriction on input
materials
Easier and less costly monitorability and
enforceability compared to limit values (less
comprehensive sampling).
Reinforced consumer confidence.
- Risk is not directly controlled (concentration
of contaminants in input materials is subject
to variation).
- Some C/D that does not pose a risk may be
restricted.
- Not technology neutral (does not encourage
innovation to enable use of restricted input
materials).
- Main potential negative impacts: Reduced
compost production; affected compost
feedstocks and digestate have to be
disposed of; increased synthetic fertiliser use.
Measure 2a)
Restriction on the
Sewage sludge exhibits particularly high
concentrations for most priority substances of
- Sewage sludge could be applied directly to
agricultural land instead of being digested

11 © Wood Environment & Infrastructure Solutions UK Limited
February 2019
Doc Ref. 40039CL003i3
Proposed risk
management
Main advantages Main disadvantages
use of sewage
sludge based C/D
as a fertiliser
concern, including several substances for
which no calculated safe limits are derivable
and concentration sampling is (potentially)
particularly expensive.
Only a low share of C/D is expected to be
affected and potential negative impacts would
be modest in scale
first, unless coherent regulation on direct use
of sewage sludge is implemented.
- Further regulating the direct use of sewage
sludge would increase the scale of impacts
related to alternative waste management for
sewage sludge.
Option 3)
Conditions of use
Aims at reducing exposure, rather than
banning certain composts/digestates or input
materials.
No sampling required.
- Risk is not directly controlled (only reduced
by eliminating uses with highest potential for
exposure).
- Potential difficulties with monitoring and
ensuring compliance by consumers.
Measure 3a)
Restriction on the
use of sewage
sludge compost
in container
growing*
Addresses the risk associated with container
growing, which is higher than application to
agricultural land for most priority substances
of concern (all except zinc and mercury).
Complementary to proposed limit values
based on calculated safe limits (sewage sludge
is linked to several substances for which no
calculated safe limits are available).
Only a very low share of compost is expected
to be affected and potential negative impacts
would be very modest in scale.
- Main potential negative impacts if use on
agricultural land is not feasible: Reduced
compost production; sewage sludge has to
be disposed of; increased synthetic fertiliser
use.
Option 4)
Obligation to use
specific processes
Aims at reducing contamination, rather than
banning certain composts/digestates or input
materials.
- Effectiveness in reducing the risks is
uncertain.
- Not technology neutral (not supporting
innovation and not leaving choice of most
efficient process to operators).
Measure 4a)
Restriction on the
use of MBT and
sewage sludge*
based digestate
as a fertiliser
except when
using two-stage
A/D
Targeted at specific risks (contaminants
reduced by this process are particularly linked
to sewage sludge).
Associated additional costs are at least partly
offset by operational benefits, so for a share of
the affected operators there may be no
negative net effects.
- A significant share of digestate is expected to
be affected and potential negative impacts
could be considerable in scale.
- For a share of the affected operators, there
will be a net cost.
- Main potential negative impacts for
operators for which the additional cost is not
feasible: affected digestate (and MBT
feedstocks/sewage sludge if replaced by
alternatives) have to be disposed of;
increased synthetic fertiliser use.
12 © Wood Environment & Infrastructure Solutions UK Limited
February 2019
Doc Ref. 40039CL003i3
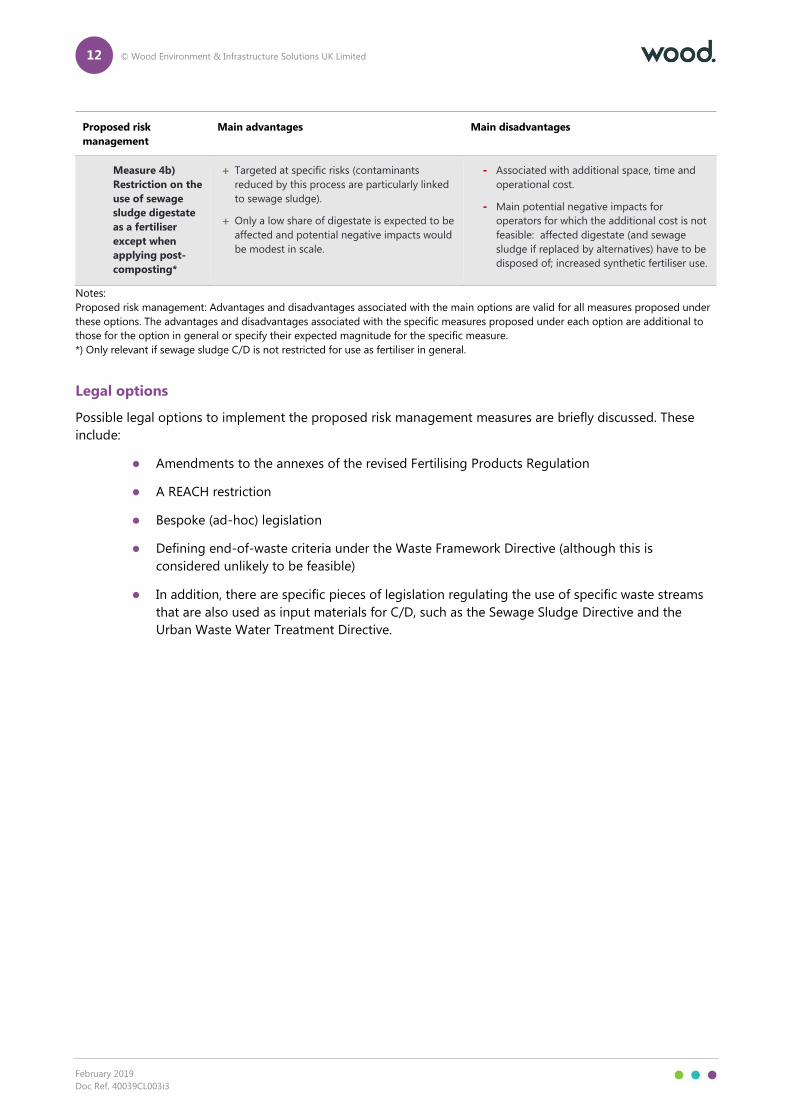
Proposed risk
management
Main advantages Main disadvantages
Measure 4b)
Restriction on the
use of sewage
sludge digestate
as a fertiliser
except when
applying post-
composting*
Targeted at specific risks (contaminants
reduced by this process are particularly linked
to sewage sludge).
Only a low share of digestate is expected to be
affected and potential negative impacts would
be modest in scale.
- Associated with additional space, time and
operational cost.
- Main potential negative impacts for
operators for which the additional cost is not
feasible: affected digestate (and sewage
sludge if replaced by alternatives) have to be
disposed of; increased synthetic fertiliser use.
Notes:
Proposed risk management: Advantages and disadvantages associated with the main options are valid for all measures proposed under
these options. The advantages and disadvantages associated with the specific measures proposed under each option are additional to
those for the option in general or specify their expected magnitude for the specific measure.
*) Only relevant if sewage sludge C/D is not restricted for use as fertiliser in general.
Legal options
Possible legal options to implement the proposed risk management measures are briefly discussed. These
include:
Amendments to the annexes of the revised Fertilising Products Regulation
A REACH restriction
Bespoke (ad-hoc) legislation
Defining end-of-waste criteria under the Waste Framework Directive (although this is
considered unlikely to be feasible)
In addition, there are specific pieces of legislation regulating the use of specific waste streams
that are also used as input materials for C/D, such as the Sewage Sludge Directive and the
Urban Waste Water Treatment Directive.

13 © Wood Environment & Infrastructure Solutions UK Limited
February 2019
Doc Ref. 40039CL003i3
Contents
1. Introduction 17
1.1 Purpose of this report 17
1.2 Objectives of the study 17
1.3 Structure of this report 17
2. Market analysis 19
2.1 Introduction 19
2.2 Approach 19 2.2.1 Overview 19 2.2.2 Consultation 19 2.2.3 Literature review 20 2.2.4 Statistical sources 20
2.3 Results 22 2.3.1 Overview 22 2.3.2 Compost 22 2.3.3 Digestate 27
3. Substance identification 32
3.1 Introduction 32
3.2 Approach 32
3.3 Results 37
4. Risk assessment 46
4.1 Introduction and approach to assessment 46
4.2 The compost and digestate life cycle 47
4.3 Defining exposure scenarios for quantitative exposure assessment 49
4.4 Assessment of specific priority substances 49 4.4.1 Cadmium (Cd) 49 4.4.2 Nickel (Ni) 51 4.4.3 Lead (Pb) 52 4.4.4 Copper (Cu) 54 4.4.5 Zinc (Zn) 55 4.4.6 Mercury (Hg) 57 4.4.7 Bisphenol-A (BPA) 58 4.4.8 Di(2-ethylhexyl)phthalate (DEHP) 60 4.4.9 17α-Ethinylestradiol 61 4.4.10 Hexabromocyclododecane (HBCDD) 66 4.4.11 2,3,7,8-Tetrachlorodibenzodioxin (TCDD) (representative of Dioxins, Furans and Dioxin-like PCBs chemical
family) 68 4.4.12 2,3,4,7,8-Pentachlorodibenzofuran (PCDF) (representative of Dioxins, Furans and Dioxin-like PCBs chemical
family) 71 4.4.13 2,4,4'-Trichlorobiphenyl (PCB28) (representative of PCBs chemical family) 79 4.4.14 Nonylphenol (representative of Nonylphenol and Nonylphenol Ethoxylates chemical family) 85 4.4.15 Benzo[a]pyrene (representative of PAH16 chemical family) 90

14 © Wood Environment & Infrastructure Solutions UK Limited
February 2019
Doc Ref. 40039CL003i3
4.4.16 Chrysene (representative of PAH16 chemical family) 96 4.4.17 Benz[a]anthracene (representative of PAH16 chemical family) 97 4.4.18 Benzo[b]fluoranthene (representative of PAH16 chemical family) 98 4.4.19 Indeno(1,2,3-cd)pyrene (representative of PAH16 chemical family) 98 4.4.20 Perfluoroctanoic acid (PFOA) (representative of PFAs chemical family) 99 4.4.21 Perfluoroctanesulfonic acid (PFOS) (representative of PFAs chemical family) 100 4.4.22 PFHxA (representative of PFAs chemical family) 102 4.4.23 Microplastics 103 4.4.24 Conclusions 104
5. Risk management option analysis 105
5.1 Overview 105
5.2 Summary of identified risk 105
5.3 Summary of uses and tonnages 110 5.3.1 Tonnages 110 5.3.2 Uses 113
5.4 Overview of existing risk management 114 5.4.1 Objective 114 5.4.2 Methodology, sources and limitations 114 5.4.3 Results 115 5.4.4 Conclusions 118
5.5 Identification and assessment of risk management options 119 5.5.1 Option 0: ‘Status quo’ 119 5.5.2 Option 1: Additional or stricter concentration limits for specific substances in compost and digestate used as
fertiliser 121 5.5.3 Option 2: Restriction on the input materials (feedstocks) in compost and digestate used as fertiliser 124 5.5.4 Option 3: Restriction on the conditions of use of compost and digestate used as fertiliser 125 5.5.5 Option 4: Specification of using specific processes 126
5.6 Socio-economic considerations 133 5.6.1 a. Alternative use for compost/digestate 136 5.6.2 b. Compost/digestate must be disposed of 138 5.6.3 c. Reduction of compost/biogas production 141 5.6.4 d. Alternative products used 141 5.6.5 e. Alternative input material used 145 5.6.6 f. Alternative waste management for input material 148 5.6.7 g. Specific processes to reduce contaminants in compost/digestate 158
5.7 Conclusions on the most appropriate (combination of) risk management options 166 5.7.1 Justification of risk management at EU-level 166 5.7.2 Comparison of the assessed risk management options 167 5.7.3 Legal options 180
Table 2.1 List of stakeholders contacted and status of their response 19 Table 2.2 Assumptions used to estimate digestate production from biogas production 22 Table 2.3 Estimated quantity of compost in the EU28 by feedstock used, in tonnes 24 Table 2.4 Estimated quantity of digestate in the EU28 by feedstock used, in tonnes 29 Table 2.5 Typical use of different types of digestate according to the European Biogas Association 30 Table 2.6 Application of digestate as fertiliser according to the European Biogas Association 31 Table 3.1 Use and Evaluation of the Criteria “human toxicity” and “dangerous for the environment” 35 Table 3.2 Use and evaluation of the criterion “mobility in water bodies” 36 Table 3.3 List of substances recommended for further risk assessment 44 Table 4.1 Overview of specific priority substances and approach to assessing their risk 46 Table 4.2 Summary of key findings for exposure of cadmium via use of compost and digestates 49 Table 4.3 Summary of key findings for exposure of nickel via use of compost and digestates 51 Table 4.4 Summary of key findings for exposure of lead via use of compost and digestates 52 Table 4.5 Summary of key findings for exposure of copper via use of compost and digestates 54 Table 4.6 Summary of key findings for exposure of zinc via use of compost and digestates 55 Table 4.7 Summary of key findings for exposure of mercury via use of compost and digestates 57

15 © Wood Environment & Infrastructure Solutions UK Limited
February 2019
Doc Ref. 40039CL003i3
Table 4.8 Summary of key findings for exposure of bisphenol-A via use of compost and digestates 58 Table 4.9 Summary of key findings for exposure of DEHP via use of compost and digestates 60 Table 4.10 Summary of key findings for exposure of 17α-ethinylestradiol via use of compost and digestates 65 Table 4.11 Sensitivity of selected outputs in the assessment of HBCDD to the concentrations reported in composts and
digestates 66 Table 4.12 Summary of key findings for exposure of HBCDD via use of compost and digestates 67 Table 4.13 Sensitivity of selected outputs in the assessment of 2,3,7,8-TCDD to the concentrations reported in composts
and digestates 68 Table 4.14 Summary of key findings for exposure of 2,3,7,8-TCDD via use of compost and digestates 69 Table 4.15 Sensitivity of selected outputs in the assessment of 2,3,4,7,8-PCDF to the concentrations reported in
composts and digestates 77 Table 4.16 Summary of key findings for exposure of 2,3,4,7,8-PCDF via use of compost and digestates 78 Table 4.17 Summary of key findings for exposure of PCB-28 via use of compost and digestates 84 Table 4.18 Sensitivity of selected outputs in the assessment of nonylphenol to the concentrations reported in composts
and digestates 87 Table 4.19 Summary of key findings for exposure of nonylphenol via use of compost and digestates 89 Table 4.20 Summary of key findings for exposure of benzo[a]pyrene via use of compost and digestates 95 Table 4.21 Summary of key findings for exposure of chrysene via use of compost and digestates 96 Table 4.22 Summary of key findings for exposure of benz[a]anthracene via use of compost and digestates 97 Table 4.23 Summary of key findings for exposure of benzo[b]fluoranthene via use of compost and digestates 98 Table 4.24 Summary of key findings for exposure of indeno[123-c,d]pyrene via use of compost and digestates 98 Table 4.25 Summary of key findings for exposure of PFOA via use of compost and digestates 99 Table 4.26 Summary of key findings for exposure of PFOS via use of compost and digestates 100 Table 4.27 Summary of key findings for exposure of PFHxA via use of compost and digestates 102 Table 4.28 Summary of key findings for exposure of microplastics via use of compost and digestates 103 Table 5.1 Tonnages of compost/digestate from input materials for which generally higher or maximum concentrations
were reported for substances of concern 111 Table 5.2 Overview of concerns identified by use scenario 113 Table 5.3 Examples of measures other than concentration limits 118 Table 5.4 Overview of calculated safe limit values in compost and digestate and identified existing limit values 122 Table 5.5 Overview of identified existing limit values for substances were safe limits are not definable 123 Table 5.6 Overview of reduction of contaminants through specific anaerobic digestion, composting, or post-treatment
processes 127 Table 5.7 Overview of reduction of prioritised contaminants through specific upstream (i.e. before composting/AD)
processes and techniques 131 Table 5.8 Summary of socio-economic considerations for the main expected outcomes of potential risk management
options 134 Table 5.9 Alternative uses for compost 136 Table 5.10 Alternative uses for digestate 137 Table 5.11 Overview of likely waste management options and technical implications 138 Table 5.12 Market characteristics of composting 139 Table 5.13 Market characteristics of anaerobic digestion 140 Table 5.14 Summary of indicative sales price data on compost, digestate and synthetic fertilisers 143 Table 5.15 Summary of health and environmental risks associated with alternatives to compost/digestate 144 Table 5.16 Main implications of input material choice for anaerobic digestion and composting plants 145 Table 5.17 Examples of the nutrient content (kg/m3 fresh weight) of some input materials commonly used in anaerobic
digestion 146 Table 5.18 Examples of input material costs 147 Table 5.19 Overview of potential waste management for input materials from digestate and compost 149 Table 5.20 Comparison of cost of collection and disposal according to World Bank 2012 153 Table 5.21 Comparison of cost of collection and disposal according to Eunomia 2002 153 Table 5.22 Risks to the environment and health by disposal method 156 Table 5.23 Substances not prioritised for risk management 166 Table 5.24 Coverage of the prioritised contaminants by proposed combination of risk management options 168 Table 5.25 Summary comparison of proposed risk management options 169 Table 5.26 Safe limit values calculated in the risk assessment and likely share of compost and digestate currently
exceeding them 173
Figure 2.1 Estimated quantity of compost per country, in tonnes (only countries >100,000 tonnes shown) 23 Figure 2.2 Compost use distribution (%) weighted mean average over 14 major compost producing EU Member States,
according to JRC (2014) 26 Figure 2.3 Estimated quantity of digestate per country, in tonnes (only countries >1 million tonnes shown) 28 Figure 4.1 Summary life cycle of composts and digestates 48

16 © Wood Environment & Infrastructure Solutions UK Limited
February 2019
Doc Ref. 40039CL003i3
Figure 4.2 Sensitivity of selected outputs in the assessment of 17α-ethinylestradiol to the Koc input value: fresh water
sediment 62 Figure 4.3 Sensitivity of selected outputs in the assessment of 17α-ethinylestradiol to the Koc input value: diet of
worm-eating birds and mammals 62 Figure 4.4 Sensitivity of selected outputs in the assessment of 17α-ethinylestradiol to the log Kow input value: diet of
worm-eating birds and mammals 63 Figure 4.5 Sensitivity of selected outputs in the assessment of 17α-ethinylestradiol to the Koc input value: total daily
intake of humans 63 Figure 4.6 Sensitivity of selected outputs in the assessment of 17α-ethinylestradiol to the BCF input value: diet of fish-
eating birds and mammals 64 Figure 4.7 Sensitivity of selected outputs in the assessment of 2,3,4,7,8-PCDF to the vapour pressure input value: diet of
fish-eating birds and mammals 72 Figure 4.8 Sensitivity of selected outputs in the assessment of 2,3,4,7,8-PCDF to the vapour pressure input value: diet of
worm-eating birds and mammals 73 Figure 4.9 Sensitivity of selected outputs in the assessment of 2,3,4,7,8-PCDF to the log Kow input value: fresh-water
sediment 74 Figure 4.10 Sensitivity of selected outputs in the assessment of 2,3,4,7,8-PCDF to the log Kow input value: diet of fish-
eating birds and mammals 75 Figure 4.11 Sensitivity of selected outputs in the assessment of 2,3,4,7,8-PCDF to the log Kow input value: diet of worm-
eating birds and mammals 76 Figure 4.12 Sensitivity of selected outputs in the assessment of PCB28 to the Koc input value: diet of worm-eating birds
and mammals 79 Figure 4.13 Sensitivity of selected outputs in the assessment of PCB28 to the Koc input value: total daily intake for
humans 80 Figure 4.14 Sensitivity of selected outputs in the assessment of PCB28 to the BCF input value: diet of fish-eating birds
and mammals 81 Figure 4.15 Sensitivity of selected outputs in the assessment of PCB28 to the log Kow input value: total daily intake for
humans 82 Figure 4.16 Sensitivity of selected outputs in the assessment of PCB28 to the Koc input value: fresh-water sediment 83 Figure 4.17 Sensitivity of selected outputs in the assessment of nonylphenol to the log Kow input value: freshwater
sediment 86 Figure 4.18 Sensitivity of selected outputs in the assessment of nonylphenol to the log Kow input value: diet of worm-
eating birds and mammals 87 Figure 4.19 Sensitivity of selected outputs in the assessment of benzo[a]pyrene to the Koc input value: diet of worm-
and fish-eating birds and mammals 91 Figure 4.20 Sensitivity of selected outputs in the assessment of benzo[a]pyrene to the Koc input value: freshwater
sediment 93 Figure 4.21 Sensitivity of selected outputs in the assessment of benzo[a]pyrene to the Koc input value: human daily
intake 94 Figure 5.1 Overview of concentrations of contaminants found in compost and digestate and safe limits calculated in
the risk assessment 106 Figure 5.2 Response scenarios for all risk management options 133 Figure 5.3 Comparison of the cost of landfill and incineration, with and without their respective taxes, in several EU
Member States 154
Glossary 182 Bibliography 185
Appendix A Overview of market analysis data Appendix B Overview of further processing techniques for digestate Appendix C Evaluation matrix Appendix D Risk assessment supporting report

17 © Wood Environment & Infrastructure Solutions UK Limited
February 2019
Doc Ref. 40039CL003i3
1. Introduction
1.1 Purpose of this report
Wood Environment & Infrastructure Solutions UK Limited (‘Wood’) has been contracted by the European
Commission, DG Environment to provide services on ”Digestate and compost as organic fertilisers – Risk
assessment and risk management options” (reference FC/2015/0010- SR3 under Framework Contract
ENV.A.3/FRA/2015/0010). Wood is working in partnership with Peter Fisk Associates Limited (‘PFA’) and
Ramboll Environment & Health GmbH (‘Ramboll’), who are acting as subcontractors to Wood for the
purposes of this contract.
This is the final report for the project, which takes into account feedback from the project’s steering group on
a draft final report. The report contains the results of the project including the market analysis, substance
identification, risk assessment and risk management option analysis including analysis of alternatives and
their costs.
1.2 Objectives of the study
The contract aims to prepare an environmental and human health risk assessment and a risk management
options analysis (RMOA) to provide a sound basis for decision making on the need to propose any regulatory
measures to control the possible risks associated with compost and digestate (hereafter referred to as C/D)
used as fertiliser8. It will include a socio-economic analysis of the impacts of possible risk management
action, relating to placing on the market and use of digestate and compost as fertilising products.
The results will be presented in the format of an Annex XV dossier for REACH restriction, but they could also
be used for other regulatory actions. This format will allow the possible use of the results for potential input
to the Commission's impact assessment, in line with the Better Regulation Guidelines (2017). This flexibility is
required as the Commission decision on the preferred risk management option will depend (inter alia) on the
outcomes of the analysis, including the potential risks to the environment or human health identified.
1.3 Structure of this report
This report is structured as follows:
First, the approach and key results of the market analysis (Task 1) are presented in Section 2.
This includes tonnages of digestate and compost produced in the European Union, as well as
their uses and input materials used to produce them. Additional detailed results for specific
countries are shown in Appendix A, and additional information on further processing of
digestate in Appendix B.
The approach and key results of the identification of potential critical contaminants in C/D
(Task 2) are presented in Section 3. Additional detailed information on all substances identified
are contained in a separate spreadsheet Appendix C.
Then, Section 4 provides a summary of the approach to assessing the risks from priority
substances and chemical families to human health and the environment (Task 3). The key
findings for each individual assessed substance are presented and discussed. This summary
8 It should be noted that C/D, particularly compost, fulfil other functions than fertilisation, such as adding organic matter to the soil.
However, for simplicity we refer to the main function as fertiliser throughout the report, except where the specific function is relevant for
the analysis.

18 © Wood Environment & Infrastructure Solutions UK Limited
February 2019
Doc Ref. 40039CL003i3
information is intended to inform the prioritisation process within the risk management option
analysis. A full detailed report of the risk assessment is included in Appendix D.
Lastly, Section 5 identifies potential regulatory instrument for possible risk management
activities to address the concerns identified (Task 4). The risk management options are assessed
with regards to their effectiveness to control the risks. Socio-economic considerations are
assessed, including the costs and benefits of using potential alternative products and
techniques to reduce the risks from contaminants in C/D (Task 5). Based on this, conclusions
regarding the most appropriate (combination of) risk management options are drawn.

19 © Wood Environment & Infrastructure Solutions UK Limited
February 2019
Doc Ref. 40039CL003i3
2. Market analysis
2.1 Introduction
The task involves collecting available information on all uses and related tonnages of digestate and compost
in the European Union, as well as their input materials. Understanding the range of input materials,
intentional uses and associated volumes will provide a foundation for the study. It will be critical to assessing
environmental and human health risks (Task 3), considering available risk management options (Task 4) and
potential alternatives (Task 5).
2.2 Approach
2.2.1 Overview
Task 1 involves a combination of a targeted stakeholder consultation and a review of relevant literature and
statistical sources. The approach to each of these is described briefly below. Estimates of quantities of
compost/by country and by feedstock are derived based on a comparison of all available sources. All the
individual figures used to derive the final estimates are presented in Appendix A.
2.2.2 Consultation
Table 2.1 lists the stakeholders that were selected for this targeted consultation. The table also indicates
whether they provided a response.
Initial contact was made by telephone, in order to identify their likely willingness to provide information for
the study. A questionnaire was produced and agreed with the Commission. This questionnaire was sent to
the stakeholders by email. The Commission provided a letter of introduction to assist with the consultation.
This was sent to the stakeholders alongside the questionnaire. 16 March was set as the deadline for
submitting responses to the questionnaire, although useful responses were received until 9 April.
Table 2.1 List of stakeholders contacted and status of their response
Organisation name Type of organisation Response to questionnaire received?
European Biogas Association (EBA) Industry association
European Compost Network (ECN) Industry association
European Biomass Association (AEBIOM) Industry association Did not respond to questionnaire but
noted that the most relevant members
are also covered by EBA.
European Consortium of the Organic-Based
Fertilizer Industry (ECOFI)
Industry association
Biorefine Cluster Europe Industry association / academic
Dutch Waste Management Association Industry association
Jointly responded they are members of
ECN which will provide data covering the
Netherlands.
Dutch association of Biowaste processors Industry association
Orgaworld Company

20 © Wood Environment & Infrastructure Solutions UK Limited
February 2019
Doc Ref. 40039CL003i3
Organisation name Type of organisation Response to questionnaire received?
Attero Company
Italian Consortium of composting structures Industry association
European waste management industry (FEAD) Industry association
Bundesverband der Deutschen Entsorgungs-
Wasser- und Rohstoffwirtschaft (BDE)
Industry association
Flemish Coordination Centre for Manure
Processing (VCM)
Intermediary platform between the
government and the sector
Fédération Nationale des Activités de la
Dépollution et de l’Environnement (Fnade)
NGO
European Organic Fertilizers Manufacturers
Association (EUROFEMA)
Industry association
European Biomass Industry Association (EUBIA) Industry association
WRAP NGO
European Environmental Bureau (EEB) NGO Responded that ECN, which is a member
of EEB, will respond on their behalf.
Friends of the Earth NGO
Kompostierung Nord GmbH Company
2.2.3 Literature review
We commenced our analysis with a literature review focusing on well-known sources and associated uses of
C/D (above all, use as fertiliser). All data were collated along with the data received from the consultation to
allow further analysis, such as comparing data from different sources, calculating totals, identifying data gaps,
etc.
Once data gaps were identified after finalisation of the consultation, further targeted research was conducted
to achieve data coverage for each product category across the EU28 on:
Product quantity and value;
Use/application;
Quantity/percentages of input materials used; and
Production technique used.
We used both keyword searches on internet search engines as well as searching the sites of relevant industry
associations and Member State Authorities in several countries both in English and their respective
languages (e.g. German, French, Spanish, Czech). The specific literature sources used are presented along
with the associated results below.
2.2.4 Statistical sources
The following statistical sources were used in relation to compost:

21 © Wood Environment & Infrastructure Solutions UK Limited
February 2019
Doc Ref. 40039CL003i3
Eurostat material flow accounts for 2014 provide estimates per country of compost ‘supplied
by the national economy and taken up by the natural environment’.9 This provides a figure for
the quantity of compost applied in each country as of 2014 (the latest year for which data is
available), however it should be noted that the Eurostat figures are estimates and subject to
some uncertainty. Therefore, these figures are compared with other data/literature sources to
determine a final estimate of the tonnage of compost per country.
Eurostat data10 on sewage sludge disposed of as ‘compost and other applications'11 for
the last available year (2015 for most countries). For some countries data was not available
for any years. This includes Spain, which was known to produce significant amounts of sewage
sludge compost according to the literature review. Thus for Spain this gap was filled with data
from the Spanish Ministry of Agriculture, Fishing, Food and the Environment Statistical Year
Book 2016. The Eurostat data is provided separately for urban and other wastewater treatment
plants; these have been summed up. The sum across countries of sewage sludge disposed of as
‘compost and other applications' was used to estimate the tonnage of sewage sludge compost
produced in Europe, using the simplifying assumption of a 50% weight reduction from sludge
input to compost output12. Overall, this is likely an underestimate given that data was missing
for several countries. This is counteracted to some extent because weight reduction could be
larger than 50%.
The following statistical sources were used in relation to digestate:
Eurostat data on primary production of biogas in units of energy (Terajoule) for 201613.
The quantity of digestate produced as a result of this biogas production was estimated for each
country based on a set of assumptions (Table 2.2) using the following steps:
1. Converting the unit of energy from Terajoule (TJ) to kilowatt hours (kWh):
3.6 x 10⁻⁶TJ=1kWh.
2. Dividing the production of biogas in terms of energy (kWh) by an assumed energy
density of the biogas (kWh total energy per m3 of biogas, see Table 2.2) to yield the
corresponding volume (m3) of biogas.
3. Estimating the quantities of input material (feedstock) used to produce these volumes of
biogas. This is done by dividing the volumes of biogas (m3) by an assumed m3 biogas
yield per tonne of input material (see Table 2.2).
4. Estimating the quantity of digestate produced from the anaerobic digestion (AD) of
these quantities of input material. This is done by multiplying the tonnes of input
material with an assumed factor of Tonnes digestate yield per tonne of input material
(see Table 2.2).
Three estimates were produced for each country, showing the likely lowest possible and
highest possible quantity of digestate resulting from the biogas production covered by the
Eurostat data, as well as a central estimate reflecting what we judge to be the most likely
assumptions.
9 Eurostat: Material flow accounts - domestic processed output [env_ac_mfadpo] 10 Eurostat: Sewage sludge production and disposal [env_ww_spd] 11 This refers to “all application of sewage sludge, after mixing with other organic material and composting, as fertilizer in parks,
horticulture etc.” according to the underlying questionnaire available at:
http://ec.europa.eu/eurostat/ramon/coded_files/OECD_ESTAT_JQ_IWA_Master.xls 12 This is roughly the ratio of compost weight to feedstock weight suggested by the market data submitted by the European Compost
Network in their response to the consultation of this project. 13 Eurostat: Supply, transformation and consumption of renewable energies - annual data [nrg_107a]

22 © Wood Environment & Infrastructure Solutions UK Limited
February 2019
Doc Ref. 40039CL003i3
Table 2.2 Assumptions used to estimate digestate production from biogas production
Assumption for
each step
Lower
estimate
Central
estimate
Upper
estimate
Source:
kWh total energy
per m3 of biogas
(step 2)
5.0 5.5 7.5 Fachverband Biogas e. V.: BIOGAS CAN DO IT Facts, arguments
and potentials, 2011, http://european-biogas.eu/wp-
content/uploads/files/2013/10/broschre_2011_en_versandversi
on.pdf.
m3 biogas yield per
tonne of input
material
(step 3)
25 250 600
Lemvig Biogas Handbook:
http://www.lemvigbiogas.com/BiogasHandbook.pdf
NNFCC anaerobic digestion information portal:
http://www.biogas-info.co.uk/about/feedstocks/
Lower estimate refers to manures, upper estimate to grains
(e.g. maize, barley), and central estimate is roughly the middle
of organic waste and grain (e.g. maize), presumably the main
input materials in most countries.
Tonnes Digestate
per tonne of input
material
(step 4)
0.83 0.84
0.85 Lower: EBA consultation response
Central: Midpoint between lower and upper
Upper: WRAP: Enhancement and treatment of digestates from
anaerobic digestion, 2012,
http://www.wrap.org.uk/sites/files/wrap/Digestates%20from%2
0Anaerobic%20Digestion%20A%20review%20of%20enhancem
ent%20techniques%20and%20novel%20digestate%20products
_0.pdf.
Source: Wood 2018 based on the sources listed in the last column.
2.3 Results
2.3.1 Overview
This section presents the results of the market analysis, first for compost, then for digestate. For both, an
overview of the following is provided:
Total tonnage produced in the EU in total and in each Member State;
A breakdown of EU tonnage by feedstock (i.e. the materials used in the composting/anaerobic
digestion that produced the compost/digestate); and
Details of common uses, including further processing of compost/digestate and details of how
the final products are applied (e.g. application rate as fertiliser).
2.3.2 Compost
Total quantities
DG JRC’s technical proposals on end-of-waste criteria for biodegradable waste subjected to biological
treatment (hereafter referred to as “JRC (2014)”) estimated that 14.4 million tonnes of compost were
produced in the EU28 (based on country-specific estimates relating to various years between 2005 and
200914). Eurostat material flow accounts15 provide an estimate of 17.9 million tonnes of compost ‘supplied by
14 The JRC (2014) calculates the EU total as the sum of country-specific figures for EU Members. The country figures relate to different
years for different countries (2005 for France, 2008 for Germany, etc.), all of which were between 2005 and 2009. Hence, the sum cannot
be attributed to a specific year, but is a combination of country estimates relating to years between 2005 and 2009. 15 Domestic processed output indicates the amounts of materials supplied by the national economy and taken up by the natural
environment.

23 © Wood Environment & Infrastructure Solutions UK Limited
February 2019
Doc Ref. 40039CL003i3
the national economy and taken up by the natural environment’ in the EU28 in 2014. The response to the
targeted stakeholder consultation for this project from the European Compost Network (ECN) indicated that
12.1-16.2 million tonnes of compost are produced in the EU28. However, ECN noted that this does not cover
sewage sludge compost. Based on sewage sludge disposal data from Eurostat we estimate the EU production
of sewage sludge compost to be in the order of 0.8 million tonnes.
As a result, we estimate that the current annual EU production of compost amounts to at least some 13
million tonnes (at least 12.1 million tonnes according to ECN plus 0.8 million tonnes of sewage sludge
compost, rounded to the closest 1 million tonnes). We further estimate that at most 18 million tonnes of
compost are produced annually (according to Eurostat material flow accounts, the highest figure suggested
by any source)16. As a central estimate, our analysis suggests that about 17.3 million tonnes of compost
are produced in the EU per year. This is the sum of estimates for each EU Member State, which are
presented in more detail in Appendix A.
The largest compost producer in the EU is Germany with 4.3 million tonnes, followed by the UK (ca 2.8
million tonnes), France (2.5 million tonnes) and Italy (ca 2.2 million tonnes). An overview of estimated
compost production (including ranges where available) for each country over 100,000 tonnes is shown in
Figure 2.1.
Figure 2.1 Estimated quantity of compost per country, in tonnes (only countries >100,000 tonnes shown)
Source: Wood 2018 based on various data sources (see Appendix A for more details)
16 It should be noted that Eurostat material flow accounts refer to application of compost, not production. However, given the relatively
low value per weight of compost, it is reasonable to assume that compost is applied in relatively close proximity to where it is produced
and international trade of compost is low. Hence, most of the compost applied in the EU is expected to be produced in the EU and vice
versa.
24 © Wood Environment & Infrastructure Solutions UK Limited
February 2019
Doc Ref. 40039CL003i3
Feedstocks
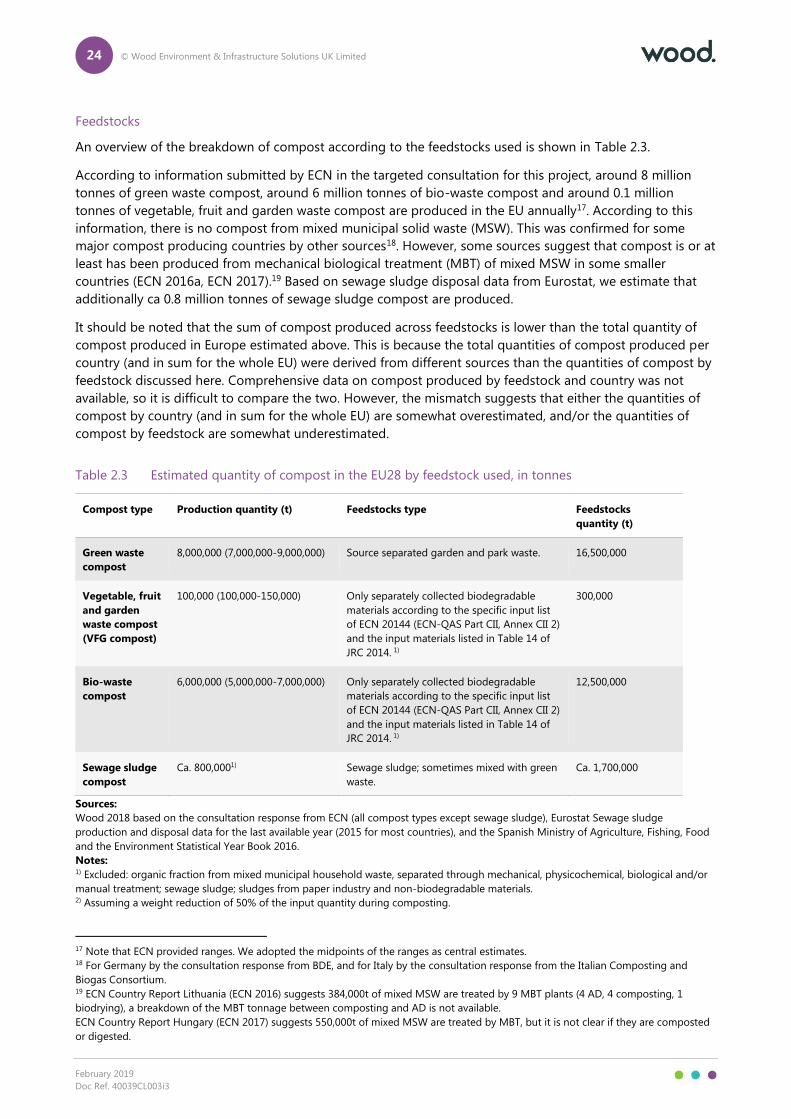
An overview of the breakdown of compost according to the feedstocks used is shown in Table 2.3.
According to information submitted by ECN in the targeted consultation for this project, around 8 million
tonnes of green waste compost, around 6 million tonnes of bio-waste compost and around 0.1 million
tonnes of vegetable, fruit and garden waste compost are produced in the EU annually17. According to this
information, there is no compost from mixed municipal solid waste (MSW). This was confirmed for some
major compost producing countries by other sources18. However, some sources suggest that compost is or at
least has been produced from mechanical biological treatment (MBT) of mixed MSW in some smaller
countries (ECN 2016a, ECN 2017).19 Based on sewage sludge disposal data from Eurostat, we estimate that
additionally ca 0.8 million tonnes of sewage sludge compost are produced.
It should be noted that the sum of compost produced across feedstocks is lower than the total quantity of
compost produced in Europe estimated above. This is because the total quantities of compost produced per
country (and in sum for the whole EU) were derived from different sources than the quantities of compost by
feedstock discussed here. Comprehensive data on compost produced by feedstock and country was not
available, so it is difficult to compare the two. However, the mismatch suggests that either the quantities of
compost by country (and in sum for the whole EU) are somewhat overestimated, and/or the quantities of
compost by feedstock are somewhat underestimated.
Table 2.3 Estimated quantity of compost in the EU28 by feedstock used, in tonnes
Compost type Production quantity (t) Feedstocks type Feedstocks
quantity (t)
Green waste
compost
8,000,000 (7,000,000-9,000,000) Source separated garden and park waste. 16,500,000
Vegetable, fruit
and garden
waste compost
(VFG compost)
100,000 (100,000-150,000) Only separately collected biodegradable
materials according to the specific input list
of ECN 20144 (ECN-QAS Part CII, Annex CII 2)
and the input materials listed in Table 14 of
JRC 2014. 1)
300,000
Bio-waste
compost
6,000,000 (5,000,000-7,000,000) Only separately collected biodegradable
materials according to the specific input list
of ECN 20144 (ECN-QAS Part CII, Annex CII 2)
and the input materials listed in Table 14 of
JRC 2014. 1)
12,500,000
Sewage sludge
compost
Ca. 800,0001) Sewage sludge; sometimes mixed with green
waste.
Ca. 1,700,000
Sources:
Wood 2018 based on the consultation response from ECN (all compost types except sewage sludge), Eurostat Sewage sludge
production and disposal data for the last available year (2015 for most countries), and the Spanish Ministry of Agriculture, Fishing, Food
and the Environment Statistical Year Book 2016.
Notes: 1) Excluded: organic fraction from mixed municipal household waste, separated through mechanical, physicochemical, biological and/or
manual treatment; sewage sludge; sludges from paper industry and non-biodegradable materials. 2) Assuming a weight reduction of 50% of the input quantity during composting.
17 Note that ECN provided ranges. We adopted the midpoints of the ranges as central estimates. 18 For Germany by the consultation response from BDE, and for Italy by the consultation response from the Italian Composting and
Biogas Consortium. 19 ECN Country Report Lithuania (ECN 2016) suggests 384,000t of mixed MSW are treated by 9 MBT plants (4 AD, 4 composting, 1
biodrying), a breakdown of the MBT tonnage between composting and AD is not available.
ECN Country Report Hungary (ECN 2017) suggests 550,000t of mixed MSW are treated by MBT, but it is not clear if they are composted
or digested.

25 © Wood Environment & Infrastructure Solutions UK Limited
February 2019
Doc Ref. 40039CL003i3
For comparison, JRC (2014) estimated 6.7 million tonnes of green waste compost, 4.7 million tonnes of bio-
waste compost, 1.6 million tonnes of sewage sludge compost, and 1.4 million tonnes of mixed waste and
“Other” compost (based on country-specific estimates relating to various years between 2005 and 2009). This
suggests that the production of green waste and bio-waste compost have increased since the period the JRC
(2014) figures refer to, while the production of sewage sludge compost has decreased. It is not clear how the
categories mixed waste and “Other” compost from JRC (2014) relate to the categories provided by ECN in the
consultation for this study.

26 © Wood Environment & Infrastructure Solutions UK Limited
February 2019
Doc Ref. 40039CL003i3
Use/application
JRC (2014) provided the use distribution (%) across 10 uses20 for 14 major compost producing countries
relating to the years 2005-200921. The weighted mean average across these countries (weighted by tonnes of
compost production per country) is shown in Figure 2.2. This suggests that the majority (ca. 85%) of
compost was used as a fertiliser or soil improver in agriculture, gardening, horticulture and
landscaping.
Figure 2.2 Compost use distribution (%) weighted mean average over 14 major compost producing EU
Member States, according to JRC (2014)
Source: Based on DG JRC: Technical proposals on end-of-waste criteria for biodegradable waste subjected to biological treatment, 2014.
In their response to the consultation for this project, ECN listed the following uses of compost in Europe:
Organic fertiliser and soil improver in agriculture and organic farming at a typical application
rate of 6-10 tonnes per hectare per year;
Soil improver for horticultural purposes, for landscaping purposes and in hobby gardening; and
Mixing compound in growing media.
While our analysis could not provide a full quantitative breakdown of uses at an EU-level, it confirms the
main uses quoted by JRC (2014) and the ECN consultation response:
The consultation response of the BDE (German Waste, Water and Raw Materials Management
Industry Association) stated that in Germany green waste and biowaste compost were used as
organic fertiliser and soil improver; mixing compound in growing media; sewage sludge
20 Agriculture, horticulture & green house production, landscaping, blends, soil mixing companies, wholesalers, hobby gardening, land
restoration and landfill cover, export, others. 21 The country figures relate to different years for different countries (2005 for France, 2008 for Germany, etc.), all of which between 2005
and 2009. Hence, the average calculated in the following cannot be attributed to a specific year, but is a combination of country
estimates relating to years between 2005 and 2009.

27 © Wood Environment & Infrastructure Solutions UK Limited
February 2019
Doc Ref. 40039CL003i3
compost was used in agriculture; while residues from the mechanical and biological treatment
of mixed solid waste are mainly used for energy generation or they are disposed of in landfills.
The ECN country report for Germany suggests the following breakdown of compost uses in
2014: 59% Agriculture, 19% Soil manufactory, 8% Landscaping/recultivation, 7% Hobby
gardening, 7.1% other.
The consultation response of the Italian Composting and Biogas Consortium provided a
detailed breakdown of uses per compost type for Italy:
Green waste compost: Soil improver for plant nursery (68%), Fertiliser for agriculture (27%),
Maintenance of parks and gardens (3%), Fertiliser for domestic use (2%);
Bio-waste compost: Fertiliser for agriculture (72%), Fertiliser for horticulture (15%), Soil
improver for plant nursery (4%), Soil improver for other usages (3%), Fertiliser for domestic
use (3%), Other (3%);
Sludge compost: Fertiliser for agriculture (95%), Fertiliser for horticulture (3%), Fertiliser for
fruit growing (2%);
The ECN country report for the UK provides the following breakdown of compost uses in 2012:
Agriculture (68%), Horticulture (12%), Landscaping (9%), Landfill restoration (3%), Other (8%).
Note that other ECN country reports did not include breakdowns of compost use.
2.3.3 Digestate
Total quantities
JRC (2014) estimated that 56 million tonnes of digestate were produced in the EU in 2010. In 2013, a position
paper from the biogas industry suggested that around 80 million tonnes of digestate were generated in
Europe (Fachverband Biogas, EBA & BiPRO 2013). The response from the European Biogas Association (EBA)
to the consultation in this project stated that no definitive data on digestate production were available, but
for agricultural digestate (the largest category) they expect at least a yearly 60 million tonnes of fresh mass in
Germany (the biggest EU producer) and around double that amount (i.e. 120 million tonnes) for the whole
EU. This reflects strong growth in anaerobic digestion in Europe over the last decade. This is roughly
consistent with Eurostat data that suggests the production of biogas almost doubled from 2010-2016.22 We
estimate that about another 56 million tonnes of digestate (in addition to agricultural digestate), are
produced from other sources. This is based on several country-specific information sources and data on the
digestion of material from municipal solid waste (MSW) submitted by EBA (see Appendix A for more details).
As a result, our analysis suggests that in the order around 180 million tonnes of digestate are
produced in the EU28 per year. The largest digestate producer in the EU is Germany with around 87 million
tonnes, followed by the Italy (up to 30 million tonnes) and the UK (ca 19 million tonnes). An overview of
estimated digestate production (including ranges where available) for each country over 1 million tonnes is
shown in Figure 2.3. More detail on the estimates for each country is provided in Appendix A.
22 This refers to the production of Biogas in the EU28 measured in terms of energy (Joule), which increased by 91% from 2010-2016.
Source: Eurostat: Supply, transformation and consumption of renewable energies - annual data [nrg_107a]

28 © Wood Environment & Infrastructure Solutions UK Limited
February 2019
Doc Ref. 40039CL003i3
Figure 2.3 Estimated quantity of digestate per country, in tonnes (only countries >1 million tonnes shown)
Source: Wood 2018 based on various data sources (see Appendix A for more details)
Feedstocks
An overview of the breakdown of digestate according to the feedstocks used is shown in Table 2.4.
According to information submitted by EBA to the targeted consultation for this project, around 120 million
tonnes of agricultural digestate are produced in the EU annually. EBA further indicated that 55 million tonnes
of organic material is mechanically extracted from municipal solid waste (MSW) and then digested. Based on
the typical weight reduction from feedstock to digestate during the anaerobic digestion process, we estimate
that this results in roughly 46 million tonnes of digestate23. No EU-level data on digestate from other
feedstocks was available. However, country-specific data (see Appendix A) suggest at least 7 million tonnes
of digestate from source-separated municipal bio-waste, 1.7 million tonnes from sewage sludge and another
1.7 million tonnes from agroindustry by-products across the EU.
23 The resulting amount of digestate was estimated as follows: The tonnage of feedstocks was multiplied by 0.84, the midpoint between
the mass reductions from feedstock to digestate suggested by the EBA consultation response and WRAP 2012.

29 © Wood Environment & Infrastructure Solutions UK Limited
February 2019
Doc Ref. 40039CL003i3
Table 2.4 Estimated quantity of digestate in the EU28 by feedstock used, in tonnes
Digestate type Productio
n quantity
(t)
Feedstocks type Feedstock
s quantity
(t)
Digestate from source
separated biowaste from
MSW
At least
7,000,000
Commonly biodegradable kitchen waste from individual housing, restaurants,
caterers, offices, canteens, hospitals and schools.
In some municipalities, organic material from landscaping may be used such
as grass clippings.
8,300,000
Digestate from organic
fraction of mixed MSW
Ca.
46,000,000
Organic fraction mechanically extracted from MSW. 55,000,000
Agricultural digestate Ca.
120,000,00
0
The most common inputs are one or a mixture of the following: livestock
manure; energy crops*, cover crops or secondary crops for energy use
(triticale, miscanthus), straw left over from harvest.
Other in-farm organic residues are not expected to be used in significant
amounts.
144,000,00
0
Sewage sludge digestate At least
1,700,000
Sewage sludge.
In a few cases source separated biowaste from nearby MSW may be added.
2,000,000
Digestate from
agroindustry by-
products
At least
1,700,000
A large proportion of sewage water from households and commerce in urban
areas is digested. Industrial sludge may be treated alongside urban sludge or
separately.
2,000,000
Total Ca.
176,400,0
00
Ca.
211,300,0
00
Sources:
Wood 2018 based on the consultation response from EBA (Input material types, production quantity of agricultural digestate, feedstock
quantity from organic fraction of mixed MSW), as well as country-specific sources relating to anaerobic digestion of source separated
bio-MSW, sewage sludge and agroindustry by-products (see Appendix A for more details). Where only the quantity of feedstocks was
available it was assumed the resulting weight of digestate was 84% of the feedstock weight, based on the consultation response from
EBA and WRAP 2012.
Notes:
* Plants grown with the specific purpose of being used for energy generation (e.g. to produce biogas or biofuel), mostly maize.
Use/application
According to JRC (2014), 95% of digestate was used directly in the agricultural sector as a liquid fertiliser.
While no comprehensive updated data on the tonnages or percentages of digestate used for which
applications was available, our analysis suggests that still the vast majority of digestate is used directly as
fertiliser:
According to the French Environment and Energy Management Agency (2014), in Germany
100% of agricultural digestate (by far the largest type of digestate in Germany), 30% of sewage
sludge digestate, and 0% of digestate from mechanical biological treatment (mixed waste) are
used as a fertiliser. In Sweden, only 24% of sewage sludge digestate (by far the largest type of
digestate in Sweden), but almost all other digestate is used as fertiliser.24
EBA (2015) notes that in Italy, agricultural digestate is generally directly applied as a fertiliser.
Food and green waste compost in Italy are separated into solid and liquid fractions. The solid
24 This suggests in Sweden the general statement that the majority of digestate is used as fertiliser does not hold true. This is due to the
fact that most digestate in Sweden comes from sewage sludge, which according to the EBA is a type of digestate rarely used as fertiliser
(see Table 2.5). However, over the whole EU sewage sludge digestate makes up only a small part of the total digestate produced (see
Table 2.4).

30 © Wood Environment & Infrastructure Solutions UK Limited
February 2019
Doc Ref. 40039CL003i3
fraction is composted and then used as soil improver, while the liquid fraction is either
recirculated in the plant or treated in wastewater treatment plants.
WRAP (2015) reports that in the UK the majority of agricultural digestate is spread on the land
of the producers or of their neighbours, while other plants had greater challenges finding
suitable markets for digestate.
CBS (2012) suggests that in the Netherlands 82% of digestate produced in 2011 were used in
agriculture (while most of the rest was exported).
According to the ECN country report for Flanders, the market for digestate products there is
mainly focused on agriculture.
EBA provided information on the typical use of digestate from each feedstock category, which is
presented in Table 2.5. This suggests that digestate from agricultural sources, source separated biowaste and
agroindustry by-products is predominantly used as organic fertiliser and soil improver in agriculture,
horticulture and more rarely hobby gardening. Digestate from mixed MSW and sewage sludge is incinerated
or landfilled in most countries, although it is not clear if it is used as fertiliser anywhere.
Table 2.5 Typical use of different types of digestate according to the European Biogas Association
Digestate type Typical use
Digestate from source
separated biowaste from
MSW
“Organic fertiliser and soil improver for use in agriculture, horticulture and in some cases hobby
gardening.
Whole digestate from biowaste may be liquid enough to pump, although many of the last
generation plants carry out efficient dry digestion or in some cases batch digestion systems with
around 70% water content or less (not pumpable). In some countries such as Italy, it is require[d] to
post-compost it. This kind of digestate is usually spread in the same way as a compost.”
Digestate from organic
fraction of mixed MSW
“In most cases and across most European countries this digestate is not used on land, [but]
generally either incinerated or landfilled. “
Agricultural digestate “Organic fertiliser and soil improver for use in agriculture, horticulture and in some cases hobby
gardening.”
Sewage sludge digestate “[…] In the vast majority of EU countries treated sludge is not spread either on land. […]
Concentrated solids of sludge [are] usually incinerated or landfilled.”
Digestate from agroindustry
by-products
“Organic fertiliser and soil improver for use in agriculture, horticulture and in some cases hobby
gardening.
The dry matter content of the digestate varies significantly depending on the product, from high
water content sludge to more solid materials similar to digestate from source separated biowaste.
The method for spreading will vary accordingly. “
Source: EBA response to the consultation in this project (2018).
Furthermore, EBA provided details on the spreading and application of digestate as fertiliser, which is
reported in Table 2.6. The explanations refer to agricultural digestate, but EBA indicated that “most of the
explanation below on digestate use/spreading also applies to other suitable types of digestate, including
from agro-industrial by-products and sourced separated biowaste”. Notably, EBA suggest that digestate is
mostly used in close proximity to where it is produced. It is mostly injected directly into the soil and
application rates vary across EU countries between 10m3 and 40m3 per hectare. EBA also suggests that some
digestate is not applied as whole digestate (i.e. directly from the biogas plant), but is treated further. A brief
overview of further treatment techniques is provided in Appendix B.

31 © Wood Environment & Infrastructure Solutions UK Limited
February 2019
Doc Ref. 40039CL003i3
Table 2.6 Application of digestate as fertiliser according to the European Biogas Association
Application/spreading of agricultural digestate as fertiliser
(also applies to other suitable types of digestate, including from agro-industrial by-products and source separated biowaste)
“Agricultural digestate is liquid in most cases (usually 70-90% water content), particularly due to the use of important quantities of
manure (itself usually 90-96% liquid). The equipment used to apply digestate is mostly the same as for spreading raw slurry. It is
essential to choose machinery that minimises digestate’s exposure to air by injecting it rapidly into the soil, as this prevents nitrogen
losses through ammonia volatilisation. Therefore, inefficient and polluting methods such as splash plate spreading should be avoided.
Instead, digestate should be best applied through trailing hoses, trailing shoes or by direct injection into the topsoil.
Most of the material is spread as whole digestate (i.e. as it comes out of a biogas plant) containing all input nutrients, micro nutrients,
organic matter and water. In some cases digestate can be further treated to match specific needs, including: separation into liquid
and solid fractions (well established); drying (also established); ammonia striping (also used) micro filtration (tested and promising);
precipitation (tested in waste water treatment sector and promising in agriculture).
Application doses of digestate are very variable, depending largely on mineral concentration of the mixture and plant demand.
Generally whole digestate is bulky due to high water content, therefore it is advised to spread it locally as much as possible. For
example, in Austria the maximum quantity allowed per hectare for a year is 25m3. Generally application varies in EU countries
between 10-40m3. If manure based digestate is spread on a Nitrate Vulnerable Zone a limit has to be respected, usually 170kg.
National interpretations vary on what is considered ‘manure’.”
Source: EBA response to the consultation in this project (2018).

32 © Wood Environment & Infrastructure Solutions UK Limited
February 2019
Doc Ref. 40039CL003i3
3. Substance identification
3.1 Introduction
Digestate and compost may contain contaminants with different hazardous properties. The objective of this
task is to identify potential critical contaminants in C/D for the subsequent risk assessment and risk
management options analysis (RMOA). Critical substances or substances of concern are, in general terms,
substances which can have negative effects on human health or the environment. Many different hazardous
substances could potentially be present in C/D, depending on the input materials. Thus, it is necessary to
develop criteria to decide whether a substance (or a group of similar substances) present in compost or
digestate should be further investigated, i.e. a quantitative/qualitative risk assessment and RMOA.
3.2 Approach
The initial stage of Task 2 aimed to identify substances of concern for further risk assessment. In order to
provide an overview of the substances reported as contaminants in C/D, an information database including
information from relevant scientific literature was generated. A matrix was created to collect all potentially
relevant information. The matrix identified substances and further relevant information such as the type of
material in which the substance was found or the technology applied for producing compost or digestate, as
well as assessment criteria according to which a substance or substance group can be identified as a
substance of concern. These criteria include “presence in specific substance lists”, “human toxicity”,
“environmental toxicity”, “harmonised classification”, “mobility in water bodies”, “concentration found in
compost/digestate”, “intrinsic properties” and “limit values exceeded”. More details related to the assessment
criteria are provided below.
The matrix was populated with information from scientific literature regarding the substances themselves,
their presence in certain types of compost and their characteristics. The identification of relevant literature is
described in the following:
Relevant information was extracted from JRC (2014), which served as the main starting point for
the identification of the contaminants in digestate and compost. This included substance
groups, single substances and their allocated substance category; compost/digestate types in
which relevant substances occur; measured concentrations; and any existing limit values. Also,
the information from other relevant literature cited in the JRC report was extracted if
considered relevant. In addition, conclusion chapters and the overall conclusion of the JRC
report were screened for statements on the relevance of each substance group / single
substances regarding the risks from contaminants in compost or digestate.
Further literature listed in the service request for this project was evaluated and all relevant
information was extracted in accordance with the approach used for the assessment of the JRC
report (above). This was also added to the matrix.
Further research was conducted to collect additional potentially-relevant scientific publications.
As the JRC report only covers literature up to 2014, the research focused on publications from
2013 to present. This approach was used so that the most recent insights regarding
contaminants in C/D were considered. Screened databases included GoogleScholar
(https://scholar.google.de/), ScienceDirect (https://www.sciencedirect.com/), SpringerLink
(https://link.springer.com/) and PubMed (https://www.ncbi.nlm.nih.gov/pubmed). Furthermore,
homepages of associations and networks were screened for publications comprising

33 © Wood Environment & Infrastructure Solutions UK Limited
February 2019
Doc Ref. 40039CL003i3
information related to contaminants in C/D (e.g. European Compost Network, Bio Refine and
European Biogas Association).25
Information provided via the stakeholder survey conducted in task 1 was also considered.
After having collected relevant information on substances identified in compost or digestate, the substances
were evaluated according to the following methodology:
The evaluation was carried out in three steps. Step 1 consisted of the identification of substances classified as
hazardous under various regulatory lists. These are explained below:
ECHA’s Authorisation list (REACH Annex XIV)26 features Substances of Very High Concern
(SVHC) for which the objective is to ensure a progressive replacement by less dangerous
substances or technologies where technically and economically feasible alternatives are
available. Identification of these substances includes a 45-day public consultation process. Once
a substance is identified as an SVHC, it is included in the Candidate list27. ECHA then
recommends priority substances from this Candidate list to be included in the Authorisation
list. These substances are listed in the “Recommendation list28” which is reviewed by the
European Commission to decide which substances are to be included in the Authorisation list
and what the respective entries should be.
The Stockholm Convention on Persistent Organic Pollutants (POP’s)29 is an international
treaty to protect human health and the environment from persistent and bioaccumulative
hazardous chemicals. The production and use of substances featured in Annex A of the
convention must be eliminated and/or prohibited by the participating parties, as well as their
import and export. Annex B lists substances that must be restricted in their production, use,
import and export, and Annex C features substances whose release through their unintentional
production should be eliminated.
The Water Framework Directive30, adopted in 2000, sets requirements for the protection of
surface and ground water. It aims to ensure good ecological and chemical status of water
bodies. Within the scope of this directive, a list of 33 chemicals (priority substance list) has been
published whose levels in water bodies is used to evaluate their status. Environmental quality
standards for these substances were set in 2008. Additionally, 8 pollutants for which
environmental quality standards have been set in the Environmental Quality Standards
Directive, but which are not included in the priority substances list, have also been added.
Substances under REACH Annex XVII31 are substances whose marketing and/or use and
release is restricted because they pose a risk to human health or the environment. The list also
includes mixtures and substances in articles that do not require registration, and shows the
respective restrictions for each substance.
The Substitute It Now (SIN) list32 includes hazardous chemicals whose substitution is a
priority. Its aim is to put pressure on legislators to set restrictions on the substances with the
highest level of concern before restrictions under REACH come into place. It aims to speed up
25 Homepages of associations and networks were mainly searched on European level only (except for UK and DE). However, all MS which
produced 500.000 t compost or more (DE, UK, FR, IT, NL, ES, PL, BE) were covered in the literature research regarding measurement
data. 26 https://echa.europa.eu/authorisation-list 27 https://echa.europa.eu/candidate-list-table (REACH list of SVHC intentions: https://echa.europa.eu/registry-of-svhc-intentions) 28 https://echa.europa.eu/previous-recommendations 29 http://chm.pops.int/TheConvention/ThePOPs/AllPOPs/tabid/2509/Default.aspx 30 http://ec.europa.eu/environment/water/water-framework/priority_substances.htm 31 https://echa.europa.eu/substances-restricted-under-reach 32 http://sinlist.chemsec.org

34 © Wood Environment & Infrastructure Solutions UK Limited
February 2019
Doc Ref. 40039CL003i3
the substitution of hazardous chemicals and offers a tool for companies to identify which
chemicals to avoid in their processes.
The Minamata Convention is an international treaty to protect human health and the
environment from the adverse effects of mercury. It specifically targets this metal, but was also
considered as part of the assessment (Minamata 2019).
The Fertiliser Regulation Proposal regulates the marketing of fertilising products by setting
guidelines and restrictions on their composition in terms of hazardous substances (European
Commission 2016a).
The lists mentioned above were used in Step 1 for the assessment of the identified chemicals. Substances
included in either REACH Annex XIV, the Recommendation list or the Candidate list, as well as those listed as
persistent organic pollutants (POP’s Annex A, B or C) in the Stockholm convention, were marked in red and
classified as potential critical substances. If the substance appeared in more than one of REACH’s lists for
substances of very high concern (REACH Annex XIV, the Recommendation list and the Candidate list), only
one red marking was assigned to avoid overestimating its priority, since substances in Annex XIV are also
listed in the Recommendation list and the Candidate list, and substances in the Recommendation list are also
listed in the Candidate list. Substances listed in the Restriction list (REACH Annex XVII), in the Water
Framework Directive or in the Fertiliser Regulation Proposal were marked in yellow. Additionally, mercury
(Hg) was included in this category in line with the stipulations of the Minamata Convention. This classification
encompassed substances that could also be considered of concern, but for which other criteria needed to be
considered for a decision on prioritisation.
Step 2 of the evaluation addressed the toxicity of each substance in terms of its effects on human health and
on the environment. These two categories were evaluated separately. ECHA’s classification and labelling
(C&L) Inventory was used for this purpose. Substances with a harmonized classification were assigned to the
“Red,” “Yellow,” or “Green” categories according to the hazard statements shown in this inventory and the
classification criteria shown in Table 3.1 below (UBA 2017).
Additionally, substances proven to be endocrine disruptors were assigned to the “Red” category for human
toxicity and substances classified as persistent, bioaccumulative, toxic/very persistent, very bioaccumulative
(PBT/vPvB) were assigned to the “Red” category for environmental toxicity33. ECHA’s Annex 15 to the final
report on endocrine disruptors (BKH Consulting Engineers 2000) was used to identify proven endocrine
disruptors, while information about PBT/vPvB substances was obtained from the registration dossier of each
substance available in ECHA’s inventory. Also, all substances listed under the Stockholm’s convention POP’s
lists were marked as PBT substances with long range transport (LRT) potential. This information on
persistency was highlighted in red letters in the substance matrix.
33 Chronic effects were identified as especially important criteria to assess the potential concern of substances identified in compost.
They were addressed through the C&L inventory hazard statements and through PBT/vPvB classifications. All priority 1 and 2
substances showed chronic effects on human health and/or on the environment, so putting more weight to chronic effects would not
change the ranking of priorities.

35 © Wood Environment & Infrastructure Solutions UK Limited
February 2019
Doc Ref. 40039CL003i3
Table 3.1 Use and Evaluation of the Criteria “human toxicity” and “dangerous for the environment”
USE AND EVALUATION OF THE CRITERION “HUMAN TOXICITY”
Evaluation RED YELLOW GREEN
Sub-criterion: Dangerous by
Inhalation, ingestion and eye
contact
Substance may cause severe
health damage
Substance may damage health Substance is not
dangerous to human
health
Indicator: Classification according
to CLP-regulation
H300, 330, 340, 350, 350i,
360, 360D, 360DF, 360F,
360FD, 361Fd, 362, 372,
EUH32
H301, 302, 304, 314, 318, 319,
331, 332, 334, 341, 351, 361,
361d, 361f, 361fd, 37013, 371,
373, EUH029 EUH031
No classification other
than “only” 335, 336
Sub-criterion: Dangerous upon
skin contact
Substance may cause health
damage if taken up via the
skin
Substance damages skin Substance has only light
effects on skin
Indicator: Classification according
to CLP-regulation
H310, 311, 314,
For Substances which may be
absorbed through to the
skin: 340, 341, 350, 351, 360,
360D, 360DF, 360F, 360FD,
361Fd, 361, 361f, 361fd, 370,
372
H312, 315, 317
For skin-penetrating
substances: 371, 373
No classification other
than “only” EUH066
Sub-criterion: Endocrine
disruption
Proven endocrine disruptive
substance (listed in Annex 15
of ECHA’s final report on
endocrine disruptors)
USE AND EVALUATION OF THE CRITERION “DANGEROUS FOR THE ENVIRONMENT”
Evaluation RED YELLOW GREEN
Sub-criterion: PBT/vPvB
properties
Substance is PBT/vPvB
substance
Based on available
information, it can be excluded
that the substance is a
PBT/vPvB substance*
Not a PBT/vPvB substance
Indicator: Information from
testing
Mention as PBT/vPvB-
substance on a list/ in the
SDB or implementation of
the PBT/vPvB-criteria
H410
Aquatic toxicity:
LC50 < 0.1 mg/l
There are no indications
that the substance is PBT
or vPvB
Sub-criterion: Aquatic toxicity The substance is highly
dangerous to the aquatic
environment
The substance is dangerous to
the aquatic environment
The substance is not
dangerous to the
environment
Classification according to CLP-
decree
H400, 410 H411, 412 and 413 No H-phrase beginning
with 4
*it is possible that a substance is inherently not degradable and has a LogKow of more than 4. These are indications that the
substance may be a PBT/vPvB. Further data is necessary for a comparison of the respective criteria (e.g. simulation test on
degradability and/or study defining a BCF); **The criteria are given in the Annex of the cited document.
Source: UBA 2017: Guide on Sustainable Chemicals, A decision tool for substance manufacturers, formulators and end users of
chemicals.

36 © Wood Environment & Infrastructure Solutions UK Limited
February 2019
Doc Ref. 40039CL003i3
Substances marked in yellow fulfilled at least one criterion of the “yellow” classification criteria but none for
the “red” classification. Finally, substances assigned to the “green” classification were those not considered to
be dangerous to human health or to the environment.
If a harmonised classification was not available, the classification group with the highest number of
notifications from the public was used instead. However, if different classifications were suggested for a
substance lacking a harmonised classification, then classifications other than the most notified one were also
considered - if they included information that might suggest that the substance is harmful and if it had a
relatively high number of notifications. Classifications with comparably few notifications from the public in
relation to the highest number of notifications were therefore not considered.
Step 3 considered further criteria for drawing a conclusive decision regarding the toxicity of the substances
investigated. This was done for all substances and considered each substance’s mobility in water bodies. This
property was addressed using the water solubility, which for most substances was obtained from the
registration dossier available on ECHA’s website. For those substances for which no registration dossier was
available, the water solubility was checked in other sources, including the US National Library’s Open
Chemistry database and published scientific literature. When available, experimental values were preferably
chosen, otherwise predicted or calculated values were used. Classification was done similarly to that of Step 2
but using the criteria shown below in Table 3.2.
Table 3.2 Use and evaluation of the criterion “mobility in water bodies”
USE AND EVALUATION OF THE CRITERION “MOBILITY IN WATER BODIES”
Evaluation RED YELLOW GREEN
Sub-criterion: Release potential in
water
High solubility Medium solubility Low solubility
Indicator: Solubility in water > 10 mg/l 1 – 0.001 mg/l < 1 g/l
Source: UBA 2017: Guide on Sustainable Chemicals, A decision tool for substance manufacturers, formulators and end users of
chemicals.
In addition, Step 3 considered whether concentrations of the substances found in compost/digestate exceed
defined or proposed limit values from regulations or guidelines. If limit values were exceeded this was
marked red in the matrix. Ranges or maximum values of the concentrations found in compost/digestate were
provided, where available. The matrix also specifies for each substance in which input materials, material
types (compost/digestate) and output materials the concentrations were measured.
In addition to these criteria, further considerations were also used to address the priority of the substances
identified. These were the reliability of sources, the measured concentration of the substances found in
compost/digestate material, the type of input material, and interpretations from the authors regarding the
relevance of the substance. If, for example, the author of one of the reviewed publications suggested that the
substance discussed could be of concern even if the criteria for high priority substances were not met, this
was noted and the substance was marked in the “Red” category.
Based on the above approach, the substances were marked in the matrix accordingly. The colour markings
from Steps 1, 2 and 3 were used to classify these in various priority levels, depending on the degree of
concern they pose. The criteria used for classifying substances in the different priority levels are shown below.
Priority 1 constitutes the highest level of concern and Priority 3 the lowest.

37 © Wood Environment & Infrastructure Solutions UK Limited
February 2019
Doc Ref. 40039CL003i3
1. Priority
≥ 1 red or 3 yellow markings in step 1, ≥ 1 red marking in step 2 and limit value exceeded; or
≥ 1 red marking in step 1, ≥ 3 red marking in step 2 and 3; or
Interpretation of the author of the corresponding publication and consideration of background
knowledge of the study team.
2. Priority
≥ 1 red marking in step 2 and limit values exceeded; or
≥ 1 red marking in step 1, ≥ 2 red markings in step 2 and 3; or
≥ 3 yellow markings in step 1, ≥ 1 red marking in step 2 and 3; or
Interpretation of the author of the corresponding publication and consideration of background
knowledge of the study team.
3. Priority
≥ 1 yellow marking in step 1, 2 red markings in step 2 and 3; or
≥ 3 red markings in step 2 and 3; or
No or few red markings, but limit values exceeded;
Interpretation of the author of the corresponding publication and consideration of background
knowledge of the study team.
Further priorities (Priority 4 and 5) were given to other substances to distinguish them from substances
without any markings. These priority levels were assigned as follows:
Priority 4: ≥ 2 red markings in step 2 and 3;
Priority 5: ≥ 1 red marking or yellow markings in step 2 and 3.
The substances identified as high priority according to this classification were included in the provisional list
of recommendations for further risk assessment (see Excel File “Evaluation matrix_fin_20180608”).
3.3 Results
During the literature research, 50 relevant publications were identified (see the accompanying Excel file
“Evaluation matrix_fin_20180608,” sheet “Literature”). The corresponding information on potentially critical
substances was included in the matrix.
Based on the information retrieved from literature, 17 substance groups were identified, which include:
AOX (adsorbable organic halogen compounds);
Chlorophenols;
PCDD/F (dioxins and furans) and dioxin-like PCB’s;
PCB (polychlorinated biphenyls);
LAS (linear alkylbenzene sulphonates);
Nonylphenol and -ethoxylates;
PAH (polycyclic aromatic hydrocarbons);
PBDE (polybrominated diphenyl ethers) and HBCD (flame retardants);

38 © Wood Environment & Infrastructure Solutions UK Limited
February 2019
Doc Ref. 40039CL003i3
Perfluorinated surfactants;
Phthalates;
Physical impurities (e.g. plastic particles);
Siloxanes;
Polycyclic musks;
Drugs and pharmaceuticals;
Pesticides;
Heavy metals; and
Other substances not considered under the above-mentioned substance groups.
Within these substance groups, more than 94 single substances and 4 sub-groups34 with concrete
measurements were identified in the literature as contaminants present in different C/D types.
Available information from identified publications related to assessment criteria and properties (type of
compost/digestate, technology applied at biological treatment plant, type of input/output material,
concentration found in compost/digestate, toxicity etc.) was included in the matrix as far as available.
Additionally, it was also checked whether the data collected for the high-priority substances (Priority 1 and 2)
covered the Member States reported to produce the highest amounts of compost. This included all Member
States producing 500 kt of compost per year or more (DE, UK, FR, IT, NL, ES, PL, BE). Overall, the sources
initially checked included data from all of these countries for most high-priority substances. For Poland, only
measurements of PAHs were available.
Based on the evaluation and selection criteria, the following substances were initially identified as first,
second and third priority (see sheet in separate appendix “evaluation matrix”). These substances were further
evaluated and discussed with the project steering group to select the final list of potential substances of
concern for further risk assessment.
Priority 1 substances:
Substance group Substance Compost/digestate
Heavy metals Cd Compost/digestate
Heavy metals Ni Compost/digestate (highest value in green waste compost)
Heavy metals Pb Compost/digestate (highest value in mechanical biological
treatment compost)
PCBs Indicator PCBs (PCB 6 or PCB 7) Compost/digestate (highest value in biowaste digestate)
Nonylphenol and -
ethoxylates
Nonylphenolethoxylates (NPE) &
nonylphenols (NP)
Compost from municipal sewage sludge
PAHs PAH16 Compost/digestate (highest value in sewage sludge compost)
Phthalates Di-isononyl-phthalate (DINP) Compost/
digestate (highest value in liquid bio-digestate)
Phthalates di(2-ethylhexyl)phtalates (DEHP) Compost/digestate (high values in digestate from food and garden
waste)
34 Sub-group = two or more individual substances are addressed together, e.g. PAH-16 or PCB7.

39 © Wood Environment & Infrastructure Solutions UK Limited
February 2019
Doc Ref. 40039CL003i3
Substance group Substance Compost/digestate
Perfluorinated surfactants Short- and long-chained PFAS Compost/digestate (highest value in sewage sludge compost)
HBCD Hexabromocyclododecane (HBCD) Compost/digestate (highest value in compost)
Dioxins, furans and dioxin-
like PCB’s
PCDD/Fs (I-TEQ) Compost/digestate (highest value in green waste compost)
The substances aldrin and pentachlorophenol were identified as priority 1, but measured values were below
the LOD or no specific measurement data were available.
Priority 2 substances:
Substance group Substance Compost/digestate
Heavy metals Cu Compost/digestate (highest values in sewage sludge compost,
biowaste digestate, biowaste compost)
Heavy metals Zn Compost/digestate (highest values in sewage sludge compost)
Heavy metals Hg Compost/digestate (highest values in biowaste compost)
PCBs dl-PCBs Compost/digestate (highest value in municipal solid waste
digestate)
Phenols Bisphenol A Compost/digestate (highest value in digestate)
Pesticides Hexachlorobenzene Compost/digestate (highest value in digestate)
The substances DDT, 4,4'-isomer, DDT, 2,4'-isomer, alpha-HCH, beta-HCH, gamma-HCH, dieldrin and endrin
were identified as priority 2, but measured values were below the LOD or no specific measurement data were
available.
Priority 3 substances
Substance group Substance Compost/digestate
Heavy metals As Compost/digestate (highest value in biowaste digestate)
Heavy metals Cr Compost/digestate (highest value in sewage sludge compost)
PBDE PBDE Compost/digestate
Pesticide Diphenylamin Digestate from bio-food waste and garden waste
Pesticide Imazalil Digestate from bio-food waste and garden waste
Hormones 17α-Ethinylestradiol Compost/digestate from sewage sludge
Hormones Estriol Compost/digestate
Hormones Testosterone Digestate
Polycyclic musks Galaxolide (HHCB) Compost/digestate
Chlorophenols 2,4,6-trichlorophenol Compost/digestate
Polycyclic musks Tonalide (AHTN) Compost/digestate
Siloxanes Octamethylcyclotetrasiloxan (D4) Compost/digestate

40 © Wood Environment & Infrastructure Solutions UK Limited
February 2019
Doc Ref. 40039CL003i3
Substance group Substance Compost/digestate
Drugs and pharma Triclosan (bactericide) Compost/digestate
The substances fluoxetine, isodrin, carbendazim and ammonium were identified as priority 3, but measured
values were below the LOD or no specific measurement data were available.
In the following, the individual substance groups and substances are discussed based on the outcome of the
evaluation sheet and the discussion with the project steering group. In most cases, information was provided
for several input materials for compost/digestate, as well as any mention in the literature of probable sources
of high-priority substances in compost material.
AOX
Measurement data on AOX in compost from municipal sewage sludge were indicated in one literature
source. Other sources were not identified. No further data were provided for AOX and no individual
substances were identified for this substance group. No data were available on limit values or hazardous
properties of these substances. Thus, it was not selected for further risk assessment.
Chlorophenols
Measurement data were provided for several single substances in compost material from different sources
(solid and liquid biowaste, green waste, renewable raw material, co-digestion, food and garden waste,
manure/slurry), as well as from sewage sludge. Values measured for di-, tri-, and tetrachlorophenols were far
below limit values proposed in the VLAREA Regulation35. Moreover, these were not classified as high-priority
substances, so they were not selected for further risk assessment. According to the evaluation criteria
applied, the substance pentachlorophenol was allocated to the priority 1 level. This substance is listed in
Annex A of the Stockholm Convention, is highly soluble, and poses major risks for aquatic life. However, it
was not selected for further risk assessment because for this specific substance no measurement data were
available.
PCDD/Fs and dioxin-like PCB’s
Measurement data were provided as I-TEQ for a group of 17 PCDD/Fs, as WHO-TEQ for a defined group of
selected PCDD/Fs including dioxin-like PCBs (dl-PCBs), for PCDD/F without further specifications and for dl-
PCBs (PCB No. 77, 81, 105, 114, 118, 123, 126, 156, 157, 167, 169, 189) in C/D made from various input
materials: municipal solid waste, manure/slurry, renewable raw materials, biowaste, renewable raw materials,
fresh plant material, energy crops and a mixture of sewage sludge, straw and sawdust from wastewater
treatment plants. For both groups of PCDD/Fs, defined or proposed limit values have been identified which
have been exceeded in the measured samples. Therefore, and due to the identification of critical properties
in step 2, the general substance group PCDD/Fs and dl-PCBs was selected for further risk assessment.
Muñoz et al. (2018) suggest that the precursors for the formation of PCDD/F’s in compost could come from
materials such as sawdust and saw used as bulking materials in composting plants treating sewage sludge.
Critical properties were also identified for PCDD/F congeners. However, no measurement data were available
for single congeners.
PCBs
Measurement data were provided for the indicator PCBs (group of 6 PCBs: PCBs 28, 52, 101, 138, 153 and
180; as well as group of 7 PCBs: PCBs 28, 52, 101, 118, 138, 153 and 180) in C/D made from various input
materials (mainly garden waste, manure/slurry and municipal sewage sludge). For both groups of indicator
PCBs, defined or proposed limit values have been identified which have been exceeded in the measured
35 0.3-0.-6 mg/kg for different chlorophenol compounds.

41 © Wood Environment & Infrastructure Solutions UK Limited
February 2019
Doc Ref. 40039CL003i3
samples. Therefore, and due to the identification of critical properties in steps 1 and 2, the indicator PCBs
were selected for further risk assessment (PCB 6/7). Critical properties were also identified for PCB congeners.
However, no measurement data were available for the single congeners. Kapanen et al. (2013) suggest that
treated wastewater from industry used in composting of sewage sludge might be an important source of
PCB’s in compost materials.
LAS
No individual substances were identified. For the group, neither limit values nor critical properties were
identified. Due to this fact and a high degradation rate, this substance group was not selected for further risk
assessment.
Nonylphenols and nonylphenolethoxylates
Measurement data were provided for 3 different iso-nonylphenols, nonylphenol (surfactant precursor),
nonylphenolethoxylates (NPE) and the group of nonylphenolethoxylates (NPE) and nonylphenols (NP).
Samples were taken in compost from green waste, renewable raw materials and municipal sewage sludge. In
compost samples from municipal sewage sludge, the identified limit values were exceeded. Due to the critical
properties and the entry in Annex XIV of REACH, the group of nonylphenolethoxylates (NPE) and
nonylphenols (NP) has been selected for further risk assessment. No information regarding the possible
source of these substances in compost material was found.
PAHs
Measurement data were identified for 16 PAH substances and also for some PAH groups, including the
group covering all 16 substances, in C/D made from several input materials (municipal sewage sludge from
wastewater treatment plants, biowaste, vegetable, fruit and garden waste, rural and urban sewage sludge,
manure, energy crops and green waste). Two PAH substances, anthracene and chrysene, are included in the
Candidate List under REACH. As these two are covered by the group PAH16 and limit values were only
identified for PAH16, this group is selected for further risk assessment. Some of the measured values for
PAH16 were above the identified limit values (C/D from sewage sludge, green waste, fruit, vegetable and
garden waste and bio-waste). Critical properties were also evaluated for all single substances. Kapanen et al.
(2013) suggest that treated wastewater from industry used in composting of sewage sludge might be an
important source of PAHs.
PBDEs and HBCD
Substances in this group were measured and identified in C/D of various input materials, mainly biowaste
and food and garden waste. Data was provided for PBDEs and decaBDE. The values identified are far below
limit values proposed by the ESWI consortium on behalf of the EC to amend POP regulation limit values (JRC
2014)36 and decaBDE as well as the PBDEs were not marked red in step 1 of the evaluation. It was already
stated in the JRC report from 2014 that these compounds are likely to be of very low concern for compost or
digestate quality. No contrary information has been identified in the literature survey for this study.
The other flame retardant, HBCD, which was measured inter alia in C/D from renewable raw materials, is
listed in Annex XIV of REACH and in Annex A of the Stockholm Convention. As it also possesses critical
properties (toxic for reproduction and for the environment), it was selected for further risk assessment,
meeting the criteria for the highest priority level. No information was found in the available literature about
possible sources for this substance in compost material.
36 50 mg/kg d.m. for PBDE congeners and 500 µg/kg d.m. for PentaBDE

42 © Wood Environment & Infrastructure Solutions UK Limited
February 2019
Doc Ref. 40039CL003i3
Perfluorinated surfactants
The general group PFAS includes several substances listed in the candidate list under REACH and having
several critical properties (e.g. PFOA, PFNA, PFOS). Perfluorinated surfactants were measured as PFOS, PFOA
and as a group of both (PFT) in C/D made from various input materials, mostly from sewage sludge and from
renewable raw materials. Measured concentrations of PFOS and PFOA exceeded existing limit values.
Moreover, it is known that short-chained PFAS remain in the environment once emitted (Brendel et al. 2018).
Therefore, the whole group of substances was selected for further risk assessment. No information was found
about possible sources in compost material.
Phthalates
Measurement data were provided for the phthalates di(2-ethylhexyl)phthalate (DEHP) and di-isononyl-
phthalate (DINP) in C/D made of various input materials (municipal sewage sludge, biowaste and food and
garden waste). DEHP is listed in Annex XIV under REACH and in several other substance lists. The
concentrations of DEHP found in compost material from municipal sewage sludge from wastewater
treatment plants exceeded the defined limit values. It is therefore selected for further risk assessment. DINP is
used as a substitute for DEHP and its use is restricted for some applications (toys and childcare articles that
can be placed on the mouth by children). It is already listed in Annex XVII under REACH. Even though the
evaluation methodology applied suggests that this substance is classified in the highest priority level, it is not
recommended for further risk assessment because RAC has analysed its toxicological profile and concluded
that it will not be classified for reproductive toxicity.
Physical impurities
Physical impurities include inter alia plastics, stones and glass. Data was found for different types of physical
impurities and for different types of microplastics. For glass and stones, proposed limit values were exceeded
in several of the measured C/D samples, but these were not selected for further risk assessment because of
the low risk they pose. In the case of microplastics, the difficulty of modelling the environmental fate of these
materials limits the possibility of carrying out a detailed risk assessment. However, the increasing concern
over the presence of microplastics in the environment makes it relevant to consider these materials in
compost/digestate. Microplastics are therefore considered for future risk assessment within the limits of a
feasible analysis.
Siloxanes
Measurements in C/D made of different input materials (commercial food waste, forestry residues, waste
from agriculture, waste from food and beverage industry, and sewage sludge) were identified in literature for
four substances within this group. One of these substances, octamethylcyclotetrasiloxane (D4), has critical
properties (vPvB and PBT) and is listed in the SIN list and was identified as an SVHC during the course of this
study. It has therefore been selected for further risk assessment. No information was found about possible
sources for this substance in compost/digestate.
Polycyclic musks
Measurement data were provided for galaxolide (HHCB) and tonalide (AHTN) in C/Ds made from different
input materials (commercial food waste, forestry residues, waste from agriculture, waste from food and
beverage industry, sewage sludge, and renewable raw materials). The measured values of both substances,
which are listed in the SIN list and have few critical properties, did not exceed the limit values proposed by
the “Bundesministerium für Umwelt, Naturschutz und Reaktorsicherheit37.” According to literature, this
endocrine disrupting substance is used for washing and cleaning products and could therefore be relevant in
37 10 or 15 mg/kg.

43 © Wood Environment & Infrastructure Solutions UK Limited
February 2019
Doc Ref. 40039CL003i3
digestate from waste water treatment. However, a rapid degradation is observed according to literature, so
these substances are not recommended for further risk assessment.
Drugs and pharmaceuticals
Many drugs and pharmaceuticals, including antibiotics and hormones, were listed in the literature sources
evaluated. For 53 different substances that were identified, measurements were carried out in C/D samples
from different input materials, mainly sewage sludge, dairy and swine manure, slaughterhouse residues, food
waste, and biowaste. Some of the hormones (testosterone, estriol, 17α-ethinylestradiol) have several critical
properties (at least three red markings in step 2). Following consultations with an expert,
17α-ethinylestradiol has been selected for further risk assessment on the basis that it is listed in the Water
Framework Directive, shows a high mobility in water, and poses major risks for human health and for the
environment. No information was available on possible sources for this substance.
Pesticides
Data and measurements were provided for several pesticides, including biocides, insecticides, herbicides and
fungicides. Some of the substances are listed in Annex A of the Stockholm Convention (e.g. Aldrin, alpha-
and beta- HCH, and DDT), are marked yellow in the evaluation matrix due to the existence in some other lists
and have critical properties. However, only for hexachlorobenzene were measurement data above the limit of
detection provided. Therefore, this pesticide was initially suggested for further risk assessment. However,
after discussion with the steering group, is has not been selected, because it was banned a long time ago.
For the JRC report, 54 samples had been taken for several pesticides. They include 2,4-D, Dichlorprop,
Mecoprop, MCPA, 2,4,5-T and Bentazone, 2,4-D also being listed in the Stockholm Convention (JRC Report
2014). The sum of the concentration values for these 7 pesticides was in all cases lower than 50.1 μg/kg. One
limit value of 500 μg/kg for the sum of 10 organochlorine pesticides was identified in Austria. No further limit
values were identified. It was stated in the JRC Report (2014) that “the measurement data suggests that
pesticides are likely to be of very low concern for compost/digestate quality.” Therefore, this group was not
selected for further risk assessment.
Heavy metals
Besides the typical heavy metals Cd, Cr, Cu, Hg, Ni, Pb and Zn, other17 metals have been measured in C/D
materials made of different input materials (solid and liquid biowaste, green waste, renewable raw material,
food and garden waste, and manure/slurry). For Cd (which is on the candidate list for SVHC substances under
REACH), Cr, Cu, Ni, Pb and Zn, values above defined or proposed limit values were observed. Cd, Ni, and Pb,
which also have critical properties, were selected for further risk assessment. The JRC (2014) report mentions
leaching from glass as a possible source for Cd in compost, while the use of leaded fuels could account for
the presence of lead. In the case of nickel, only natural sources such as ultramafic rock are mentioned. Zn and
Cu, which are classified to the priority 2 level according to the methodology applied, are also recommended
for further risk assessment due to their high concentrations found in compost materials. As discussed by the
steering group, these substances are commonly found in manure/slurry because they are present in
veterinary drugs. Finally, Hg is also recommended for further risk assessment due to its severe effects on the
environment and on human health. The inclusion of Zn, Cu and Hg was recommended by experts. No
information was found on possible sources for these metals. Cr would be further relevant if Cr(VI) is the
source of measured Cr concentration. However, this could not be further verified.
Others
The category “others” includes phenols with the substances bisphenol A, sweeteners (3 substances),
ammonium and mineral oil (C10-C40). Out of these substances, bisphenol A is listed in the candidate list for
SVHC substances and has critical properties. It was found in C/D, inter alia from renewable raw materials, and

44 © Wood Environment & Infrastructure Solutions UK Limited
February 2019
Doc Ref. 40039CL003i3
was therefore also selected for further risk assessment. Literature sources suggest the widespread use of
bisphenol A in the production of plastics as the most significant source of this substance in compost material.
Based on this discussion, a final list of substances for further risk assessment has been selected.
In general, substances assigned to the Priority 1 and 2 categories were selected for further risk assessment
with the following exceptions (see Excel File “Evaluation matrix_fin_20180608”):
Di-isononyl-phthalate (DINP), identified as a Priority 1 substance using the evaluation method
used, was not selected as it was recently assessed by RAC for its toxicity for reproduction, but it
was not finally proposed for classification.
Octamethylcyclotetrasiloxane (D4), allocated to the Priority 3 level, is identified as an SVHC
(vP/vB and PBT), so it is recommended for further risk assessment.
17α-ethinylestradiol, also classified as a Priority 3 substance, shows a high mobility and is
included in the Water Framework Directive. It was thus recommended for further risk
assessment.
Hexachlorobenzene was classified as a Priority 2 substance but was not selected because its use
has already been banned long time ago. It is not expected that this substance will pose a major
risk.
Microplastics will be further considered for risk assessment, but a detailed analysis is not possible due to
absence of limit values and the difficulty in evaluating the properties of these materials once they are
released. Even though they do not fulfil the prioritisation criteria, they were selected due to an increasing
concern over their presence in the environment. Microplastics intentionally added to products (such as
detergents and cosmetics) are more likely to concentrate in sewage sludge (ECHA 2018a).
Table 3.3 shows the final list of substances selected for further risk assessment.
Table 3.3 List of substances recommended for further risk assessment
Substance group Substance/family Compost/digestate
Dioxins, furans and dioxin-like PCB’s 17 PCDD/Fs (I-TEQ) Compost/digestate (highest value in green waste
compost)
PCB’s Indicator PCBs (PCB 6 or PCB 7) Compost/digestate (highest value in biowaste
digestate)
Nonylphenol and -ethoxylates Nonylphenolethoxylates (NPE) &
nonylphenols (NP)
Compost from municipal solid waste
PAHs PAH16 Compost/digestate (highest value in sewage
sludge compost)
HBCD Hexabromocyclododecane (HBCD) Compost/digestate (highest value in compost)
Perfluorinated surfactants Short- and long-chained PFAS Compost/digestate (highest value in sewage
sludge compost)
Phthalates di(2-ethylhexyl)phthalate (DEHP) Compost/digestate (high values in digestate
from food and garden waste)
Siloxanes Octamethylcyclotetrasiloxane (D4) Compost/digestate
Hormones 17α-Ethinylestradiol Compost/digestate from sewage sludge

45 © Wood Environment & Infrastructure Solutions UK Limited
February 2019
Doc Ref. 40039CL003i3
Substance group Substance/family Compost/digestate
Heavy metals Cd Compost/digestate
Heavy metals Ni Compost/digestate (highest value in green waste
compost)
Heavy metals Pb Compost/digestate (highest value in mechanical
biological treatment compost)
Heavy metals Cu Compost/digestate (highest values in sewage
sludge compost, biowaste digestate, biowaste
compost)
Heavy metals Zn Compost/digestate (highest values in sewage
sludge compost)
Heavy metals Hg Compost/digestate (highest values in biowaste
compost)
Phenols Bisphenol A Compost/digestate (highest value in digestate)

46 © Wood Environment & Infrastructure Solutions UK Limited
February 2019
Doc Ref. 40039CL003i3
4. Risk assessment
4.1 Introduction and approach to assessment
The approach to assessing the priority substances and chemical families is summarised below. The findings
for each individual assessed substance are presented and discussed later in this section. A brief discussion on
the sensitivity of the results to specific variables was also included for substances where a particular variability
concern was noted.
Appendix D presents a full detailed report of the risk assessment. The summary information here is intended
to inform the prioritisation process within the RMOA.
Table 4.1 Overview of specific priority substances and approach to assessing their risk
Chemical category or family Representative substances assessed Comments
Heavy metals Cadmium, Nickel, Lead, Copper, Zinc and
Mercury
Exposure and risk characterisation has been
carried out. Natural background and active
accumulation mechanisms present a challenge.
The assessments are in terms of total metal
although in the environmental media it could be
present in different forms. This is discussed as
part of the individual assessments.
Bisphenol A Conventional quantitative risk characterisation is
not appropriate, but exposures at the steady
state are discussed.
Phthalates DEHP Conventional quantitative risk characterisation is
not appropriate, but exposures at the steady
state are discussed.
Pharmaceuticals 17α-Ethinylestradiol Conventional quantitative risk characterisation is
not appropriate, but exposures at the steady
state are discussed.
Hexabromocyclododecane Conventional quantitative risk characterisation is
not appropriate, but exposures at the steady
state are discussed.
Dioxins, furans and dioxin-like PCBs 2,3,7,8-TCDD, 2,3,4,7,8-PCDF, [PCB28] Conventional quantitative risk characterisation is
not appropriate, but exposures at the steady
state are discussed.
Other PCB PCB28 Conventional quantitative risk characterisation is
not appropriate, but exposures at the steady
state are discussed.
Nonylphenol isomers and
ethoxylates
Nonylphenol Exposure and risk characterisation has been
carried out.
PAH16 Benzo[a]pyrene, chrysene, benz[a]anthracene,
benzo[b]fluoranthene, indeno[,2,3-cd]pyrene
Collectively the first two are termed PAH2 and
the first four are termed PAH4. Conventional
quantitative risk characterisation is not
appropriate, but exposures at the steady state
are discussed and estimated human exposures
are compared with the BMDL10.

47 © Wood Environment & Infrastructure Solutions UK Limited
February 2019
Doc Ref. 40039CL003i3
Chemical category or family Representative substances assessed Comments
PFAs PFOA Conventional quantitative risk characterisation is
not appropriate, but exposures at the steady
state are discussed.
Physical impurities Microplastics Generic estimate only – fugacity modelling is not
reliable.
For the endpoints where conventional quantitative risk characterisation is appropriate, a limit below which
adverse effects are not expected has been calculated. This is referred to as “safe limit” throughout the report.
Note that this does not preclude possible other effects at lower concentrations, related to other endpoints
for which quantitative risk characterisation was not possible.
4.2 The compost and digestate life cycle
The life cycle of digestates and composts in the agricultural context is illustrated overleaf.

48 © Wood Environment & Infrastructure Solutions UK Limited
February 2019
Doc Ref. 40039CL003i3
Figure 4.1 Summary life cycle of composts and digestates

49 © Wood Environment & Infrastructure Solutions UK Limited
February 2019
Doc Ref. 40039CL003i3
4.3 Defining exposure scenarios for quantitative exposure assessment
The project team gave consideration to whether additional local scenarios should be included such as
transport, distribution, storage, unloading/storage/cleaning at the user site or if these were intended to be
excluded. As there is relatively little firm data for the sector, it would be inappropriate to develop over-
complicated scenarios. However, it is important not to neglect releases e.g. from the handling and use of
products by users alongside the main mode of use.
Two separate local scenarios are discussed in the following sections:
I. Compost and digestate products, handling and application as soil amendment
including application of compost; whole digestate; crude dry fibre and all liquid products;
II. Compost used as a growing medium
compost only; e.g. for consumer (hobby) and professional growers.
Full details of the scenario have been circulated in previous progress reports and will be included in the draft
final report.
4.4 Assessment of specific priority substances
4.4.1 Cadmium (Cd)
Summary of findings
Table 4.2 Summary of key findings for exposure of cadmium via use of compost and digestates
Key findings of the risk assessment of cadmium in contaminated composts and digestates
Overall range of compost and digestate concentrations Median values approximately 0.2 to 0.8 mg/kg dw. The
maximum values reported are 2.75 mg/kg dw in compost and 2.5
mg/kg dw in digestate.
Major raw material sources Only limited data are available. Concentrations broadly similar
across different raw material sources (renewable raw materials,
co-digestion, biowaste and green waste, and solid and liquid
biowaste). The highest concentrations reported are in mechanical
biological treatment compost and in digestate from biowaste
and green waste. It is not possible to differentiate whether
natural or anthropogenic in origin38.
Safe limit concentration in compost and digestate No risks identified at the proposed FPR limit value. The majority
of the measured data are below this limit. The safe limit would
be higher than the current levels so this is not currently seen as a
concern.
Main concern(s) arising Cumulative loads at steady state.
38 The presence of heavy metals in compost/digestate could result from natural occurrence, industrial sources or a combination of both.
Metals will generally be present (at relatively low levels) in most living matter and survive the processes associated with anaerobic
digestion / composting.

50 © Wood Environment & Infrastructure Solutions UK Limited
February 2019
Doc Ref. 40039CL003i3
Key findings of the risk assessment of cadmium in contaminated composts and digestates
Effects considered in the main concern hazard(s) Toxicity to kidney and bone via dietary exposure. The European
Food Safety Authority (EFSA) has identified that at least in the
case of children, the tolerable weekly intake of cadmium via total
diet, could be exceeded (European Food Safety Authority 2012).
Cadmium in compost and digest could contribute to this dietary
exposure.
Uncertainties and their implications Uncertainty over the safe threshold for dietary exposure.
Small occurrence data set covering limited number of countries.
The highest concentrations reported could present a risk to
humans exposed via crops, however this significance of this is
highly uncertain.
Sensitivity of exposures to variations in water management in the
local container growing scenario is low.
Other remarks The contribution from C/D to the total cadmium present in soil
from all sources is relatively small.
The realistic worst case analysis carried out indicates that the risks to the environment from the presence of
cadmium in C/D are generally low. The contribution from C/D to the total cadmium present in soil from all
sources is relatively small. For man exposed via the diet, the levels predicted are below the available toxicity
threshold values. However, it should be noted that cadmium and its salts have been identified as SVHC based
on mutagenicity and/or carcinogenicity and effects on kidney and bones and, according to ECHA (2013)
there is some uncertainty over the safe threshold for dietary exposure. ECHA (2013) indicated that
atmospheric deposition to soil was the major source of cadmium entering the diet and recommended that
action should be taken at Community level to control and reduce cadmium pollution. Although the input of
cadmium into soil, and hence the diet, from C/D appears to be small compared with other sources, C/D will
contribute to the total dietary intake of cadmium.
At steady state, 67% of the total mass remains within the region + continent39, suggesting that there is
relatively low transfer over long distances following release via the handling and application of C/D40. The
realistic worst case mass of cadmium in the region + continent at steady state as a result of use of C/D is
estimated to be around 4.27×10⁶ kg assuming that all compost contains cadmium at the mid-range of the
measured concentration. This steady-state mass amounts to approximately 220 times the mass released
annually via application of composts and digestates41.
39 This refers to the regional and continental spatial scales in the EUSES model. Refer to Section 1.7 of Appendix D for further
information. 40 The possibility or not for transfer over long distance is largely an inherent property of the substances themselves, but it is interesting if
this is expressed even when the pathway into the environment is so dominated by incorporation into soil. 41 Please note this is not to be interpreted as how much time elapses to reach steady state; the steady state predicted by the model are
the amounts and distribution at the regional and continental scale arising from the compost and digestate use application pathway only.
Adding in the release of the same substances via other pathways (air and waste water) and natural sources, could lead to a different
steady state picture.

51 © Wood Environment & Infrastructure Solutions UK Limited
February 2019
Doc Ref. 40039CL003i3
4.4.2 Nickel (Ni)
Summary of findings
Table 4.3 Summary of key findings for exposure of nickel via use of compost and digestates
Key findings of the risk assessment of nickel in contaminated composts and digestates
Overall range of compost and digestate concentrations Typically <10 to 39 mg/kg dw. The maximum values
reported are 250 mg/kg dw in compost and 40 mg/kg dw in
digestate.
Major raw material sources Only limited data are available. Concentrations broadly
similar across different raw material sources (renewable raw
materials, co-digestion, biowaste and green waste, and solid
and liquid biowaste). The highest overall concentrations have
been reported in compost samples derived from biowaste,
green waste, sewage sludge and mechanical biological
treatment. It is not possible to differentiate whether natural
or anthropogenic in origin42.
Safe limit concentration in compost and digestate 7.9 mg/kg dw for compost for container growing.
130 mg/kg dw for compost or digestate for application to
agricultural land. The majority of measured data are below
this value.
Main concern(s) arising Human exposure through crops from use of compost in
container growing.
Secondary poisoning from use of compost in container
growing.
Cumulative loads at steady state.
Effects considered in the main concern hazard(s) Human toxicity based on mammalian developmental toxicity
Secondary poisoning based on reproductive study in rat
Uncertainties and their implications Small occurrence data set covering limited number of
countries.
Sensitivity of exposures to variations in water management
in the local container growing scenario is low.
Other remarks The nickel from C/D contributes up to around 20% of the
total background nickel present in soil.
The realistic worst-case analysis carried out indicates a potential risk to secondary poisoning and human
exposure through use of compost containing nickel for scenario II. No risks are identified for use of compost
or digestate containing nickel in scenario I based on the typical range of concentrations and the limit value
from the proposal for the revised Fertilising Products Regulation (FPR) (European Commission 2018b).
However, there are a limited number of measured concentrations in nickel in compost above this limit value
and these would indicate a potential risk to humans via diet if the concentration exceeds around 130 mg/kg
dry wt. The majority of the available measured data are below this value.
42 The presence of heavy metals in compost/digestate could result from natural occurrence, industrial sources or a combination of both.
Metals will generally be present (at relatively low levels) in most living matter and survive the processes associated with anaerobic
digestion / composting.

52 © Wood Environment & Infrastructure Solutions UK Limited
February 2019
Doc Ref. 40039CL003i3
In order to control the risks from scenario II the level of nickel present in compost would need to be around
7.9 mg/kg dry weight or below43. This is would lead to a concentration in the actual growing medium of
around 2.6 mg/kg dry weight. This limit value appears to be very low when compared with the reported EU
background concentration in agricultural soil of 26 mg/kg dry weight (see Appendix D).
EU limit values for nickel in agricultural soil to which sewage sludge is applied are specified in Council
Directive 86/278/EEC44. The limit value set by the Directive for nickel in soil with a pH of 6 to 7 is 30 to 75
mg/kg dry weight. The actual limit values applied in the Member States are in the range 30 to 75 mg/kg dry
weight in 27 Member States (Eunomia Research & Consulting 2018). One Member State (Denmark) has set a
lower limit value for nickel in soil of 15 mg/kg dry weight. Thus, the safe limit estimated for nickel for
container growing in scenario II is also significantly lower than existing limit values for nickel in agricultural
soil.
As discussed in Appendix D, there are some uncertainties associated with the container growing scenario
used. In particular, the current calculations assume that there is no loss of the substance from the growing
medium by leaching (although the analysis carried out in Appendix D suggests that this may not be so
significant for nickel) and that the dietary intake from root and leaf crops occurs entirely from crops grown in
such media. This latter assumption, in particular, may lead to an overestimation of the risks associated with
compost and digestate containing nickel in this scenario and so the estimated safe limit of 7.9 mg/kg dry
weight in compost should be seen as preliminary only.
The contribution from C/D to the total nickel present in agricultural soil from all sources is relatively small. At
steady state, 77% of the total mass remains within the region + continent45, suggesting that there is relatively
low transfer over long distances following release via the handling and application of C/D46. The realistic
worst-case mass of nickel in the region + continent at steady state as a result of use of C/D is estimated to be
around 2.95×10⁸ kg assuming that all compost contains nickel at the mid-range of the reported measured
levels. This steady-state mass amounts to approximately 490 times the mass released annually via application
of composts and digestates47.
4.4.3 Lead (Pb)
Summary of findings
Table 4.4 Summary of key findings for exposure of lead via use of compost and digestates
Key findings of the risk assessment of lead in contaminated composts and digestates
Overall range of compost and digestate concentrations Typically <2.5 to 91 mg/kg dw. The maximum concentration
reported is 230 mg/kg dw in compost. The concentrations in
digestate are generally lower than in compost.
Major raw material sources The data suggests that the concentrations may be higher with
biowaste and green waste, and solid and liquid biowaste as raw
43 Safe limit concentrations are determined for the protection target that is most sensitive for that substance. These safe limits are then
protective for all endpoints. 44 Council Directive 86/278/EEC of 12 June 1986 on the protection of the environment, and in particular of the soil, when sewage sludge
is used in agriculture. Official Journal of the European Communities L 181/6, 4.7.86. 45 This refers to the regional and continental spatial scales in the EUSES model. Refer to Section 1.7 of Appendix D for further
information. 46 The possibility or not for transfer over long distance is largely an inherent property of the substances themselves, but it is interesting if
this is expressed even when the pathway into the environment is so dominated by incorporation into soil. 47 Please note this is not to be interpreted as how much time elapses to reach steady state; the steady state predicted by the model are
the amounts and distribution at the regional and continental scale arising from the compost and digestate use application pathway only.
Adding in the release of the same substances via other pathways (air and waste water) and natural sources, could lead to a different
steady state picture.

53 © Wood Environment & Infrastructure Solutions UK Limited
February 2019
Doc Ref. 40039CL003i3
Key findings of the risk assessment of lead in contaminated composts and digestates
material sources than renewable raw materials and co-digestion
as raw material sources. The highest concentration overall was
found in compost derived from mechanical biological treatment.
However, only very limited data are available. It is not possible to
differentiate whether natural or anthropogenic in origin48.
Safe limit concentration in compost and digestate Not applicable (risk characterisation ratio not definable).
Main concern(s) arising Non-threshold neurotoxic substance.
Cumulative loads at steady state. Significant contribution from
C/D to the total background level of lead in soil.
Effects associated with the main concern hazard(s) Non-threshold neurotoxin.
Uncertainties and their implications Small occurrence data set covering limited number of countries.
Sensitivity of exposures to variations in water management in the
local container growing scenario is low.
Other remarks -
The realistic worst-case analysis carried out indicates risk characterisation ratios (RCRs) <1 for soil, sediment,
water and secondary poisoning based on the realistic worst case assumptions for both scenario I and
scenario II. However, lead is a non-threshold neurotoxic substance and so it is not possible to carry out a
quantitative risk characterisation for man exposed via the environment (refer to Section 2.1 of Appendix D).
The contribution from C/D to the total background levels of lead present in soil from all sources is significant
(estimated to be up to 66% based on the mid-range measured levels; this would be higher if the highest
measured levels or the proposed FPR limit value is assumed).
At steady state, 95% of the total mass remains within the region + continent49, suggesting that there is
relatively low transfer over long distances following release via the handling and application of C/D50. The
realistic worst case mass of lead in the region + continent at steady state as a result of use of C/D is
estimated to be more than 1 million tonnes assuming that all compost contains lead at the mid-range of the
levels that have been measured. This steady-state mass amounts to approximately 1,670 times the mass
released annually via application of composts and digestates51.
48 The presence of heavy metals in compost/digestate could result from natural occurrence, industrial sources or a combination of both.
Metals will generally be present (at relatively low levels) in most living matter and survive the processes associated with anaerobic
digestion / composting. 49 This refers to the regional and continental spatial scales in the EUSES model. Refer Section 1.7 of Appendix D for further information. 50 The possibility or not for transfer over long distance is largely an inherent property of the substances themselves, but it is interesting if
this is expressed even when the pathway into the environment is so dominated by incorporation into soil. 51 Please note this is not to be interpreted as how much time elapses to reach steady state; the steady state predicted by the model are
the amounts and distribution at the regional and continental scale arising from the compost and digestate use application pathway only.
Adding in the release of the same substances via other pathways (air and waste water) and natural sources, could lead to a different
steady state picture.
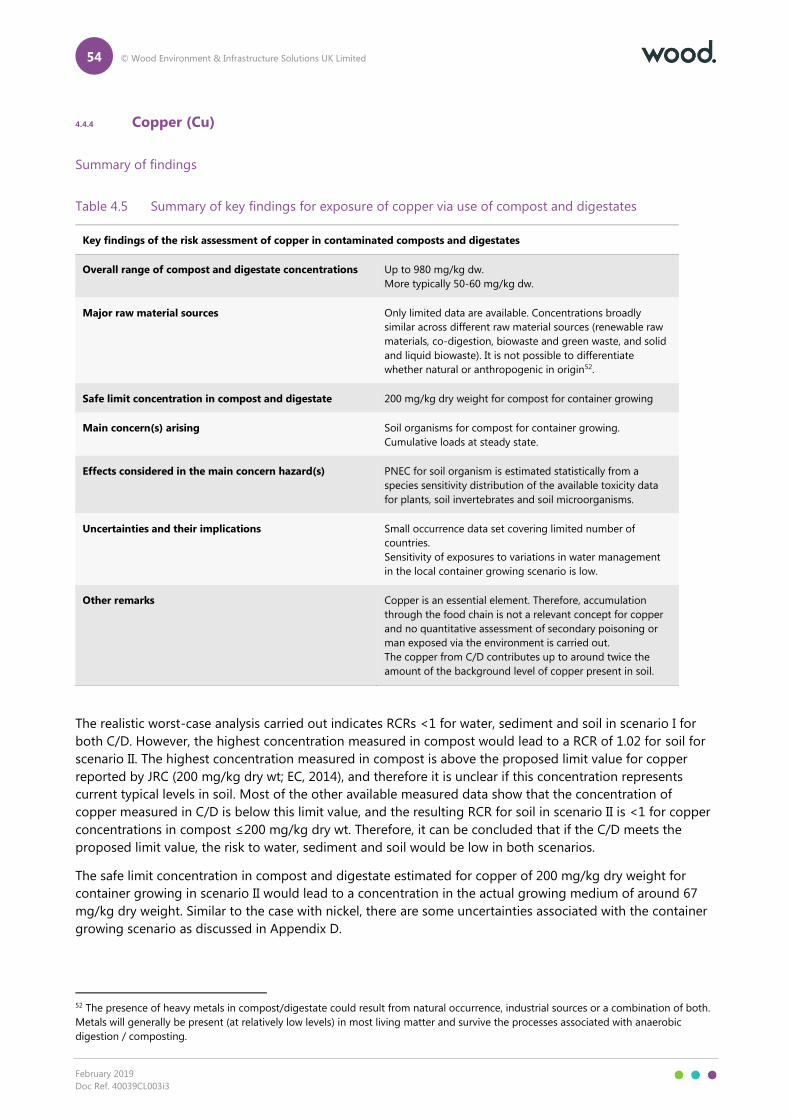
54 © Wood Environment & Infrastructure Solutions UK Limited
February 2019
Doc Ref. 40039CL003i3
4.4.4 Copper (Cu)
Summary of findings
Table 4.5 Summary of key findings for exposure of copper via use of compost and digestates
Key findings of the risk assessment of copper in contaminated composts and digestates
Overall range of compost and digestate concentrations Up to 980 mg/kg dw.
More typically 50-60 mg/kg dw.
Major raw material sources Only limited data are available. Concentrations broadly
similar across different raw material sources (renewable raw
materials, co-digestion, biowaste and green waste, and solid
and liquid biowaste). It is not possible to differentiate
whether natural or anthropogenic in origin52.
Safe limit concentration in compost and digestate 200 mg/kg dry weight for compost for container growing
Main concern(s) arising Soil organisms for compost for container growing.
Cumulative loads at steady state.
Effects considered in the main concern hazard(s) PNEC for soil organism is estimated statistically from a
species sensitivity distribution of the available toxicity data
for plants, soil invertebrates and soil microorganisms.
Uncertainties and their implications Small occurrence data set covering limited number of
countries.
Sensitivity of exposures to variations in water management
in the local container growing scenario is low.
Other remarks Copper is an essential element. Therefore, accumulation
through the food chain is not a relevant concept for copper
and no quantitative assessment of secondary poisoning or
man exposed via the environment is carried out.
The copper from C/D contributes up to around twice the
amount of the background level of copper present in soil.
The realistic worst-case analysis carried out indicates RCRs <1 for water, sediment and soil in scenario I for
both C/D. However, the highest concentration measured in compost would lead to a RCR of 1.02 for soil for
scenario II. The highest concentration measured in compost is above the proposed limit value for copper
reported by JRC (200 mg/kg dry wt; EC, 2014), and therefore it is unclear if this concentration represents
current typical levels in soil. Most of the other available measured data show that the concentration of
copper measured in C/D is below this limit value, and the resulting RCR for soil in scenario II is <1 for copper
concentrations in compost ≤200 mg/kg dry wt. Therefore, it can be concluded that if the C/D meets the
proposed limit value, the risk to water, sediment and soil would be low in both scenarios.
The safe limit concentration in compost and digestate estimated for copper of 200 mg/kg dry weight for
container growing in scenario II would lead to a concentration in the actual growing medium of around 67
mg/kg dry weight. Similar to the case with nickel, there are some uncertainties associated with the container
growing scenario as discussed in Appendix D.
52 The presence of heavy metals in compost/digestate could result from natural occurrence, industrial sources or a combination of both.
Metals will generally be present (at relatively low levels) in most living matter and survive the processes associated with anaerobic
digestion / composting.
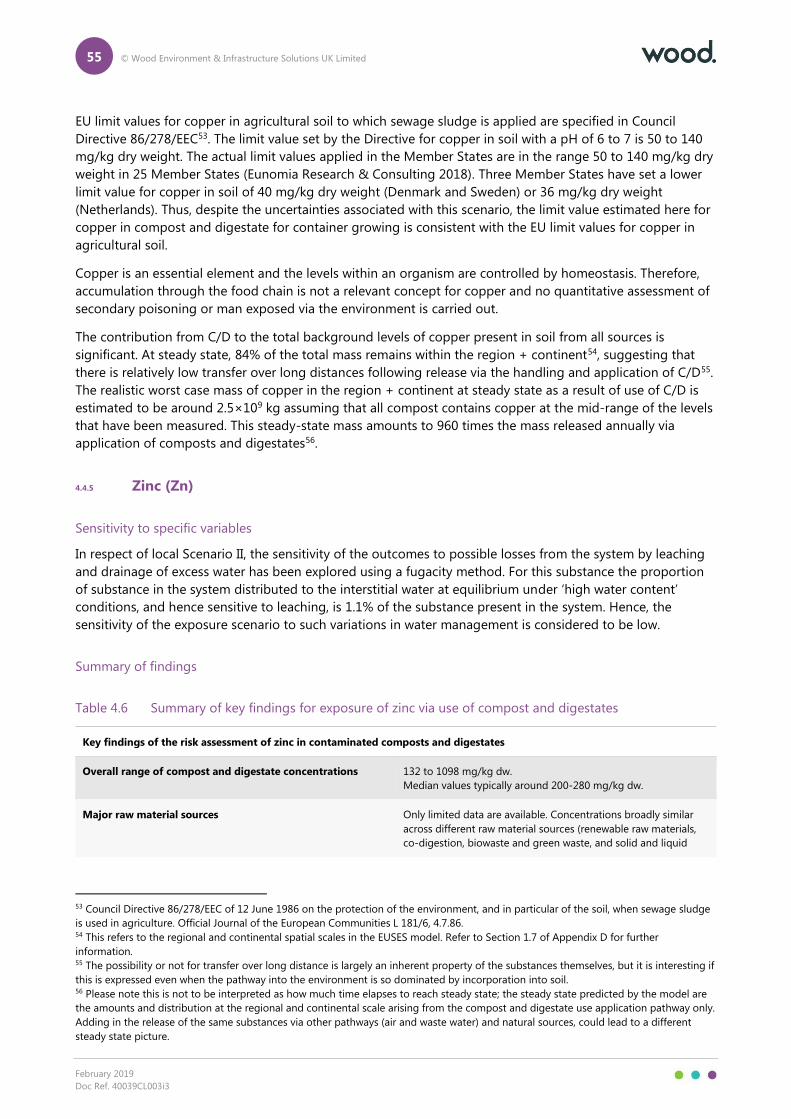
55 © Wood Environment & Infrastructure Solutions UK Limited
February 2019
Doc Ref. 40039CL003i3
EU limit values for copper in agricultural soil to which sewage sludge is applied are specified in Council
Directive 86/278/EEC53. The limit value set by the Directive for copper in soil with a pH of 6 to 7 is 50 to 140
mg/kg dry weight. The actual limit values applied in the Member States are in the range 50 to 140 mg/kg dry
weight in 25 Member States (Eunomia Research & Consulting 2018). Three Member States have set a lower
limit value for copper in soil of 40 mg/kg dry weight (Denmark and Sweden) or 36 mg/kg dry weight
(Netherlands). Thus, despite the uncertainties associated with this scenario, the limit value estimated here for
copper in compost and digestate for container growing is consistent with the EU limit values for copper in
agricultural soil.
Copper is an essential element and the levels within an organism are controlled by homeostasis. Therefore,
accumulation through the food chain is not a relevant concept for copper and no quantitative assessment of
secondary poisoning or man exposed via the environment is carried out.
The contribution from C/D to the total background levels of copper present in soil from all sources is
significant. At steady state, 84% of the total mass remains within the region + continent54, suggesting that
there is relatively low transfer over long distances following release via the handling and application of C/D55.
The realistic worst case mass of copper in the region + continent at steady state as a result of use of C/D is
estimated to be around 2.5×10⁹ kg assuming that all compost contains copper at the mid-range of the levels
that have been measured. This steady-state mass amounts to 960 times the mass released annually via
application of composts and digestates56.
4.4.5 Zinc (Zn)
Sensitivity to specific variables
In respect of local Scenario II, the sensitivity of the outcomes to possible losses from the system by leaching
and drainage of excess water has been explored using a fugacity method. For this substance the proportion
of substance in the system distributed to the interstitial water at equilibrium under ‘high water content’
conditions, and hence sensitive to leaching, is 1.1% of the substance present in the system. Hence, the
sensitivity of the exposure scenario to such variations in water management is considered to be low.
Summary of findings
Table 4.6 Summary of key findings for exposure of zinc via use of compost and digestates
Key findings of the risk assessment of zinc in contaminated composts and digestates
Overall range of compost and digestate concentrations 132 to 1098 mg/kg dw.
Median values typically around 200-280 mg/kg dw.
Major raw material sources Only limited data are available. Concentrations broadly similar
across different raw material sources (renewable raw materials,
co-digestion, biowaste and green waste, and solid and liquid
53 Council Directive 86/278/EEC of 12 June 1986 on the protection of the environment, and in particular of the soil, when sewage sludge
is used in agriculture. Official Journal of the European Communities L 181/6, 4.7.86. 54 This refers to the regional and continental spatial scales in the EUSES model. Refer to Section 1.7 of Appendix D for further
information. 55 The possibility or not for transfer over long distance is largely an inherent property of the substances themselves, but it is interesting if
this is expressed even when the pathway into the environment is so dominated by incorporation into soil. 56 Please note this is not to be interpreted as how much time elapses to reach steady state; the steady state predicted by the model are
the amounts and distribution at the regional and continental scale arising from the compost and digestate use application pathway only.
Adding in the release of the same substances via other pathways (air and waste water) and natural sources, could lead to a different
steady state picture.

56 © Wood Environment & Infrastructure Solutions UK Limited
February 2019
Doc Ref. 40039CL003i3
Key findings of the risk assessment of zinc in contaminated composts and digestates
biowaste). It is not possible to differentiate whether natural or
anthropogenic in origin57.
Safe limit concentration in compost and digestate 600 mg/kg dry weight for application of compost or digestate to
agricultural land.
70 mg/kg dry weight for compost used in container growing.
Main concern(s) arising Sediment for scenario I, related to application of compost or
digestate onto agricultural land.
Soil for scenario II, related to compost use in container growing.
High cumulative loads at steady state and high predicted
regional RCRs in sediment.
Effects considered in the main concern hazard(s) PNEC for sediment is derived from survival and growth data for
benthic organisms.
PNEC for soil is based on toxicity to soil microbial processes,
plants and soil invertebrates derived from species sensitivity
distributions.
Uncertainties and their implications Small occurrence data set covering limited number of countries.
Uncertainties over the risk at the regional level.
Sensitivity of exposures to variations in water management in the
local container growing scenario is low.
Other remarks Zinc is an essential element. Therefore, accumulation through the
food chain is not a relevant concept for zinc and no quantitative
assessment of secondary poisoning or man exposed via the
environment is carried out.
The input of zinc to agricultural soil from C/D is relatively small
(around 10% of the total) compared with other sources.
The realistic worst case analysis carried out indicates RCRs <1 for water and soil for scenario I, indicating a
low risk. However the realistic worst case analysis results in RCRs >1 for sediment for scenario I and soil for
scenario II. RCRs >1 are also indicated for sediment at a regional level when calculated using the
approximate mid-range concentration in C/D, however the regional risk assessment for zinc is highly
uncertain.
When the added risk approach is used, RCRs for scenario I for sediment, water and soil are all <1 when the
concentration in digestate or compost is limited to ≤600 mg/kg dry weight, which corresponds to the
proposed limit value for zinc from JRC 2014 (EC, 2014). This shows that the proposed limit value would be
sufficient to control the risks from this scenario. For scenario II (which relates to compost only), the
concentration in compost would need to be limited to ≤70 mg/kg dry weight in order to achieve RCRs <1.
This is below the proposed FPR limit value, and also lower than the approximate mid-range of the measured
data.
Zinc is an essential element and the levels within an organism are controlled by homeostasis. Therefore,
accumulation through the food chain is not a relevant concept for zinc and no quantitative assessment of
secondary poisoning or man exposed via the environment is carried out.
The contribution from C/D to the total background levels, including other agricultural uses and natural
sources, of zinc present in soil from all sources is small. The total EU input of zinc into agricultural soil from
C/D (assuming the concentration present is around the mid-range level) estimated to be around 1,700
tonnes; this compares with an estimate of the total EU input of zinc into agricultural soil of 17,000 tonnes
57 The presence of heavy metals in compost/digestate could result from natural occurrence, industrial sources or a combination of both.
Metals will generally be present (at relatively low levels) in most living matter and survive the processes associated with anaerobic
digestion / composting.

57 © Wood Environment & Infrastructure Solutions UK Limited
February 2019
Doc Ref. 40039CL003i3
from all agricultural soil. At steady state, 54% of the total mass remains within the region + continent58,
suggesting that there is some transfer over long distances following release via the handling and application
of C/D59. The realistic worst-case mass of zinc in the region + continent at steady state as a result of use of
C/D is estimated to be around 1.51×10⁹ kg assuming that all compost contains zinc at the mid-range of the
levels that have been measured. This steady-state mass amounts to 130 times the mass released annually via
application of composts and digestates60.
4.4.6 Mercury (Hg)
Summary of findings
Table 4.7 Summary of key findings for exposure of mercury via use of compost and digestates
Key findings of the risk assessment of mercury in contaminated composts and digestates
Overall range of compost and digestate concentrations <0.018-0.98 mg/kg dw
Major raw material sources The data suggests that the concentrations may be higher with
biowaste and green waste, and solid and liquid biowaste as raw
material sources than renewable raw materials and co-digestion
as raw material sources. However, only very limited data are
available. It is not possible to differentiate whether natural or
anthropogenic in origin61.
Safe limit concentration in compost and digestate 0.2 mg/kg dry wt for C/D applied to agricultural land
Main concern(s) arising Secondary poisoning.
Transfer over long distances.
Effects considered in the main concern hazard(s) Concerns for secondary poisoning are based on the existing EQS
for biota. The effects considered in deriving the EQS are not
clear.
Uncertainties and their implications No quantitative risk characterisation for sediment or soil has
been carried out. Therefore the risks to these protection goals is
unclear.
Small occurrence data set covering limited number of countries.
Sensitivity of exposures to variations in water management in the
local container growing scenario is low.
Other remarks The overall contribution from C/D to the total concentration of
mercury in agricultural soil is low.
European Union is a signatory to the UN Minamata Convention
on Mercury.
The realistic worst case analysis carried out indicates RCRs <1 for water for scenario I and scenario II,
indicating a low risk. However the realistic worst case analysis results in RCRs >1 for secondary poisoning for
scenario I. In order to control this risk, the maximum concentration of mercury in compost or digestate would
58 This refers to the regional and continental spatial scales in the EUSES model. Refer to Section 1.7 of Appendix D for further
information. 59 The possibility or not for transfer over long distance is largely an inherent property of the substances themselves, but it is interesting if
this is expressed even when the pathway into the environment is so dominated by incorporation into soil. 60 Please note this is not to be interpreted as how much time elapses to reach steady state; the steady state predicted by the model are
the amounts and distribution at the regional and continental scale arising from the compost and digestate use application pathway only.
Adding in the release of the same substances via other pathways (air and waste water) and natural sources, could lead to a different
steady state picture. 61 The presence of heavy metals in compost/digestate could result from natural occurrence, industrial sources or a combination of both.
Metals will generally be present (at relatively low levels) in most living matter and survive the processes associated with anaerobic
digestion / composting.

58 © Wood Environment & Infrastructure Solutions UK Limited
February 2019
Doc Ref. 40039CL003i3
need to be limited to ≤0.2 mg/kg dry weight. This value is below the proposed FPR limit value for mercury.
The highest reported concentration of mercury in digestate is 0.17 mg/kg dry weight and the mid-range
concentration reported in compost are <0.2 mg/kg dry weight, which would not lead to a risk based on these
calculations, but the highest reported concentration in compost (0.98 mg/kg dry weight) would lead to RCRs
>1 for secondary poisoning.
The contribution from C/D to the total background levels of mercury present in agricultural soil from all
sources is small. At steady state, ~3% of the total mass remains within the region + continent62, suggesting
that there is potential for transfer over long distances following release via the handling and application of
C/D63. The realistic worst-case mass of mercury in the region + continent at steady state as a result of use of
C/D is estimated to be around 4.24×10⁵ kg assuming that all compost contains mercury at the mid-range of
the levels that have been measured. This steady-state mass amounts to 10 times the mass released annually
via application of composts and digestates. It is important to note, however, that a significant proportion
(~97%) of the steady-state mass of mercury is predicted to have transported out of the region and continent
to more remote areas.
It should be noted that the European Union is a signatory to the UN Minamata Convention on Mercury. The
Minamata Convention is a global treaty to protect human health and the environment from the adverse
effects of mercury and entered into force on 16 August 2017. Among other things the Convention covers
control measures on emissions to air and on releases to land and water, and disposal of mercury once it
becomes waste; hence it could be anticipated that levels of mercury in raw materials for composts and
digestates would consequently be reduced in future.
4.4.7 Bisphenol-A (BPA)
Sensitivity to specific variables
In respect of local Scenario II, the sensitivity of the outcomes to possible losses from the system by leaching
and drainage of excess water has been explored using a fugacity method. For this substance the proportion
of substance in the system distributed to the interstitial water at equilibrium under ‘high water content’
conditions, and hence sensitive to leaching, is 3.7% of the substance present in the system. Hence, the
sensitivity of the exposure scenario to such variations in water management is considered to be low.
Summary of findings
Table 4.8 Summary of key findings for exposure of bisphenol-A via use of compost and digestates
Key findings of the risk assessment of bisphenol-A in contaminated composts and digestates
Overall range of compost and digestate concentrations Very limited data, all for one specific sampled region (2015,
Bavaria) <0.01 - 1 mg/kg dw
Major raw material sources Renewable raw materials, or not stated.
Safe limit concentration in compost and digestate Not applicable (risk characterisation ratio not definable).
Main concern(s) arising Reprotoxin and endocrine disruptor (SVHC)
Effects considered in the main concern hazard(s) SVHC (reproduction; endocrine disrupting in relation to both
human health and the environment).
62 This refers to the regional and continental spatial scales in the EUSES model. Refer to Section 1.7 of Appendix D for further
information. 63 The possibility or not for transfer over long distance is largely an inherent property of the substances themselves, but it is interesting if
this is expressed even when the pathway into the environment is so dominated by incorporation into soil.

59 © Wood Environment & Infrastructure Solutions UK Limited
February 2019
Doc Ref. 40039CL003i3
Key findings of the risk assessment of bisphenol-A in contaminated composts and digestates
DNELoral for the general population available in respect of
effects on mammary gland, reproductive, neurobehavioural,
immune and metabolic systems.
PNECs are available derived using species sensitivity
distributions.
Quantitative risk characterisation has not been attempted in this
study.
Uncertainties and their implications Very limited data set of concentrations in composts / digestates
means release amounts could be under- or over-estimated in
this model.
Sensitivity of exposures to variations in water management in the
local container growing scenario is low. In circumstances where
a) the system is watered in excess of the water holding capacity
of the growing medium and b) where the container design
means that excess water will drain away and not remain in
contact with the container/growing medium, then a small
proportion of the substance could be lost from the system in the
drained water.
Other remarks None
Bisphenol A is a SVHC (toxic for reproduction with endocrine disrupting properties in respect of both the
environment and human health) and in view of these hazardous properties, quantitative risk characterisation
has not been attempted in this study. However, it is noted that the predicted local total daily intake for
humans does not exceed the DNEL used by EFSA and RAC, and the PNECs adopted in the 2010 ESR risk
assessment are not exceeded. The highest contribution(s) to human exposure via the environment arising
from the application of C/D is mainly associated with dietary consumption of root vegetables.
The regional scale predicted environmental concentration (PEC) in agricultural soil arising from the
application of C/D is well below the background concentration arising from the industrial life cycle, calculated
in the ESR risk assessment.
At steady state, >99% of the total mass remains within the region + continent64, of which the significant
majority remains within soil. This suggests there is low mobility and little potential for transfer over long
distances following release via the handling and application of C/D65. The total mass in the region +
continent at steady state is however relatively low, less than 2 t in total even when a conservative
concentration in the compost/digestate is assumed. This steady-state mass amounts to a small fraction (~0.1)
of the mass released annually via application of composts and digestates66, suggesting that long-term
gradual accumulation is not anticipated from exposure via this source.
64 This refers to the regional and continental spatial scales in the EUSES model. Refer to Section 1.7 of Appendix D for further
information. 65 The possibility or not for transfer over long distance is largely an inherent property of the substances themselves, but it is interesting if
this is expressed even when the pathway into the environment is so dominated by incorporation into soil. 66 Please note this is not to be interpreted as how much time elapses to reach steady state; the steady state predicted by the model are
the amounts and distribution at the regional and continental scale arising from the compost and digestate use application pathway only.
Adding in the release of the same substances via other pathways (air and waste water) could lead to a different steady state picture.

60 © Wood Environment & Infrastructure Solutions UK Limited
February 2019
Doc Ref. 40039CL003i3
4.4.8 Di(2-ethylhexyl)phthalate (DEHP)
Summary of findings
Table 4.9 Summary of key findings for exposure of DEHP via use of compost and digestates
Key findings of the risk assessment of DEHP in contaminated composts and digestates
Overall range of compost and digestate concentrations 0.6-140 mg/kg dw (or higher; the upper limit value is reportedly
an average).
Major raw material sources High concentrations associated with digestates prepared from
biowaste-food and garden waste (Norway), and municipal
sewage sludge from wastewater treatment plants (Finland).
Safe limit concentration in compost and digestate Not applicable (risk characterisation ratio not definable).
Main concern(s) arising Humans via dietary exposure (container growing);
High cumulative loads at steady state.
Absolute concentrations in compost/digestate exceeding existing
local limit values / guide values.
Local PEC in freshwater (local scenario I) exceeds annual average
EQS (Directive 2008/105/EC as amended (2013/39/EU)) (though
regional background PEC does not).
Effects considered in the main concern hazard(s) SVHC (toxic for reproduction, endocrine disrupting in relation to
both human health and environment). Basis of the EQS (AA-QS)
is not stated in the Directive but is understood to relate to
secondary poisoning of predators (The Commission 2005).
Uncertainties and their implications Concentrations in composts and digestates have high variability
– local PECs would similarly be variable and could be still higher
than modelled here.
Sensitivity of exposures to variations in water management in the
local container growing scenario is low.
Other remarks Measured concentration in sludge-amended soil support the
local estimated concentration.
The highest reported occurrence values in digestate exceed a national limit value of 50 mg/kg digestate dw
applicable (or relevant as a guide value) in several European countries. This in itself indicates a potential issue.
These high occurrence concentrations were reported in digestates prepared from biowaste-food and garden
waste (Norway), and municipal sewage sludge from wastewater treatment plants (Finland).
As an SVHC (toxic for reproduction with endocrine disrupting properties for environment and human health),
risk characterisation has not been quantified. However, it is noted that the local total daily intake for humans
associated with local scenario II slightly exceeds the DNELoral for general population defined by Danish EPA
(2016). Additionally, the predicted exposures in soil in local scenario II are approaching the PNEC value
defined by EC (2008).
The estimated regional exposures in agricultural soils and grassland arising from the application of C/D are
below the estimated background PECs derived from the EC (2008) ESR risk assessment based on the
industrial life cycle. The estimated local exposures in agricultural soils from Scenario I is within the range
measured for a sludge-fertilised agricultural soil.
The highest contribution to human exposure via the environment arising from the use of C/D in either
scenario is mainly associated with dietary consumption of root vegetables.

61 © Wood Environment & Infrastructure Solutions UK Limited
February 2019
Doc Ref. 40039CL003i3
At steady state, >99% of the total mass remains within the region + continent67, with the vast majority of
substance remaining in the agricultural soil. This suggests there is low potential for transfer over long
distances following release via the handling and application of C/D68.
The total mass in the region + continent at steady state is very high (>1000 t) based on the more
conservative interpretation of the available concentration data, and still significant (90 t) even when releases
are based on a less conservative, relatively low concentration of DEHP in compost/digestate. This steady-
state mass amounts to 1.2 times the mass released annually via application of composts and digestates69,
suggesting that long-term gradual accumulation is not anticipated from exposure via this source.
4.4.9 17α-Ethinylestradiol
Sensitivity to specific variables
The main sources of uncertainty in the assessment of this substance are:
BCF in fish (value 110 l/kg ± 1 log unit);
Koc (range QSAR value 510 to RIVM 4768 (source uncertain);
Kow (value 3.67 ± 1 log unit);
Water solubility (value 11.3 mg/l ± 1 log unit); and
Vapour pressure (value 2.6E-07 Pa ± 1 log unit).
The impact of varying each property within the specified range or within a suitable uncertainty range was
explored independently. Refer to the figures below, which illustrate the impact on relevant predicted
exposure concentrations.
67 This refers to the regional and continental spatial scales in the EUSES model. Refer to Section 1.7 of Appendix D for further
information. 68 The possibility or not for transfer over long distance is largely an inherent property of the substances themselves, but it is interesting if
this is expressed even when the pathway into the environment is so dominated by incorporation into soil. 69 Please note this is not to be interpreted as how much time elapses to reach steady state; the steady state predicted by the model are
the amounts and distribution at the regional and continental scale arising from the compost and digestate use application pathway only.
Adding in the release of the same substances via other pathways (air and waste water) could lead to a different steady state picture.

62 © Wood Environment & Infrastructure Solutions UK Limited
February 2019
Doc Ref. 40039CL003i3
Figure 4.2 Sensitivity of selected outputs in the assessment of 17α-ethinylestradiol to the Koc input value:
fresh water sediment
Figure 4.3 Sensitivity of selected outputs in the assessment of 17α-ethinylestradiol to the Koc input value:
diet of worm-eating birds and mammals
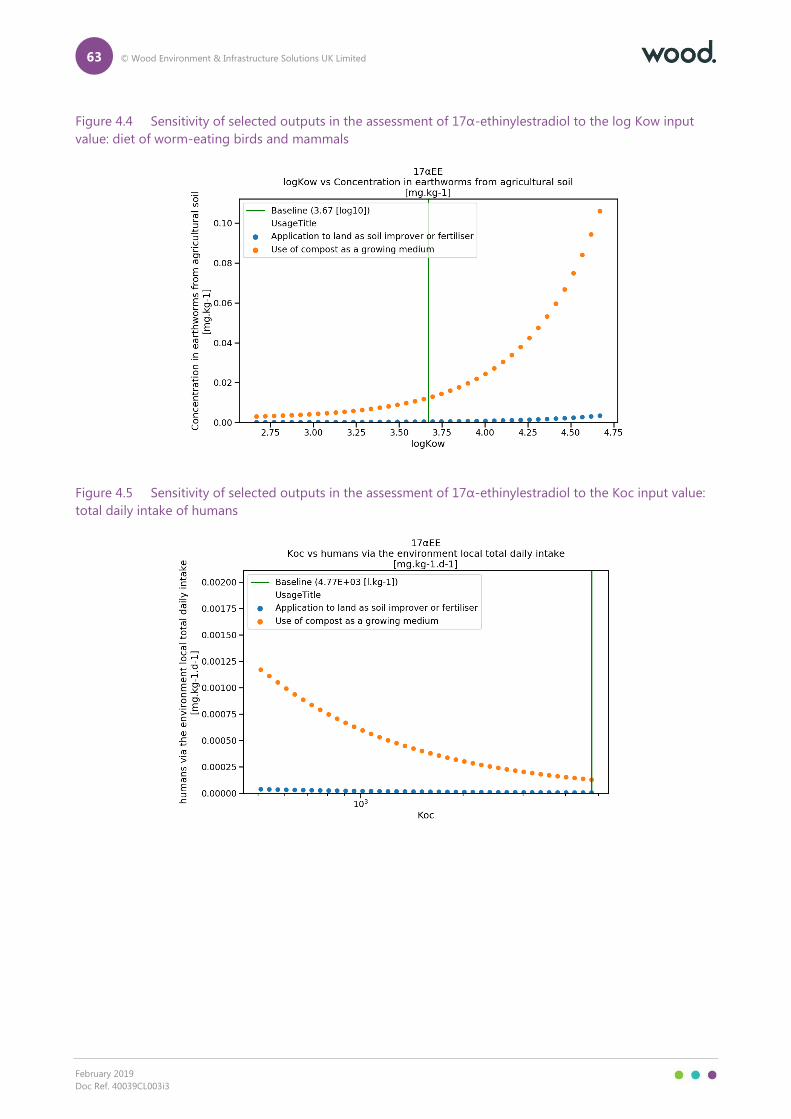
63 © Wood Environment & Infrastructure Solutions UK Limited
February 2019
Doc Ref. 40039CL003i3
Figure 4.4 Sensitivity of selected outputs in the assessment of 17α-ethinylestradiol to the log Kow input
value: diet of worm-eating birds and mammals
Figure 4.5 Sensitivity of selected outputs in the assessment of 17α-ethinylestradiol to the Koc input value:
total daily intake of humans

64 © Wood Environment & Infrastructure Solutions UK Limited
February 2019
Doc Ref. 40039CL003i3
Figure 4.6 Sensitivity of selected outputs in the assessment of 17α-ethinylestradiol to the BCF input value:
diet of fish-eating birds and mammals
It can be concluded that:
At the Koc value used in the baseline assessment, the PNECsediment arising from the
application to land scenario has been estimated conservatively.
The secondary poisoning exposure of worm-eating birds and mammals and local total daily
intake, arising from use in the container growing scenario, could have been significantly higher
than estimated in the baseline assessment, if the lower value of Koc is accurate, and/or within a
reasonable uncertainty range around the literature log Kow value.
The secondary poisoning exposure of fish-eating birds and mammals (local scenario I) could be
up to 5x higher within a reasonable uncertainty range around the BCF value, which is estimated
in the absence of data.

65 © Wood Environment & Infrastructure Solutions UK Limited
February 2019
Doc Ref. 40039CL003i3
In respect of local Scenario II, the sensitivity of the outcomes to possible losses from the system by leaching
and drainage of excess water has been explored using a fugacity method. For this substance the proportion
of substance in the system distributed to the interstitial water at equilibrium under ‘high water content’
conditions, and hence sensitive to leaching, is ≤1% of the substance present in the system. Hence, the
sensitivity of the exposure scenario to such variations in water management is considered to be low.
Summary of findings
Table 4.10 Summary of key findings for exposure of 17α-ethinylestradiol via use of compost and digestates
Key findings of the risk assessment of 17α-ethinylestradiol in contaminated composts and digestates
Overall range of compost and digestate concentrations <LOD – 0.483 mg/kg dw
Major raw material sources WWTP sewage sludges
Safe limit concentration in compost and digestate Not applicable (risk characterisation ratio not definable).
Main concern(s) arising Endocrine disruptor with unclear safe limit thresholds. Modelling
suggests a possibility of transfer over long distances.
Effects considered in the main concern hazard(s) No quantitative hazard threshold available.
Uncertainties and their implications Very limited data set of concentrations in composts / digestates
means release amounts could be under- or over-estimated in
this model., Some uncertainties in chemical property data values
which could be significant for predicted exposures. Threshold
values for the environment (EQS) are not established.
Sensitivity of exposures to variations in water management in the
local container growing scenario is low.
Other remarks None
In view that the substance is an endocrine disruptor with unclear safe limit thresholds, risk characterisation
has not been quantified in this assessment.
Both the BCF and Koc values used in the exposure assessment are associated with some uncertainty. The
sensitivity to these as uncertainty sources has been checked and the local predator exposure (secondary
poisoning) could be higher than estimated here.
The highest contributions to human exposure via the environment arising from the application of C/D is
mainly associated with dietary consumption of root vegetables. The local total daily intake is well below the
therapeutic pharmaceutical dose even when the exposure model assumes relatively conservative
concentrations in the compost/digestate. Again the sensitivity assessment indicates that exposures could be
higher within the uncertainty range of the BCF and Koc values.
At steady state, only around 6% of the total mass remains within the region + continent70, suggesting there
may be relatively high mobility and potential for transfer over long distances following release via the
handling and application of C/D71. Global scale modelling within EUSES suggests that at the steady state, the
majority of the substance would be found in global tropic waters, (53%), moderate waters (24%) and arctic
waters (16%). In view of the pharmaceutical use, it is noted that the absolute exposure of aquatic
70 This refers to the regional and continental spatial scales in the EUSES model. Refer to Section 1.7 of Appendix D for further
information. 71 The possibility or not for transfer over long distance is largely an inherent property of the substances themselves, but it is interesting if
this is expressed even when the pathway into the environment is so dominated by incorporation into soil.

66 © Wood Environment & Infrastructure Solutions UK Limited
February 2019
Doc Ref. 40039CL003i3
environments arising from the use of C/D containing 17α-ethinylestradiol is likely to be small compared to
the exposure of receiving waters from municipal wastewater treatment plants.
The total mass in the region + continent at steady state is low (approximately 7 t total) even when the
exposure model assumes relatively conservative concentrations in the compost/digestate. This steady-state
mass amounts to 1.3 times the mass released annually via application of composts and digestates.
4.4.10 Hexabromocyclododecane (HBCDD)
Sensitivity to specific variables
The main source of uncertainty in the assessment of this substance is the wide range in the reported
concentration levels of the substance in C/D.
The impact of varying the releases within the specified range was explored. Refer to the table below, which
illustrates the impact on relevant predicted exposure concentrations. The inputs used in the ‘more
conservative’ and ‘less conservative’ assessments are discussed in more detail in Appendix D.
Table 4.11 Sensitivity of selected outputs in the assessment of HBCDD to the concentrations reported in
composts and digestates
More conservative
(realistic worst case)
Less conservative
(general case)
Units
PECagricultural soil – local scenario I 1.06E-02 5.19E-03 [mg.kgdwt-1]
PECagricultural soil – local scenario II 2.01E+00 9.90E-01 [mg.kgdwt-1]
Humans via the environment: local total
daily intake – local scenario I
4.72E-04 2.12E-04 [mg.kg-1.d-1]
Humans via the environment: local total
daily intake – local scenario II
3.77E-02 1.85E-02 [mg.kg-1.d-1]
Total steady-state mass (region +
continent)
2.15E+01 7.56E-04 [t]
Total steady-state mass fraction (region +
continent)
6.73E+01 6.72E+01 [%]
Regional PEC in surface water (total) 1.51E-06 5.32E-11 [mg.l-1]
Secondary poisoning – freshwater fish-
eating birds and mammals – local scenario
I
1.16E+00 4.45E-01 [mg.kgwwt-1]
Secondary poisoning – worm-eating birds
and mammals – local scenario I
3.54E-04 1.67E-04 [mg.kg-1]
Secondary poisoning – worm-eating birds
and mammals – local scenario II
9.62E-02 4.74E-02 [mg.kg-1]

67 © Wood Environment & Infrastructure Solutions UK Limited
February 2019
Doc Ref. 40039CL003i3
It can be concluded that:
At the local scale, the variability in HBCDD in composts and digestates is not particularly
significant as the predicted exposure concentrations of HBCDD in important compartments are
within a factor of 2-3. This is mainly a consequence of how close the mid-range concentrations
in compost/digestate are compared to the maximum values, due to the small number of data
points.
At the regional scale, the difference between the two scenarios is much more significant for
HBCDD.
In respect of local Scenario II, the sensitivity of the outcomes to possible losses from the system by leaching
and drainage of excess water has been explored using a fugacity method. For this substance the proportion
of substance in the system distributed to the interstitial water at equilibrium under ‘high water content’
conditions, and hence sensitive to leaching, is ≤1% of the substance present in the system. Hence, the
sensitivity of the exposure scenario to such variations in water management is considered to be low.
Summary of findings
Table 4.12 Summary of key findings for exposure of HBCDD via use of compost and digestates
Key findings of the risk assessment of HBCDD in contaminated composts and digestates
Overall range of compost and digestate concentrations Very few reported values <1E-05 – 6.1 mg/kg dw
Major raw material sources The type of input material is not mentioned for the higher
concentration compost/digestates. Digestate produced from
renewable raw materials had lower concentration of HBCDD.
Safe limit concentration in compost and digestate Not applicable (risk characterisation ratio not definable).
Main concern(s) arising Source of exposure of POP/PBT.
Fresh water PEC exceeds the annual average EQS for inland
surface water at both the local (scenario I) and regional scales
(the MAC EQS is not exceeded); predator exposure via diet (local
scenario I) exceeds the EQS for biota (Directive 2008/105/EC as
amended (2013/39/EU)).
Effects considered in the main concern hazard(s) POP; SVHC (PBT); basis of EQS is not stated in the Directive but a
background document suggests both the biota and freshwater
EQS relate to effects in birds (European Commission 2011).
Uncertainties and their implications Very limited data set of concentrations in composts / digestates
means release amounts could be under- or over-estimated in this
model.
Sensitivity of exposures to variations in water management in the
local container growing scenario is low.
Other remarks
As a POP and PBT SVHC under REACH, it is in itself a potentially important finding that HBCDD has been
detected in freshly-produced composts and digestates in recent years. The raw material waste streams could
be investigated further. It is noted though that very few of the literature sources has identified HBCDD. The
same factors mean that the very small data set size for occurrence is not necessarily a cause of concern in
respect of uncertainty in the risk assessment.

68 © Wood Environment & Infrastructure Solutions UK Limited
February 2019
Doc Ref. 40039CL003i3
The estimated regional scale exposures arising from the application of C/D are well below the anthropogenic
background concentrations modelled in the ESR risk assessment (EC 2008, which were reported to compare
well with measured concentrations).
The highest contribution(s) to human exposure via the environment arising from the application of C/D is
mainly associated with dietary consumption of root vegetables.
At steady state, ca. 67% of the total mass remains within the region + continent72, suggesting that there is
limited redistribution following release via the handling and application of C/D73. Much of the remainder is
modelled to distribute to global tropic (13.5%) and global moderate (12%) waters. The total mass in the
region + continent at steady state is approximately 20 t. When a comparable scenario is assessed using a
lower level release based on the range of occurrence data, the total mass at steady state is much lower at
<1 kg. This steady-state mass amounts to 0.48 times the mass released annually via application of composts
and digestates74, suggesting that long-term gradual accumulation is not anticipated from exposure via this
source.
4.4.11 2,3,7,8-Tetrachlorodibenzodioxin (TCDD) (representative of Dioxins, Furans and
Dioxin-like PCBs chemical family)
Dioxins and related compounds are persistent organochlorine compounds generated during incineration and
as a by-product of certain industrial processes. This group covers numerous poly-chlorinated chemical
structures; theoretically there are 75 polychlorinated dibenzo-p-dioxin (PCDD) and 135 polychlorinated
dibenzofuran (PCDF) congeners, and 12 ‘dioxin-like polychlorinated biphenyls’ (dl-PCBs). One representative
PCDD and one PCDF have been selected for detailed assessment of this chemical family.
Toxicity in this group is assessed based on Toxic Equivalency Factors (TEFs) and Toxic Equivalent (TEQ)
expressing the weighted concentration equivalent to the most toxic dioxin 2,3,7,8-tetrachlorodibenzo-p-
dioxin (TCDD).
Sensitivity to specific variables
The main source of uncertainty in the assessment of this substance is the wide range in the reported
concentration levels of the substance in C/D.
The impact of varying the releases within the specified range was explored. Refer to the table below, which
illustrates the impact on relevant predicted exposure concentrations. The inputs used in the ‘more
conservative’ and ‘less conservative’ assessments is discussed in more detail in Appendix D.
Table 4.13 Sensitivity of selected outputs in the assessment of 2,3,7,8-TCDD to the concentrations reported
in composts and digestates
More conservative (realistic
worst case)
Less conservative (general
case)
Units
PECagricultural soil – local
scenario I
2.40E-04 2.15E-05 [mg.kgdwt-1]
72 This refers to the regional and continental spatial scales in the EUSES model. Refer to Section 1.7 of Appendix D and the Annex for
further information. 73 The possibility or not for transfer over long distance is largely an inherent property of the substances themselves, but it is interesting if
this is expressed even when the pathway into the environment is so dominated by incorporation into soil. 74 Please note this is not to be interpreted as how much time elapses to reach steady state; the steady state predicted by the model are
the amounts and distribution at the regional and continental scale arising from the compost and digestate use application pathway only.
Adding in the release of the same substances via other pathways (air and waste water) could lead to a different steady state picture.

69 © Wood Environment & Infrastructure Solutions UK Limited
February 2019
Doc Ref. 40039CL003i3
PECagricultural soil – local
scenario II
3.96E-03 4.29E-04 [mg.kgdwt-1]
Humans via the environment:
local total daily intake – local
scenario I
7.75E-07 5.87E-08 [mg.kg-1.d-1]
Humans via the environment:
local total daily intake – local
scenario II
9.98E-06 1.07E-06 [mg.kg-1.d-1]
Total steady-state mass
(region + continent)
1.59E+01 8.00E-04 [t]
Total steady-state mass
fraction (region + continent)
9.91E+01 9.91E+01 [%]
Regional PEC in surface water
(total)
2.65E-09 1.33E-13 [mg.l-1]
Secondary poisoning –
freshwater fish-eating birds
and mammals – local scenario
I
2.58E-05 1.91E-06 [mg.kgwwt-1]
Secondary poisoning – worm-
eating birds and mammals –
local scenario I
1.90E-04 8.89E-06 [mg.kg-1]
Secondary poisoning – worm-
eating birds and mammals –
local scenario II
1.72E-03 1.77E-04 [mg.kg-1]
It can be concluded that:
At the local scale, the predicted exposure concentrations of 2,3,7,8-TCDD in important
compartments differ by a factor of around x10-20.
At the regional scale, the difference between the two scenarios is much more significant for
2,3,7,8-TCDD at around 4 orders of magnitude.
In respect of local Scenario II, the sensitivity of the outcomes to possible losses from the system by leaching
and drainage of excess water has been explored using a fugacity method. For this substance the proportion
of substance in the system distributed to the interstitial water at equilibrium under ‘high water content’
conditions, and hence sensitive to leaching, is ≤1% of the substance present in the system. Hence, the
sensitivity of the exposure scenario to such variations in water management is considered to be low.
Summary of findings
Table 4.14 Summary of key findings for exposure of 2,3,7,8-TCDD via use of compost and digestates
Key findings of the risk assessment of 2,3,7,8-TCDD in contaminated composts and digestates
Overall range of compost and digestate concentrations 7E-09 – 0.0145 mg/kg dw (total PCDD/PDCF)
Major raw material sources Highest values are reported for sewage sludge composts and
biowaste/green waste manure energy crop digestate.

70 © Wood Environment & Infrastructure Solutions UK Limited
February 2019
Doc Ref. 40039CL003i3
Key findings of the risk assessment of 2,3,7,8-TCDD in contaminated composts and digestates
Safe limit concentration in compost and digestate Not applicable (risk characterisation ratio not definable).
Main concern(s) arising Source of exposure of POP/PBT; significant cumulative loads at
steady state; absolute concentrations exceeding previously
published measured concentrations in foods; absolute
concentrations in compost/digestate exceeding existing local
limit values / guide values (but not exceeding EC Regulation
1195/2006); predator exposure via diet (local scenarios I and II)
exceed the EQS for biota (Directive 2008/105/EC as amended
(2013/39/EU)).
Effects considered in the main concern hazard(s) POP; basis of EQS is not stated in the Directive and is unclear
Uncertainties and their implications Very variable data set of concentrations in composts / digestates
means release amounts could be under- or over-estimated in this
model.
Sensitivity of exposures to variations in water management in the
local container growing scenario is low.
Other remarks None.
As POPs, it is noteworthy that PCDD/PCDF and PCBs have been detected in freshly-produced composts and
digestates at several different locations in recent years. Their presence may result from atmospheric
deposition of emissions from combustion or municipal solid waste incineration rather than originating from
the raw material waste streams. This is an area for possible future work.
The highest reported concentrations in composts and digestates already appear to exceed the national limit
value for several member states, although still within the 15 μg/kg limit referenced from Council Regulation
(EC) No 1195/2006 of 18 July 2006 amending Annex IV to Regulation (EC) No 850/2004 (POPs Regulation).
These high occurrence concentrations arise from composts and digestates from a range of raw materials and
processing types.
The highest contribution(s) to human exposure via the environment arising from the application of compost
and digestate is mainly associated with (dietary consumption of root vegetables). The estimated exposures
arising from the application of C/D are high compared with reported mean/median levels of PCDD/PCDF in
foodstuffs including vegetables, in Western Europe as summarised by WHO (2002). This is the case even
when lower concentrations were assumed in the exposure model (for example, the ‘low concentration’
exposure assessment for 2,3,7,8-TCDD results in concentrations of 1E-05 mg/kg and 2E-04 mg/kg in root
tissue of plants arising from application to land (local scenario I) and container growing (local scenario II)
respectively. However the WHO summary reports a weighted mean of 0.003 pg PCDD/PCDF/g whole food
(equivalent to 3E-9 mg/kg) for vegetable products.
At steady state, >99% of the total mass remains within the region + continent75, suggesting that there is
relatively low potential for transfer over long distances following release via the handling and application of
C/D76. The total mass in the region + continent at steady state is 16t which is significant but not particularly
high. This steady-state mass amounts to 320 times the mass released annually via application of composts
75 This refers to the regional and continental spatial scales in the EUSES model. Refer to Section 1.7 of Appendix D for further
information. 76 The possibility or not for transfer over long distance is largely an inherent property of the substances themselves, but it is interesting if
this is expressed even when the pathway into the environment is so dominated by incorporation into soil.

71 © Wood Environment & Infrastructure Solutions UK Limited
February 2019
Doc Ref. 40039CL003i3
and digestates77. When a comparable scenario is assessed using a lower level release, the steady state mass is
very low (below 1 kg).
4.4.12 2,3,4,7,8-Pentachlorodibenzofuran (PCDF) (representative of Dioxins, Furans and
Dioxin-like PCBs chemical family)
Sensitivity to specific variables
The main sources of uncertainty in the assessment of this substance are:
Kow (value 6.92 ± 1 log unit);
Water solubility (value 2.35E-04 mg/l ± 1 log unit);
Vapour pressure (value 3.51E-07 ± 1 log unit); and
Wide range in the reported concentration levels of the substance in C/D.
The impact of varying each property within a suitable uncertainty range was explored independently. Refer to
the figures below, which illustrate the impact on relevant predicted exposure concentrations. In respect of the
concentration in the compost/digestate, the impact of varying the releases within the specified range was
explored. In respect of the variable concentrations/releases, the inputs used in the ‘more conservative’ and
‘less conservative’ assessments is discussed in more detail in Appendix D.
77 Please note this is not to be interpreted as how much time elapses to reach steady state; the steady state predicted by the model are
the amounts and distribution at the regional and continental scale arising from the compost and digestate use application pathway only.
Adding in the release of the same substances via other pathways (air and waste water) could lead to a different steady state picture.

72 © Wood Environment & Infrastructure Solutions UK Limited
February 2019
Doc Ref. 40039CL003i3
Figure 4.7 Sensitivity of selected outputs in the assessment of 2,3,4,7,8-PCDF to the vapour pressure input
value: diet of fish-eating birds and mammals

73 © Wood Environment & Infrastructure Solutions UK Limited
February 2019
Doc Ref. 40039CL003i3
Figure 4.8 Sensitivity of selected outputs in the assessment of 2,3,4,7,8-PCDF to the vapour pressure input
value: diet of worm-eating birds and mammals

74 © Wood Environment & Infrastructure Solutions UK Limited
February 2019
Doc Ref. 40039CL003i3
Figure 4.9 Sensitivity of selected outputs in the assessment of 2,3,4,7,8-PCDF to the log Kow input value:
fresh-water sediment

75 © Wood Environment & Infrastructure Solutions UK Limited
February 2019
Doc Ref. 40039CL003i3
Figure 4.10 Sensitivity of selected outputs in the assessment of 2,3,4,7,8-PCDF to the log Kow input value:
diet of fish-eating birds and mammals

76 © Wood Environment & Infrastructure Solutions UK Limited
February 2019
Doc Ref. 40039CL003i3
Figure 4.11 Sensitivity of selected outputs in the assessment of 2,3,4,7,8-PCDF to the log Kow input value:
diet of worm-eating birds and mammals
It can be concluded that:
At the water solubility value used in the baseline assessment, all PECs have been estimated
conservatively. Within the uncertainty range, some PECs could be higher, but some could be
lower. The secondary poisoning exposure of worm-eating birds and mammals, and of fish-
eating birds and mammals could have been significantly higher (up to 2x) than estimated in the
baseline assessment, at lower Kow values and VP value or higher water solubility within a
reasonable uncertainty range around the literature values.
The local total daily intake via both exposure scenarios could have been significantly higher (up
to 2x) than estimated in the baseline assessment, at lower Kow values or higher water solubility
within a reasonable uncertainty range around the literature log Kow value.
The secondary poisoning exposure of fish-eating birds and mammals (local scenario I), and
sediment PECs, could be up to 2x higher at lower Kow values within a reasonable uncertainty
range.

77 © Wood Environment & Infrastructure Solutions UK Limited
February 2019
Doc Ref. 40039CL003i3
Table 4.15 Sensitivity of selected outputs in the assessment of 2,3,4,7,8-PCDF to the concentrations
reported in composts and digestates
More conservative (realistic
worst case)
Less conservative (general
case)
Units
PECagricultural soil – local
scenario I
3.14E-04 2.15E-05 [mg.kgdwt-1]
PECagricultural soil – local
scenario II
4.03E-03 4.29E-04 [mg.kgdwt-1]
Humans via the environment:
local total daily intake – local
scenario I
1.08E-05 7.22E-07 [mg.kg-1.d-1]
Humans via the environment:
local total daily intake – local
scenario II
1.17E-04 1.24E-05 [mg.kg-1.d-1]
Total steady-state mass
(region + continent)
4.88E+01 2.46E-03 [t]
Total steady-state mass
fraction (region + continent)
5.87E+01 5.87E+01 [%]
Regional PEC in surface water
(total)
1.40E-08 7.05E-13 [mg.l-1]
Secondary poisoning –
freshwater fish-eating birds
and mammals – local scenario
I
6.89E-03 2.98E-04 [mg.kgwwt-1]
Secondary poisoning – worm-
eating birds and mammals –
local scenario I
4.05E-03 9.61E-05 [mg.kg-1]
Secondary poisoning – worm-
eating birds and mammals –
local scenario II
2.06E-02 1.91E-03 [mg.kg-1]
It can be concluded that:
At the local scale, the predicted exposure concentrations of 2,3,4,7,8-PCDF in important
compartments differ by a factor of around x10-20.
At the regional scale, the difference between the two scenarios is much more significant for
2,3,4,7,8-PCDF at more than 4 orders of magnitude.
In respect of local Scenario II, the sensitivity of the outcomes to possible losses from the system by leaching
and drainage of excess water has been explored using a fugacity method. For this substance the proportion
of substance in the system distributed to the interstitial water at equilibrium under ‘high water content’
conditions, and hence sensitive to leaching, is ≤1% of the substance present in the system. Hence, the
sensitivity of the exposure scenario to such variations in water management is considered to be low.
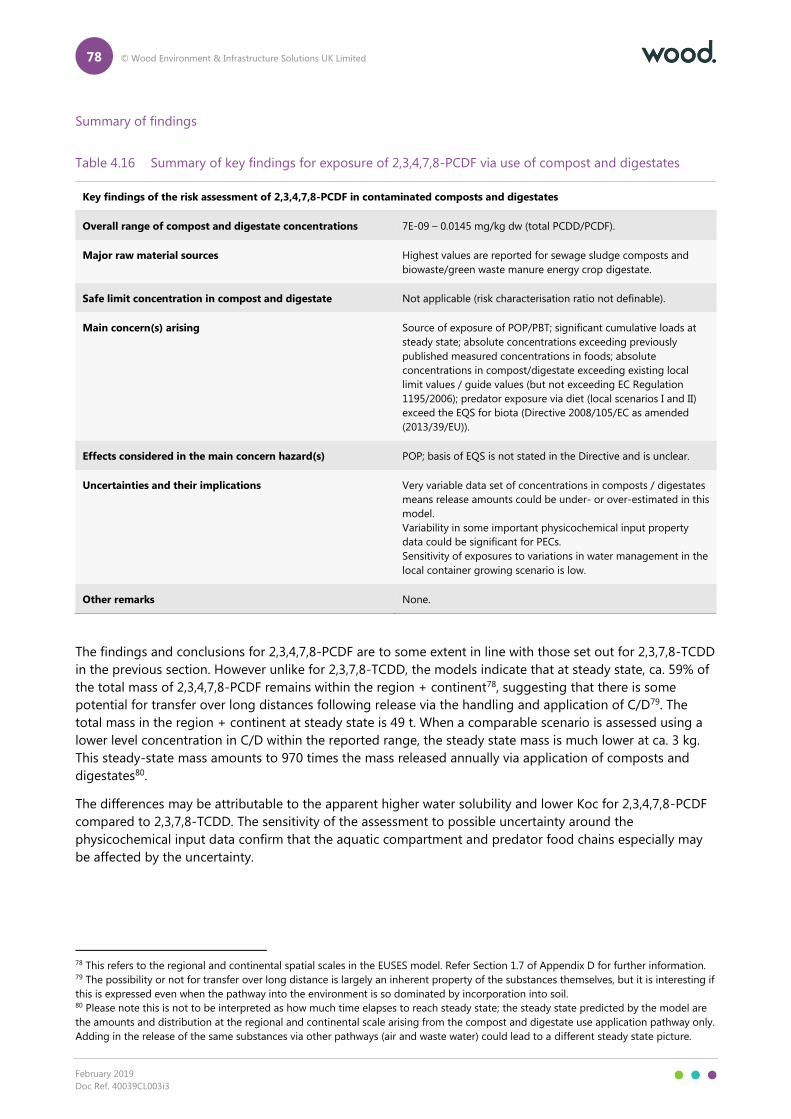
78 © Wood Environment & Infrastructure Solutions UK Limited
February 2019
Doc Ref. 40039CL003i3
Summary of findings
Table 4.16 Summary of key findings for exposure of 2,3,4,7,8-PCDF via use of compost and digestates
Key findings of the risk assessment of 2,3,4,7,8-PCDF in contaminated composts and digestates
Overall range of compost and digestate concentrations 7E-09 – 0.0145 mg/kg dw (total PCDD/PCDF).
Major raw material sources Highest values are reported for sewage sludge composts and
biowaste/green waste manure energy crop digestate.
Safe limit concentration in compost and digestate Not applicable (risk characterisation ratio not definable).
Main concern(s) arising Source of exposure of POP/PBT; significant cumulative loads at
steady state; absolute concentrations exceeding previously
published measured concentrations in foods; absolute
concentrations in compost/digestate exceeding existing local
limit values / guide values (but not exceeding EC Regulation
1195/2006); predator exposure via diet (local scenarios I and II)
exceed the EQS for biota (Directive 2008/105/EC as amended
(2013/39/EU)).
Effects considered in the main concern hazard(s) POP; basis of EQS is not stated in the Directive and is unclear.
Uncertainties and their implications Very variable data set of concentrations in composts / digestates
means release amounts could be under- or over-estimated in this
model.
Variability in some important physicochemical input property
data could be significant for PECs.
Sensitivity of exposures to variations in water management in the
local container growing scenario is low.
Other remarks None.
The findings and conclusions for 2,3,4,7,8-PCDF are to some extent in line with those set out for 2,3,7,8-TCDD
in the previous section. However unlike for 2,3,7,8-TCDD, the models indicate that at steady state, ca. 59% of
the total mass of 2,3,4,7,8-PCDF remains within the region + continent78, suggesting that there is some
potential for transfer over long distances following release via the handling and application of C/D79. The
total mass in the region + continent at steady state is 49 t. When a comparable scenario is assessed using a
lower level concentration in C/D within the reported range, the steady state mass is much lower at ca. 3 kg.
This steady-state mass amounts to 970 times the mass released annually via application of composts and
digestates80.
The differences may be attributable to the apparent higher water solubility and lower Koc for 2,3,4,7,8-PCDF
compared to 2,3,7,8-TCDD. The sensitivity of the assessment to possible uncertainty around the
physicochemical input data confirm that the aquatic compartment and predator food chains especially may
be affected by the uncertainty.
78 This refers to the regional and continental spatial scales in the EUSES model. Refer Section 1.7 of Appendix D for further information. 79 The possibility or not for transfer over long distance is largely an inherent property of the substances themselves, but it is interesting if
this is expressed even when the pathway into the environment is so dominated by incorporation into soil. 80 Please note this is not to be interpreted as how much time elapses to reach steady state; the steady state predicted by the model are
the amounts and distribution at the regional and continental scale arising from the compost and digestate use application pathway only.
Adding in the release of the same substances via other pathways (air and waste water) could lead to a different steady state picture.

79 © Wood Environment & Infrastructure Solutions UK Limited
February 2019
Doc Ref. 40039CL003i3
4.4.13 2,4,4'-Trichlorobiphenyl (PCB28) (representative of PCBs chemical family)
Sensitivity to specific variables
The main sources of uncertainty in the assessment of this substance are:
BCF in fish (literature data range 2E+04 to 4E+05 l/kg);
Koc (literature data range 3400 to 6.3E+05 l/kg); and
log Kow (literature data range 4.4 to 5.9).
The impact of varying each property within the specified range was explored independently. Refer to the
figures below, which illustrate the impact on relevant predicted exposure concentrations.
Figure 4.12 Sensitivity of selected outputs in the assessment of PCB28 to the Koc input value: diet of worm-
eating birds and mammals
Note: the red line representing the EQS cannot be seen on this graph due to it overlapping the x-axis on this scale.

80 © Wood Environment & Infrastructure Solutions UK Limited
February 2019
Doc Ref. 40039CL003i3
Figure 4.13 Sensitivity of selected outputs in the assessment of PCB28 to the Koc input value: total daily
intake for humans

81 © Wood Environment & Infrastructure Solutions UK Limited
February 2019
Doc Ref. 40039CL003i3
Figure 4.14 Sensitivity of selected outputs in the assessment of PCB28 to the BCF input value: diet of fish-
eating birds and mammals
Note: the red line representing the EQS cannot be seen on this graph due to it overlapping the x-axis on this scale.

82 © Wood Environment & Infrastructure Solutions UK Limited
February 2019
Doc Ref. 40039CL003i3
Figure 4.15 Sensitivity of selected outputs in the assessment of PCB28 to the log Kow input value: total daily
intake for humans

83 © Wood Environment & Infrastructure Solutions UK Limited
February 2019
Doc Ref. 40039CL003i3
Figure 4.16 Sensitivity of selected outputs in the assessment of PCB28 to the Koc input value: fresh-water
sediment
It can be concluded that:
The variation in Koc input value is of particular significance for human dietary intake levels,
sediment biota, and also predator exposure via diet (earthworms). In respect of predator
exposure the modelled concentrations in prey exceed the EQS for biota at all values of Koc so
the uncertainty does not affect the assessment conclusions.
Within the literature data range of log Kow, there is an impact on the local total daily intake for
humans; a relatively conservative value has been used but in the realistic worst case exposures
could be up to 2x higher than modelled here.
In respect of local Scenario II, the sensitivity of the outcomes to possible losses from the system by leaching
and drainage of excess water has been explored using a fugacity method. For this substance the proportion
of substance in the system distributed to the interstitial water at equilibrium under ‘high water content’
conditions, and hence sensitive to leaching, is ≤1% of the substance present in the system. Hence, the
sensitivity of the exposure scenario to such variations in water management is considered to be low.

84 © Wood Environment & Infrastructure Solutions UK Limited
February 2019
Doc Ref. 40039CL003i3
Summary of findings
Table 4.17 Summary of key findings for exposure of PCB-28 via use of compost and digestates
Key findings of the risk assessment of PCB-28 in contaminated composts and digestates
Overall range of compost and digestate concentrations 0.001 – 1.2 mg/kg dw (higher values up to 9-10 mg PCB6/kg dw
appear to be exceptional).
Major raw material sources Concentrations above ca. 0.1 µg PCBs/kg dw are reported for
digestates derived from biowaste-food and garden waste,
biowaste and green waste compost, sewage sludge compost,
C/Ds from source separation and compost made from low-grade
waste wood.
Safe limit concentration in compost and digestate Not applicable (risk characterisation ratio not definable).
Main concern(s) arising Source of exposure of POP; significant cumulative loads at steady
state; absolute concentrations exceeding previously published
measured concentrations in foods; absolute concentrations in
compost/digestate exceeding existing local limit values / guide
values (but not exceeding EC Regulation 1195/2006); predator
exposure via diet (local scenarios I and II) exceed the EQS for
biota (Directive 2008/105/EC as amended (2013/39/EU)).
Effects considered in the main concern hazard(s) POP; basis of EQS is not stated in the Directive and is unclear.
Uncertainties and their implications Range of concentrations in composts / digestates means release
amounts could be under- or over-estimated in this model.
Sensitivity of exposures to variations in water management in the
local container growing scenario is low.
Other remarks None.
As POPs, it noteworthy that PCBs have been detected in freshly-produced composts and digestates at several
different locations in recent years. Their presence may result from atmospheric deposition of emissions from
combustion or municipal solid waste incineration rather than originating from the raw material waste
streams. This is an area for possible future work.
The highest reported concentrations especially in digestates in Norway (reported by E. Govasmark et al.,
2011) appear to significantly exceed the national limit value for PCBs in that region (Forskrift om organisk
gjødsel; Mattilsynet, 2005; 1.2 mg/kg DM). These high occurrence concentrations seem to mainly relate to
digestates prepared from biowastes food and garden wastes.
The highest contribution(s) to human exposure via the environment arising from the application of C/D is
mainly associated with dietary consumption of root vegetables. The estimated exposures arising from the
application of C/D are high compared with reported mean/median levels of PCBs in foodstuffs including
vegetables, in Western Europe as summarised by WHO (2002). This is the case even when lower
concentrations were assumed in the exposure model (for example, the ‘low concentration’ exposure
assessment for PCB28 results in concentrations of 2E-03 mg/kg and 0.03 mg/kg in root tissue of plants
arising from application to land (local scenario I) and container growing (local scenario II) respectively.
However, the WHO summary reports a weighted mean of 0.04 pg PCBs/g whole food (equivalent to 4E-08
mg/kg) for vegetable products.

85 © Wood Environment & Infrastructure Solutions UK Limited
February 2019
Doc Ref. 40039CL003i3
At steady state, 97% of the total mass remains within the region + continent81, suggesting that there is
relatively low potential transfer over long distances following release via the handling and application of
C/D82. The total mass in the region + continent at steady state is very high at 270 t. Even when a comparable
scenario is assessed using a lower level release, ca. 15 t is modelled to remain within the region + continent
at steady state. This steady-state mass amounts to 200 times the mass released annually via application of
composts and digestates83.
The consulted sources of property data show there is variation in some input properties. The sensitivity of the
conclusions to this uncertainty has been investigated and it is noted that variation in the value of Koc and
BCF particularly across the range given could be significant in respect of the predicted exposure
concentrations in freshwater sediment, worm-eating predators via the food chain, and humans exposed via
the environment. This is an important source of uncertainty in the exposure assessment.
4.4.14 Nonylphenol (representative of Nonylphenol and Nonylphenol Ethoxylates chemical
family)
Sensitivity to specific variables
The main sources of uncertainty in the assessment of this substance are:
Kow (reliable values within range 4.4 to 5.5); and
wide range in the reported concentration levels of the substance in C/D.
The impact of varying these parameters within the specified range was explored. Refer to the figures below,
which illustrate the impact on relevant predicted exposure concentrations. The inputs used in the ‘more
conservative’ and ‘less conservative’ assessments are discussed in more detail in Appendix D.
81 This refers to the regional and continental spatial scales in the EUSES model. Refer to Section 1.7 of Appendix D for further
information. 82 The possibility or not for transfer over long distance is largely an inherent property of the substances themselves, but it is interesting if
this is expressed even when the pathway into the environment is so dominated by incorporation into soil. 83 Please note this is not to be interpreted as how much time elapses to reach steady state; the steady state predicted by the model are
the amounts and distribution at the regional and continental scale arising from the compost and digestate use application pathway only.
Adding in the release of the same substances via other pathways (air and waste water) could lead to a different steady state picture.

86 © Wood Environment & Infrastructure Solutions UK Limited
February 2019
Doc Ref. 40039CL003i3
Figure 4.17 Sensitivity of selected outputs in the assessment of nonylphenol to the log Kow input value:
freshwater sediment

87 © Wood Environment & Infrastructure Solutions UK Limited
February 2019
Doc Ref. 40039CL003i3
Figure 4.18 Sensitivity of selected outputs in the assessment of nonylphenol to the log Kow input value: diet
of worm-eating birds and mammals
Table 4.18 Sensitivity of selected outputs in the assessment of nonylphenol to the concentrations reported
in composts and digestates
More conservative (realistic
worst case)
Less conservative (3.5 mg/kg
dwt case)
Units
PECagricultural soil – local
scenario I
8.38E-02 5.87E-03 [mg.kgdwt-1]
PECagricultural soil – local
scenario II
1.55E+01 1.16E+00 [mg.kgdwt-1]
Humans via the environment:
local total daily intake – local
scenario I
1.15E-03 8.58E-05 [mg.kg-1.d-1]

88 © Wood Environment & Infrastructure Solutions UK Limited
February 2019
Doc Ref. 40039CL003i3
More conservative (realistic
worst case)
Less conservative (3.5 mg/kg
dwt case)
Units
Humans via the environment:
local total daily intake – local
scenario II
2.75E-01 2.05E-02 [mg.kg-1.d-1]
Total steady-state mass
(region + continent)
6.93E+01 6.59E+01 [t]
Total steady-state mass
fraction (region + continent)
9.44E+01 9.44E+01 [%]
Regional PEC in surface water
(total)
2.66E-06 2.53E-06 [mg.l-1]
Secondary poisoning –
freshwater fish-eating birds
and mammals – local scenario
I
5.69E-02 6.84E-03 [mg.kgwwt-1]
Secondary poisoning – worm-
eating birds and mammals –
local scenario I
1.29E-01 1.09E-02 [mg.kg-1]
Secondary poisoning – worm-
eating birds and mammals –
local scenario II
3.59E+01 2.68E+00 [mg.kg-1]
It can be concluded that:
1. If the lower log Kow value is correct then sediment PEC (local scenario I), secondary
poisoning of worm-eating birds and mammals (local scenario II), and total local daily intake
for humans could be lower than modelled. The baseline assessment is reasonably
conservative.
2. At the local scale, limiting the concentration of nonylphenol in composts and digestates to a
maximum of 3.5 mg/kg dwt could be expected to reduce the predicted exposure
concentrations of nonylphenol in important compartments by a factor of more than 10
compared to the realistic worst case, sufficient to manage risks.
3. At the regional scale at steady state, the difference between the two scenarios is not very
significant for nonylphenol.
In respect of local Scenario II, the sensitivity of the outcomes to possible losses from the system by leaching
and drainage of excess water has been explored using a fugacity method. For this substance the proportion
of substance in the system distributed to the interstitial water at equilibrium under ‘high water content’
conditions, and hence sensitive to leaching, is ≤1% of the substance present in the system. Hence, the
sensitivity of the exposure scenario to such variations in water management is considered to be low.

89 © Wood Environment & Infrastructure Solutions UK Limited
February 2019
Doc Ref. 40039CL003i3
Summary of findings
Table 4.19 Summary of key findings for exposure of nonylphenol via use of compost and digestates
Key findings of the risk assessment of nonylphenol in contaminated composts and digestates
Overall range of compost and digestate concentrations <0.1 - 50 mg/kg dw
Major raw material sources Concentrations of ca. 10 mg/kg and above reported for green
waste compost and municipal sewage sludge-derived products.
Safe limit concentration in compost and digestate 3.5 mg/kg dry wt for compost for container growing.
Main concern(s) arising Soil organisms and worm-eating predators exposed via the food
chain, both for compost for container growing.
Significant cumulative loads at steady state. Source of exposure
of humans via diet to endocrine disrupting substance.
Effects considered in the main concern hazard(s) Soil PNEC based on enchytraeid reproductive effects. Predator
PNECoral based on mammalian reproductive effects.
Uncertainties and their implications Two alternative log Kow values are available and some
protection targets are affected by the variation within the
indicated range.
Sensitivity of exposures to variations in water management in the
local container growing scenario is low.
Other remarks It is noted that the container growing scenario is likely to be
limited to exposure during a single growing season and in a
container which may not be in contact with soil. It could be that
the food chain envisaged by the model would not be fully
established on this time scale.
The highest reported concentrations in C/D already appear to exceed the national limit value for digestates
(AGW du 14/06/2001 favorisant la valorisation de certains déchets (BE), guide value of 25 mg/kg dw
applicable in Belgium; Slambekendtgørelsen value 10 mg/kg dw applicable in Denmark). The high occurrence
concentrations were found in digestates prepared from municipal sewage sludge (Finland, Kapanen et al.,
2013) although several other similar digestates and composted sludges reported lower values (even from the
same literature source).
To the extent that risk characterisation has been possible, unacceptable risks are indicated for the container
growing scenario (local scenario II), specifically in respect of the local soil and secondary poisoning (in worm-
eating birds and mammals) protection targets (RCRs of ca. 13 and 3.6 respectively). While risk
characterisation for humans exposed via the environment has not been quantified, it is noted that the
predicted local total daily intake associated with either mode of use (application on land or container
growing), modelled to be in the range ca. 2E-03 – 0.3 mg/kg bw/d, is comparable with the daily human
intake for local exposures associated with the various industrial use scenarios modelled in the ESR RAR
(2002). Exposure of humans via the environment is significantly dominated by consumption of root crops.
The estimated regional exposures arising from the application of compost and digestate are very low
compared with natural background concentrations in fresh water and sediments based on data cited in the
ESR RAR (2008). The annual average EQS for inland surface waters (Directive 2008/105/EC as amended
(2013/39/EU)) is not predicted to be exceeded.

90 © Wood Environment & Infrastructure Solutions UK Limited
February 2019
Doc Ref. 40039CL003i3
It is notable that, at steady state, approximately 94% of the total mass remains within the region +
continent84, with the majority remaining within agricultural soil. This suggests that there is relatively low
transfer over long distances following release via the handling and application of C/D85.
The total mass in the region + continent at steady state is 69 t, when relatively conservative assumptions are
made in regard to the concentration of nonylphenol in the compost/digestate. This steady-state mass
amounts to 0.4 times the mass released annually via application of composts and digestates86, suggesting
that long-term gradual accumulation is not anticipated from exposure via this source.
The value of log Kow has been identified in the RAC/SEAC assessment (2014) as a key uncertainty, with
possible impacts on various other parameters derived from it (particularly bioconcentration factor for
earthworms and organic carbon adsorption coefficient Koc). In terms of the present assessment, it is noted
that the two different values available for log Kow would indicate a relatively small difference in the predicted
exposure concentrations in sediment (scenario I), although the PNEC is still not exceeded; and in the local
total daily intake for humans exposed via the environment. This is therefore not considered to be an
important source of uncertainty in the exposure assessment for these protection targets.
4.4.15 Benzo[a]pyrene (representative of PAH16 chemical family)
PAH are generated as by-products of combustion or pyrolysis of organic matter and hence almost always
occur as mixtures. The PAH selected for substance-specific assessment are substances of higher molecular
mass. There are precedents for assessing subgroups of PAH in regulatory contexts, and for use of certain PAH
substances and small groups of PAHs as reference markers for the wider chemical family, to simplify
analytical monitoring.
Sensitivity to specific variables
The main source of uncertainty in the assessment of this substance is the value of Koc. Several values
covering an extremely wide range have been reported (log Koc 6.66 (LSC), Eadie et al. (1990); 6.26 (Average
on sediments), Kayal & Connell (1990); 8.3 (Specified particulate), Broman et al. (1990), 4.0 (Predicted to be
dissolved), Broman et al. (1990). The assessment in this project follows the approach used in the ESR RAR for
coal tar pitch high temperature (log Koc 5.92, Karickhoff, 1979) but it is of interest to see how the variation
across this range affects PECs resulting from these release scenarios.
log Koc (range 4 to 8 as log values)
The impact of varying this property within the specified range was explored. Refer to the figures below, which
illustrate the impact on relevant predicted exposure concentrations.
84 This refers to the regional and continental spatial scales in the EUSES model. Refer to Section 1.7 of Appendix D for further
information. 85 The possibility or not for transfer over long distance is largely an inherent property of the substances themselves, but it is interesting if
this is expressed even when the pathway into the environment is so dominated by incorporation into soil. 86 Please note this is not to be interpreted as how much time elapses to reach steady state; the steady state predicted by the model are
the amounts and distribution at the regional and continental scale arising from the compost and digestate use application pathway only.
Adding in the release of the same substances via other pathways (air and waste water) could lead to a different steady state picture.

91 © Wood Environment & Infrastructure Solutions UK Limited
February 2019
Doc Ref. 40039CL003i3
Figure 4.19 Sensitivity of selected outputs in the assessment of benzo[a]pyrene to the Koc input value: diet
of worm- and fish-eating birds and mammals
Note: the red line representing the EQS cannot be seen on this graph due to it overlapping the x-axis on this scale.

92 © Wood Environment & Infrastructure Solutions UK Limited
February 2019
Doc Ref. 40039CL003i3

93 © Wood Environment & Infrastructure Solutions UK Limited
February 2019
Doc Ref. 40039CL003i3
Figure 4.20 Sensitivity of selected outputs in the assessment of benzo[a]pyrene to the Koc input value:
freshwater sediment
Note: the red line representing the PNEC cannot be seen on this graph due to it exceeding the maximum value of the y-axis on this
scale.
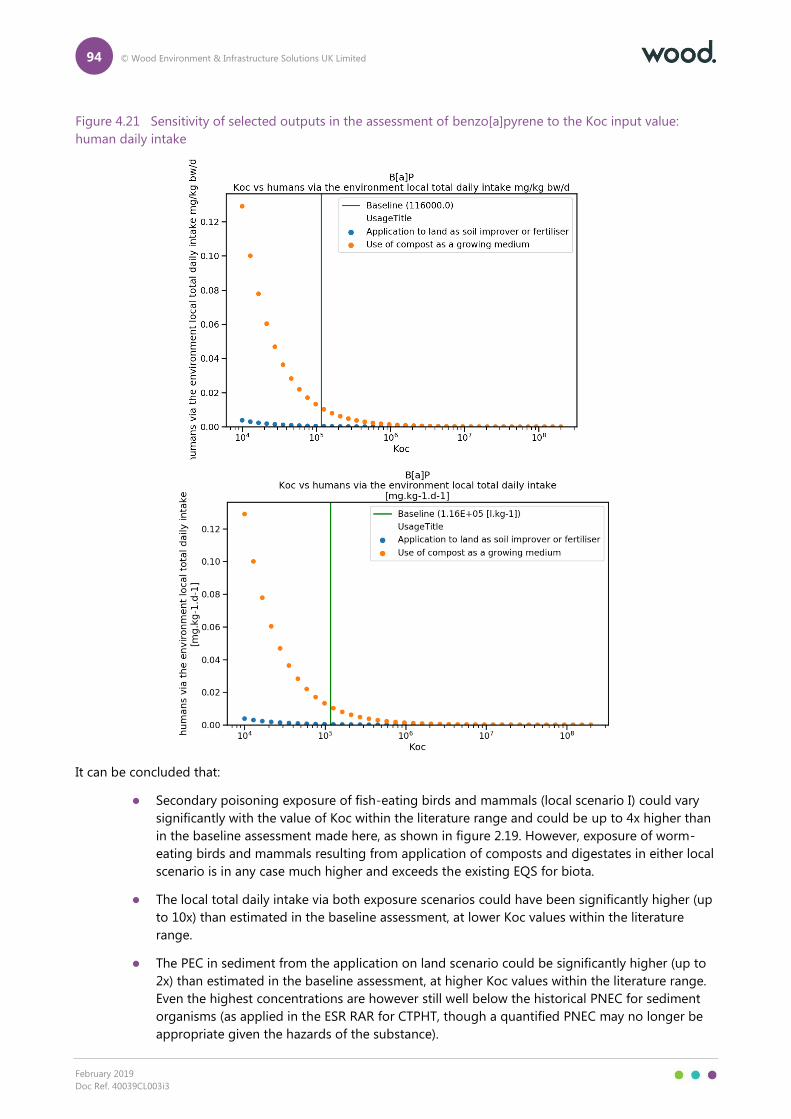
94 © Wood Environment & Infrastructure Solutions UK Limited
February 2019
Doc Ref. 40039CL003i3
Figure 4.21 Sensitivity of selected outputs in the assessment of benzo[a]pyrene to the Koc input value:
human daily intake
It can be concluded that:
Secondary poisoning exposure of fish-eating birds and mammals (local scenario I) could vary
significantly with the value of Koc within the literature range and could be up to 4x higher than
in the baseline assessment made here, as shown in figure 2.19. However, exposure of worm-
eating birds and mammals resulting from application of composts and digestates in either local
scenario is in any case much higher and exceeds the existing EQS for biota.
The local total daily intake via both exposure scenarios could have been significantly higher (up
to 10x) than estimated in the baseline assessment, at lower Koc values within the literature
range.
The PEC in sediment from the application on land scenario could be significantly higher (up to
2x) than estimated in the baseline assessment, at higher Koc values within the literature range.
Even the highest concentrations are however still well below the historical PNEC for sediment
organisms (as applied in the ESR RAR for CTPHT, though a quantified PNEC may no longer be
appropriate given the hazards of the substance).

95 © Wood Environment & Infrastructure Solutions UK Limited
February 2019
Doc Ref. 40039CL003i3
In respect of local Scenario II, the sensitivity of the outcomes to possible losses from the system by leaching
and drainage of excess water has been explored using a fugacity method. For this substance the proportion
of substance in the system distributed to the interstitial water at equilibrium under ‘high water content’
conditions, and hence sensitive to leaching, is ≤1% of the substance present in the system. Hence, the
sensitivity of the exposure scenario to such variations in water management is considered to be low.
Summary of findings
Table 4.20 Summary of key findings for exposure of benzo[a]pyrene via use of compost and digestates
Key findings of the risk assessment of benzo[a]pyrene in contaminated composts and digestates
Overall range of compost and digestate concentrations <0.04 – 0.52 mg benzo[a]pyrene/kg dw, <0.3 – 20.8 mg PAH/kg
Major raw material sources PAHs reported above ca. 3 mg/kg in sewage sludge (composted
and non-composted), bio-waste and green waste compost, C/D
from source separation, digestate derived from manure/slurry,
and digestate derived from renewable raw materials.
Safe limit concentration in compost and digestate Not applicable (risk characterisation ratio not definable).
Main concern(s) arising High cumulative loads at steady state; PEC in surface water (at
regional scale and local scenario I) exceeds the annual average
EQS for benzo[a]pyrene as a marker for total PAH (2013);
predator exposure via diet (local scenarios I and II) exceed the
EQS for biota benzo[a]pyrene as a marker for total PAH (Directive
2008/105/EC as amended (2013/39/EU)).
Effects considered in the main concern hazard(s) Basis of the EQS is not stated in the Directive but is understood
to relate to human health via consumption of fishery products.
Human BMDL10 based on carcinogenicity.
Uncertainties and their implications Small occurrence data set for benzo[a]pyrene specifically means
that the exposure levels may be under- or over-estimated by the
present assessment; exposures of humans via diet, predators via
the food chain, sediment organisms could be sensitive to
variability in Koc value.
Sensitivity of exposures to variations in water management in the
local container growing scenario is low.
Other remarks Local human exposure via diet does not exceed the BMDL10.
While risk characterisation has not been quantified, it is noted that the predicted exposures in fresh water
arising from the application of composts/digestates on soil (local scenario I) exceed the safe limit (annual
average inland surface water EQS for benzo[a]pyrene as a marker for total PAH set under Directive
2008/105/EC (EU, 2008) as amended by Directive 2013/39/EU (EU, 2013)) (the MAC EQS applicable for
benzo[a]pyrene specifically is not exceeded).
It is noted that predator exposure via diet (earthworms) (local scenarios I and II) exceed the EQS for biota
benzo[a]pyrene as a marker for total PAH (Directive 2008/105/EC as amended (2013/39/EU)) although this
biota EQS normally relates to crustaceans and molluscs.
It is noted that the human exposures to PAH arising from the application of composts/digestates on soil do
not exceed the BMDL10 value either in terms of benzo[a]pyrene alone, total for PAH2 or total for PAH4.
The estimated regional concentrations in vegetables arising from the application of C/D are comparable with
the background concentrations reported by WHO in the EHC monograph 202 (1998). Local predicted
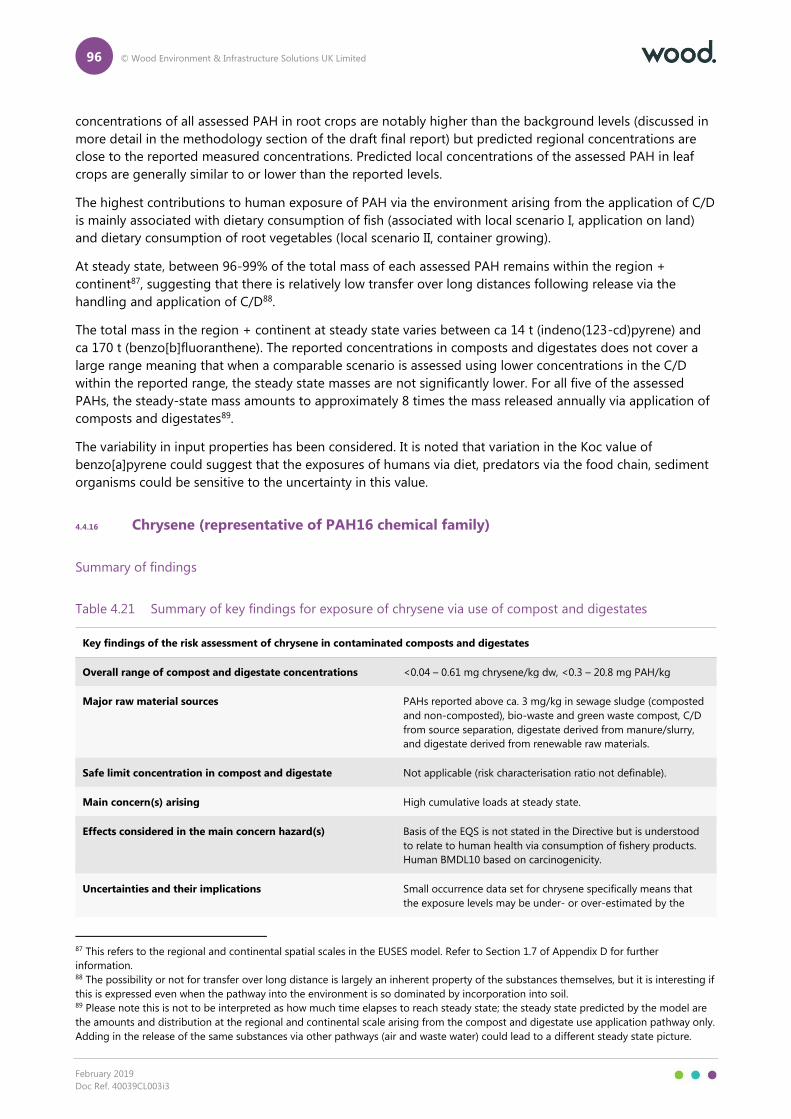
96 © Wood Environment & Infrastructure Solutions UK Limited
February 2019
Doc Ref. 40039CL003i3
concentrations of all assessed PAH in root crops are notably higher than the background levels (discussed in
more detail in the methodology section of the draft final report) but predicted regional concentrations are
close to the reported measured concentrations. Predicted local concentrations of the assessed PAH in leaf
crops are generally similar to or lower than the reported levels.
The highest contributions to human exposure of PAH via the environment arising from the application of C/D
is mainly associated with dietary consumption of fish (associated with local scenario I, application on land)
and dietary consumption of root vegetables (local scenario II, container growing).
At steady state, between 96-99% of the total mass of each assessed PAH remains within the region +
continent87, suggesting that there is relatively low transfer over long distances following release via the
handling and application of C/D88.
The total mass in the region + continent at steady state varies between ca 14 t (indeno(123-cd)pyrene) and
ca 170 t (benzo[b]fluoranthene). The reported concentrations in composts and digestates does not cover a
large range meaning that when a comparable scenario is assessed using lower concentrations in the C/D
within the reported range, the steady state masses are not significantly lower. For all five of the assessed
PAHs, the steady-state mass amounts to approximately 8 times the mass released annually via application of
composts and digestates89.
The variability in input properties has been considered. It is noted that variation in the Koc value of
benzo[a]pyrene could suggest that the exposures of humans via diet, predators via the food chain, sediment
organisms could be sensitive to the uncertainty in this value.
4.4.16 Chrysene (representative of PAH16 chemical family)
Summary of findings
Table 4.21 Summary of key findings for exposure of chrysene via use of compost and digestates
Key findings of the risk assessment of chrysene in contaminated composts and digestates
Overall range of compost and digestate concentrations <0.04 – 0.61 mg chrysene/kg dw, <0.3 – 20.8 mg PAH/kg
Major raw material sources PAHs reported above ca. 3 mg/kg in sewage sludge (composted
and non-composted), bio-waste and green waste compost, C/D
from source separation, digestate derived from manure/slurry,
and digestate derived from renewable raw materials.
Safe limit concentration in compost and digestate Not applicable (risk characterisation ratio not definable).
Main concern(s) arising High cumulative loads at steady state.
Effects considered in the main concern hazard(s) Basis of the EQS is not stated in the Directive but is understood
to relate to human health via consumption of fishery products.
Human BMDL10 based on carcinogenicity.
Uncertainties and their implications Small occurrence data set for chrysene specifically means that
the exposure levels may be under- or over-estimated by the
87 This refers to the regional and continental spatial scales in the EUSES model. Refer to Section 1.7 of Appendix D for further
information. 88 The possibility or not for transfer over long distance is largely an inherent property of the substances themselves, but it is interesting if
this is expressed even when the pathway into the environment is so dominated by incorporation into soil. 89 Please note this is not to be interpreted as how much time elapses to reach steady state; the steady state predicted by the model are
the amounts and distribution at the regional and continental scale arising from the compost and digestate use application pathway only.
Adding in the release of the same substances via other pathways (air and waste water) could lead to a different steady state picture.

97 © Wood Environment & Infrastructure Solutions UK Limited
February 2019
Doc Ref. 40039CL003i3
Key findings of the risk assessment of chrysene in contaminated composts and digestates
present assessment; exposures of humans via diet, predators via
the food chain.
Sensitivity of exposures to variations in water management in the
local container growing scenario is low.
Other remarks Local human exposure via diet does not exceed the BMDL10.
The assessment findings for all assessed PAH are discussed in the equivalent section in Section 4.4.15.
4.4.17 Benz[a]anthracene (representative of PAH16 chemical family)
Summary of findings
Table 4.22 Summary of key findings for exposure of benz[a]anthracene via use of compost and digestates
Key findings of the risk assessment of benz[a]anthracene in contaminated composts and digestates
Overall range of compost and digestate concentrations <0.04 – 0.33 mg benz[a]anthracene/kg dw, <0.3 – 20.8 mg
PAH/kg.
Major raw material sources PAHs reported above ca. 3 mg/kg in sewage sludge (composted
and non-composted), bio-waste and green waste compost, C/D
from source separation, digestate derived from manure/slurry,
and digestate derived from renewable raw materials.
Safe limit concentration in compost and digestate Not applicable (risk characterisation ratio not definable).
Main concern(s) arising High cumulative loads at steady state.
Effects considered in the main concern hazard(s) Basis of the EQS is not stated in the Directive but is understood
to relate to human health via consumption of fishery products.
Human BMDL10 based on carcinogenicity.
Uncertainties and their implications Small occurrence data set for benz[a]anthracene specifically
means that the exposure levels may be under- or over-estimated
by the present assessment, particularly for digestate for which no
values were found; exposures of humans via diet, predators via
the food chain.
Sensitivity of exposures to variations in water management in the
local container growing scenario is low.
Other remarks Local human exposure via diet does not exceed the BMDL10.
The assessment findings for all assessed PAH are discussed in the equivalent section in Section 4.4.15.

98 © Wood Environment & Infrastructure Solutions UK Limited
February 2019
Doc Ref. 40039CL003i3
4.4.18 Benzo[b]fluoranthene (representative of PAH16 chemical family)
Summary of findings
Table 4.23 Summary of key findings for exposure of benzo[b]fluoranthene via use of compost and
digestates
Key findings of the risk assessment of benzo[b]fluoranthene in contaminated composts and digestates
Overall range of compost and digestate concentrations 0.12-2.14 mg benzo[b]fluoranthene/kg dw, <0.3 – 20.8 mg
PAH/kg.
Major raw material sources PAHs reported above ca. 3 mg/kg in sewage sludge (composted
and non-composted), bio-waste and green waste compost, C/D
from source separation, digestate derived from manure/slurry,
and digestate derived from renewable raw materials.
Safe limit concentration in compost and digestate Not applicable (risk characterisation ratio not definable).
Main concern(s) arising High cumulative loads at steady state.
Effects considered in the main concern hazard(s) Basis of the EQS is not stated in the Directive but is understood
to relate to human health via consumption of fishery products.
Human BMDL10 based on carcinogenicity.
Uncertainties and their implications Small occurrence data set for benzo[b]fluoranthene specifically
means that the exposure levels may be under- or over-estimated
by the present assessment, especially for digestate where no
values were found; exposures of humans via diet, predators via
the food chain.
Sensitivity of exposures to variations in water management in the
local container growing scenario is low.
Other remarks Local human exposure via diet does not exceed the BMDL10.
The assessment findings for all assessed PAH are discussed in the equivalent section in Section 4.4.15.
4.4.19 Indeno(1,2,3-cd)pyrene (representative of PAH16 chemical family)
Summary of findings
Table 4.24 Summary of key findings for exposure of indeno[123-c,d]pyrene via use of compost and
digestates
Key findings of the risk assessment of indeno[123-c,d]pyrene in contaminated composts and digestates
Overall range of compost and digestate concentrations <0.04-2.32 mg indeno[123-c,d]pyrene /kg dw, <0.3 – 20.8 mg
PAH/kg.
Major raw material sources PAHs reported above ca. 3 mg/kg in sewage sludge (composted
and non-composted), bio-waste and green waste compost, C/D
from source separation, digestate derived from manure/slurry,
and digestate derived from renewable raw materials.
Safe limit concentration in compost and digestate Not applicable (risk characterisation ratio not definable).
Main concern(s) arising High cumulative loads at steady state.

99 © Wood Environment & Infrastructure Solutions UK Limited
February 2019
Doc Ref. 40039CL003i3
Key findings of the risk assessment of indeno[123-c,d]pyrene in contaminated composts and digestates
Effects considered in the main concern hazard(s) Basis of the EQS is not stated in the Directive but is understood
to relate to human health via consumption of fishery products.
Human BMDL10 based on carcinogenicity.
Uncertainties and their implications Small occurrence data set for indeno[123-c,d]pyrene specifically
means that the exposure levels may be under- or over-estimated
by the present assessment, particularly for digestate for which no
values were found; exposures of humans via diet, predators via
the food chain.
Sensitivity of exposures to variations in water management in the
local container growing scenario is low.
Other remarks Local human exposure via diet does not exceed the BMDL10.
The assessment findings for all assessed PAH are discussed in the equivalent section in Section 4.4.15.
4.4.20 Perfluoroctanoic acid (PFOA) (representative of PFAs chemical family)
Sensitivity to specific variables
In respect of local Scenario II, the sensitivity of the outcomes to possible losses from the system by leaching
and drainage of excess water has been explored using a fugacity method. For this substance the proportion
of substance in the system distributed to the interstitial water at equilibrium under ‘high water content’
conditions, and hence sensitive to leaching, is 18% of the substance present in the system. Hence, the
sensitivity of the exposure scenario to such variations in water management is considered to be potentially
significant.
Summary of findings
Table 4.25 Summary of key findings for exposure of PFOA via use of compost and digestates
Key findings of the risk assessment of PFOA in contaminated composts and digestates
Overall range of compost and digestate concentrations <2E-03 - ≤0.165 mg/kg dw.
Major raw material sources PFOA/PFOS measured above ca 0.01 mg/kg in C/D from source
separation, bio-waste & green waste compost, green waste
compost, sewage sludge compost, "mechanical biological
treatment compost", bio-waste & green waste manure energy
crops digestate, "mechanical biological treatment digestate".
Safe limit concentration in compost and digestate Not applicable (risk characterisation ratio not definable).
Main concern(s) arising Source of exposure of a POP; humans exposed via the
environment (especially via diet and drinking water); possible
transfer over long distances.
Effects considered in the main concern hazard(s) Proposed POP; human TDI based on mammalian liver toxicity.
Uncertainties and their implications Small occurrence data sets for PFOA specifically, and almost all
stated values are less-than limit values.
Sensitivity of exposures to variations in water management in the
local container growing scenario is potentially significant. In
circumstances where a) the system is watered in excess of the
water holding capacity of the growing medium and b) where the

100 © Wood Environment & Infrastructure Solutions UK Limited
February 2019
Doc Ref. 40039CL003i3
Key findings of the risk assessment of PFOA in contaminated composts and digestates
container design means that excess water will drain away and
not remain in contact with the container/growing medium, then
a significant proportion of the substance could be lost from the
system in the drained water.
Other remarks None.
As a proposed POP, it is in itself a potentially important finding that PFOA or other PFAs have been detected
in freshly-produced composts and digestates at several different locations in recent years. The raw material
waste streams could be investigated further. However, the reported concentrations in composts and
digestates do not exceed the national limit values according to the data collected in this project.
While risk characterisation has not been quantified, it is noted that the predicted exposures of humans in the
form of local total daily intake associated with local exposure when used for container growing could exceed
the safe limit (TDI) based on the value derived by MST (2015).
The estimated regional-scale predicted environmental concentrations in surface water, ground water and
agricultural soil arising from the application of C/D are within the range of the literature concentrations
presented in this section compared with natural background concentrations based on ECHA (2014). The
estimated environmental concentration in groundwater is above the Drinking Water Directive proposal limit
for each individual PFAS substance in drinking water (0,1 µg/l), but below the proposed limit for the sum of
PFAS substances (0.5 µg/l). The estimated environmental concentration in freshwater is well below the
Drinking Water Directive proposal limits.
The highest contributions to human exposure via the environment arising from the application of C/D is
mainly associated with dietary consumption of root vegetables; exposure via drinking water is also high for
local scenario I (application on land).
At steady state, <1% of the total mass remains within the region + continent90, suggesting that there is high
potential for transfer over long distances following release via the handling and application of C/D91. Global
scale modelling within EUSES suggests that at the steady state, the majority of the substance would be found
in global tropic waters (56%), moderate waters (26%) and arctic waters (17%). The total mass in the region +
continent at steady state is <10 t in the baseline scenario. This steady-state mass amounts to 4.4 times the
mass released annually via application of composts and digestates92.
4.4.21 Perfluoroctanesulfonic acid (PFOS) (representative of PFAs chemical family)
Summary of findings
Table 4.26 Summary of key findings for exposure of PFOS via use of compost and digestates
Key findings of the risk assessment of PFOS in contaminated composts and digestates
Overall range of compost and digestate concentrations <2E-03 - ≤0.165 mg/kg dw.
90 This refers to the regional and continental spatial scales in the EUSES model. Refer to Section 1.7 of Appendix D for further
information. 91 The possibility or not for transfer over long distance is largely an inherent property of the substances themselves, but it is interesting if
this is expressed even when the pathway into the environment is so dominated by incorporation into soil. 92 Please note this is not to be interpreted as how much time elapses to reach steady state; the steady state predicted by the model are
the amounts and distribution at the regional and continental scale arising from the compost and digestate use application pathway only.
Adding in the release of the same substances via other pathways (air and waste water) could lead to a different steady state picture.

101 © Wood Environment & Infrastructure Solutions UK Limited
February 2019
Doc Ref. 40039CL003i3
Key findings of the risk assessment of PFOS in contaminated composts and digestates
Major raw material sources PFOA/PFOS measured above ca 0.01 mg/kg in C/D from source
separation, bio-waste & green waste compost, green waste
compost, sewage sludge compost, "mechanical biological
treatment compost", bio-waste & green waste manure energy
crops digestate, "mechanical biological treatment digestate".
Safe limit concentration in compost and digestate Not applicable (risk characterisation ratio not definable).
Main concern(s) arising Source of exposure of a POP; Humans exposed via the
environment (especially via diet and drinking water); possible
transfer over long distances. Highest reported concentrations are
limit values, but could exceed the guidance level of 100 µg/kg
dw. Local and regional PECs exceed the annual average EQS.
Effects considered in the main concern hazard(s) POP; human TDI based on mammalian liver toxicity; Basis of the
EQS is not stated in the Directive but is understood to relate to
accumulation in fish.
Uncertainties and their implications Almost all stated values are less-than limit values.
Sensitivity of exposures to variations in water management in the
local container growing scenario is low.
Other remarks None.
As a POP, it is in itself a potentially important finding that PFOS has been detected in freshly-produced
composts and digestates at several different locations in recent years. The raw material waste streams could
be investigated further. The highest among the reported concentrations in composts and digestates exceed
the national limit values according to the data collected in this project.
While risk characterisation has not been quantified, it is noted that the predicted exposures of humans in the
form of local total daily intake associated with both types of use could exceed the safe limit (TDI) based on
the values derived by EFSA (2008) and MST (2015).
The estimated regional-scale predicted environmental concentrations in surface water, ground water and
agricultural soil arising from the application of C/D appear to be low compared to the measured background
concentrations quoted by EA (2004). The estimated environmental concentrations in groundwater and
freshwater are well below the Drinking Water Directive proposal limit for each individual PFAS substance
(0.1 µg/l) in drinking water and for the sum of PFAS substances (0.5 µg/l).
The highest contributions to human exposure via the environment arising from the application of C/D is
mainly associated with dietary consumption of root vegetables.
At steady state, 5% of the total mass remains within the region + continent93, suggesting that there is high
potential for transfer over long distances following release via the handling and application of C/D94. The
majority of the substance is modelled to be present in global tropic waters (54%) at steady state followed by
moderate waters (25%) and arctic waters (16%). The total mass in the region + continent at steady state is 28
t in the baseline scenario. This steady-state mass amounts to 25 times the mass released annually via
application of composts and digestates95.
93 This refers to the regional and continental spatial scales in the EUSES model. Refer to Section 1.7 of Appendix D for further
information. 94 The possibility or not for transfer over long distance is largely an inherent property of the substances themselves, but it is interesting if
this is expressed even when the pathway into the environment is so dominated by incorporation into soil. 95 Please note this is not to be interpreted as how much time elapses to reach steady state; the steady state predicted by the model are
the amounts and distribution at the regional and continental scale arising from the compost and digestate use application pathway only.
Adding in the release of the same substances via other pathways (air and waste water) could lead to a different steady state picture.

102 © Wood Environment & Infrastructure Solutions UK Limited
February 2019
Doc Ref. 40039CL003i3
4.4.22 PFHxA (representative of PFAs chemical family)
Sensitivity to specific variables
In respect of local Scenario II, the sensitivity of the outcomes to possible losses from the system by leaching
and drainage of excess water has been explored using a fugacity method. For this substance the proportion
of substance in the system distributed to the interstitial water at equilibrium under ‘high water content’
conditions, and hence sensitive to leaching, is 2.7% of the substance present in the system. Hence, the
sensitivity of the exposure scenario to such variations in water management is considered to be low.
Summary of findings
Table 4.27 Summary of key findings for exposure of PFHxA via use of compost and digestates
Key findings of the risk assessment of PFHxA in contaminated composts and digestates
Overall range of compost and digestate concentrations <2E-03 - ≤0.165 mg/kg dw
Major raw material sources PFOA/PFOS measured above ca 0.01 mg/kg in C/D from source
separation, bio-waste & green waste compost, green waste
compost, sewage sludge compost, "mechanical biological
treatment compost", bio-waste & green waste manure energy
crops digestate, "mechanical biological treatment digestate".
Safe limit concentration in compost and digestate Not applicable (risk characterisation ratio not definable).
Main concern(s) arising Source of exposure of a proposed SVHC; Humans exposed via
the environment (especially via diet and drinking water); possible
transfer over long distances.
Effects considered in the main concern hazard(s) Proposed SVHC under the REACH Regulation on the basis of a
large number of equivalent concern factors.
Uncertainties and their implications No data available for PFHxA specifically, and almost all stated
values are less-than limit values.
Sensitivity of exposures to variations in water management in the
local container growing scenario is low. In circumstances where
a) the system is watered in excess of the water holding capacity
of the growing medium and b) where the container design
means that excess water will drain away and not remain in
contact with the container/growing medium, then a small
proportion of the substance could be lost from the system in the
drained water.
Other remarks None.
The estimated regional-scale predicted environmental concentrations in surface water, ground water and
agricultural soil arising from the application of C/D are close to the range of the literature concentrations
presented in the Occurrence data set section based on ECHA (2018).
The highest contributions to human exposure via the environment arising from the application of C/D is
mainly associated with dietary consumption of root vegetables.

103 © Wood Environment & Infrastructure Solutions UK Limited
February 2019
Doc Ref. 40039CL003i3
At steady state, 31.7% of the total mass remains within the region + continent96, suggesting that there is
some potential for transfer over long distances following release via the handling and application of C/D97. A
significant proportion of the substance is modelled to be present in global tropic waters (29%) at steady
state. The total mass in the region + continent at steady state is 12.5 t in the baseline scenario. This steady-
state mass amounts to 11 times the mass released annually via application of composts and digestates98.
4.4.23 Microplastics
Summary of findings
In considering these findings readers should note that EUSES is not designed to model distribution of
particulates which severely restricts the use in this project. Findings are indicative only.
Table 4.28 Summary of key findings for exposure of microplastics via use of compost and digestates
Key findings of the risk assessment of microplastics in contaminated composts and digestates
Overall range of compost and digestate concentrations 14 – 146 particles/kg dw.
Major raw material sources All reported data relate to composts and digestates prepared
from household biowaste combined with green clippings and
some energy crops.
Safe limit concentration in compost and digestate Not applicable (risk characterisation ratio not definable).
Main concern(s) arising A potentially important source of microplastic exposure of the
environment via wastewater treatment plant sludge (with
possible consequent human exposure to microplastics via the
environment).
Effects considered in the main concern hazard(s) No quantitative assessment of hazard was applied in this
assessment.
Uncertainties and their implications Quantitative exposure of humans and predators via the food
chain cannot be reliably modelled using the present methods.
Steady state exposures are not reliable and not presented. Wastewater treatment digestate could potentially contain higher
concentrations of particles; data were not found in this project.
Sensitivity of exposures to variations in water management in the
local container growing scenario cannot be modelled.
Other remarks Other sources of microplastics release appear to be much higher
than exposure via composts and digestates, although use of
digestate obtained from sewage sludge could be an important
source of microplastics for the soil.
The exposures of soil and sediment arising from the application of C/D estimated in the present model are
very low compared with the PECs modelled in the recent risk assessment of exposures arising from a range of
industrial and consumer uses (Wood 2017). However the assessment does not cover the possible release of
96 This refers to the regional and continental spatial scales in the EUSES model. Refer to Section 1.7 of Appendix D for further
information. 97 The possibility or not for transfer over long distance is largely an inherent property of the substances themselves, but it is interesting if
this is expressed even when the pathway into the environment is so dominated by incorporation into soil. 98 Please note this is not to be interpreted as how much time elapses to reach steady state; the steady state predicted by the model are
the amounts and distribution at the regional and continental scale arising from the compost and digestate use application pathway only.
Adding in the release of the same substances via other pathways (air and waste water) could lead to a different steady state picture.
104 © Wood Environment & Infrastructure Solutions UK Limited
February 2019
Doc Ref. 40039CL003i3
microfibres released by washing of textiles. While exposure of man via the environment arising from the use
of compost and digestate is very low compared to other sources, the occurrence data used in this
assessment is largely based on household biowaste-derived products rather than WWTP digestates. ECHA
reports that sewage sludge could be an important source of emissions of microplastics to the soil (ECHA
2018a).
Exposure of humans via root and leaf crops in the diet is possible, however (similarly to the EC 2017 exposure
assessment), the washing of vegetables and peeling of root vegetables would be expected to limit levels of
human consumption.
Cattle could ingest contaminated soil adhering to the grass, and therefore the exposure of cattle will be
related to the concentration in soil, however (in line with EC, 2017) the assessment assumes that this remains
within gut contents and passes through the cattle without entering into meat or milk. This indicates that
human exposure via these foodstuffs is negligible.
The occurrence data found in this project suggest use of composts and digestates contributes an overall total
release of 3650 billion microplastic particles per year in the region plus continent, however it is not feasible
using EUSES to model the multimedia fate, distribution and flux of particles following release.
4.4.24 Conclusions
A further summary and conclusion regarding the identified risks, across all assessed substances, is provided
in Section 5.2 for the purpose of potential risk management.

105 © Wood Environment & Infrastructure Solutions UK Limited
February 2019
Doc Ref. 40039CL003i3
5. Risk management option analysis
5.1 Overview
The aim of the risk management option analysis (RMOA) is to identify the most appropriate regulatory
instrument for possible risk management activities to address the concerns related to contaminants in C/D
used as fertilisers. As such, it covers a range of different substances and physical components (together
“contaminants”) present in feedstock supply for anaerobic digestion (AD) and aerobic composting plants
and, consequently, as impurities in digestate and compost. This is based on the identification and
prioritisation of contaminants of concern in Section 3, as well as the assessment of the risks posed by the
contaminants when present in C/D used as fertilisers (Section 4).
The structure of this section is based on ECHA guidance99 but has been adapted given its focus on a range of
substances and physical components. This approach was discussed during the interim meeting of this project
(17 May 2018). An adapted RMOA format was presented in a progress note (of 17 July 2018) and agreed with
the European Commission. The RMOA is structured as follows:
First, Section 5.2 briefly summarises the risks to be addressed, based on the results from the
substance identification (Section 3) and risk assessment (Section 4).
Section 5.3 puts this into the context of the European market for C/D (based on the market
analysis in Section 2), in order to conclude on the geographical spread and scale of the
problem.
Section 5.4 provides an overview of existing risk management to assess the extent to which the
risks are already addressed.
Potential risk management options are presented and assessed in Section 5.5. This includes
their effectiveness in controlling the risks and other regulatory considerations (e.g. regulatory
consistency and practicalities of enforcement).
Preliminary socio-economic considerations are covered in Section 5.6. Likely 'response
scenarios' for producers and users of digestate and compost in the case of each risk
management option are assessed. Their associated costs are estimated, including the costs and
benefits of using potential alternative products and techniques to reduce the risks from
contaminants in C/D.
Finally, Section 5.7 draws conclusions based on the assessment of risk management options
and preliminary socio-economic considerations.
5.2 Summary of identified risk
This section summarises the identified risks prioritised for potential management. This is based on the results
from the substance identification (Section 3) and risk assessment (Section 4).
Conventional quantitative risk characterisation was carried out where possible. For some substances this has
identified a potential risk. This is the case where in the realistic worst case, concentrations found in compost
and/or digestate exceed safe limits100. The safe limits, and thus the risks, can vary for the two investigated
99 Such as the internal RMOA templates used by ECHA, or Guidance on Annex XV for restriction (ECHA 2007) 100 Note that, as explained in Section 4.1, “safe limit” in this report is defined as a limit below which adverse effects are not expected for
the endpoints in question. This does not preclude possible other effects at lower concentrations, related to other endpoints for which
quantitative risk characterisation was not possible.

106 © Wood Environment & Infrastructure Solutions UK Limited
February 2019
Doc Ref. 40039CL003i3
scenarios (use in container growing, or application to agricultural land, see Section 4.3). A comparison of safe
limits for both scenarios and measured concentrations in C/D is shown in Figure 5.1.
Figure 5.1 Overview of concentrations of contaminants found in compost and digestate and safe limits
calculated in the risk assessment
Notes:
Concentrations in C&D: “Lower central” and “upper central” refer to the range of concentrations most typically measured in C/D, as
identified in the literature in Task 2 (substance identification, see Section 3); “max” refers to the highest concentration in C/D reported in
the literature but is considered an outlier and therefore an exceptional case.
Safe limit concentration: These relate to the concentration in C/D below which an unacceptable risk is not identified when applied in
either exposure scenario defined in the risk assessment (I. Application to agricultural land, or II. Application in container growing; see
Section 4 for more details).
The identified risks are summarised by scenario below:
Container growing: Potential risks (and safe limits) specifically for compost used in container
growing have been identified for the heavy metals Nickel (safe limit of 7.9 mg/kg dw) and
Copper (safe limit of 200 mg/kg dw). Note that there are some uncertainties101 associated with
the container growing scenario used, as discussed in Appendix D. For both substances, the
main sources of this contamination is not entirely clear. From different input materials most
measured concentrations are broadly similar. However, for Nickel the highest maximum
concentrations have been reported in biowaste compost, greenwaste compost and MBT
101 In particular, the current calculations assume that there is no loss of the substance from the growing medium by
leaching (although the analysis carried out in Appendix D suggests that this may not be so significant for nickel and
copper) and that the dietary intake from root and leaf crops occurs entirely from crops grown in such media. This latter
assumption, in particular, may lead to an overestimation of the risks associated with compost and digestate containing
nickel in this scenario and so the estimated safe limit of 7.9 mg/kg dry weight in compost should be seen as preliminary
only. These uncertainties apply similarly to copper, but the limit value estimated here for copper in compost and
digestate for container growing is consistent with the EU limit values for copper in agricultural soil.

107 © Wood Environment & Infrastructure Solutions UK Limited
February 2019
Doc Ref. 40039CL003i3
compost. For Copper, sewage sludge compost, MBT C/D display generally higher
concentrations. Manure is a known source of Copper but is not the only possible source.
Application to agricultural land: Potential risks (and safe limits) specifically for digestate
and/or compost applied to agricultural land have been identified for Mercury (safe limit of 0.2
mg/kg dw). As above, from different input materials most measured concentrations are broadly
similar. However, the highest maximum concentrations have been reported in biowaste
compost, greenwaste compost, MBT compost and sewage sludge compost.
Both scenarios (container growing and application to land): Potential risks (and safe limits)
for both container growing and application to agricultural land have been identified for Zinc
(safe limit in container growing102 of 70 mg/kg dw, safe limit for application to agricultural land
600 mg/kg dw). Generally higher concentrations of Zinc were measured in digestate from
various input materials (compared to compost in general), as well as in sewage sludge compost
and MBT compost.
For Nonylphenol, to the extent that risk characterisation has been possible, unacceptable risks
are indicated for the container growing scenario (with a 3.5 mg/kg safe limit)103. Risk
characterisation for humans exposed via the environment was not quantified, as Nonylphenol is
an endocrine disruptor. However, the predicted local total daily intake associated with the
application of C/D is comparable with the daily human intake for local exposures associated
with the various industrial use scenarios set out in the EU risk assessment from 2002 (European
Commission 2005). The 2002 risk assessment concluded that (1) there was considerable
uncertainty in the estimated human daily intake figures, (2) subject to this uncertainty, the
industrial use scenarios could show a potential concern that needs to be addressed, and (3)
further information was needed on emissions into the local environment. Few measurements of
nonylphenol concentrations were reported in the literature. Of the tested C/D, municipal
sewage sludge-derived products exhibited the highest concentrations, followed by green waste
compost. Agricultural digestate (manure and energy crops) exhibited far lower concentrations.
Where conventional quantitative risk characterisation is not appropriate, exposures at the steady state are
discussed. Due to the hazards (Non-threshold or unclear threshold, SVHC, POP, PBT) associated with some
substances, their presence in compost/digestate itself may present a main concern. This includes the
following substances:
Lead is a non-threshold neurotoxic substance and the contribution from C/D to the total
background levels of lead in soil from all sources is significant104. On the other hand, the
realistic worst case has yielded no risk characterisation ratios (RCRs) >1 for soil, sediment, water
and secondary poisoning. Generally higher concentrations of Lead were measured in compost
(compared to digestate in general), with MBT compost exhibiting the highest reported average
and maximum concentrations.
BPA and DEHP are reprotoxins and endocrine disruptors (SVHCs).
For BPA, the regional scale predicted environmental concentration (PEC) in agricultural soil
is well below the background concentration arising from the industrial life cycle. The
predicted local total daily intake for humans does not exceed the DNEL used by EFSA and
RAC, and the PNECs adopted in the 2010 ESR risk assessment are not exceeded. BPA in C/D
can therefore be considered a lower priority for further risk management.
102 Note the uncertainties associated with the container growing scenario, as discussed above and in Appendix D. 103 Note the uncertainties associated with the container growing scenario, as discussed above and in Appendix D. 104 Estimated to be up to 66% based on the mid-range concentrations measured in compost and digestate. This would be higher if the
highest concentrations measured in compost and digestate or the proposed FPR limit value (European Commission 2018b) is assumed.

108 © Wood Environment & Infrastructure Solutions UK Limited
February 2019
Doc Ref. 40039CL003i3
For DEHP, the highest reported concentrations in composts and digestates (sewage sludge
compost, biowaste-food and garden waste digestate) already appear to exceed the national
limit value for several member states and the local total daily intake for humans associated
with container growing slightly exceeds the DNEL defined by Danish EPA. With regards to
application to land, the regional scale predicted environmental concentration (PEC) in
agricultural soil and grassland is below the background concentration arising from the
industrial life cycle. The European Commission is preparing to amend the REACH
Authorisation List entry for DEHP (and other phthalates) to account for their endocrine
disrupting effects, which means some uses previously exempted may require authorisation
(ECHA 2018b). Furthermore, in December 2018 a REACH restriction was adopted on DEHP in
articles used by consumers or available in indoor areas at a concentration equal to or above
0.1% w/w (European Commission 2018a). This may lead to a reduction of DEHP in input
materials used for composting and AD, although food contact materials (a potential source
of DEHP in input materials for compost and digestate) are not included in the proposed
REACH restriction. Hence, further monitoring of the development of DEHP concentrations in
C/D is required to judge the need for further risk management in the future.
17α-ethinylestradiol is an endocrine disruptor with unclear safe limit thresholds. The total
mass in the region + continent at steady state is low (approximately 7 tonnes), but the local
total daily intake is only about four times below the therapeutic pharmaceutical dose105. The
only concentration measurements identified in the literature are for C/D from sewage sludge
and given 17α-ethinylestradiol is a pharmaceutical, it appears likely that sewage from waste
water treatment is the main source of the substance into C/D.
HBCDD, the assessed representative of PCBs (PCB28) and of dioxins and furans (TCDD,
PCDF), as well as PFOA and PFOS are POPs. That they have been detected in freshly-
produced composts and digestates at several locations in recent years is itself a concern.
For HBCDD, very few literature sources have identified HBCDD and the estimated regional
scale exposures arising from the application of C/D are well below the anthropogenic
background concentrations. Furthermore, following the expiry of the only REACH
authorisation106, any contribution to HBCDD concentrations in compost in digestate
resulting from industrial release of HBCDD should be eliminated. HBCCD in C/D can
therefore be considered a lower priority for further risk management.
For the assessed PCB, the highest reported concentrations in composts and digestates
already appear to exceed the national limit value for several Member States (although only
in a very small share of samples) and the estimated exposures are high compared with
reported mean/median levels in foodstuffs. A clear distinction of PCB concentration levels
between C/D from different input materials could not be established, with a wide variation
of values reported for most.
For the assessed dioxins and furans, the highest reported concentrations in composts and
digestates already appear to exceed the national limit value for several Member States and
the estimated exposures are high compared with reported mean/median levels in
foodstuffs. A clear distinction of dioxin and furan concentration levels between C/D from
different input materials could not be established, with a wide variation of values reported
105 The upper limit of possible exposure from compost and digestate use according to the risk assessment is only approximately 4x
below the lower limit of the pharmaceutical dose range if a bodyweight of 60kg is assumed for the patient. Note that the amount of
data available on concentration of this contaminant in compost/digestate is extremely limited. 106 HBCDD is listed in Annex XIV to the REACH Regulation (“Authorisation List”). The only Authorisation was for use as flame retardant
additive to expanded polystyrene and expired on 21 August 2017. See: https://echa.europa.eu/applications-for-authorisation-previous-
consultations/-/substance-rev/1602/term
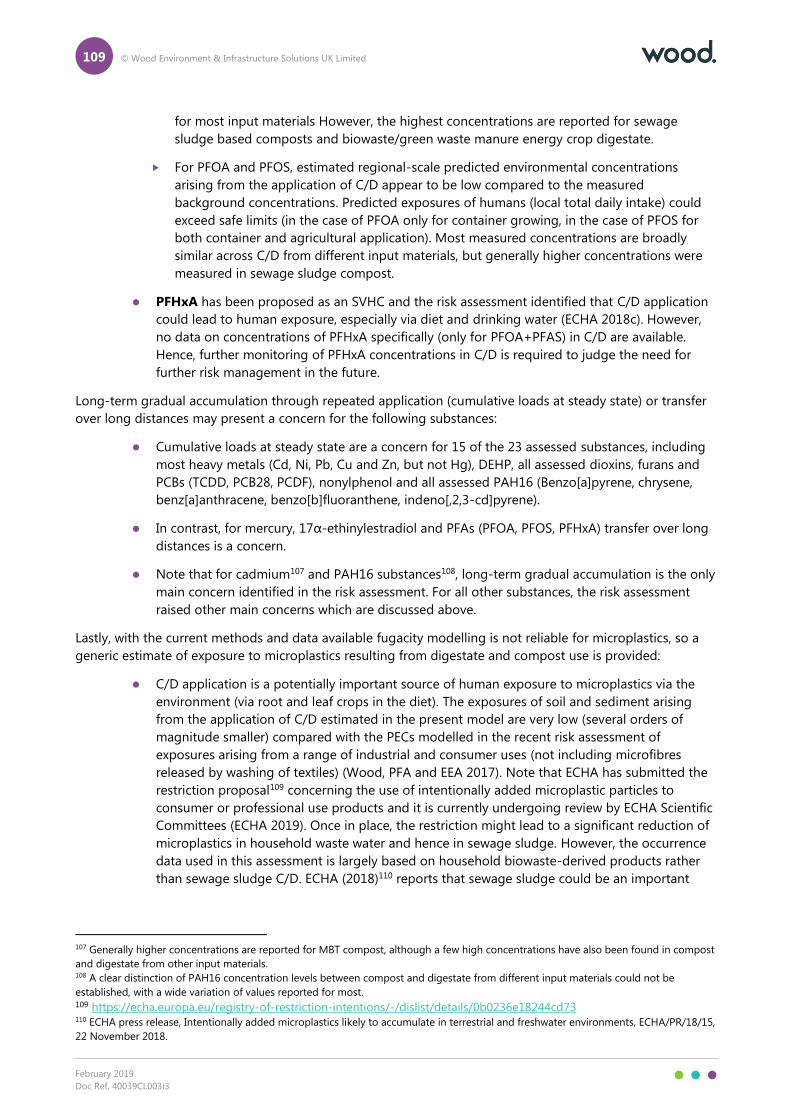
109 © Wood Environment & Infrastructure Solutions UK Limited
February 2019
Doc Ref. 40039CL003i3
for most input materials However, the highest concentrations are reported for sewage
sludge based composts and biowaste/green waste manure energy crop digestate.
For PFOA and PFOS, estimated regional-scale predicted environmental concentrations
arising from the application of C/D appear to be low compared to the measured
background concentrations. Predicted exposures of humans (local total daily intake) could
exceed safe limits (in the case of PFOA only for container growing, in the case of PFOS for
both container and agricultural application). Most measured concentrations are broadly
similar across C/D from different input materials, but generally higher concentrations were
measured in sewage sludge compost.
PFHxA has been proposed as an SVHC and the risk assessment identified that C/D application
could lead to human exposure, especially via diet and drinking water (ECHA 2018c). However,
no data on concentrations of PFHxA specifically (only for PFOA+PFAS) in C/D are available.
Hence, further monitoring of PFHxA concentrations in C/D is required to judge the need for
further risk management in the future.
Long-term gradual accumulation through repeated application (cumulative loads at steady state) or transfer
over long distances may present a concern for the following substances:
Cumulative loads at steady state are a concern for 15 of the 23 assessed substances, including
most heavy metals (Cd, Ni, Pb, Cu and Zn, but not Hg), DEHP, all assessed dioxins, furans and
PCBs (TCDD, PCB28, PCDF), nonylphenol and all assessed PAH16 (Benzo[a]pyrene, chrysene,
benz[a]anthracene, benzo[b]fluoranthene, indeno[,2,3-cd]pyrene).
In contrast, for mercury, 17α-ethinylestradiol and PFAs (PFOA, PFOS, PFHxA) transfer over long
distances is a concern.
Note that for cadmium107 and PAH16 substances108, long-term gradual accumulation is the only
main concern identified in the risk assessment. For all other substances, the risk assessment
raised other main concerns which are discussed above.
Lastly, with the current methods and data available fugacity modelling is not reliable for microplastics, so a
generic estimate of exposure to microplastics resulting from digestate and compost use is provided:
C/D application is a potentially important source of human exposure to microplastics via the
environment (via root and leaf crops in the diet). The exposures of soil and sediment arising
from the application of C/D estimated in the present model are very low (several orders of
magnitude smaller) compared with the PECs modelled in the recent risk assessment of
exposures arising from a range of industrial and consumer uses (not including microfibres
released by washing of textiles) (Wood, PFA and EEA 2017). Note that ECHA has submitted the
restriction proposal109 concerning the use of intentionally added microplastic particles to
consumer or professional use products and it is currently undergoing review by ECHA Scientific
Committees (ECHA 2019). Once in place, the restriction might lead to a significant reduction of
microplastics in household waste water and hence in sewage sludge. However, the occurrence
data used in this assessment is largely based on household biowaste-derived products rather
than sewage sludge C/D. ECHA (2018)110 reports that sewage sludge could be an important
107 Generally higher concentrations are reported for MBT compost, although a few high concentrations have also been found in compost
and digestate from other input materials. 108 A clear distinction of PAH16 concentration levels between compost and digestate from different input materials could not be
established, with a wide variation of values reported for most. 109 https://echa.europa.eu/registry-of-restriction-intentions/-/dislist/details/0b0236e18244cd73 110 ECHA press release, Intentionally added microplastics likely to accumulate in terrestrial and freshwater environments, ECHA/PR/18/15,
22 November 2018.

110 © Wood Environment & Infrastructure Solutions UK Limited
February 2019
Doc Ref. 40039CL003i3
source of emissions of microplastics to the soil. Hence, further monitoring of microplastics
concentrations in C/D is required to judge the need for further risk management in the future.
In summary, the following substances are prioritised for risk management in the remainder of this RMOA,
based on the identified risks:
Nickel (Ni);
Lead (Pb);
Copper (Cu);
Zinc (Zn);
Mercury (Hg);
17α-ethinylestradiol;
PCBs (PCB28);
Dioxins and furans (TCDD, PCDF);
Nonylphenol;
Perfluoroctanoic acid (PFOA); and
Perfluoroctanesulfonic acid (PFOS).
For Cadmium and PAH16 (Benzo[a]pyrene, Chrysene, Benzo[a]anthracene, Benzo[b]fluoranthene,
Indeno(1,2,3-cd)pyrene), the only main concern is long-term gradual accumulation through repeated
application. These substances are also considered for risk management, but at a lower priority than the
above.
5.3 Summary of uses and tonnages
This section combines the identified risks from Section 5.2 with the results of the market analysis (Section 2)
to conclude on the geographical spread and scale of the problem. First, the extent to which it has been
possible to associate identified risks with specific input materials, techniques or uses is summarised. This is
then compared to the tonnages and location of these input materials, techniques or uses. Conclusions are
then drawn regarding (1) what proportion of compost/digestate is affected by contaminant concentrations
above levels of potential concern, and (2) where are the concerns concentrated (both geographically and in
terms of the feedstocks, production techniques and application practices used)?
5.3.1 Tonnages
As discussed above (Section 5.2), the concentrations of many substances of concern (and thus risk) varies
strongly between C/D, and/or between input materials used. In the following, the tonnages are presented in
the context of these variations in contaminant concentrations/risk, first between C/D, and then between
compost/digestate from different input materials.
Compost and digestate
Generally higher concentrations of Zinc were measured in digestate (from various input materials) compared
to compost in general. Conversely, generally higher concentrations of Lead were measured in compost
compared to digestate. The market analysis (Section 2) estimates a current annual EU production of some
17.3 million tonnes of compost (with a possible range of 13 million - 18 million tonnes), and in the order of
around 180 million tonnes of digestate. Hence, the concern associated with Zinc (higher concentrations in

111 © Wood Environment & Infrastructure Solutions UK Limited
February 2019
Doc Ref. 40039CL003i3
digestate) could be expected to be much more widespread than the concern associated with Lead (higher
concentrations in compost), considering the much higher tonnage of digestate. Note the tonnage of
digestate is dominated by few Member States: almost half of the EU’s digestate is produced in Germany
alone (87 million tonnes), and just over three quarters in Germany, Italy (30 million tonnes) and the UK (18.5
million tonnes) together.
Input materials
For many substances, higher concentrations and thus higher risk is associated with C/D from specific input
materials. Table 5.1 shows which input materials exhibit generally higher or maximum concentrations for
which substances of concern, as well as the associated tonnages of C/D produced from these input materials.
Note that this does not imply that a potentially unacceptable risk exists only for compost/digestate from
these input materials. However, if an input material exhibits generally higher concentrations or the risk of
occasionally very high concentrations of contaminants, as well as high tonnages, it could be prioritised for
risk management.
About 21-25 million tonnes of C/D are produced in the EU from biowaste and greenwaste according to the
market analysis (see Section 2 and Table 5.1). Biowaste and greenwaste compost/digestate exhibits generally
higher concentrations, or the highest single observation of concentration, for nickel, mercury, Nonylphenol,
PAHs and possibly dioxins and furans and cadmium111.
46 million tonnes of digestate (and an uncertain but likely small amount of compost) is produced from
organic fraction of mixed municipal solid waste (mechanical biological treatment – MBT). MBT digestate
exhibits generally higher concentrations, or the highest single observation of concentration, for heavy metals.
A much smaller quantity, but at least 2.5 million tonnes of C/D are produced from sewage sludge. However,
C/D from sewage sludge exhibits generally higher concentrations, or the highest single observation of
concentration, for most priority substances of concern (copper, zinc, mercury, 17α-ethinylestradiol, dioxins
and furans, nonylphenol, PFOA, PFOS, PAHs).
The majority of the total digestate and compost produced in the EU (in the order of 200 million tonnes) is
agricultural digestate, with about 122 million tonnes. The input materials of agricultural digestate are typically
a mix of manure and energy crops (see Section 2). Manure is a known source of copper, but the highest
concentrations of copper were reported in compost/digestate from other input materials, suggesting manure
is likely not the only source, and possibly not the most significant. Among the highest dioxins and furans and
cadmium concentrations reported was a digestate made from a mix of biowaste/green waste, manure and
energy crops. It is unclear from which of these input materials the high dioxins and furans and cadmium
contents stem. Hence, agricultural digestate accounts for the largest tonnage, but cannot not be linked to
particularly high concentrations of any priority substances of concern with certainty.
Table 5.1 Tonnages of compost/digestate from input materials for which generally higher or maximum
concentrations were reported for substances of concern
Biowaste Greenwaste MBT Sewage sludge Manure
Estimated
tonnage of
digestate
produced from
this input
material
Separately collected organic waste (can
include biowaste, greenwaste and similar
waste streams such as agroindustry by-
products): 8.7 million tonnes.
46 million tonnes At least 1.7 million
tonnes
Agricultural
digestate (typically
a mix of manure
and energy crops):
122 million tonnes.
111 Among the highest concentrations reported was a digestate made from a mix of biowaste/green waste, manure, energy crop. It is
unclear from which of these input materials the high PCB/Cadmium contents stem.

112 © Wood Environment & Infrastructure Solutions UK Limited
February 2019
Doc Ref. 40039CL003i3
Biowaste Greenwaste MBT Sewage sludge Manure
Estimated
tonnage of
compost
produced from
this input
material
5.1-7.2 million tonnes
(including Vegetable,
fruit and garden
waste).
7-9 million tonnes None reported 0.8 million tonnes None reported
Generally higher or maximum concentrations in following priority substances of concern:
Nickel (Ni) x x x
Lead (Pb)
x
Copper (Cu)
x x ? [1]
Zinc (Zn)
x x
Mercury (Hg) x x x x
17α-
ethinylestradiol
x
PCBs (PCB28) No clear distinction of concentration levels between C/D from different input materials could be established.
Dioxins and
furans (TCDD,
PCDF)
? [2] ? [2] x ? [2]
Nonylphenol
x
x
Perfluoroctanoic
acid (PFOA)
x
Perfluoroctanesul
fonic acid (PFOS)
x
Cadmium (Cd) ? [2] ? [2] x ? [2]
PAH16
(Benzo[a]pyrene,
Chrysene,
Benzo[a]anthrace
ne,
Benzo[b]fluorant
hene,
Indeno(1,2,3-
cd)pyrene
x x x
Substances not prioritised in the summary of identified risk:
Bisphenol-A
(BPA)
BPA in C/D can be considered a lower priority for further risk management (low contribution to background
concentrations, available safe limits of human consumption not exceeded).
Di(2-
ethylhexyl)phthal
ate (DEHP)
Further monitoring of the development of DEHP concentrations in C/D is required to judge the need for further
risk management in the future.
Hexabromocyclo
dodecane
(HBCDD)
Following the expiry of the only REACH authorisation, any contribution to HBCDD concentrations in compost in
digestate resulting from industrial release of HBCDD should be eliminated. Can therefore be considered a lower
priority for further risk management.

113 © Wood Environment & Infrastructure Solutions UK Limited
February 2019
Doc Ref. 40039CL003i3
Biowaste Greenwaste MBT Sewage sludge Manure
PFHxA Further monitoring of PFHxA concentrations in C/D is required to judge the need for further risk management in
the future.
Microplastics Further monitoring of microplastics concentrations in C/D is required to judge the need for further risk
management in the future.
Notes:
[1] Manure is a known source of copper, but the highest concentrations of copper were reported in compost/digestate from other input
materials, suggesting manure is likely not the only source, and possibly not the most significant source.
[2] Among the highest concentrations reported was a digestate made from a mix of biowaste/green waste, manure, energy crop. It is
unclear from which of these input materials the high contamination stems, but it appears more likely that it is one or more of biowaste,
green waste or manure, rather than energy crops.
5.3.2 Uses
Two use scenarios were assessed in the risk assessment (see Section 4.3): use in container growing and
application to agricultural land. Table 5.2 shows for which of the two scenarios the main concerns are
identified for each priority contaminant. Below, these are discussed and linked to the tonnages of different
uses of C/D.
Table 5.2 Overview of concerns identified by use scenario
Substance Container growing Application to
agricultural land
Conclusion
Measured concentrations in compost and digestate exceed safe limits for:
Nickel (Ni) X Concern only for container growing
Copper (Cu) X Concern only for container growing
Zinc (Zn) X X Concern for both use scenarios
Mercury (Hg) X Concern only for application to agricultural land
Nonylphenol X Concern only for container growing
Exposures at the steady state are higher for:
Lead (Pb) X Higher concern for container growing
17α-ethinylestradiol X Higher concern for container growing
PCBs (PCB28) X Higher concern for container growing
Dioxins and furans (TCDD,
PCDF)
X Higher concern for container growing
PFAs (PFOA, PFOS) X Higher concern for container growing
Cadmium (Cd) X Higher concern for container growing
PAH16 (Benzo[a]pyrene,
Chrysene, Benzo[a]anthracene,
Benzo[b]fluoranthene,
Indeno(1,2,3-cd)pyrene
X Higher concern for container growing

114 © Wood Environment & Infrastructure Solutions UK Limited
February 2019
Doc Ref. 40039CL003i3
For most substances for which conventional quantitative risk characterisation was possible, safe limits are
lower for the use scenario of container growing than for application to agricultural land.112 As a result, for
several substances (nickel, copper, nonylphenol) measured concentrations in C/D exceed safe limits only for
container growing but not for application to agricultural land. Hence, for these substances a potential
concern has only been identified for container growing but not for application to cultural land.
For one substance (zinc), measured concentrations in C/D exceed safe limits for both use scenarios and so for
both uses a potential risk has been identified. For one substance (mercury) a potential risk has only been
identified for application onto agricultural land, but not for container growing.
For several substances, their presence in compost/digestate itself may present a main concern due to the
hazards (Non-threshold or unclear threshold, SVHC, POP, PBT) associated with them. For all assessed
substances falling into this category (Lead, BPA, DEHP, 17α-ethinylestradiol, HBCDD, PCBs, dioxins and
furans, PFAS) exposures at the steady state are higher for the container growing scenario than for application
onto agricultural land.
According to the market analysis, the vast majority of the 180 million tonnes of digestate produced in the EU
is used directly as fertiliser in agriculture (JRC 2014). Based on this, the risk assessment has assumed that only
compost is used in container growing.
For compost, the market analysis could not provide a full quantitative breakdown of uses at an EU-level, but
shows the majority (ca. 85%) of compost was used as a fertiliser or soil improver in agriculture, gardening,
horticulture and landscaping. This corresponds to something in the order of 15 million tonnes of compost.113
Based on the breakdown of compost uses in 14 major compost producing EU Member States from JRC
(2014)114 we estimate that up to 34% of compost is used in container growing, while 51% are applied to
agricultural land. Assuming the JRC (2014) use distribution applies to the whole EU today115, this corresponds
to in the order of 6 million tonnes of compost used in container growing, compared to some 9 million tonnes
used in agriculture. Note that some additional data on tonnages per use is available for a few specific
countries (see Section 2).
5.4 Overview of existing risk management
5.4.1 Objective
To evaluate the extent to which risks identified in the risk assessment may be already addressed, this section
gives an overview of current risk reduction measures in the European Union. This overview is not exhaustive –
it covers EU-level risk management and draws on brief case examples from selected Member States.
5.4.2 Methodology, sources and limitations
This analysis is based on the following sources:
The targeted consultation: question 3.5 investigated actions already taken within the
respondents’ sector to control the risk from contaminants in digestate and compost. Responses
to this question were provided by the Association of the German Waste, Water and Resource
112 This is because the use as a stand-alone growing medium relates to growing plants in container beds, bags, or pots, where the
substance can be expected to remain in the compost and its interstitial water (soil pore-water) unless either degraded, lost by
volatilisation or taken up into plants; the latter could potentially lead to human exposure if the plants are eaten. 113 The central estimate of total compost produced in the EU (17.3 million tonnes) multiplied by 85%. 114 Note that JRC (2014) doesn’t explicitly distinguish container growing. The uses that potentially include container growing (hobby
gardening, horticulture and greenhouse production, blends, “others”) amount to 34% of all compost used. 51% are explicitly applied to
agricultural land. Source: DG JRC: Technical proposals on end-of-waste criteria for biodegradable waste subjected to biological
treatment, 2014. 115 I.e. the use percentages are multiplied with the central estimate of total compost produced in the EU (17.3 million tonnes).

115 © Wood Environment & Infrastructure Solutions UK Limited
February 2019
Doc Ref. 40039CL003i3
Industry116 (BDE), the European Biogas Association (EBA) and the European Compost Network
(ECN).
Outputs from Task 2 on ‘substance identification – identification of contaminants present in
digestate and compost’: existing defined or proposed limit values from European or national
regulations or guidelines.
Further literature review, to identify other existing measures in Member States, such as the
country reports from the European Compost Network.
This review of existing risks measures is not exhaustive; we list below a series of limitations in the review:
Information on existing risk management measures is scattered among legally binding and
non-binding measures across multiple pieces of legislation.
It was beyond the scope of this assessment to review in detail all relevant national legislation
for all EU Member States.
5.4.3 Results
At EU level, certain contaminants are addressed through EU-wide legislation, including bans or limit values.
The Stockholm Convention on POPs allows elimination and/or restriction in the production and
use of chemicals such as PCB, PCDD, PCDF, some pesticides, as well as PFAS. It also proposes
for listing PFOA-related compounds and PFHxS-related compounds.117
A revision of the Fertilising Products Regulation (FPR) is currently under way (European
Commission 2018b). The proposal specifies recovery rules for C/D which may be allowed as
component materials of CE-marked fertilising products. This includes restrictions on input
materials (among others, the organic fraction of mixed municipal household waste separated
through MBT and sewage sludge are excluded) and limit values on a range of contaminants
(including cadmium, mercury, nickel, lead, PAH, plastics) based on the recommendations made
by JRC (2014). In the updated current text, it is indicated that contaminants must not be present
in CE marked EU fertilising products by more than the following (European Commission 2018b):
Cadmium: where the EU fertilizing product has a total phosphorus (P) content of less than
5% phosphorus pentoxide (P2O5)-equivalent by mass: 3 mg/kg dry matter and where equal
or greater than 5%: 60 mg/kg phosphorus pentoxide.
Other limit values are established in the document (2 mg/kg dry matter for hexavalent
chromium; 1 mg/kg dry matter for mercury; 50 mg/kg dry matter for nickel; 120 mg/kg dry
matter for lead; 40 mg/kg dry matter for inorganic arsenic, etc.)
Other EU-wide initiatives include non-binding measures: the European Compost Network (ECN)
Assurance Scheme for Compost and Digestate includes further risk management measures
such as restriction of input materials (e.g. sludges and not separately collected waste are
excluded) and limit values for heavy metals and lays down harmonised requirements for
national certification bodies as well as quality criteria for recycled materials from organic
sources in digestate and compost (ECN 2018).
116 Bundesverband der Deutschen Entsorgungs-, Wasser- und Rohstoffwirtschaft 117 For example, its transposition as Council Regulation (EC) No 1195/2006 of 18 July 2006 amending Annex IV to Regulation (EC) No
850/2004 of the European Parliament and of the Council on persistent organic pollutants117 provides a limit value for PCBs and PFOS in
waste of 50 mg/kg d.m. each; if this limit is exceeded, the waste must be treated to ensure that the persistent organic pollutant is
destroyed or irreversibly transformed. Placing on the market or use of articles or mixtures containing PCBs and PFOS is fully prohibited,
except as an unintentional trace contaminant (for PFOS defined as 10 mg/kg, for PCBs not explicitly defined).

116 © Wood Environment & Infrastructure Solutions UK Limited
February 2019
Doc Ref. 40039CL003i3
Some EU-level legislation does not directly specify any risk management relating to contaminants in C/D, but
concerns some of the input materials of C/D and can therefore indirectly affects potential risks from C/D use:
The Urban Waste Water Treatment Directive establishes a requirement to collect and treat
urban wastewater as well as some industrial wastewaters. The focus of this directive is primarily
on the nutrient and pathogen content of waste flows, which are quantified in terms of
population equivalent. Chemical substances and potential impacts from chemicals of concern
are not directly included within the Directive (beyond Annex I) which indicates that for
industrial waste waters, the release of treated effluent should not have an adverse effect on the
environment. Article 14 encourages the re-use of sewage sludge “whenever appropriate”, while
“minimising adverse effects on the environment”, however no targets or risk management
measures are specified. The Directive also requires controlling and reporting disposal of sludge
and phases out disposal of sludge to surface waters. Changes to treatment methods for
wastewater under this directive may in turn affect concentrations of substances present in
sludge.
In the proposal for a revised Drinking Water Directive, new limit values for industrial
contaminants were introduced by the Commission in order to ensure the safety of drinking
water (European Commission 2018c). The proposal, supported by the European Parliament,
suggests limits of 0.1 µg/l for each individual PFAS substance and 0.5 µg/l for the sum of PFAS
substances.
These limits can be compared to the modelled concentration of PFAS in groundwater and
freshwater resulting from C/D use: PFOA concentration in groundwater resulting from C/D use
is estimated to be above the Drinking Water Directive proposal limit for each individual PFAS
substance in drinking water, but below the proposed limit for the sum of PFAS substances. The
estimated concentrations of PFOA in freshwater and of PFOS in both groundwater and
freshwater are well below both Drinking Water Directive proposal limits (for each individual
PFAS substance and for the sum of PFAS substances).
However, additional limits on PFAS in drinking water will also mean that water treatment will
potentially have to filter larger amounts of PFAS which would then end up in higher
concentrations in sludge, an input material for C/D.
The Sewage Sludge Directive encourages the use of sewage sludge in agriculture and regulates
its use to avoid adverse effects. In this context, limit values for concentrations of heavy metals
in sewage sludge intended for agricultural use and in sludge-treated soils are in Annexes I A, I B
and I C of the Directive. A study from JRC in 2012 in the context of the revision of the Directive
looks further into inorganic and organic contaminants such as heavy metals, PCBs, PCDD/Fs,
and PAHs, and also less investigated emerging compounds such as, for instance, brominated
flame retardants, ingredients of personal care products, pharmaceuticals, some industrial
chemicals, etc. in sewage sludge and treated bio-waste (JRC 2012).
The directive also prohibits the use of sewage sludge on agricultural land unless it is injected or
incorporated into the soil, or having undergone "biological, chemical or heat treatment, long-
term storage or any other appropriate process so as significantly to reduce its fermentability
and the health hazards resulting from its use". Hence the directive encourages the use of
sewage sludge that has undergone composting or anaerobic digestion, particularly if the
associated hazards are lower than for untreated sewage sludge.
Moreover, under the new requirements from the revised Waste Framework Directive, Member
States have to ensure by December 2023 that bio-waste is either collected separately or
recycled at source (e.g. home composting). As of 1 January 2027, composted or digested
municipal bio-waste may only be counted as recycled if it has been separately collected or
separated at source, therefore MBT C/D will no longer count towards recycling targets.
Therefore, MBT C/D can be expected to significantly decrease in volume in the years leading to

117 © Wood Environment & Infrastructure Solutions UK Limited
February 2019
Doc Ref. 40039CL003i3
these 2023 and 2027 deadlines, while volumes of C/D from source-separated biowaste are
likely to increase.
In addition EU Member States implement national risk management measures. Concentration limits or limit
values for contaminants were the most frequent risk management measure in our review. In most cases,
those limit values were mandatory (under legislation and standards); only very few cases (e.g. in Belgium)
provided a guidance limit value. From all types of substances assessed, the most regulated under national
legislation were PCBs (at least 8 countries out of 16), polycyclic aromatic hydrocarbons (PAHs) (at least 6
countries out of the 16), dioxins and furans (PCDD/PCDF) (at least 6 countries out of 16) and heavy metals, in
particular cadmium and chromium (at least 4 countries out of 16), followed by pesticides and perfluorinated
surfactants.
The highest number of risk management measures identified are in Germany, Belgium, Denmark, the United
Kingdom and Austria, followed by France. Example cases are presented below:
Germany implemented the EU bio-waste legislation into their national legal and policy
frameworks, and subsequently implemented additional acts and ordinances regarding bio-
waste. For example, the Bio-waste Ordinance (BioAbfV) covers information / requirements on
suitable input materials, processes, quality and hygiene of the products and applications; it also
contains obligations to provide evidence of compliance with those requirements. In addition,
there are quality assurance systems used by most of compost producers as well as digestate
producers for many years, i.e. BGK, RAL- Gütesicherung. These quality standards require the
declaration of plant nutrients, physical and biological parameters and heavy metal content.
Given the use of compost or digestate as fertiliser and soil improver, it was noted that their
harmlessness must be ensured. The quality standard RAL defines quality requirements,
differentiated for compost (mature, fresh, substrate), digestate (liquid, solid), digestate from
renewable raw materials (liquid, solid) and compost produced from sewage sludge. The
requirements of the RAL on quality standards in relation to impurities (e.g. glass and plastics)
are stricter than those in the above-mentioned Ordinance. Finally, threshold values for
impurities or contaminants are defined in the Fertiliser Ordinance (Düngemittelverordnung
DüMV 2012, latest amendment 12/4/2017).
In Belgium (Flanders), the VLAREMA-regulation, a Flemish regulation for sustainable
management of material circuits and waste streams, provides compulsory quality certificate for
the treatment of bio-waste, which is then subject to a Vlaco-certificate118 to ensure its
sustainable application and ensures that the unacceptable diffusion of unwanted or polluting
substances is avoided when applied as fertiliser. The VLAREMA-regulation establishes limit
values for key environmental parameters, both organic (e.g. PAH, PCB, volatile compounds, etc.)
and inorganic (e.g. heavy metals). The Vlaco Quality Assurance System is based on even stricter
limit values than those in the regulation.
In the United Kingdom, both compost and digestate are subject to a national standard, called
a ‘Publicly Available Specification (PAS), published by the Brigit Standards Institute (BSI):
Compost PAS 100, Specification for Composted Materials (2011) and Digestate PAS 110,
Specification for whole Digestate, Separated Liquor and Separated Fibre Derived from the
Anaerobic Digestion of Source-Segregated Biodegradable Materials (2014). These two
specifications establish limits values for contaminants and require independent third-party
certification, for which operators have to provide evidence that contaminant limit levels have
not been exceeded.
118 In the context of the Flemish Waste Regulation (VLAREMA), Vlaco is appointed by the Flemish Waste Authority OVAM to implement
quality control for the biological treatment of bio-waste.

118 © Wood Environment & Infrastructure Solutions UK Limited
February 2019
Doc Ref. 40039CL003i3
In Denmark, the Statutory Order on the application of waste products for agricultural purposes
No 834 regulates the agricultural reuse of main biodegradable wastes, including compost and
sewage sludge. It provides limit values for heavy metals and organic pollutants.
Risk management measures other than concentration limits, i.e. restriction on input materials, on uses or
through specific processes were seldom or not applied:
Table 5.3 Examples of measures other than concentration limits
Examples of measures other than concentration limits
Germany In addition to transposing the EU bio-waste legislation into its national legal framework, Germany
implemented additional acts and ordinances regarding bio-waste. The Bio-Waste Ordinance contains
information and requirements on suitable input materials, processes, quality and hygiene of the products
including their applications.
Hungary In Hungary, the Regulation 23/2003 Technical Requirements of Bio-waste Treatment and Composting
covers suitable input materials, hygiene requirements and technical specifications of composting.
Estonia In Estonia, the Regulation on Requirements for Producing Compost for Biodegradable Waste provides
quality parameters for compost, such as maximum particle size, bulk density, water content, salinity, pH,
etc.
Other In additional to national regulations (e.g. bio-waste ordinance, compost regulations, fertilisers
regulations, etc.) third-party control through national quality schemes have been established in various
Member States.
5.4.4 Conclusions
Geographical coverage
The current European legislative framework addresses certain contaminants. Member States must directly
apply or transpose theses into their national legislation, such as the Stockholm Convention on Persistent
Organic Pollutants119 or the revised Fertilising Products Regulation, once adopted. Other non-binding
measures have been established, such as requirements from the European Compost Network on recyclate
from organic sources. In addition, our review found additional risk management measures implemented in 16
European countries (15 EU countries and Norway), with the most measures found for Germany, Belgium,
Denmark, the United Kingdom and Austria, followed by France.
Types of existing risk management measures identified
Concentration limits, i.e. limit values for contaminants, were the most frequent risk management measures in
all EU Member States. In the majority of cases found, those limit values were mandatory (under legislation
and standards); only very few cases provided a guidance limit value. Other types of measures such as
restriction on input materials, on uses, or reductions of contaminants through specific processes were seldom
or not applied.
Substances covered
From all types of substances assessed in this review the most regulated in various national legislation were
PCBs, dioxins and furans (PCDD/PCDF), polycyclic aromatic hydrocarbons (PAHs) and heavy metals (in
particular cadmium and chromium), followed by pesticides and perfluorinated surfactants.
119 Transposed in the Council Regulation (EC) No 1195/2006 of 18 July 2006 amending Annex IV to Regulation (EC) No 850/2004 of the
European Parliament and of the Council on persistent organic pollutants.

119 © Wood Environment & Infrastructure Solutions UK Limited
February 2019
Doc Ref. 40039CL003i3
5.5 Identification and assessment of risk management options
This section identifies the different options and assesses their suitability. The assessment follows relevant
ECHA guidance on Annex XV for restrictions based on the following criteria (ECHA 2007):
Effectiveness: Is the option targeted at the effects or exposures that cause the identified risks,
capable of reducing these risks to an acceptable level within a reasonable period of time, and
proportional to the risk?
Practicality: Is the option implementable, enforceable and manageable?
Monitorability: Is it possible to monitor the implementation of the option?
Socio-economic considerations are addressed in Section 5.6 and combined with information from this
section (5.5) to determine the preferred combination of) risk management options in Section 5.7.
Based on literature review120, the targeted stakeholder consultation under Task 1, and discussions with the
steering group, the following main options have been identified:
1. Directly setting concentration limits for the contaminants of concern.
2. Indirectly reducing the contaminants of concern by eliminating the use of potentially
contaminated input materials (feedstocks) in composting/AD.
3. Reducing the exposure to the contaminants through the conditions of use of C/D.
4. In certain cases the concentration of contaminants in C/D can be reduced by applying specific
processes before composting/AD (e.g. during the collection and separation of organic waste),
during composting/AD (e.g. specific time-temperature profiles or separation of
compost/digestate made from different feedstocks) or after composting/AD (post-processing).
Several legal instruments are available to implement each option, the advantages and disadvantages of
which are discussed for each option below. The option of doing nothing (‘status quo’) is also briefly
discussed.
5.5.1 Option 0: ‘Status quo’
As set out in Section 5.4, a number of activities are already targeting known risks from digestate and
compost used as fertilisers. Below the extent to which this will address the risks identified (see Section 5.2) is
discussed.
The proposal for the revised Fertilising Products Regulation (FPR) is the main regulatory activity to addresses
the risk from C/D used as fertilisers on EU-level (European Commission 2018b). It includes restrictions on
input materials (among others, the organic fraction of mixed municipal household waste separated through
MBT and sewage sludge are excluded) and limit values on a range of contaminants (including cadmium,
120 In particular, JRC (2014) noted the environmental and health risks from compost and digestate could be limited by end-of-waste
criteria (i.e. criteria ensuring their use is safe for the environment and human health so that no regulatory controls under waste
legislation are needed) “including certain product quality requirements regarding pollutants and impurities, restrictions on the input
materials used to produce the compost/digestate, and process requirements to eliminate pathogens from the material.” JRC concluded
that 5 complementary elements should be combined in a set of end-of-waste criteria for compost and digestate:
1. Product quality requirements [minimum limit values for nutrients, maximum limit values for contaminants]
2. Requirements on input materials
3. Requirements on treatment processes and techniques
4. Requirements on the provision of information
5. Requirements on quality assurance procedures
Source: JRC 2014
JRC’s Elements 1-3 are reflected in Options 1, 2 and 4 of this RMOA below. JRC’s Elements 4 and 5 concern aspects related to monitoring
and implementation, rather than potential standalone risk management options.

120 © Wood Environment & Infrastructure Solutions UK Limited
February 2019
Doc Ref. 40039CL003i3
mercury, nickel, lead, PAH, plastics) based on the recommendations made by JRC (2014). These address some
but not all of the risks identified in this study. For example, some substances of particular concern such as
PCBs, dioxins and furans and nonylphenol are not addressed.121 Moreover, the proposal applies only to CE-
marked fertilising products. This means that other national fertilisers may still co-exist, which do not adhere
to the proposal. According to personal communication with the European Biogas Association, they expect
that many Member States will likely adopt national rules consistent with the Fertilising Products Regulation
so that in practice its provisions will apply to the majority of the compost/digestate market, but this is
currently still uncertain.
In addition, the European Compost Network (ECN) Quality Assurance Scheme for Compost and Digestate
includes further risk management measures. However, quality assurance schemes are non-binding and so
their ability to control the risk generally depends on their uptake. According to personal communication with
ECN, they are well established in any country where there is a market for compost122, but it is not certain if
they are applied in all Member States and how well digestate is covered.
EU Member States have also implemented national risk management measures to address the issue of
contaminants in digestate and compost. Although our review of existing limit values is likely not
comprehensive, it suggests that limit values do not exist in all Member States, do not cover all substances of
concern, and often exceed safe limits calculated in this study.123 Other types of measures such as restriction
on input materials, on uses or reduction of contaminants through specific processes were seldom or not
applied in Member State regulation. Furthermore, with national-level regulation there is potential for
discrepancies in the allowed input materials, their definitions, and concentration limits used in any national
restrictions. This has implications not only for the degree to which the environment is protected, but also in
terms of ensuring the functioning of the internal market124.
In conclusion, this suggests some risk management is already in place in the majority of the EU C/D market,
but is unlikely to adequately control the risk identified in this study. Notably, there is a lack of binding and
coherent requirements for all types of C/D and all Member States. As discussed in Section 5.3, the production
of digestate as fertiliser is expected to increase significantly in the short to medium term. Whether the status
quo risk management will continue to provide even the level of protection it is achieving now is
questionable.
121 In terms of input materials, the exclusion of MBT waste and sewage sludge addresses all input materials for which generally higher or
maximum concentrations were reported for Lead, Zinc, 17α-ethinylestradiol, PFOA and PFOS. This means, the input materials associated
with the highest concern and that are a priority for the reduction of risk from these substances are addressed by the proposal, although
potentially unacceptable risk may still be posed by these substances at lower concentrations from other input materials. Furthermore, for
Nickel, Mercury, dioxins and furans and Nonylphenol, generally higher or maximum concentrations were reported also for other input
materials (biowaste and greenwaste) which are not excluded in the proposal. See Section 5.3.1.
In terms of limit values, some of the proposed limit values are below the safe limit concentration calculated in this study and therefore
appropriately address the risk, but several proposed limit values far exceed the safe limit concentration calculated in this study. For
instance, for nickel, the proposed limit value (50 mg/kg d.m.) is below the safe limit concentration calculated in this study for application
to agricultural land (130 mg/kg d.m.), but far exceeds the safe limit concentration for container growing (7.9 mg/kg d.m.). For mercury,
the proposed limit value (1 mg/kg d.m.) far exceeds the safe limit concentration calculated in this study for application to agricultural
land (0.2 mg/kg d.m.).
For PCBs and nonylphenol, two (groups of) substances which the risk assessment of this study suggests are among the priorities for risk
management, the proposal includes neither limit values, nor does it exclude the input materials for which generally higher or maximum
concentrations were reported. Note that for PCBs the JRC report makes reference to the POPs Regulation limit values, which are however
not specifically designed for compost/digestate use, and relatively high at 50 mg/kg d.m. 122 For instance, in Germany >70% of compost is covered. The share is high also in Austria, the Netherlands, Flanders and others, and it is
increasing in Italy. 123 A more detailed assessment of the limit values that would be required to adequately address the risks identified in this study is
provided in Section 5.5.2. 124 Note that overcoming this issue is an objective of the ECN Quality Assurance Scheme.

121 © Wood Environment & Infrastructure Solutions UK Limited
February 2019
Doc Ref. 40039CL003i3
5.5.2 Option 1: Additional or stricter concentration limits for specific substances in
compost and digestate used as fertiliser
Concentration limits are a measure to directly limit pollutants to levels considered to pose no (or an
‘acceptable level’ of) risk. As discussed in Section 5.4, concentration limits for certain substances in C/D
already exist (either in Member State legislation or in quality assurance schemes). JRC (2014) identified the
following potential parameters for direct quality criteria on compost/digestate:
1. Quantitative minimum limits of elements providing a soil improvement/fertilising function, such
as organic matter content, or nutrient (N, P, K, Mg) content.
2. Quantitative maximum limits on elements potentially toxic to human health or ecotoxic, such as
heavy metals, or persistent organic pollutants.
3. Quantitative maximum limits on macroscopic foreign materials (e.g. glass, plastics, metals).
4. Limited content of pathogens (if appropriate through quantitative maximum limits).
5. Limited presence of viable weeds (if appropriate through quantitative maximum limits).
6. Minimum stability (if appropriate through quantitative maximum limits).
Taking each of the above criteria in turn: numbers one, five125 and six126 are not relevant in the context of risk
from contaminants to the environment and health. Pathogens (number 4) were not selected as contaminants
of concern for the purpose of this RMOA (see Section 3). So only criteria two and three are potentially
relevant and discussed below.
The contaminants can be split into three groups:
(1) Substances for which safe limit concentrations in C/D were calculated based on exposure
and risk characterisation in the risk assessment;
(2) Substances for which safe limits are not definable, but limit values already exist (in national
legislation, quality assurance schemes, or the proposed end-of waste criteria from JRC 2014);
and
(3) Substances for which neither safe limits can be defined, nor existing limit values identified.
Group 1: Safe limit substances
For substances for which exposure and risk characterisation were completed in the risk assessment, safe limit
concentrations in C/D were calculated, as shown in Table 5.4. This includes most heavy metals (Cd, Ni, Cu, Zn,
Hg) and nonylphenol. For heavy metals, limit values already exist127. These are also shown in the table, for
context. It should be noted that the existing limit values can deviate from the safe limits calculated in this
study for a variety of reasons.128
125 In the context of end-of-waste criteria (which are the focus of JRC 2014), product quality criteria are also needed to check that the
product is suitable for direct use (on land, for production of growing media, in addition to criteria on environmental and health risks. 126 According to JRC (2014), the aim of minimum stability is “to avoid methane and odour emissions during uncontrolled anaerobic
conditions after sales (e.g. during storage)”, which are not related to contaminants. 127 E.g. in the proposal for the revised Fertilising Products Regulation (European Commission 2018b), the ECN Quality Assurance Scheme
(ECN 2018) and in many national regulations. 128 They may reflect different assumptions and approaches to risk assessment as well as specific local circumstances (affecting the
scenarios used in the risk assessment). Other factors such as socio-economic and political considerations may also have affected the
choice of limit values.

122 © Wood Environment & Infrastructure Solutions UK Limited
February 2019
Doc Ref. 40039CL003i3
Table 5.4 Overview of calculated safe limit values in compost and digestate and identified existing limit
values
Substance Safe limit concentration in
compost and digestate for
application to agricultural
land
Safe limit concentration in
compost for container
growing[1]
Existing limit values
Cadmium [2] [2] 1.5 mg/kg d.m. (FPR), 1.3 mg/kg d.m.
(ECN-QAS), 0.4 mg/kg d.m. (Norway),
1.0-1.5 mg/kg d.m. (Germany,
depending on application load and
input materials), 0.036 kg/ha (UK,
voluntary standard).
Nickel [2] 7.9 mg/kg dry weight 50 mg/kg d.m. (FPR), 40 mg/kg d.m.
(ECN-QAS), 35-80 mg/kg d.m.
(Germany, depending on application
load and input materials) 1.2 kg/ha (UK,
voluntary standard).
Copper [2] 200 mg/kg dry weight 300 mg/kg d.m. (FPR, ECN-QAS), 70-
900 mg/kg d.m. (Germany, depending
on application load and input
materials), 4.8 kg/ha (UK, voluntary
standard).
Zinc 600 mg/kg dry weight 70 mg/kg dry weight 800 mg/kg d.m. (FPR), 600 mg/kg d.m.
(ECN-QAS), 300-5,000 mg/kg d.m.
(Germany, depending on application
load and input materials).
Mercury 0.2 mg/kg dry weight [2] 1 mg/kg d.m. (FPR), 0.45 mg/kg d.m.
(ECN-QAS), 0.7-1.0 mg/kg d.m.
(Germany, depending on application
load and input materials), 0.024 kg/ha
(UK, voluntary standard),
Nonylphenol [2] 3.5 mg/kg dry weight [3] 25 mg/kg d.m. (Wallonia, Belgium,
Guide value only, for digestate only),
10 mg/kg d.m. (Denmark).
Notes:
1) Note that there are some uncertainties associated with the container growing scenario used, as discussed in Appendix D. In particular,
the current calculations assume that there is no loss of the substance from the growing medium by leaching (although the analysis
carried out in Appendix D suggests that this may not be so significant for nickel, copper, zinc and nonylphenol) and that the dietary
intake from root and leaf crops occurs entirely from crops grown in such media. This latter assumption, in particular, may lead to an
overestimation of the risks associated with compost and digestate containing nickel in this scenario and so the estimated safe limits
should be seen as preliminary only.
2) Safe limit would be higher than the current levels so this is not currently seen as a concern.
3) As per the definition of ‘safe limit’ earlier in this section, this refers only to the endpoint in question (for nonylphenol this is set out in
Table 4.19). However, nonylphenol also has other adverse effects which can occur at lower concentrations.
The risk assessment suggests that setting (additional, EU-wide) limit values equal to the calculated safe limits
would adequately control the risk, while minimising the amount of compost/digestate restricted. Where
concentrations are below the safe limits, this implies no further risk management is required.
Group 2: Substances without safe limits but with existing limit values
For substances for which conventional quantitative risk characterisation is not appropriate, safe limits could
not be defined in the risk assessment. Hence, it is not immediately clear at which level limit values (if any)
should be set. However, safe limit values could be informed by the level at which existing safe limits (e.g. in

123 © Wood Environment & Infrastructure Solutions UK Limited
February 2019
Doc Ref. 40039CL003i3
national legislation) have been set, as presented in Table 5.5. This assumes the existing limit values are risk
based, i.e. the associated risks were considered “acceptable” by the responsible organisations (e.g. competent
authorities, industry associations, or JRC 2014).
Table 5.5 Overview of identified existing limit values for substances were safe limits are not definable
Substance Existing limit values
PCBs 50 mg/kg d.m. (POPs Regulation), 1.2 mg/kg d.m. (Norway, PCB6), 0.2 mg/kg d.m. (Austria, PCB6), 0.1 mg/kg
d.m. (Luxemburg, PCB6, guide value only), 0.4 mg/kg d.m. (Slovenia, PCB6), 0.8 mg/kg d.m. (France, PCB7, only
for sewage sludge compost), 0.2 mg/kg d.m. (Germany, only for sewage sludge products), 0.08 mg/kg d.m.
(Denmark, PCB7), 0.8 mg/kg d.m. (Flanders, PCB7), 0.15 mg/kg d.m. (Wallonia, PCB7).
Dioxins and
furans
20 ng I-TEQ /kg dm (Austria, PCDD/F), 20 ng I-TEQ /kg dm (Wallonia, PCDD/F), 20 ng I-TEQ /kg dm
(Luxemburg, PCDD/F, guide value only), 20 ng I-TEQ /kg dm (Switzerland, PCDD/F, guide value only), 30 ng
WHO-TEQ/kg dm (Germany, maximum sum of PCDD/F and dl-PCB, in some cases additional restrictions for
PCDD/F only of maximum 5 ng WHO-TEQ/kg dm)
Lead 120 mg/kg d.m. (FPR), 130 mg/kg d.m. (ECN-QAS), 100-150 mg/kg d.m. (Germany, depending on application
load and input materials)
PFAs 100 µg/kg d.m. (Austria, Denmark and Germany, PFOA+PFOS).
PAHs 6 mg/kg d.m. (FPR, PAH16), 1.5 mg/kg d.m. (France, Benzo[a]pyrene), 2.5 mg/kg d.m. (France,
Benzo[b]fluoranthene), ), 4 mg/kg d.m. (France, Fluoranthene), 3 mg/kg d.m. (Denmark, PAH11), 3 mg/kg d.m.
(Norway, PAH16), 3 mg/kg d.m. (Slovenia, PAH16), 4 mg/kg d.m. (Switzerland, PAH16), 5 mg/kg d.m. (Belgium,
PAH16), 6 mg/kg d.m. (Austria, PAH6), 10 mg/kg d.m. (Luxembourg, PAH16).
Group 3: Substances without safe limits or existing limit values
For these substances neither calculated safe limits nor existing limit values can inform the choice of an
appropriate limit value. Hence, additional criteria would be needed to judge appropriateness of limit values
for these substances. Of the substances prioritised for further risk management (as per Section 5.2), this is the
case only for 17α-ethinylestradiol.
Enforceability, manageability and monitorability of concentration limits as risk management
As discussed above, concentration limit values are included in existing risk management measures. As a
result, approaches to enforce and monitor concentration limits already exist. Quality assurance schemes
including limit values have achieved a high market penetration in many countries129 which would suggest
existing limits are also manageable. However, the question remains whether this would be significantly
affected by additional limits. Changing the level of existing concentration limits would likely not have any
significant impact on enforceability, manageability and monitorability130. However, setting concentration
limits for additional contaminants would require additional concentration measurements.
The burden of concentration measurements for different combinations of contaminants and for different
sizes of installations was discussed in detail in JRC (2014) (see in particular the section “Requirements on
product testing for compost and digestate” from page 142). This is not reproduced here in detail, but the JRC
concluded that whilst some concerns were raised over the burden to very small plants, the “sampling and
analysis cost associated to the proposed EU end-of-waste framework [covering heavy metals and PAH16 at
129 According to personal communication with the European Compost Network (ECN), quality assurance systems (QAS) in compliance
with the ECN-QAS (which specifies concentration limits) are very well established in any country where there is a market for compost. For
instance, in Germany >70% of compost is covered. The share is high also in Austria, the Netherlands, Flanders and others, and it is
increasing in Italy. 130 The requirements would be similar in nature and the same mechanisms for checking compliance and monitoring could be used.

124 © Wood Environment & Infrastructure Solutions UK Limited
February 2019
Doc Ref. 40039CL003i3
specified sampling frequencies] appears very reasonable compared to typical overall operating costs for most
plants and that the additional cost induced by measurement of PAH16 represents only a minimal fraction of
the typical operating cost of most medium-sized to large plants” (JRC 2014). Other organic pollutants such as
PCBs, dioxins and furans and PFCs (which includes PFOA and PFOS) were not included in the proposed end-
of-waste criteria but were discussed in JRC (2014). A key paragraph is reproduced in the box below, showing
that the inclusion of further organic pollutants can increase sampling costs significantly. The magnitude of
these additional costs would depend on which substances (e.g. which PCBs exactly) will be assigned limit
values, as well as the sampling frequency. JRC also notes that prices for sampling are likely to decrease in the
long term thanks to EU-wide standardisation of the measurements and ensuing increased competition
between laboratories.
Of the substances prioritised for further risk management (Section 5.2), only the measurement of
nonylphenol and 17α-ethinylestradiol were not discussed in JRC (2014). ECHA (2014) suggested a cost of
about €200 per test for nonylphenol ethoxylates in textiles – costs for nonylphenol in compost/digestate
could be in a similar order of magnitude but no specific data was available. No data on the measurement
costs for 17α-ethinylestradiol in compost/digestate was available. Despite the limited information available it
is likely that measurements of nonylphenol and/or 17α-ethinylestradiol would add significant burden.
5.5.3 Option 2: Restriction on the input materials (feedstocks) in compost and digestate
used as fertiliser
Restricting input materials aims to eliminate those materials that are the most likely or significant sources of
contaminants. As discussed in Section 5.4, some restrictions on input materials already exist, but, restrictions
of input materials are less common than concentration limits.
Note that the concentration of contaminants in input materials is subject to variation and so the risk cannot
be directly controlled by restricting input materials. However, according to JRC (2014) the restriction of input
materials is considered a potentially more workable alternative and/or additional safeguard to checking
JRC (2014): Cost of measurements for contaminant concentrations
“Several stakeholders provided cost data showing that measurement costs for heavy metals in compost/digestate
were on average 129 Euro for a full metal set (range of 42 to 230 Euro), 149 Euro for PAH16 (range of 85 to 245
Euro), 201 Euro for PCB (range of 85 to 480 Euro), 481 Euro for PCDD/F (range of 300 to 741 Euro) and 150 Euro for
PFC (only one data source). This shows that PCDD/F measurements are clearly the most expensive, followed by PCB,
whereas PAH and PFC measurements only seem slightly more expensive than heavy metal measurements. For
comparison, prices provided for the full suite of measurements for quality assured composts/digestates were
generally situated between 350 and 550 Euro. Hence, adding the full set of 4 organic compound groups would
roughly result in a tripling of the current analytical costs, whereas including only a PAH measurement would lead to
an increase of the current measurement costs with about a third. Moreover, if only one PAH measurement would be
required for every fifth sample, the average analytical cost for end-of-waste materials would only increase by 7%. In
addition, other stakeholders have argued that cost increases would not be linear. As such, data were provided that
showed that packages of different analytical parameters were generally more economical, e.g. 190 Euro for a full set
of 8 heavy metals, PAH16 and PCB7, compared to 91 Euro for the metals alone, for a same laboratory. Moreover, it
is believed that a price increase from implementing mandatory organic pollutants measurements would be partially
offset by a price decrease on the long term thanks to EU-wide standardization of the measurements and ensuing
increased competition between laboratories.”
Source: DG JRC: Technical proposals on end-of-waste criteria for biodegradable waste subjected to biological
treatment, page 133, 2014.

125 © Wood Environment & Infrastructure Solutions UK Limited
February 2019
Doc Ref. 40039CL003i3
concentration limits. As discussed in Section 5.3, generally higher or maximum concentrations of substances
of concern were noted in the following input materials131:
Sewage sludge exhibits generally higher or the maximum observed concentrations for most
priority substances of concern (copper, zinc, mercury, 17α-ethinylestradiol, dioxins and furans,
nonylphenol, PFOA, PFOS, PAHs).
Biowaste and greenwaste compost/digestate exhibits generally higher or the maximum
observed concentrations for nickel, mercury, Nonylphenol and possibly dioxins and furans and
cadmium.132
Mechanical biological treatment (the organic fraction of mixed municipal solid waste) digestate
exhibits generally higher or the maximum observed concentrations for heavy metals.
The majority of the total digestate and compost produced in the EU is agricultural digestate (manure and
energy crops), which could not be linked to particularly high concentrations of any priority substances of
concern with certainty. It should be noted that sewage sludge C/D only accounts for a small share of the EU
compost/digestate production (at least 2.5 million tonnes), while biowaste and greenwaste
compost/digestate account for some 21-25 million tonnes, and MBT digestate even some 46 million tonnes.
Restricting an input material with a smaller tonnage would constitute a less disruptive effect on the
compost/digestate market, but it would also control a smaller share of the risk posed by the EU-wide market.
Section 4 of JRC (2014) discusses advantages and disadvantages of granting end-of-waste status to
compost/digestate from a wider or smaller range of input materials, and of using a positive list of allowed
materials or a negative list of prohibited materials. This discussion is not reproduced here. However, based
on JRC (2014) and discussions with key stakeholders over the course of this study, the main features of
restrictions on input materials as compared to additional or stricter concentration limits are:
Reinforced consumer confidence (by including only input materials with a proven track record
of quality);
Easier and less costly monitorability and enforceability, because of less comprehensive
sampling required;
More directly encouraging separate waste collection (if use of not separately collected waste is
prohibited);
No level playing field of standards across all C/D materials and thus not the same simplicity and
clarity to producers and consumers;
Not technology neutral and less legal certainty for long-term investment planning.
5.5.4 Option 3: Restriction on the conditions of use of compost and digestate used as
fertiliser
While options 1 and 2 focus on reducing the risk by reducing the concentration of the contaminants in C/D,
option 3 focuses on reducing exposure by restricting uses where the contaminants are more likely to affect
people or ecosystems. This risk management option could only effectively control the risk where the risk
assessment has identified a concern for specific use scenarios. These cases are marked in Table 5.2 (Section
5.3.2) and discussed further below.
131 Note that this does not imply that a potentially unacceptable risk exists only for compost/digestate from these input materials.
However, if an input material exhibits generally higher concentrations (or the risk of occasionally very high concentrations of
contaminants), it could be prioritised for risk management. 132 Among the highest concentrations reported was a digestate made from a mix of biowaste/green waste, manure, energy crop. It is
unclear from which of these input materials the high PCB and cadmium contents stem.

126 © Wood Environment & Infrastructure Solutions UK Limited
February 2019
Doc Ref. 40039CL003i3
For nickel, copper and nonylphenol, a potential concern (measured concentrations in C/D
exceed safe limits) has only been identified for container growing but not for application to
agricultural land.133
For zinc, for both uses a potential risk has been identified and for mercury a potential risk has
been identified for application onto agricultural land, but not container growing.134
For Lead, BPA, DEHP, 17α-ethinylestradiol, HBCDD, PCBs, dioxins and furans and PFAs, safe
limits could not be calculated, but exposures at the steady state are higher for the container
growing scenario than for application onto agricultural land.
Hence, for all substances for which the risk assessment has found a concern - except for zinc and mercury -
the risk could be reduced by restricting the use of C/D in container growing. According to the market
analysis, the vast majority of digestate is used directly as fertiliser in agriculture. On that basis the risk
assessment has assumed that only compost is used in container growing. While the available market data for
compost does not explicitly distinguish container growing, it is estimated that in the order of 6 million tonnes
correspond to uses that potentially include container growing (see Section 5.3).
To further target this risk management option, it could be combined with a restriction on input materials (see
Option 2 above). This would mean that in particular composts from input materials with generally higher or
highest maximum concentrations of those contaminants with a greater risk in container growing are
prohibited in that use.
Little information on the implementability, enforceability, manageability and monitorability of this risk
management measure was available because it was not proposed as an end-of-waste criterion (see JRC
2014)135. However, it appears likely that prohibiting a specific use (e.g. container growing) for a specific
product (e.g. sewage sludge compost) should be simple to implement and manage through labelling and
rules for distributors and retailers. Monitoring and compliance checks are likely to be more difficult,
particularly for consumers (as opposed to professionals) which are likely among the users of compost in
container growing.
5.5.5 Option 4: Specification of using specific processes
Specific processes and techniques are available that can reduce the concentration of contaminants in C/D.
This potentially includes the introduction of additional processes and techniques:
before composting/AD, i.e. addressing the feedstocks, their collections, handling and
processing;136
during composting/AD, i.e. the composting/AD processes themselves; or
after composting/AD, i.e. post-processing.137
133 This is because the use as a stand-alone growing medium relates to growing plants in container beds, bags, or pots, where the
substance can be expected to remain in the compost and its interstitial water (soil pore-water) unless either degraded, lost by
volatilisation or taken up into plants; the latter could potentially lead to human exposure if the plants are eaten. Note however the
uncertainties associated with the container growing scenario results, particularly for Nickel and to a smaller extent for Copper, as
discussed in Section 4. 134 This is because the main risk identified for mercury is secondary poisoning via the fish food chain, which is not relevant for the
container growing scenario. Although leaching from the compost in used container growing into interstitial water may occur, this will
tend to be taken back up into the compost/plant and is unlikely to lead to significant exposure of the external environment. 135 In the context of end-of-waste criteria restrictions on the use of the product are not appropriate because end-of-waste status should
imply a full-fledged product without any further waste management controls. This principle is however not critical in the context of this
RMOA. 136 Note that this does not include restrictions on which input materials (feedstocks) can be used for composting/AD, as this is addressed
in Option 2. 137 Note that this does not include the conditions of use of compost and digestate, as this is addressed in Option 3.

127 © Wood Environment & Infrastructure Solutions UK Limited
February 2019
Doc Ref. 40039CL003i3
Processes and techniques during and after composting/AD are primarily related to the composting/AD
operator or possibly other stakeholders processing compost or digestate further. In contrast, processes and
techniques before composting/AD (such as waste collection and separation) primarily concern other
stakeholders that are not directly handling C/D themselves (such as waste operators). Therefore in the
following, processes and techniques during and after composting/AD are assessed jointly, and processes and
techniques before composting/AD are assessed separately.
Processes and techniques during and after composting/AD
Table 5.6 provides a brief overview of the available processes and techniques to reduce each of the
contaminants whose risk has been assessed in this report.
Table 5.6 Overview of reduction of contaminants through specific anaerobic digestion, composting, or
post-treatment processes
Chemical category or
family
Representative
substances assessed
Relevant AD/composting processes or post-treatment
Heavy metals Cadmium, Nickel, Lead,
Copper, Zinc
Metals can be removed from digestate through a two-stage AD process
(Evans 2001). The 1st stage includes hydrolysis/acidification and
liquefaction of the substrate and the 2nd stage includes
methanogenesis. Research results show that around 70% of the Ni, 40%
of the Zn and 25% of the Cd can be removed.138 For Cu and Pb,
mobilization in the hydrolytic stage was shown to be lower (0.5% for Cu,
5% for Pb), resulting in less effective removal (Selling R., Håkansson T.,
Björnsson L. 2008).
Mercury (Hg) No relevant processes have been identified. Efforts to reduce mercury
typically focus on controlling mercury in feedstock by reducing or
eliminating the mercury contents in household products, particularly
batteries and fluorescent lamps.
Bisphenol A Bisphenol A (BPA) No relevant processes have been identified. Limam et al. (2012) studied
biodegradation of bisphenol A during anaerobic digestion process and
no biodegradation was observed.
Phthalates DEHP DEHP degrades better under aerobic than under anaerobic conditions
(Madsen et al., 1999; Staples et al., 1997). Therefore, DEHP can be
expected to be removed from organic waste through composting to a
much higher extent, compared to anaerobic digestion (Kupper et al.,
2008).
Pharmaceuticals 17α-Ethinylestradiol AD has been shown to reduce concentrations. Carballa et al. (2007) who
examined pharmaceutical and personal care products. The behaviour of
17α-Ethinylestradiol in laboratory scale anaerobic sludge digesters
under mesophilic conditions (37ºC) with a sludge retention time (SRT) of
30 d and under thermophilic conditions (55ºC) with an SRT of 20 days
was examined. Removal of 17α-Ethinylestradiol was reported to be
initially 60% rising to 90% with time.
However, it is not clear if using a specific process could be used to
reduce concentrations more than AD in general.
138 When the leachate from hydrolysis was circulated over a macroporous polyacrylamide column for 6 days (Lehtomäki, A and
Björnsson, L, 2006).

128 © Wood Environment & Infrastructure Solutions UK Limited
February 2019
Doc Ref. 40039CL003i3
Chemical category or
family
Representative
substances assessed
Relevant AD/composting processes or post-treatment
Hexabromocyclododecane Hexabromocyclododecane
(HBCDD)
AD has been shown to reduce concentrations of this contaminant.
Andreas C et al. (2006) investigate whether degradation of HBCD occurs
in a full-scale anaerobic digester. In accordance with the results of the
laboratory incubation experiments, concentration HBCD decreased
between inlet and outlet of the full-scale anaerobic digester by around
42%.
However, it is not clear if using a specific process could be used to
reduce concentrations more than AD in general.
Nonylphenol isomers and
ethoxylates
Nonylphenol Thermophilic digestion has been shown to be most effective to reduce
nonylphenol concentrations in digestate. Paterakis et al. 2012 found a
removal efficiency of nonylphenol in the mixed sludge of 92% for
thermophilic digestion, compared to 58% for mesophilic digestion.
Dioxins and furans 2,3,7,8-TCDD, 2,3,4,7,8-
PCDF
None found.
PCBs PCB28 Reeh and Moller (2001) and Brändli et al. (2007) find low rates of
degradation of PAH and PCB compounds during anaerobic digestion.
The combination with composting as a post-treatment shows a higher
rate of degradation (Reeh and Moller, 2001).
PAHs with a low molecular weight are known to be biodegraded under
aerobic conditions (Yuan et al., 2000) and two-stage anaerobic process
(Cea-Barcia et al., 2013).
PAH16 Benzo[a]pyrene, chrysene,
benz[a]anthracene,
benzo[b]fluoranthene,
indeno[,2,3-cd]pyrene
PFAs PFOA, PFOS, PFHxA There are no well-established treatment technologies for PFAs
contaminated digestate/compost. The main post-treatment
technologies that can be considered to remediate PFAs in
digestate/compost include sorption and stabilization or the
mobilizing/destructing of contaminants using heat (thermal
technology). Thermal treatment trials conducted by Enviropacific, 2017
on PFAs impacted soils have demonstrated highly effective contaminant
removal of all 20 commonly observed PFAs analytes, with >99.9%
reduction in PFOS (from 172 mg/kg to 0.004 mg/kg), and PFOA (from
2.73 mg/kg to <0.0005mg/kg).
Physical impurities Microplastics The main process to remove microplastics in compost/digestate is
mechanical screening in the pre- and post-treatment, including physical
purification through ultra-filtration and reverse osmosis. In-vessel
cleaning systems such as a rotating skimmer can remove floating
material such as plastics (WRAP 2012).
In the following, the relevant processes/techniques identified above are assessed further, including their
effectiveness in controlling the risks, practicality, monitorability and any other aspects relevant to their
suitability as risk management option. Note that some product quality criteria schemes and the proposed
end-of-waste criteria (JRC 2014) for C/D also specify several other processes that do not relate to any
particular contaminant or group of contaminants prioritised for risk management in this study.139
139 These include:
- Time-temperature profiles (primarily address the presence of pathogens, which are not assessed in this study);
- Storage conditions to minimize emissions of greenhouse gases, odour or other compounds (does not relate to the uses assessed in
this study, i.e. the application of compost/digestate onto agricultural land or in container growing);
- Plants producing end-of-waste compost or digestate should only be allowed to process approved materials; the possibility of physical
contact between input materials and final products must also be prevented (do not relate to any particular contaminant or group of
contaminants, and no estimates of their effectiveness in reducing contamination is available - can be considered as an addition to other
risk management options, rather than an measure of their own).

129 © Wood Environment & Infrastructure Solutions UK Limited
February 2019
Doc Ref. 40039CL003i3
Two-stage anaerobic digestion: Two-stage anaerobic digestion allows higher reduction of
heavy metals (Cadmium, Nickel, Lead, Copper, Zinc) and a better biodegradation efficiency of
PAH16. In a two-stage anaerobic digestion system, hydrolysis/acidification and
acetogenesis/methanogenesis are technically separated to maintain optimum environmental
conditions for each group of microorganisms (acid and methane formers). It is associated with
higher cost and space, but provides several benefits: The selection and enrichment of different
microorganisms in each digester allows them to perform better and thus enhances the
efficiency of the plant. It also allows to apply a higher organic loading rate (OLR) and a shorter
hydraulic retention time (HRT) which ensures process stability even when input materials are
highly variable.
Post-composting: Aerobic conditions (i.e. composting) achieve a higher degradation of DEHP,
PAHs and PCB compounds (and pesticides) compared to anaerobic conditions. Therefore,
composting digestate as a post-treatment would lead to higher removal of those substances.
The implementation of this process would be associated with additional space, time and
operational cost.
Thermophilic digestion: There are two types of anaerobic digestion systems: mesophilic
(optimum temperature 37⁰C) and thermophilic (optimum temperature 55⁰C). All feedstock
considered for anaerobic treatment is processed under either of these conditions. Removal
efficiency of nonylphenol is higher for thermophilic digestion compared to mesophilic
digestion. The adaptation of mesophilic anaerobic digestion to thermophilic conditions is in
principle practicable to every plant140. Bouskova et al. (2005) showed that the required increase
in temperature can be achieved directly in one step. The disadvantage of thermophilic
stabilization is that more energy for the heating system is required.
PFAs extraction: Heat can be used to increase the volatility of PFAs such that they can be
volatilised from the digestate/compost. The resulting gases are treated at very high
temperature to break down the PFAs and allow capture of the resulting fluoride in an air
pollution control device. Thermal treatment requires an additional appropriately designed plant
to treat the material and is associated with significant energy costs.
Mechanical screening: As discussed in Table 5.6, microplastics in compost/digestate can be
removed through readily available mechanical screening technologies. However, microplastics
was not prioritised for risk management (see Section 5.2), so this is not discussed in further
detail here.
Regarding the enforceability, manageability and monitorability of specific processes as risk management in
general: Regulators could check compliance with requirements to use specific processes through inspections
and/or a monitoring regime including submission of monitoring data to the regulator at regular intervals.
Operators need to be able to monitor a range of parameters at different stages of the composting/AD
process in order to control the process. This includes temperature, hydraulic retention time (HRT), pH,
loading rate, waste composition, chemical oxygen demand (COD), dry matter (DM), flows and composition.
Therefore the required monitoring infrastructure is already in place.
Processes and techniques before composting/AD
FERA (2011) has assessed in detail the potential for upstream control of contaminants in C/D (amongst other
materials) spread to land. The contaminants considered included heavy metals, POPs, bulk industrial and
domestic chemicals, pesticides, human pharmaceuticals, veterinary medicines, biocides and PCPs, as well as
pathogens. Table 5.7 summarises the potential upstream processes and techniques (hereafter referred to as
measures for simplicity) identified in FERA (2011) for the contaminants that were prioritised for risk
140 According to Wood internal experts on anaerobic digestion.

130 © Wood Environment & Infrastructure Solutions UK Limited
February 2019
Doc Ref. 40039CL003i3
management in this study. As the table shows, there are a range of possible measures across various sectors.
Below, for each main input material for compost/digestate, the most promising measures are listed141:
Agricultural digestate (energy crops and manure) (122 million tonnes of digestate): Reducing
heavy metal content in manure by controlling livestock diet.
Mechanical biological treatment of mixed municipal solid waste (46 million tonnes of
digestate): Several identified measures relate to sources that would be expected to end up in
significant quantities only in mixed municipal solid waste. This includes measures such as use of
metal-free inks, use of Cadmium-free or Lead-free batteries, recycling of batteries and take-
back schemes for safe disposal of pharmaceuticals.
Biowaste/greenwaste (21-25 million tonnes of C/D): Separation of woods that have received
copper-containing treatment.
Sewage sludge (2.5 million tonnes of C/D): Replace metal pipework with plastic pipework to
avoid corrosion (reducing heavy metals). Two further measures addressing contaminants in
sewage sludge were proposed but their effectiveness and feasibility seem currently uncertain.
A few measures address industrial waste streams not known to be used in composting/AD. This
includes separation of dyeing and post-dyeing wastes and separation of wastes from different
processes in packaging.
The potential effectiveness of each measure in reducing the risk from contaminants in C/D is difficult to
assess. First, it depends on the effectiveness of reducing the concentration of contaminants in the waste
streams concerned. This is often uncertain because it can depend the starting concentrations in the waste
streams concerned, the technical efficiency of the measure and the uptake (especially measures reliant on
consumer behaviour such as recycling schemes). Second, the effectiveness depends on the share of the
particular waste stream in the input materials used in compost/digestate, which is often not known in any
detail.
141 The measures are attributed to input materials based on the “major source” and “waste type” addressed by each measure (see Table
5.7).

131 © Wood Environment & Infrastructure Solutions UK Limited
February 2019
Doc Ref. 40039CL003i3
Table 5.7 Overview of reduction of prioritised contaminants through specific upstream (i.e. before composting/AD) processes and techniques
Waste type Major sources Potential upstream control Notes
Heavy metals
(several)
Livestock manure, Abattoir
waste, Chemical and
pharmaceutical industry
Feedstuffs Increase bioavailability in
animal diet
With increased bioavailability of copper and zinc in animal diet, then it is likely that
lower amounts are needed in feedstuffs, which would therefore effectively reduce
levels in manure.
Sewage sludge Plumbing corrosion Replace metal pipework with
plastic pipework
Municipal solid waste Batteries Use of Cadmium-free or
Lead-free batteries,
Recycling (e.g. stewardship
incentive schemes)
The use of Cadmium-free batteries is likely to greatly reduce Cadmium in MSW and
these are already available.
Lead mainly comes from batteries for which there are already available schemes for
recycling.
Paper and pulp industry Ink Use of metal-free inks Using metal-free inks would reduce amount of heavy metals in the waste ink
produced by a printer; in the printed materials that are landfilled or incinerated; in
the sludge created during de-inking in paper recycling.
However, it is unclear to what degree paper waste and sludges from this industry
end up in feedstocks for compost/AD and so to what degree they contribute to the
contaminants in compost/digestate.
Food and drinks industry Packaging Separate the wastes from
the different processes.
An effective measure to keep the different contaminants separated in the different
waste streams to avoid cross contamination.
However, it is unclear to what degree packaging waste ends up in feedstocks for
compost/AD and so to what degree they contribute to the contaminants in
compost/digestate.
Nickel (Ni) Drinking water sludge,
Food industry
Unknown - -
Copper (Cu) Wood, bark and other plant
waste
Wood treatment Separate woods according
to treatment received.
Zinc (Zn) Textile industry Dyes, Flameproof
wool
Separate wastes that contain
heavy metals
Separation of dyeing and post-dyeing wastes from the other waste streams
reduces heavy metal contamination of the final waste.
Mercury (Hg) Gypsum Unknown - -
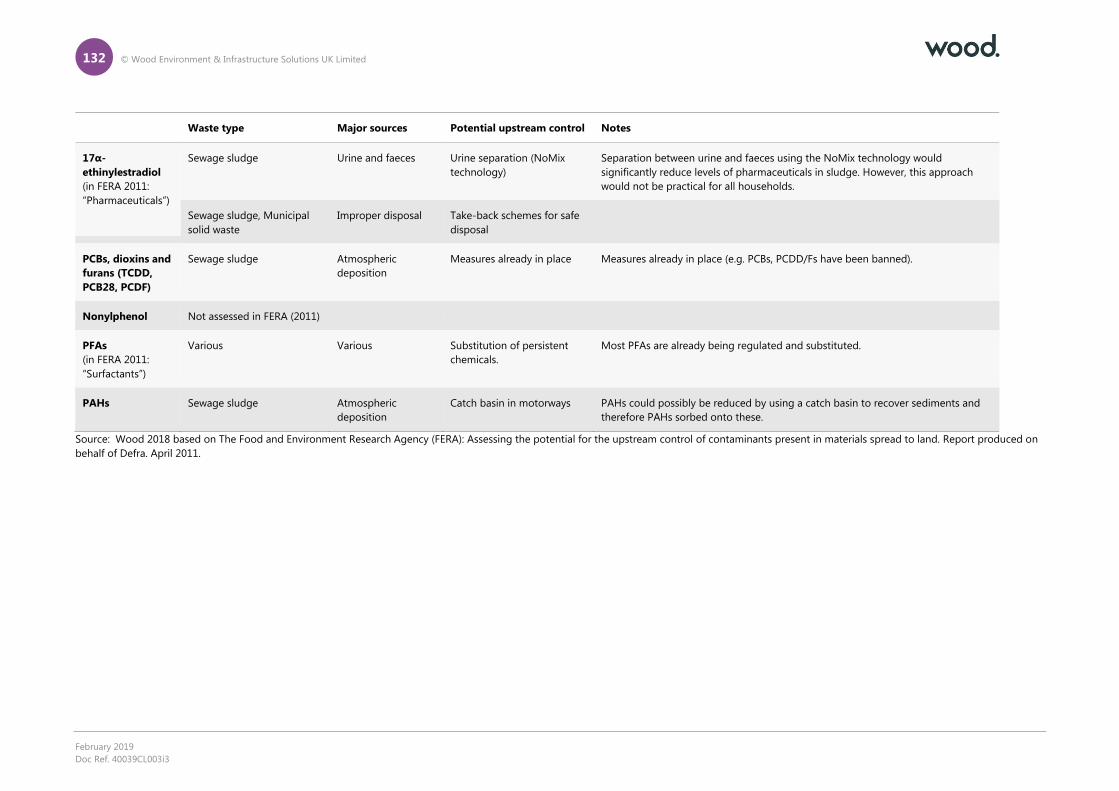
132 © Wood Environment & Infrastructure Solutions UK Limited
February 2019
Doc Ref. 40039CL003i3
Waste type Major sources Potential upstream control Notes
17α-
ethinylestradiol
(in FERA 2011:
“Pharmaceuticals”)
Sewage sludge Urine and faeces Urine separation (NoMix
technology)
Separation between urine and faeces using the NoMix technology would
significantly reduce levels of pharmaceuticals in sludge. However, this approach
would not be practical for all households.
Sewage sludge, Municipal
solid waste
Improper disposal Take-back schemes for safe
disposal
PCBs, dioxins and
furans (TCDD,
PCB28, PCDF)
Sewage sludge Atmospheric
deposition
Measures already in place Measures already in place (e.g. PCBs, PCDD/Fs have been banned).
Nonylphenol Not assessed in FERA (2011)
PFAs
(in FERA 2011:
“Surfactants”)
Various Various Substitution of persistent
chemicals.
Most PFAs are already being regulated and substituted.
PAHs Sewage sludge Atmospheric
deposition
Catch basin in motorways PAHs could possibly be reduced by using a catch basin to recover sediments and
therefore PAHs sorbed onto these.
Source: Wood 2018 based on The Food and Environment Research Agency (FERA): Assessing the potential for the upstream control of contaminants present in materials spread to land. Report produced on
behalf of Defra. April 2011.

133 © Wood Environment & Infrastructure Solutions UK Limited
February 2019
Doc Ref. 40039CL003i3
5.6 Socio-economic considerations
This section covers preliminary socio-economic considerations associated with the potential risk
management options outlined above. As a reminder, these were:
1. Setting concentration limits for the contaminants of concern
2. Reducing the contaminants of concern by eliminating the use of potentially contaminated
input materials in composting/anaerobic digestion (AD).
3. Reducing the exposure to the contaminants through the introduction of further conditions of
use for compost and digestate (C/D).
4. Reduce concentrations by applying specific processes before, during or after composting/AD.
Figure 5.2 shows the main anticipated responses from the supply chains along with associated outcomes.
These are identified based on literature review, the targeted stakeholder consultation under Task 1, and
discussions with the steering group.
Figure 5.2 Response scenarios for all risk management options
Notes: “C/D” stands for compost and/or digestate.
The overall approach follows Guidance on Annex XV for restriction (ECHA 2007). In this alternatives
assessment is a core component which are usually defined as “alternative chemical substances or alternative
techniques (processes and technologies) or combinations thereof that can be used to replace (partially or totally)
the substance of concern in a given use or a number of uses by providing the equivalent function that the
substance delivers in those uses or by making the function redundant” (ECHA 2007). In this case, the
“alternatives” derive from both the expected responses and outcomes identified in the response scenario
above. These largely comprise alternative processes and technologies used to reduce the identified risks.
Therefore, the four aspects described above (technical feasibility, economic feasibility, availability and human
health/environmental risks) are assessed for each of the main outcomes. Table 5.8 summarises the results for
all outcomes in this chapter.

134 © Wood Environment & Infrastructure Solutions UK Limited
February 2019
Doc Ref. 40039CL003i3
Table 5.8 Summary of socio-economic considerations for the main expected outcomes of potential risk management options
Outcome Technical feasibility Economic feasibility Availability Human health/environmental
risks
a. Alternative use for
compost/digestate
Uncertain: There are few alternatives
uses and these are in the early
stages of development.
Production of digestate would likely
continue largely unchanged
regardless of feasibility of
alternative uses.
Uncertain: few alternatives uses for
C/D, in early stages of development.
No significant additional risks
identified.
Largely not feasible for compost:
production of compost that cannot
be used in agriculture/landscaping
would likely be stopped.
b. Compost/digestate must be
disposed of
Technically feasible: primarily
relevant for digestate, most likely
destination incineration or landfill.
Further waste management costs
(e.g. gate fees) for digestate: <€5 to
>€150 per tonne, depending the
Member State as well as transport
costs.
Not relevant for compost
(production would likely cease).
Uncertain: Depending on scope of
regulatory action potential need for
increases in capacity.
Considerable additional risks.
Contrary to environmental policy
objectives.
Environmental benefits of C/D use
may be lost.
c. Reduction of compost/biogas
production
No relevant technical constraints. Income from selling or using
digestate often secondary to AD
operators, so biogas production
would likely continue largely
unchanged.
No relevant constraints. Risks potentially result from
alternative waste management of
input materials (as per f. below)
Reduction of compost production
would result in foregone revenue
from compost sales.
d. Alternative products used Partly feasible: inorganic fertilisers
are a feasible alternative to C/D in
terms of nutrient availability but not
in terms of organic matter.
Likely economically feasible in terms
of nutrient supply.
Likely no availability issue in terms
of nutrient supply.
Several additional environmental
risks identified: Greenhouse gas
emissions, disruption of natural
nutrient cycles, eutrophication
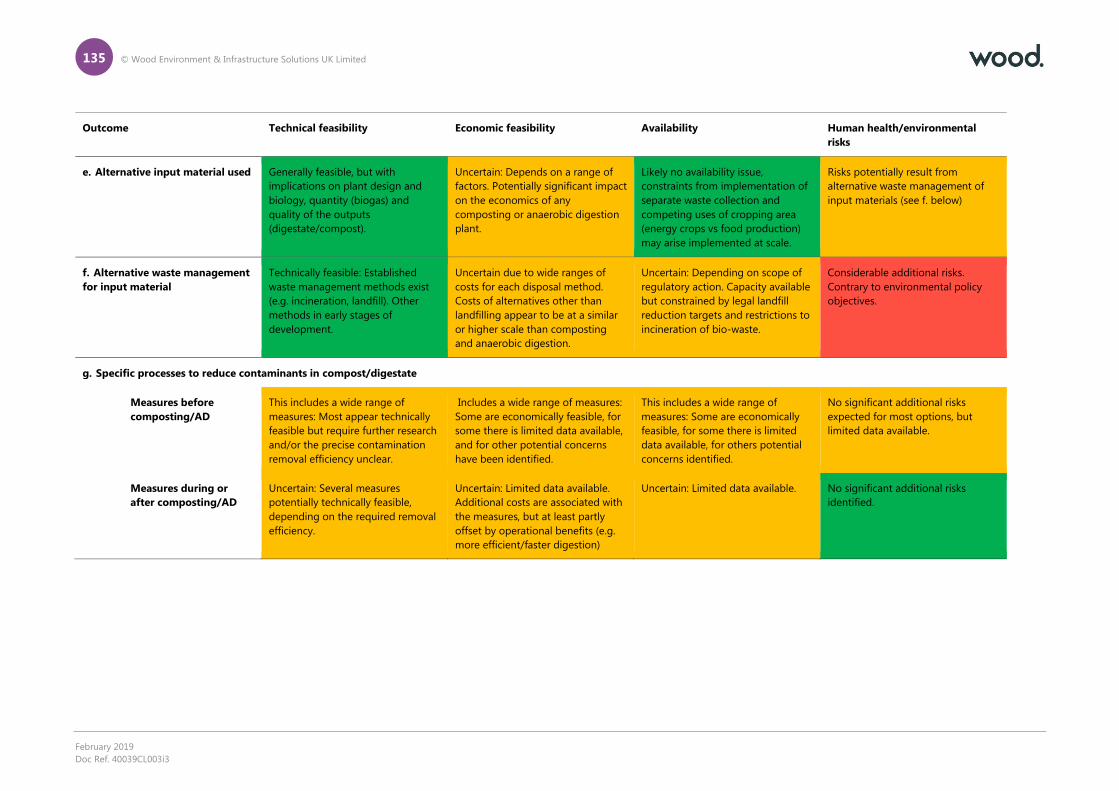
135 © Wood Environment & Infrastructure Solutions UK Limited
February 2019
Doc Ref. 40039CL003i3
Outcome Technical feasibility Economic feasibility Availability Human health/environmental
risks
e. Alternative input material used Generally feasible, but with
implications on plant design and
biology, quantity (biogas) and
quality of the outputs
(digestate/compost).
Uncertain: Depends on a range of
factors. Potentially significant impact
on the economics of any
composting or anaerobic digestion
plant.
Likely no availability issue,
constraints from implementation of
separate waste collection and
competing uses of cropping area
(energy crops vs food production)
may arise implemented at scale.
Risks potentially result from
alternative waste management of
input materials (see f. below)
f. Alternative waste management
for input material
Technically feasible: Established
waste management methods exist
(e.g. incineration, landfill). Other
methods in early stages of
development.
Uncertain due to wide ranges of
costs for each disposal method.
Costs of alternatives other than
landfilling appear to be at a similar
or higher scale than composting
and anaerobic digestion.
Uncertain: Depending on scope of
regulatory action. Capacity available
but constrained by legal landfill
reduction targets and restrictions to
incineration of bio-waste.
Considerable additional risks.
Contrary to environmental policy
objectives.
g. Specific processes to reduce contaminants in compost/digestate
Measures before
composting/AD
This includes a wide range of
measures: Most appear technically
feasible but require further research
and/or the precise contamination
removal efficiency unclear.
Includes a wide range of measures:
Some are economically feasible, for
some there is limited data available,
and for other potential concerns
have been identified.
This includes a wide range of
measures: Some are economically
feasible, for some there is limited
data available, for others potential
concerns identified.
No significant additional risks
expected for most options, but
limited data available.
Measures during or
after composting/AD
Uncertain: Several measures
potentially technically feasible,
depending on the required removal
efficiency.
Uncertain: Limited data available.
Additional costs are associated with
the measures, but at least partly
offset by operational benefits (e.g.
more efficient/faster digestion)
Uncertain: Limited data available. No significant additional risks
identified.

136 © Wood Environment & Infrastructure Solutions UK Limited
February 2019
Doc Ref. 40039CL003i3
5.6.1 a. Alternative use for compost/digestate
Further (as yet undefined) conditions on the use of compost/digestate (Option 2) or specific concentration
limits (Option 1, again undefined) may be introduced to address specific substance concerns. In the event of
either risk management measure, various outcomes are possible: (a.) Downstream users may switch to
alternative uses (i.e. compost/digestate is used in applications where concentration limits or use restrictions
do not apply), this is discussed in this subsection. (b.) There may be an increase in the amount of digestate
that cannot be used and are disposed of as waste (discussed in Section 5.6.2) and (c.) production of compost
/ biogas may reduce (discussed in Section 5.6.3).
Few alternatives uses for C/D other than as soil improvers and fertilisers currently exist. Those that are, are in
early stages of development. Table 5.9 summarises alternative uses for compost.
Table 5.9 Alternative uses for compost
Use Description
Covering landfills/construction In personal communication the ECN suggested as alternative use in the worst case
compost could be used for covering landfills or in construction. For example, while the
Irish Environmental Protection Agency highlights how covering landfills is a potential
use for compost, it is also noted that compost can have methane and odour oxidative
properties and promote vegetation growth, and requires regular testing if it is used as a
daily cover, as opposed to an intermediate cover. This is to check permeability and
biostability as under particular conditions stockpiles of combustible matter can self-
combust due to gas generation (EPA 2014). Hence, landfill cover is not the best
alternative use – especially for high-quality compost – but it is feasible, subject to
regular checks.
Construction of artificial wetlands The construction of artificial wetlands can reduce erosion and sediment run-off.
Compost has the potential to be used as a substrate for construction of such wetlands
due to its organic matter content, permeability and ability to hold contaminants (EPA
1995).
Rehabilitation/restoration of mining
sites with low quality C/D materials
Ecological restoration and mine reclamation have become important parts of the overall
sustainable development strategy in many countries. Surface mining can cause soil
quality deterioration in terms of biological, physical, and chemical properties. Hence, an
alternative use for low-quality C/D materials is their application on damaged soil as part
of the soil restoration process during remediation (Sheoran et al., 2010) (Borišev et al.,
2018). For example, composted MSW has been used in the restoration is limestone
quarries in Mediterranean environments (Almendro-Candel et al., 2014).
According to a WRAP report (2011) on markets for digestate, uses identified include: home garden fertiliser
and soil amendment products; landscaping; commercial fruit and vegetable production; compost tea
production; mushroom growing media; commercial nurseries; fertiliser for organic crops and farms; forestry;
publicly owned flower beds/green spaces. Alternative uses for digestate identified by WRAP include:
algal culture;
construction materials;
fuel production; and
biopesticides production.
As highlighted in Appendix B, digestate can also be further processed by drying. The end product can be
used as animal bedding and biomass for green energy as well as organic fertiliser. However, according to the
European Biogas Association, digestate drying is a questionable process due to the high consumption of
heat. Furthermore, during the drying process, if there is no effective air scrubbing in place, ammonium gets

137 © Wood Environment & Infrastructure Solutions UK Limited
February 2019
Doc Ref. 40039CL003i3
released into the air (EBA 2013). The report highlighted that as of 2011 technical limitations will constrain
potential future demand. No further evidence was found to indicate that these alternative uses for C/D have
since become established on the market. This feeds into their economic feasibility as it is possible that they
are still in embryonic stages of development (WRAP 2011). Table 5.10 summaries each alternative use for
digestate in turn.
Table 5.10 Alternative uses for digestate
Use Description
Algal culture This is a method for extracting nutrients from organic wastes via the cultivation of engineered algae
ponds. This method could be used to develop algal biomass from digestate to feed biofuel
production. WRAP highlighted that the Carbon Trust is researching the feasibility of increasing the
yield of oil from different species of algae, and how to reduce costs associated with its harvesting.
The harvested algae/macrophytes can be used as feedstock for biofuels, animal feed or as an organic
fertiliser. However, it is predicted that the breakthrough of algae in the bio-based economy will take
another 5–15 years, due to high costs compared to other types of biomass (Vaneeckhaute et al.,
2018).
Construction materials Dried fibres of anaerobically digestate animal manure can be blended with UF resin and pressed into
wooden panels. However, this has not yet been implemented at a large scale because certain design
elements still need to be tested (i.e. adherence of paint).
Fuel Bioethanol is an alternative to petrol which is produced by sugar formation. It has previously been
assumed that digestate fibre was unsuitable for processing into bioethanol. However, it has been
demonstrated that AD changes the composition of manure fibres – improving suitability for the
production of ethanol. For example, it was estimated that for every dry tonne of manure, 0.6 tonnes
of digestate fibre could be produced which could be processed to produce 6.3m3 ethanol. As of 2011
this technology was not yet available on a commercial scale, and according to the market analysis
(see Section 2), this is still not a common use of digestate. Given the developments required for
alternative fuel sources due to the effects of climate change, further investment in the development
of this technology is likely and could make it feasible in the future.
Biopesticides Due to the difficulties associated with the availability of raw materials for conventional biopesticide
production (i.e. soybean meal, soluble starch etc.) there may be potential for production of
biopesticides from AD food and farm waste. However, the composition of digestate feedstock may
have varying impacts on the effects of biopesticides on insects and detailed investigation into this
topic is still required in order to conclude whether or not it is a viable alternative use for digestate.
Overall conclusion
While the uses mentioned above are potential alternatives for digestate, they are still in the early stages of
development and require further investigation for further comment on their feasibility. According to personal
communication with anaerobic digestion operators, the business model of the majority of installations is
primarily based on biogas production or gate fees, rather than on income from selling or using digestate. The
production of digestate would therefore potentially continue largely unchanged regardless of whether
alternative uses are feasible.
The alternative use of compost in the construction of artificial wetlands, while viable, is a niche use and
unlikely to require large amounts that are currently being produced. Compost also has some potential to be
used as a landfill cover (preferably as an intermediate cover) but this is a low value application unlikely to
require vast amounts being produced and, is not the best use for high-quality compost. Contrary to
anaerobic digestion operators, the business model of composting operators is relying on income from selling
compost. According to personal communication with the European Compost Network, the production of
compost that cannot be used in agriculture/landscaping anymore would therefore likely be stopped.

138 © Wood Environment & Infrastructure Solutions UK Limited
February 2019
Doc Ref. 40039CL003i3
5.6.2 b. Compost/digestate must be disposed of
As discussed above, (as yet undefined) conditions on the use of compost/digestate (Option 2) or the
imposition of specific concentration limits (Option 1, again undefined) could lead to various outcomes. This
sub-section discusses the hypothetical case where risk management leads to an increase in the amount of
digestate that cannot be used and would therefore be disposed of as waste.
Technical feasibility
If compost can no longer be used as a fertiliser/soil improver, it is likely that compost would simply not be
produced, or at least produced in sustainably smaller volumes.142 So, an initial effect is likely to be increased
volumes of input materials being disposed of as waste (unless viable alternative uses are found), rather than
increased volumes of compost per se. The potential disposal routes for these input materials are discussed in
Section 5.6.6. In addition, depending the scope and phasing of any restriction or condition, there would be a
short-term increase in disposal of existing stocks of compost. Given the size of current market in the EU
(central estimate of 17.3 million tonnes per year), depending on the specific concentration limits or use
restriction this could amount up to several million tonnes of increased waste disposal need, per year.
The same logic does not apply to digestate, because the business model of the majority of anaerobic
digestion installations is primarily based on biogas production or gate fees, rather than on income from
selling or using digestate.143 So, a rationale for continued production of digestate in large volumes would
remain. Current production is large (with a central estimate of 180 million tonnes per year across the EU 28).
According to personal communication with the European Biogas Association and with a large anaerobic
digestion operator, if no use for digestate is available it will most likely be incinerated or landfilled,
depending on capacities of each Member State (this is discussed further in Table 5.11). Anecdotal
information from the same source indicates only a very small proportion of digestate is currently incinerated
in Europe. According to WRAP (2012) incineration may be the only available disposal option for digestate
which cannot be applied to land due to non-compliance with legislation (WRAP 2012). JRC (2014) reported
that in the Netherlands, digestate that does not meet the requirements for use as fertiliser is partially
incinerated and partially landfilled.
Overall there is no inherent technical constraint in disposing of both compost (input materials) and digestate
as waste, provided that moisture content is reduced/low. The most likely destination is incineration and
where this is not feasible, landfill.
Table 5.11 Overview of likely waste management options and technical implications
Treatment Notes on technical feasibility
Landfill There is no inherent technical constraint to landfilling of digestate, except that the Landfill Directive specifies liquid
waste shall not be accepted to landfill. The digestate may therefore have to be dried or the liquid fraction separated
beforehand. Landfill is seen as the “final resort” in the waste management hierarchy and is contrary to various
policy/regulatory targets. The revised Waste Framework Directive sets new common EU targets for recycling of
municipal waste of 55% by 2025, 60% by 2030 and 65% by 2035 (Directive 2008/98/EC). Digested municipal
biodegradable waste may only be counted as recycled if the resulting digestate is to be used as a recycled product,
so landfilled digestate does not count towards these targets. The revised Landfill Directive sets a binding landfill
reduction target of 10% by 2035 (Directive 2018/850).
Incineration Digestate has to be dewatered prior to incineration in order to reduce the moisture content, potentially requiring
additional fuel/energy input to dry the digestate. Co-incineration with municipal solid waste may provide a means of
increasing the heating value. The volume of additional fuel required to initiate and sustain combustion, and whether
energy recovery from the process is possible both depend on the calorific value of the digestate, moisture content
and the efficiency of the incinerator.
142 This was confirmed by personal communication with the European Compost Network. 143 According to personal communication with anaerobic digestion operators.

139 © Wood Environment & Infrastructure Solutions UK Limited
February 2019
Doc Ref. 40039CL003i3
Economic feasibility
This section examines the economic feasibility of compost/digestate being disposed of as waste. This
involves a brief exploration of the market characteristics of both to help determine the most likely course of
action and hence the main socio-economic effects.
Composting
Table 5.12 shows that the transport and production costs of compost at least on average typically exceed its
market price. On this basis, a likely outcome would be a substantial reduction in the production of compost
in Europe and an associated increase in disposal of the input materials. There would be a corresponding loss
of economic activity of the compost distributer/application business. Although there is no data on the size of
this sector, the nature of the market described above suggests it would be comparatively small.
Table 5.12 Market characteristics of composting
Market aspect Explanation
Transportation cost JRC (2014) notes that generally compost plants serve a local market, supplying their product within 50 km
of the plant144. This is the equivalent distance a 25 tonnes capacity lorry can make within an hour, at a cost
of EUR 50–60. They note that transport costs and the other marketing expenses are generally covered by
end compost prices of around EUR 5/tonne (EUR 125/lorry load).
Production cost Production cost of composting depend on local conditions and the quality of the material to be
composted. For example,
- Estimated costs of composting source-separated biological waste is c. EUR 35–60/tonne of waste
for larger ‘best practice’ plants in closed systems, although higher costs are noted.
- The cost of low-tech windrow composting is estimated to be lower than EUR 20/tonne.
Market prices Prices for bulk compost for use as organic fertilisers or soil improvers are lower than the production costs.
Prices of composts for agricultural were rarely above EUR 5/tonne of compost, often lower or given away to
farmers free of charge. A typical model used in Germany is that compost is given as part of a service that
includes transport and spreading of the compost itself on land (JRC, 2014). This is broadly consistent with
more recent estimates from the UK, indicating transportation costs of between £2-3 for solid organic
materials, with spreading costs of between £2 and 4 per tonne (or m3), depending the vehicle type and
load size (WRAP 2016).
Digestate
Table 5.13 summarises market aspects of anaerobic digestion. Overall it appears likely that if concentration
limits / conditions of use were applied, additional volumes of digestate would be disposed of as waste. This
would incur further waste management costs (e.g. gate fees), which range from <5 Euros per tonne to >150,
depending the Member State as well as transport costs (European Environment Agency 2013). These
additional costs may mean some reduction in the market size as well as a possible slowdown in the growth of
the sector but appears less likely to make biogas production economically infeasible. For agricultural end
users, this would also be compounded by potential losses in crop yield.
144 JRC also note specific cases in Germany where compost is being transported over longer distances of c.200 km.

140 © Wood Environment & Infrastructure Solutions UK Limited
February 2019
Doc Ref. 40039CL003i3
Table 5.13 Market characteristics of anaerobic digestion
Market aspect Explanation
Production cost JRC (2014) notes (based on discussion with the European Biogas Association), that production costs range
from 10 to 30 Euro per tonne for bio-waste treatment through anaerobic digestion. This value excludes the
investment costs necessary to for start-up and costs are sensitive to technology used as well as input
materials. Gate fees also vary, which reflect differences in regulation and the energy content of the
feedstock. In some cases, they note anaerobic digestion operators actually pay for the input materials.
Market prices JRC note that sales price for digestate are generally slightly lower than for compost. Often this aspect of
operation runs at a loss, with average maximum price of 3 to 5 Euro/tonne for whole digestate. The
digestion plants commonly pay companies or farmers for land spreading. In specific cases (solid and post-
composted digestates) sales prices reach closer 10 Euro per tonne with some dry pelletized digestates
reach prices of up to 150-250 Euro per tonne. Sales prices of dried digestate range from 5 - 30 € per tonne
and wet digestates between 0 to 8 Euro/tonne. Composted digestates generate prices of 0 to 50 Euro per
tonne. The wide range reflects differences in local demand; regions with a higher manure supply tend to
reflect lower digestate prices.
This is broadly consistent with more recent estimates from the UK WRAP, indicating transportation costs of
between £3 and- 4 for liquid organic materials (whole, liquid or separated liquor digestate) and £2-3 for
solid (e.g. separated fibre digestate), with spreading costs of between £3 – 4.50 per tonne (or m3),
depending the vehicle type and load size (WRAP 2016).
Biogas production There are no publicly available data on the economic impact of the European biogas sector, but the
European Biogas Association (EBA) statistical report 2017 indicate capacity of around 18,000 plants with
strong expansion between 2009 and 2014 in particular. Installed electric capacity stood at 9,985 MW in
2016.
Availability
There are both environmental, economic and technical limits to waste management capacity. In terms of
landfill, there has been a 59% decrease in the volume of European waste sent to landfill between 1995 and
2016. The latest 2016 data indicates some 60 million tonnes of municipal waste was sent to landfill across the
EU28 (Eurostat 2018a).
Eurostat collate data on incineration activity across Europe in line with the Waste Statistics Regulation and
the Waste Framework Directive (Eurostat 2018b). Current European incineration capacity is greatest in
Germany, France, Netherlands and the Nordic countries. As of 2016 European incineration capacity (total
waste, both hazardous and non-hazardous), stood at some 80.8 million tonnes, up from 71.6 million in 2004,
an increase of 13%. Given the 180 million tonnes of digestate produced in Europe at present, even a small
increase in the amount of waste dealt with via incineration, say 5%, would imply an increase in demand of
10%, hence a potential need for increases in capacity.
Human health and environmental risks
An increase in C/D waste would be contrary to the package of waste regulation and risk management
progressively adopted in the EU over the last 20 years. The Landfill Directive 1999/31/EC set out various
targets to reduce the amount of biodegradable waste that goes to landfill and reaffirmed that landfilling is
the least preferable option, to be limited to the necessary minimum. More generally it requires Member
States set up national strategies for the reduction of biodegradable waste going to landfill (European
Commission 2016b). The Directive 200/98/EC on waste (Waste Framework Directive) further established the
waste hierarchy, with disposal the least preferable, alongside various waste management principles to avoid
harm to human health and the environment, further legislation involves landfilling and incineration
specifically as well as the shipment of waste (European Commission 2016c, European Commission 2017).
More recently the 7th Environmental Action Plan (7th EAP) aims to reduced waste, limiting both incineration
and landfilling to non-recyclable/non-recoverable waste alongside the 2018 waste package (European
Commission 2018d).

141 © Wood Environment & Infrastructure Solutions UK Limited
February 2019
Doc Ref. 40039CL003i3
Unless satisfactory alternatives are used, the environmental benefits of both composting and digestate use
may be lost. These include increases in soil organic matter, erosion reduction, increased water retention and
physical structure of soil (aggregate stability, density, pore size).
5.6.3 c. Reduction of compost/biogas production
As discussed above, (as yet undefined) conditions on the use of compost/digestate (Option 2) or the
imposition of specific concentration limits (Option 1, again undefined) could lead to various outcomes. A
potential reduction in the production of compost/digestate is discussed in this sub-section.
As discussed above, the business model of most anaerobic digestion operators is primarily based on biogas
production or gate fees, rather than on income from selling or using digestate.145 The production of biogas
would therefore potentially continue largely unchanged, so the discussion below focuses on compost only.
A reduction of compost production would imply that likely (d.) alternative products must be used to replace
it (discussed in Section 5.6.4), and the use of input materials for composting would also be reduced and so
(f.) alternative waste management practices would have to be used for these input materials (discussed in
Section 5.6.6). However, in addition to these outcomes, a reduction of compost production would result in
foregone revenue from compost sales.
The total revenue foregone to composters would depend on the mass of compost production that is
stopped, as well as the price of the affected types of compost. According to JRC (2014), typical prices of
compost for farmers are up to €5 per tonne, often including transport and spreading. However, higher prices
have been reported in some countries for compost made from certain input materials such as pure garden
and park waste, particularly when sold in smaller bags to hobby gardeners, potentially reaching €10-300/t.
5.6.4 d. Alternative products used
Further (as yet undefined) conditions on the use of compost/digestate (Option 2) or the imposition of
specific concentration limits (Option 1, again undefined) could lead to a reduction in certain uses of
compost/digestate. A (again as yet undefined) restriction on input materials for composting and anaerobic
digestion (Option 3) could have a similar effect, if these input materials cannot be adequately replaced, e.g.
for reasons of technical or economic feasibility or availability.
According to the market analysis, the vast majority146 of the c. 180 million tonnes of digestate produced in
the EU is used as a fertiliser. The majority (ca. 85%) of compost is used as a fertiliser or soil improver in
agriculture, gardening, horticulture and landscaping. This corresponds to something in the order of 15
million tonnes of compost.147 If certain uses of certain composts and digestates are restricted through risk
management their users (predominantly farmers) need to replace them with alternative products (notably
fertilisers), or face losses in crop yields due to a lack of nutrients. The share of C/D affected strongly depends
on the specifications of the risk management and can therefore not easily be quantified before a specific
combination of risk management is chosen. Therefore, in the following the main general implications of
replacing C/D with alternative fertilisers are discussed.
Technical feasibility
Digestate and compost are examples of organic fertilisers. Inorganic/synthetic fertilisers include complex N
and P-fertilisers, simple mineral fertilisers (urea, ammonium nitrate, sulphate) and mineral-organic fertilisers
(calcium cyanamid) (Eurostat 2015a). Fertilisation modifies soil properties (including pH, organic matter
145 According to personal communication with anaerobic digestion operators. 146 For instance, JRC (2014) suggests 95%. 147 The central estimate of total compost produced in the EU (17.3 million tonnes) multiplied by 85%.

142 © Wood Environment & Infrastructure Solutions UK Limited
February 2019
Doc Ref. 40039CL003i3
content, soil richness, and nutrients availability). Organic fertilisers modify these qualities differently to
inorganic fertilisers.
In terms of nutrient availability, inorganic fertilisers are a feasible alternative to C/D, as the latter have been
shown to yield variable nutrient availability148. However, repeated use of compost may increase overall
organic matter content and water retention in the soil which improves its workability149. It has also been
shown to enhance environmental qualities such as biodiversity, which enhances the soil’s resilience to
stress.150 Therefore, while the nutrient availability may vary depending on type of organic fertiliser and soil
type, inorganic biodiversity and soil health can be improved over time due to organic matter content.
The nutrient composition of digestate can vary dependent on the feedstock and treatment (i.e. food-based
digestates generally have higher nutrients than crop/manure based) (AHDB 2017). Inorganic fertilisers with
well-defined nutrient concentrations may be technically preferable to farmers, as decisions related to the
type/amount of nutrients applied to crops is calculated at farm level, based on the cost of fertilising products
and the efficiency of nutrients in terms of yield (European Commission 2012). Due to the variation in
nutrients between digestate producers, users are advised to analyse the digestate themselves, or to contact a
qualified advisor/agricultural consultant (for instance, FACTS members in the UK)151 to conduct nutrient
management planning, (which may have extra costs. Integrating this kind of analysis into farm nutrient
management planning would further maximise the potential of digestate to be used by farmers. According to
WRAP, the available data needs to be updated to advise farmers on how to best apply digestate to crops
(WRAP 2012).
Inorganic fertilisation – especially N fertilisers – contributes towards reducing the soil’s pH, which enhances
the mobility of micronutrients such as Cu, Fe, Mn and Zn while also adding available nutrients directly to the
soil. However, conventional inorganic fertilisers – which currently supply most of Europe’s soil nutrients - do
not supplement organic matter content. Furthermore, simple N fertilisers and P fertilisers only add that single
nutrient to the soil while organic fertilisers have variable concentrations of nutrients but also contain organic
matter, an important component of healthy soil (European Commission 2012).
Given the lack of available guidelines, training and variable nutrients, it is highly likely that that conventional
inorganic fertilisers may be technically preferable to farmers. Inorganic fertilisers are already commonly used,
they are a technically feasible alternative to digestate and compost, but at an environmental cost (See
Human health and environmental risks). Despite the high nutrient availability of inorganic fertilisers, they
cannot act as substitutes for C/D in terms of organic matter.
Economic feasibility
As discussed above, compost, digestate and synthetic fertilisers contain different combinations of nutrients
and other materials that benefit the soil. Therefore, these products are not ono-to-one replacements. To
assess the economic feasibility of alternatives, this section first compares prices of compost/digestate with
conventional fertilisers and then puts this into context of their implications for crop yields.
148 Digestate contains significantly more readily available nutrients than compost but this depends on how much is lost as ammonia
emissions and leaching both of which can which can be reduced by the use of precision applicators during spreading and the time of
year spreading occurs. Due to the highly available rates of N, digestate is also subject to no-spreading periods e.g. within Nitrate
Vulnerable Zones (Eurostat 2015a). 149 For example, the available field data indicate that compost contains little available N, yet its repeated use can increase organic matter
content and water retention in the soil which generally improves workability. According to WRAP, little data has been gathered on
phosphate availability from compost, but extrapolation from livestock manure and sludge suggests that ca 50% of phosphate applied is
available (AHDB 2017). 150 For example, a study conducted by Liu et al. (2016) evaluated the effects of fertiliser on soil nematode communities in croplands from
over 229 data points across 54 studies. The results showed that nematode abundance increased with C input, while greater N application
reduced species richness. Species richness was found to increase in organically-fertilised regimes, and decline in inorganically fertilised
regimes. 151 FACTS is a body for standard setting and training in crop nutrition, established in 1993. http://www.factsinfo.org.uk/facts/home.eb

143 © Wood Environment & Infrastructure Solutions UK Limited
February 2019
Doc Ref. 40039CL003i3
Market prices
The data available is patchy, but Table 5.14 presents a summary of indicative values for the sales price/t of
compost, digestate and examples of synthetic fertilisers used in Europe. Note that market prices for C/D are
discussed in Section 5.6.2, Table 5.12 (compost) and Table 5.13 (digestate).
The latest data on sales price of synthetic fertilisers available from Eurostat is very patchy between MS and
shows high variability. For example, for sulphate of ammonia, the price in Bulgaria is recorded at €1170/t,
while in Czech Republic it is recorded at €170/t. Hence, the prices presented below should be taken only as
indicative values.
Table 5.14 Summary of indicative sales price data on compost, digestate and synthetic fertilisers
Type of fertiliser Indicative unit cost (€/t)
Compost 0-5
Digestate (whole) 3-5
Synthetic fertilisers
*Sulphate of ammonia
599
*Ammonium nitrate (26% N in bulk) 493
*Urea 583
*Superphosphate (18% P2O5) 677
*Sulphate of potash 772
*Ternary fertiliser 9-9-18 (NPK ratio) 310
*Binary fertilizer 0-20-20 (NPK ratio) 328
Source: *Denotes Eurostat 2017 data, based on average €/100kg of synthetic fertilisers across all MS converted to €/t. Compost and
digestate indicative figures: JRC (2014)
Implications for crop yield
While the data on sales price highlights that synthetic fertilisers are significantly more expensive than
compost or digestate when unit cost is considered, the effects of fertiliser on crop yield is likely to have more
control on whether alternatives to digestate and compost are economically feasible or not. Hence, value-cost
ratio (VCR) or net return from fertiliser, is, according to the FAO, a key determinant regarding fertiliser use
(FAO 2006). Given the fact that the availability of nutrients and organic matter to soil also depends on local
conditions (i.e. climate, terrain, soil type) (FAO 2006) the economic feasibility of using alternatives to
digestate and compost will likely be different between EU Member States. Furthermore, survey data from
Case et al. (2016) for 448 Danish farmers highlighted that uncertainty regarding nutrient content was a key
barrier to using organic fertilisers including digestate and compost, and can therefore be interpreted as a
motivation to using of synthetic fertilisers (Case et al. 2016).
Considering vegetation growth depends on the availability of nutrients, and nutrients availability is
significantly more variable in digestate/compost than it is in synthetic fertilisers, it is likely that in terms of
ensuring value-cost ratio/net return from fertiliser use, synthetic fertilisers may be more feasible for farmers.
Therefore, despite the lower sales price of compost and digestate, there are possible trade-offs regarding net
returns from fertiliser in terms of crop yield. As a result, when focusing on the provision of nutrients it seems
likely that it is economically feasible to use synthetic fertilisers as an alternative to composts or digestates

144 © Wood Environment & Infrastructure Solutions UK Limited
February 2019
Doc Ref. 40039CL003i3
Availability
Considering synthetic fertiliser as the main alternative to replace nutrient supply from compost/digestate, the
synthetic fertiliser sector is a mature industry within Europe, which currently supports the majority of Europe’s
nutrient needs. For example, according to Eurostat N-based fertilisers accounted for the vast majority (77.4
%) of the nutrients consumed (Eurostat 2015b). Fluctuations in consumption have occurred (i.e. a dip in
fertilizer use over 2009-10), which is attributed to price increases associated with the link between N
fertilizers and oil prices. While the Nitrates Directive and the Water Framework Directive led to reductions in
specific Member States (i.e. Croatia, Italy and Greece), overall, total N fertiliser consumption remains high in
the EU (Eurostat 2018c). It should be noted that, given the environmental risks and high transport costs
associated with synthetic fertilisers (See section below on Human health and environmental risks), the
Commission are currently taking steps to revise EU regulation on fertilisers to promote the circulation of
recycled nutrients (i.e. in digestate and compost) by developing quality standards to reduce the need for
mineral-based synthetic fertilisers (European Commission 2015).
Given the fact that synthetic fertilisers already provide the majority of nutrients to European soils despite the
high availability of digestate and compost being produced in the EU, a loss of a part of digestate/compost
would not be likely to affect Europe’s nutrient supply. However, if more policy measures are put in place to
promote recycled nutrients as part of the Circular Economy strategy, the importance of digestate/compost to
Europe’s nutrient supply will likely increase.
Human health and environmental risks
Nutrients are essential for all forms of life and nutrients such as N and P are a principal component of
fertilisers which are applied to agricultural land. However, there are a range of environmental and health risks
associated with such fertilisers which are summarised in Table 5.15. This suggests if compost or digestate
were to be replaced with synthetic alternatives, eutrophication and environmental risks associated with P and
N fertilisers would likely become more prevalent. Whilst there are concerns regarding cadmium content of P
fertilisers, it is not yet possible to provide a conclusive answer as to whether this is an additional risk to the
use of digestate or compost, as quality standards are still being developed as a means of minimising health
risks associated with their use.
Table 5.15 Summary of health and environmental risks associated with alternatives to compost/digestate
Risk Explanation
Health risks
Cadmium in P fertilisers and the associated effects on human health have been
identified as a potential risk within the EU (SCAHT 2015). Several Cd compounds
have also been identified as SVHC under REACH and included in the candidate list
for authorisation (ECHA 2018d). 90% of P fertilisers are imported from third
countries (e.g. Morocco, Tunisia). The cadmium content in P rock can vary
depending on where it is mined, potentially making its way into soils, foodstuffs and
lead to long term adverse health and environmental effects (EPRS 2017).
Environmental risks
Climate change
It has been estimated that in Europe for every ton of mineral fertiliser that gets
produced, an average 9.7 tons of CO2 eq is emitted (EBA 2015). Hence, the use of
mineral fertiliser contributes to the overall risks associated with climate change and
fossil fuel emissions as its production is energy intensive. For example, it has been
estimated that 2% global energy production gets used to produce inorganic N
fertilisers alone. The physical application of N fertiliser to land also releases N-
emissions into the atmosphere which can also contribute to acidification and
climate change (Eurostat 2018c).

145 © Wood Environment & Infrastructure Solutions UK Limited
February 2019
Doc Ref. 40039CL003i3
Risk Explanation
Disruption of natural nutrient cycles Disruption of natural nutrient cycles is another environmental risk associated with
the use of mineral fertilisers. For example, phosphorous is an example of a
commodity which moves linearly from mines, travelling large distances where it is
applied to crops as fertiliser, where a large amount may be lost to surface waters, or
it may become inactive due to over application and is thus not fully taken up by the
crops it is applied to (Schröder et al., 2011). For example, it has been estimated that
only between 15-30% of P fertiliser that is applied gets taken up by crops – the rest
may end up in the aquatic environment when soil is saturated by phosphorus,
where it can contribute to eutrophication and algal blooms (in addition to N)
(Weber et al. 2014). In Europe, mineral fertilisers and manure accounted for 93% of
the P input to the environment (Eurostat 2018d).
Eutrophication Regarding N, before the development of the Haber-Bosch process in the 19th
century, the only natural means of forming reactive nitrogen (Nr) from N2 was by
lightning and biological N fixation (BNF) of certain bacteria. This was balanced by
the natural cycle of conversion of Nr back to N2 which ensured Nr did not naturally
accumulate in the environment. Today, since the development of N-fertilisers via
the Haber-Bosch process, biologically available nitrogen has dramatically increased
due to increased food demands of a rapidly growing population and as such,
majorly contributed to Nr accumulating in lakes, rivers and seas all over the world
(Galloway et al. 2014). Excessive N fertiliser application gets lost to water and
overstimulates production of algae and contributes to eutrophication in the aquatic
environment. For example, according to the impact assessment for CE marked
fertilisers, leaks of N and P from human activities have negatively affected European
surface waters via eutrophication and led to the development of anoxic zones in
coastal zones.152
5.6.5 e. Alternative input material used
Further (as yet undefined) restrictions on input materials for composting and anaerobic digestion (Option 3)
could lead to replacement of the restricted inputs with other materials. Furthermore, the imposition of
specific (as yet undefined) concentration limits (Option 1) could have a similar effect, if the concentration
limits cannot be met in particular by compost or digestate from specific input materials.
Technical feasibility
Almost any biodegradable organic material can be treated by anaerobic digestion/composting. Anaerobic
digestion/composting plants are currently treating a wide range of material including various kinds of
organic wastes, manures, crops and other plants (see market analysis in Section 2). Therefore, in principle the
substitution of one input material with another (biodegradable organic) material is technically feasible.
However, the composition of input materials has significant implications on the plant design and digester
biology, as well as the quantity (biogas) and quality (digestate/compost) of the outputs. These are discussed
in Table 5.16.
Table 5.16 Main implications of input material choice for anaerobic digestion and composting plants
Market aspect Explanation
Plant design and
digestion biology
Each type of input material will require an appropriate pre-treatment process to transform the materials
into a suitable form for digestion/composting. Depending on the chemical composition of the input
material, the microbes responsible for the digestion process may need to be supplemented with trace
elements, particularly selenium, cobalt, nickel and iron to perform at a peak level. But excessive
concentrations of some elements and common compounds can inhibit or kill the microbes, so inputs must
152 Circular Economy Package: Impact Assessment (2016) Proposal for laying down rules on the making available on the market of CE
marked fertilising products and amending Regulation no 1069/2009 and No 1107/2009.

146 © Wood Environment & Infrastructure Solutions UK Limited
February 2019
Doc Ref. 40039CL003i3
Market aspect Explanation
be carefully planned and monitored. Hence, it is theoretically and practically possible for any plant to switch
to any other commonly used input material, but each type of input material can bring different challenges
(preparing material for digester feeding and impact on digester performance (biogas production).
Biogas yield (applies
only to AD)
The energy content stems from methane, which accounts for about 50-75% of the volume of biogas.
Different input materials yield different amounts of methane and hence biogas in anaerobic digestion,
depending on their content of proteins, fats, and carbohydrates (Lemvig Biogas 2008). Therefore, to
achieve the same amount of biogas with an alternative input material may require larger/smaller quantities
of material, depending on the biogas yield of the different materials. Biogas yield in m3 per tonne of fresh
feedstock is provided for some typical feedstocks below:153
- Livestock manure and slurries: Ranges between 15-100 m3/tonne for different animals
- Organic waste: This can vary widely depending on the composition of the waste, but 100
m3/tonne is reported as a typical value.
- Plant waste: from around 80 (beets), to around 200 (silage) and up to 500 (grass, leaves)
m3/tonne
- Energy crops: From around 300 to over 600 m3/tonne
Digestate/compost
quality
Similarly, the quality of the resulting digestate or compost for agriculture depends on the input materials
used. Table 5.17 provides and overview of nutrient value in digestate from a few different input materials,
for illustration. Furthermore, the nutrient availability (the share of nutrients that are in chemical forms
accessible to plant roots, an important factor in plant growth) varies across different input materials used.
For instance, 80% of the total nitrogen is present as readily available nitrogen in food-based digestate,
whereas the figure is lower in digestate from livestock slurries (around 50% for cattle slurry digestate and
70% for pig-slurry digestate).154
Table 5.17 Examples of the nutrient content (kg/m3 fresh weight) of some input materials commonly used
in anaerobic digestion
Input material Total N NH4-N Total P Total K
Grass silage 3.5-6.9 6.9-19.8 0.4-0.8 –
Maize silage 1.1-2 0.15-0.3 0.2-0.3 4.2
Dairy waste 1.0 0.1 0.4 0.2
Food leftovers 0.8-3 2-4 0.7 Value not available
Source: Lukehurst et al. (2010). Utilisation of digestate from biogas plants as biofertiliser. IEA Bioenergy Task 37. Available at:
http://www.centri-force.co.uk/wp-content/uploads/2014/07/Utilisation-of-Digestate-as-Biofertiliser-V2.0.pdf
Economic feasibility
As discussed above, using alternative input materials can affect the quantity of biogas produced per tonne of
input material. Alternatively, the plant can adjust the quantity of input material to produce the same amount
of biogas. In any case, this has an impact on the economic viability of the plant, because it can affect either
the income through the sale or use of biogas (which is the main source of income in most cases) or the costs.
The change in costs would depend on the relative prices of different input materials. Table 5.18 gives
examples of values of different input materials in the UK in 2010 (values have been converted to € in 2017
153 A more detailed list can be found in the sources for these figures: Lemvig Biogas 2008 Handbook and NNFCC anaerobic digestion
information portal (http://www.biogas-info.co.uk/about/feedstocks/) 154 WRAP (2012): Using quality anaerobic digestate to benefit crops. The source provides nitrogen availability in pig and cattle slurry and
notes that digestion of livestock slurry will typically increase availability of the nitrogen in the slurry by around 10%. This yields the
figures of 50% for cattle slurry digestate and 70% for pig-slurry digestate reported here.

147 © Wood Environment & Infrastructure Solutions UK Limited
February 2019
Doc Ref. 40039CL003i3
prices). These are ‘opportunity cost’ values, i.e. what the product could be sold for on the open market or
transferred into another farm enterprise (such as dairy), which can be different from the ‘cost of production’
of the input materials. The values are for illustration only, as in reality they will vary across Member States
and local circumstances as well as time. However, the values show that there is a wide variation of costs
across different input materials. For instance, grains which are also associated with the highest biogas yield
are also the most expensive. Manure has no value for other applications and is typically free, while for
treating waste, plants can treat gate fees and hence generate an income, rather than a cost, from the input
material.
Table 5.18 Examples of input material costs
Input material Cost Income (gate fee)
Maize/grass silage €28-32
Grain (wheat/barley) €102-114
Manure/slurry €0
Green waste Ca €25
Food waste At least €57
Source: THE ANDERSONS CENTRE (2010). A DETAILED ECONOMIC ASSESSMENT OF ANAEROBIC DIGESTION TECHNOLOGY AND ITS
SUITABILITY TO UK FARMING AND WASTE SYSTEMS 2ND EDITION. Available at: http://www.organics-
recycling.org.uk/uploads/category1060/10-010%20FINAL_Andersons_NNFCC_AD2010.pdf
Values converted to Euros in 2017 prices, using the 2010 annual average annual exchange rate from the European Central Bank
(available at: https://www.ecb.europa.eu/stats/policy_and_exchange_rates/euro_reference_exchange_rates/html/index.en.html) and the
Harmonised Index of Consumer Prices (HICP) for the euro area (available at:
https://www.ecb.europa.eu/stats/ecb_statistics/escb/html/table.en.html?id=JDF_ICP_ECONOMIC_ACTIVITIES_INX).
The choice of input materials can affect the nutrient content and availability of both compost and digestate.
This in turn affects their value for use in agriculture/landscaping. For instance, JRC (2014) reports a range of
values for C/D from different input materials, in various countries. For instance, depending on the nutrient
content the price of digestate can vary from €5-30/t for dried digestate and €0-8/t for wet. Prices for
compost from park and garden waste are generally reported to be higher (€8-12/t) than those for compost
from for instance mixed municipal solid waste (MBT compost, €2–3/t)155. Note however, that of course the
choice of input materials affects not only the sales price of the compost/digestate, but also the costs for
input materials, as discussed above.
As mentioned above under technical feasibility, the choice of input materials can also affect the amount and
type of pre-processing required. This could also have economic implications, although detailed data on cost
for pre-treatment by input material were not available.
Hence, switching input materials can significantly affect the economics of any composting or anaerobic
digestion plant. However, due to the amount of factors involved that are all subject to strong local variation,
no general conclusion about economic feasibility could be drawn.
Availability
In principle, far larger amounts of most input materials are or could be made available than is currently used
in composting and anaerobic digestion. For instance, it is estimated that, only about 25% of the 118 and 138
million tonnes of bio-waste arising annually in the EU are currently recycled into C/D (ECN 2016b). This does
155 The fact that JRC 2014 refers to a price for MBT compost suggests that it has been produced at some point before 2014. Note that
the market analysis could not quantify MBT compost production in Europe, as some sources suggest MBT compost is not currently
produced, while others suggest that compost is or at least has been produced from MBT in some smaller countries.

148 © Wood Environment & Infrastructure Solutions UK Limited
February 2019
Doc Ref. 40039CL003i3
not include significant quantities of food residues from food manufacturing (41 million tonnes) (ECN 2016b).
However, the ability to use these materials for composting and digestion depends on their separate
collection, which is not yet implemented across the EU and likely challenging to establish quickly.
Whilst there are competing uses for energy crops (e.g. biofuel) and for cropping areas (e.g. growing crops for
food), in 2012 it was estimated that in the EU only 3.2% (5.5 million hectares) of the total cropping area were
used for bioenergy cropping, of which in turn only 7% were used for biogas crops (Biomass Futures 2012).
Due to the significant growth of biogas production since that time, these figures will have increased, but
biogas still likely only accounts for a small share, which suggests that small increases in the use of energy
crops for anaerobic digestion would likely be feasible, provided market prices can be paid (see economic
feasibility above).
Human health and environmental risks
This section assesses switching input materials in response to a risk management measure to reduce risks to
human health and the environment from the use of C/D as fertiliser. No increase in other risks is expected.
Hence, risks are expected to decrease overall.
5.6.6 f. Alternative waste management for input material
Further (as yet undefined) restrictions on input materials for composting and anaerobic digestion (Option 3)
could lead to the restricted inputs having to be treated using alternative waste management methods.
Furthermore, the imposition of specific (as yet undefined) concentration limits (Option 1) could have a similar
effect, if the concentration limits cannot be met in particular by compost or digestate from specific input
materials.
As discussed in Section 5.3, the majority of the total digestate and compost produced in the EU is agricultural
digestate, with about 122 million tonnes. The input materials of agricultural digestate are typically a mix of
manure and energy crops. 46 million tonnes of digestate (and an uncertain but likely small amount of
compost) is produced from organic fraction of mixed municipal solid waste (mechanical biological treatment
– MBT). About 21-25 million tonnes of C/D are produced in the EU from biowaste and greenwaste. A much
smaller quantity, but at least 2.5 million tonnes of C/D are produced from sewage sludge.
The alternative waste management methods covered in this subsection are landfill, incineration, including co-
firing and advanced thermal treatment, physical or mechanical treatment, use as construction materials and
fermentation.
Technical feasibility
The table below elaborates on the technical feasibility of the identified alternative waste management
methods for inputs material from digestate and compost.

149 © Wood Environment & Infrastructure Solutions UK Limited
February 2019
Doc Ref. 40039CL003i3
Table 5.19 Overview of potential waste management for input materials from digestate and compost
Type of waste
management
Technical feasibility
Landfill Landfilling is considered the least preferable option in the waste management hierarchy, and it should be minimised as much as possible. Waste that needs to be landfilled must
comply with legal requirements set out in the Directive 1999/31/EC on the landfill of waste, which aims to prevent or reduce the negative effects on environment.
Although considered as the final resort in terms of waste management, input materials typically used in C/D, could by definition be accepted by any non-hazardous licensed
landfill site; however, the decision would sit with the operator of the site, who has the final decision to accept such material.
Conventional
incineration
Conventional incineration is usually applied for waste with a high content of combustible fraction, i.e. paper and plastic/synthetics, and/or where land for disposal is limited.
Technically, it requires adequate equipment, infrastructure facility and trained personnel (World Bank 2000).
In this treatment, waste is reduced through combustion in incinerators for material recovery or disposal in landfills as an inert inorganic ash residue. The energy is recovered to
produce electricity and/or heat. The most common form of incineration is large-scale mass burn incineration, that involves little or no sorting or any other pre-treatment,
however, biodegradable materials (like input materials for compost or digestate) are usually excluded by source separation given their low calorific value and high water-content
(except paper and wood). Sewage sludge is typically dehydrated before incineration. This is particularly common in countries where the direct use of sludge in agriculture is
banned (e.g. the Netherlands (HVC 2018)). The resulting ash can be used for a range of applications, including fertiliser production, but is currently still predominantly landfilled
(Donatello and Cheeseman 2013).
Although a technically feasible option, the combustible residue from burning biodegradable without separate treatment provides a lower calorific value, unlike for example refuse
derived fuels (RDF) that have been pre-processed to remove several streams of recyclable materials.

150 © Wood Environment & Infrastructure Solutions UK Limited
February 2019
Doc Ref. 40039CL003i3
Type of waste
management
Technical feasibility
Co-firing Co-firing is a type of incineration that involves two or more different types of materials at the same time. The co-firing of biodegradable waste, in particular those that classify as
biomass like wastewater sludge, are thus a potential source of renewable energy. Although it is technically feasible to burn wastewater sludge with municipal waste and co-firing
is recognised as a ‘Best Available Technology’ process for IPPC (covered under BREF), there are some technical issues highlighted in the Sludge Strategy from Scottish Water
(Scottish Water 2006), for instance:
The technologies associated with dried sludge applications have not proven commercially viable, unlike the technologies for dewatered sludge. Pre-treatment of waste would still
be required as many organic wastes have a high moisture content and may require drying before combustion. Moreover, there are technical issues regarding the mixing
arrangements, as the quantity a plant may be able to take will depend on the proportions of the sludge ‘cake’ to dried product suggested: there is a risk that a substantial
addition of cake affect negatively the combustion. Finally, the flue gas abatement plant must be in place and adequate, to ensure compliance with the Waste Incineration
Directive, as the incineration of sludge can increase the emissions of particulate and NOx.
Scottish Water also recognises that if the plant is not specifically designed to take specified quantities of wastewater sludge with other waste streams at the design stage, there is
a substantial risk and potential for plant failure, under performance and/or inability to accept some of the intended waste streams. Scottish Water estimates that it would take
between three to eight years from planning to construction and first operation of such a plant. It is also possible to construct and operate a built multi-waste stream plant;
however, it is more difficult to obtain a planning permission for such a plant compared to a dedicated sludge incinerator and there are risks from adding another different stream
into an existing plant arrangement.
Given that regulations such as the Waste Incineration Directive apply to co-firing in power stations, stations would have to comply with requirements to meet Annex I and II on
emission limits to air, and Annex IV on emission limits for discharges of waste water from the cleaning of exhaust gases, as well as clauses 2 to 8 of Article 6 on requirements for
gas residence times. It is unlikely that any power station will be able to take wastewater sludge for co-firing as, depending on the quantity of wastewater sludge co-fired, the fly
ashes may be considered as hazardous.
Co-firing can also take place in cement and lime kilns. The use of alternative waste derived fuels is preferable in the cement industry as it is energy intensive. The utilisation of
waste as fuel source is technically feasible and is subject to the Waste Incineration Directive. However, the use of wastewater sludge is not appropriate for co-firing in line plants
as it can contaminate the lime.

151 © Wood Environment & Infrastructure Solutions UK Limited
February 2019
Doc Ref. 40039CL003i3
Type of waste
management
Technical feasibility
Pyrolysis and
gasification
(advanced
thermal
treatment)
Pyrolysis and gasification are both alternative waste treatment technologies that rely on high temperatures in order to treat the biodegradable share of municipal solid waste and
recover energy (e.g. under heat, electricity or fuel). These technologies usually use carbon-based waste, e.g. paper, petroleum-based wastes like plastics and organic materials,
and support the diversion of biodegradable waste from landfill. Pyrolysis is the thermal degradation of a substance in the absence of oxygen, to break down waste materials.
Gasification is a partial oxidation process that produces syngas: the amount of oxygen added is not sufficient to allow a full combustion to occur (Friends of the Earth 2009).
Advantages from those two waste management systems, often called ‘advanced thermal treatment’ (ATT) are (Defra 2013).
Treatment from ATT technologies recover more value from waste compared to mass burn incineration; moreover, a by-product from these technologies, the syngas, can generate
energy more efficiently that mass burn incineration.
ATT technologies are more flexible than mass burn incinerators, as the plants are modular: they are made of a number of smaller units that allow them to increase/reduce their
size depending on the waste amounts received; moreover, these technologies are easy to build.
These technologies reduce the biodegradable content of residual waste, which, in turn, reduce the production of landfill gases, when this residual waste is sent to landfill.
Technical limitations exist for pyrolysis and gasification. These technologies need to use pre-sorted or processed waste as feedstock and they do require high technical
experience compared to mass burn incineration.
Physical or
chemical
treatments
Other physical and chemical treatments for input materials for C/D include:
Rendering, i.e. ‘the partial recovery of materials from animal by-products, e.g. former foodstuffs, by crushing and grinding, followed by heat treatment that will reduce the
moisture content and kill micro-organisms’ (NIBusinessinfo).
Hydrolysis, i.e. ‘a process in which chemical bonds are broken by the insertion of water between the atoms in the chemical bond (…). It is particularly suited to high-risk wastes,
e.g. high-level animal by-product wastes’ (NIBusinessinfo).
Autoclaving, i.e. ‘a conventional combination of heat treatment under pressure, used as a sterilisation process (…). Organic waste such as food and vegetable residues, paper and
cardboard, etc. will result in an organic ‘wool’ or fibre when treated in an autoclave’ (NIBusinessinfo). More information on this treatment is provided below.
As for pyrolysis and gasification, plants are modular and made up of smaller units that can adapt to the waste streams and subsequent volumes. Technical issues exist for
autoclaving as the fibre requires a significant heat input to be dried before further processing, given its very high moisture content (up to 50%). If dried to 5-8% moisture, it can
be stored for over a week, but if not, it will deteriorate and rot within 24 hours.
Moreover, hazardous municipal waste may contaminate the fibre, given that there is not front-end recycling to remove such hazardous waste from the waste stream beforehand.
A report from Friends of Europe highlights that in some fibres, high levels of some metals were found, which limited its potential uses (Friends of the Earth 2008). Finally,
autoclaving only consists in an intermediate step and potential applications for the fibre to be recovered or recycled still include composting, digestion or creation of refuse
derived fuel. Potential markets to use the fibre as a raw material in product manufacturing exist, including the washing of the fibre to extract the long cellulose fibres used in
paper pulp. Another application is to convert the fibre into refuse derived fuel that will be incinerated and produce energy, however this would have to occur in another
dedicated site or the same facility should plan for both purposes.
Construction
materials
Scottish Water reports that a number of trials involve sewage and water treatment sludges in manufacture of lightweight aggregate and bricks, as well as in the manufacture of
ceramics, cement and aggregate through wastewater sludge incinerator ash. However, brick manufacturers consulted in the context of this study reported that the water content
was critical for this type of treatment and their processes could not accept wet product streams (Scottish Water 2006).

152 © Wood Environment & Infrastructure Solutions UK Limited
February 2019
Doc Ref. 40039CL003i3
Type of waste
management
Technical feasibility
Fermentation Some of the biodegradable waste can also be used to produce biofuel through fermentation. In the past, biofuels were mostly based on crops, however waste material from food
crops can also be used nowadays. To make the material fermentable, a first step is to steam crack the lignocellulose parts.

153 © Wood Environment & Infrastructure Solutions UK Limited
February 2019
Doc Ref. 40039CL003i3
Economic feasibility
A 2001 study highlighted that the prospects for obtaining one figure for the unit cost of each treatment in
given countries were remote, as costs are highly influenced by the scale and volumes of waste (Eunomia
2001). Since this further literature on the topic is limited, or scattered comprising case studies focusing on
specific input materials, in given countries with certain waste treatments.
A 2012 report, provides the following comparative analysis on estimated solid waste management costs by
disposal method (World Bank 2012). It compares the cost of collection by income categories and the cost of
treatment by disposal method, i.e. sanitary landfill, open dumbing, composting, waste-to-energy incineration
and anaerobic digestion. Note that all countries in the EU are high income countries, with a few exceptions of
upper mid income countries. Costs are shown for these two income categories in Table 5.20. This suggests
that due to the wide ranges of costs for each disposal method, a general conclusion on the cost implications
of switching from composting or anaerobic digestion to a different method cannot be drawn.
Table 5.20 Comparison of cost of collection and disposal according to World Bank 2012
Cost of collection and disposal (US
$/tonne)
Upper Mid Income Countries High Income Countries
Collection 40-90 85-250
Sanitary landfill 25-65 40-100
Open dumping NA NA
Composting 20-75 35-90
Waste-to-energy incineration 60-150 70-200
Anaerobic digestion 50-100 65-150
Source: World Bank, 2012, What a Waste.
Note: Information on lower mid income and lower income countries is also available in the report; however all EU MS are either upper
mid income countries or high income countries.
IA 2002 report classified various disposal treatment in a qualitative manner (see Table 5.21) (Eunomia 2002).
This suggests that the costs of alternative waste management practices other than landfilling appear to be at
a similar or higher scale than composting and anaerobic digestion.
Table 5.21 Comparison of cost of collection and disposal according to Eunomia 2002
Disposal method Scale of costs
Mechanical Biological Treatment Costs of whole treatment depends upon destination of separated
/ treated fractions
Compost Low to medium
Anaerobic Digestion Medium to high
Incineration Medium to very high
Pyrolysis Medium to high
Gasification Medium to very high
Source: http://ec.europa.eu/environment/waste/compost/pdf/econanalysis_finalreport.pdf

154 © Wood Environment & Infrastructure Solutions UK Limited
February 2019
Doc Ref. 40039CL003i3
The following figure compares the cost of landfill and incineration, with and without their respective taxes, in
a series of EU Member States in 2012 and 2014 (Ademe 2017), and highlights differences in the cost structure
across the EU: for instance, it shows that, in 2012, the cost of landfill including taxes was lower than the cost
of incinerating in France, Catalonia, and the Netherlands. Hence, the cost implications of switching from
composting or anaerobic digestion to a different method will likely depend on local circumstances affecting
the costs for each method. To provide more context, the cost structure of each method (where information
was available) is discussed further below. Where possible, conclusions regarding economic feasibility are
drawn.
Figure 5.3 Comparison of the cost of landfill and incineration, with and without their respective taxes, in
several EU Member States
Source: ADEME, 2017, Étude comparative de la taxation de l’élimination des déchets en Europe
Landfill
Typical costs of landfill can be disaggregated into the following components: acquisition costs, capital
expenditure and development costs, operating costs, restoration and aftercare costs. Acquisition costs
depend on the country: the site can be acquired for a fee, through royalty payment or lease. Capital
expenditures will also be affected by the countries’ requirements as well as by the geology of the site and
proximity to aquifer. Restoration costs will also be defined depending on the area rather than on the quantity
of material taken. Aftercare costs arise mainly from the Landfill Directive, that requires adequate financial
provisions to be made by the operator to cover the costs of aftercare, and the magnitude of this fund is likely
to depend on the Member State (Eunomia 2001).
The following factors result in differences in unit costs of landfill:
Land acquisition;
Requirements for engineering (geology, aquifer);
Scale of landfill;

155 © Wood Environment & Infrastructure Solutions UK Limited
February 2019
Doc Ref. 40039CL003i3
The rate at which the landfill is filled;
The costs for daily cover/restoration;
Financial provisions / aftercare; and
Landfill taxes.
A main constrain on landfill consists in the landfill tax. CEWEP provides an overview of landfill taxes and
landfill bans (current and planned) across EU Member States, in 2017 (CEWEP 2017).
Incineration and co-firing
The costs of incineration are affected by:
Cost of land acquisition;
Scale (given diseconomies of small scale);
Plant utilisation rate;
The requirements for treatment of flue gas (differing among MS);
The treatment and disposal / recovery of ash residues: bottom ash can be used in construction,
hence preventing landfill, however the fly ash needs to be treated and its cost of treatment
varies among MS and depending on legislation;
The efficiency of energy recovery;
The revenue received for energy delivered;
The recovery of metals and revenues from this; and
Taxes on incineration.
Regarding the co-firing of wastewater sludge as a fuel, Scottish Water highlights that other types of waste
will possibly require a higher gate fee than wastewater sludge.
Pyrolysis and gasification (advanced thermal treatment)
Regarding advanced thermal treatment, it was noted that both gasification and pyrolysis have much higher
capital and operational costs than mass burn incineration. However, biomass and bio-waste gasification can
improve the efficiency of large-scale biomass power facilities and specialised facilities. A report from Friends
of Europe on pyrolysis and gasification indicates that the syngas (by-product from gasification) can be used
to generate energy more efficiently if a gas engine is used, while incineration will only generate energy less
efficiently through steam turbines. Moreover, it highlights that the energy produced is considered as
renewable energy, increasing the potential income from power generated, in some countries like the UK
through Renewable Obligation Certificates (Friends of the Earth 2009).
Physical or chemical treatments
A report from Friends of Europe on autoclaving raises doubt about its cost-effectiveness. It also highlights
that this process is a waste of resources, as in some cases, certain high-calorific elements of the waste stream
are left in the fibre, instead of being separated for recycling (Friends of the Earth 2008).
Construction materials
In a consultation for their national sludge strategy (Scottish Water 2006). Scottish Water highlighted that
brickworks manufacturers would only be interested in taking water treatment sludges at very low moisture

156 © Wood Environment & Infrastructure Solutions UK Limited
February 2019
Doc Ref. 40039CL003i3
content as drying requirements may not be cost-effective in the short-medium term, and longer-term
financial viability will be subject to the material’s suitability, contracts, etc.
Availability
Landfill
According to Eurostat data, around 1.1 billion tonnes of waste were landfilled in the EU as of 2014,
suggesting that adding a small share of waste currently treated by composting/AD would be feasible
(Eurostat 2018e). However, the European Union established strict requirements for landfills through the
Landfill Directive and requires that waste is treated before being disposed in landfills; moreover, it sets out
that biodegradable waste to landfill must be reduced to 35% of the levels of the total amount of
biodegradable municipal waste produced in 1995. The revised Waste Framework Directive sets new common
EU targets for recycling of municipal waste of 55% by 2025, 60% by 2030 and 65% by 2035 (Directive
2008/98/EC). The revised Landfill Directive sets a binding landfill reduction target of 10% by 2035 (Directive
2018/850).
Incineration and co-firing
According to Eurostat data for 2014 (Eurostat 2018e), the EU has an incineration capacity of 184 million
tonnes per year, and 34% of household waste are incinerated (both for disposal and recovery of energy). This
varies strongly by Member State (from 0% in Bulgaria, Greece, Croatia, Cyprus, Lithuania, Malta, Romania and
Slovenia to 100% in Sweden). Hence, on EU-level sufficient incineration capacity would likely exist to add a
small share of waste currently treated by composting/AD, but this capacity is concentrated in some Member
States so availability would likely be an issue locally. However, note that according to the revised Waste
Framework Directive, bio-waste has to be collected separately by 31 December 2023 (§22 (1)) and separately
collected bio-waste cannot be incinerated (§10 (3a)), although there are derogations for environmental,
technical, and economic reasons.
Pyrolysis and gasification (advanced thermal treatment)
Plants that carry out pyrolysis require a certain amount of particular types of materials to work effectively, i.e.
plastic, paper and food waste; hence, this conflicts with recycling and composting as these materials are
often the most valuable of the waste streams for such processes. Specific information on the availability of
capacity for physical or chemical treatments or use as construction materials was not available.
Human health and environmental risks
Waste management has a key role to play in the transition to circular economy, contributing to the supply of
high-quality secondary resources. Although waste avoidance is prioritised in the waste hierarchy, the reduce,
re-use and recycle approaches are fundamental toward the implementation of circular economy. In this
context, a major concern in this analysis of alternative waste management for inputs materials used for
digestate and compost lies in related risks for the human health and the environment. The following table
presents the various risks to both the environment and health by disposal method.
Table 5.22 Risks to the environment and health by disposal method
Disposal method Potential risks to the environment and health
Landfill Landfilling mixed municipal solid waste without pre-treatment or separating out the biological
fraction used to be a common practice in the European Union despite its negative impacts on
environment and health from high greenhouse gas potential (methane), leachate and space

157 © Wood Environment & Infrastructure Solutions UK Limited
February 2019
Doc Ref. 40039CL003i3
Disposal method Potential risks to the environment and health
usage. In 1995, the production of methane from bio-waste (and other biodegradable waste)
decomposing in landfills accounted for circa 3% of total greenhouse gas emissions in the
EU15.
Nowadays, landfilling of such waste still leads to a waste a potentially valuable resource, the
exploitation of virgin resources and the reduction of the amount of land required for landfill.
Incineration A large amount of ash is produced during the incineration of waste, ca. 30% of the weight of
the original waste, and ca. 40-50% of the volume of compacted waste. Two types of ash are
produced during incineration, i.e. bottom and fly ash. Fly ash is highly toxic and has high
concentration of heavy metals and dioxins – even substances with little toxicity before
incineration can become hazardous after the conversation to particulates and fine particles in
the ash. Moreover, the combination of pollutants within the fly ash can increase its toxicity.
Modern incinerations produce less air pollution, however, the less air pollution, the more toxic
the ash. Given that landfill sites are becoming less available, there is a need to develop a
practicable alternative to both landfill and incineration (BSEM 2008).
There are trace elements such as sulphur and nitrogen in wastewater sludge for incineration,
which can lead to emissions of hazardous chemicals to air during combustion. Sludge
incineration can also result in increased particulate and NOx emissions.
Co-firing Sludge incineration can result in increased particulate and NOx emissions.
Co-firing in a power plant station may require fit flue gas desulphurisation and NOx
abatement. Moreover, depending on the quantity of wastewater sludge co-fired, the fly ash
can be hazardous.
Pyrolysis and gasification
(advanced thermal
treatment)
Although fewer air emissions may be produced due to the minimum use of oxygen, if gases
and oils from the process are then burnt, this can generate emissions.
Disposal of ash and other by-products may happen.
Air emissions from advanced thermal treatment may include acid gases, dioxins and furans,
nitrogen oxides, Sulphur dioxide, particulates, cadmium, mercury, lead and hydrogen sulphide.
Physical or chemical
treatments
The fibre from autoclaving treatment may be contaminated by hazardous municipal waste.
High levels of some metals have been found in the fibre, hence limiting its potential uses.
Note that the residual waste from autoclaving may be sent to landfill, however, this treatment
reduces the biodegradability of waste, hence it is ‘bio-stabilised’ and is less likely to degrade
in the environment and produce methane gas in landfill.
Construction materials Waste used in construction material also produce ash that will have to be disposed to landfill.
In conclusion, most alternative waste management methods investigated are associated with severe risks to
human health and the environment, and undermine the transition to a circular economy, a priority target for
environmental protection and economic development in the EU (European Commission 2018e). This is true
particularly for the methods that are most common (landfilling and incineration) and therefore most likely to
be used for input materials that would cease to be treated by composting/AD. Some methods (advanced
thermal treatment, physical or chemical treatment, use as construction materials) are associated with lower
risks and/or are more compatible with the circular economy, but as discussed above, these are more niche
applications associated with higher costs and/or technical limitations.

158 © Wood Environment & Infrastructure Solutions UK Limited
February 2019
Doc Ref. 40039CL003i3
5.6.7 g. Specific processes to reduce contaminants in compost/digestate
Figure 5.2 sets out the risk management options being assessed, the potential responses from the supply
chain and the associated outcomes. This subsection considers the main socio-economic considerations of
requirements for additional processes to remove specific contaminants of concern (Option 4). The precise
measures are as yet undefined but are expected to comprise some combination of:
Additional measures addressing the input material / feedstocks, before composting / AD
processes takes place.
Additional measures taken during, or after the composting or AD processes themselves.
Note that such additional processes before, during or after the production of compost/digestate could also
be used to achieve specific concentration limits (Option 1), which could be associated with the same broad
socio-economic implications.
Part 1: Measures before composting/AD
This section evaluates several measures that could, in principle, be implemented before composting or AD
processes commence. The potential RMO in this study focusses on addressing the risk from several chemical
containments. Hence the assessment in Table 5.7 above is organised by chemical substance. This identified
several measures that address the risks from several common substances, but these arise from different
sources, so different technical and economic issues may be relevant for each.
The information below is based on the scope of measures in Table 5.7 and the technical analysis on each of
these is contained in FERA (2011). Below we look briefly at the measure, the substance(s) the measure would
address as well as the sources of the contaminants. Any RMO would require a range of different technical
measures. These measures would require action at several stages of several very different supply chains.

159 © Wood Environment & Infrastructure Solutions UK Limited
February 2019
Doc Ref. 40039CL003i3
Technical feasibility
Measure: Increase bioavailability
in animal diet
Replacement of
metal pipework
with plastic
Separation of wastes; recycling; battery replacement or
“take back” schemes.
Substitution Other specific technology
Contaminant
of concern:
Heavy Metals; (Zn, Cu,
Fe, Mn).
Heavy metals (Cu,
Zn. Cd, Hg, Ni, Pb).
Heavy metals (Cu, Zn. Cd, HG, Ni, Pb)
Pharmaceuticals
Plastics
Heavy Metals (Cd, Cr, Cu, Zn, Pb)
Pharmaceuticals
Surfactants
Pharmaceuticals
Heavy Metals (Cr, Pb, Cu,
Zn), PAHs.
Waste type
or source:
Livestock manure (and
abattoir waste): Experts
cited in FERA 2011
judged that further
controls on metal levels
in feed are possible and
increasing bioavailability
in feed represents “the
most effective way to
reduce the amount of
metal in manure”. The
authors note that “more
research is needed on
the actual requirements
of animals in different
life stages, the metal
bioavailability,
interactions between
different minerals, and
the use of organic trace
element formulations”156.
Despite this, certain
specific techniques are
proposed. These include:
Reducing the
period where high
zinc content diet is
Sewage sludge (and
dredgings from
inland waters):
Various contaminants
present, arising from
a wide range of
household and
industrial uses and
from pipework
/plumbing corrosion.
Replacement
with plastics
pipework
considered likely
to reduce sludge
contamination.
Municipal solid waste: Batteries are a significant source of
Cd, Pb. Measures include:
Cd free or rechargeable batteries.
Segregation judged one of the “best approaches” for
contaminant reduction. Source separation and
mechanical and biological separation. FERA 2011 notes
that educating consumers also likely to be effective.
Stewardship schemes: e.g. pay by weight / recycling
programmes judged effective for Pb (Car batteries).
Municipal solid waste, sewage sludge and dredgings from
inland waters:
Take back schemes for pharmaceuticals already in use
for e.g. drug disposal.
Paper and Pulp waste:
Separation of de-inking sludge from other waste.
Waste wood, bark and other plant waste:
Municipal solid waste and Paper
and Pulp waste:
Metal free (vegetable oil
based) inks: Cr in paper is
mainly from inks. Using
metal-free inks expected to
significantly reduce levels and
aid greater paper recycling.
Sewage sludge and dredgings
from inland waters:
Change prescription practices,
“greener” drug development.
Textile industry waste:
Substituting of persistent
chemical incl. surfactants.
Tannery and leather waste:
Substitution of chromium as
tanning agent and of
Urine separation from
sewage sludge:
Pharmaceuticals are released
at higher concentrations in
urine. Urine source
separation is noted as a
“new-technology that diverts
faeces from urine using
“NoMix-technology”.
FERA, 2011 notes that whilst
this technology was being
studied in 38 projects
Northern and Central Europe
Countries, at the time of
writing “a global application
of this technology is not
practical”. Application in
specific institutions (e.g.
hospitals and nursing
homes) was considered more
feasible.
Catch basin: for PAHs from
atmospheric deposition
“could possibly be reduced”
by using a catch basin on
motorways to recover
sediments.
156 Page 138

160 © Wood Environment & Infrastructure Solutions UK Limited
February 2019
Doc Ref. 40039CL003i3
Measure: Increase bioavailability
in animal diet
Replacement of
metal pipework
with plastic
Separation of wastes; recycling; battery replacement or
“take back” schemes.
Substitution Other specific technology
Contaminant
of concern:
Heavy Metals; (Zn, Cu,
Fe, Mn).
Heavy metals (Cu,
Zn. Cd, Hg, Ni, Pb).
Heavy metals (Cu, Zn. Cd, HG, Ni, Pb)
Pharmaceuticals
Plastics
Heavy Metals (Cd, Cr, Cu, Zn, Pb)
Pharmaceuticals
Surfactants
Pharmaceuticals
Heavy Metals (Cr, Pb, Cu,
Zn), PAHs.
provided to animals
and combining
organic and
inorganic mineral in
feed.
Cease non-essential
mineral
supplements
In terms of sources
of metals, specific
concerns are noted
in pig farming.
Separation of woods according to treatment received.
SMARTWaste157 is a waste auditing tool used in the UK
claimed to aid this process.
Textile industry waste:
Separation of dyeing and post dyeing waste from other
waste streams.
Food and drink industry waste:
Separate highly inked/dyed wastes as well as packaging,
food & drink and animal waste streams to avoid
contamination.
Chemical and pharmaceutical manufacturing waste:
Various contaminants expected – sorting to prevent
cross contamination.
persistent chemicals more
generally (e.g. surfactants).
Food and drink industry waste
and Chemical and
pharmaceutical manufacturing
waste:
Substitution of persistent
chemicals more generally.
Granular activated carbon
(GAC) filter water
treatment option: GAC
filters “could possibly”
reduce Cr inputs into
wastewater treatment – one
significant source is via
carwashes.
Conclusion: Appears technically
feasible but requires
further research.
Technically feasible
but precise
contamination
removal unclear.
Technically feasible but precise contamination removal
efficiency unclear.
Substitution is technically
feasible in certain applications
but has proved difficult in
several applications described
above158.
Several measures appear
technically feasible, but
authors note these are at
early stage. Likely up-
157 See www.smartwaste.co.uk. This is site monitoring and reporting software, available for a fee. 158 See for example A Safe Chemicals Innovation Agenda (2018) for a discussion of various technical functions performed by harmful chemical substances that, in practice, have proved difficult to substitute
for a range of technical and economic reasons. https://webgate.ec.europa.eu/s.../Safe%20Chemicals%20Innovation%20Agenda.pdf

161 © Wood Environment & Infrastructure Solutions UK Limited
February 2019
Doc Ref. 40039CL003i3
Measure: Increase bioavailability
in animal diet
Replacement of
metal pipework
with plastic
Separation of wastes; recycling; battery replacement or
“take back” schemes.
Substitution Other specific technology
Contaminant
of concern:
Heavy Metals; (Zn, Cu,
Fe, Mn).
Heavy metals (Cu,
Zn. Cd, Hg, Ni, Pb).
Heavy metals (Cu, Zn. Cd, HG, Ni, Pb)
Pharmaceuticals
Plastics
Heavy Metals (Cd, Cr, Cu, Zn, Pb)
Pharmaceuticals
Surfactants
Pharmaceuticals
Heavy Metals (Cr, Pb, Cu,
Zn), PAHs.
scaling requirements /
challenges.

162 © Wood Environment & Infrastructure Solutions UK Limited
February 2019
Doc Ref. 40039CL003i3
Economic feasibility
Taking each measure in turn:
Increasing bioavailability in animal diet: requires amending animal diet to reduce metal content
in manure. As noted above further research is required so that elves can be reduced without
adversely affecting the animals’ physical development and hence prices that farmers can
command. It is not clear whether farmers would be able to retain existing feed mixtures, simply
feeding less, or whether the feed recipe itself will need to be changed by suppliers. Feed is the
largest single source of cost in pig farming, representing upwards of 60% in several European
countries (AHDB 2016). Recent data suggests that pig feed prices have increased, reflecting
recent droughts, alongside a decrease in pork prices putting pressure on margins (Farmers
Weekly 2018). Overall, a reduction in feed will be economically feasible – if animal growth is not
adversely affected and assuming a change in feed recipe that increases costs further is not
required.
Replacement of metal pipework with plastic: such as PVC is economically feasible, such pipes
are commercially available and in widespread use. Their use in certain circumstances can reduce
costs, given that plastic pipes are more amenable to repair in Situ, rather than require
roadworks (Epoxy Resins Committee 2015). However the process of replacing pipework,
including old pipe and plumbing can be extremely costly, given they are generally inaccessible.
Appropriate phasing and replacement criteria would be required.
Separation of wastes; recycling; battery replacement or “take back” schemes: Examples of pre-
sorting of waste streams as well as take back or other stewardship schemes already exist
(Resource 2018). They require no scarce resources so are generally available. As discussed
above, Cd free/ rechargeable batteries are already commercially available (Which 2019). The
majority of the world battery market is Cd free. Overall, in general terms such activities are
likely to be economically feasible. Pre-sorting of waste steams is currently carried out, but the
precise technical solution and additional cost is not currently clear.
Substitution: Heavy metals, pharmaceutical and surfactants are the subject of several
regulations (such as REACH) aiming to address their use in specific applications. These undergo
detailed assessment of economic feasibility in each case. Substitution is a wider technical and
economic challenge recognised in recent strategy published by ECHA (ECHA 2018e).
Other specific technology: Of the three specific technologies noted above, two are
commercially available159 however there is limited recent data on the capital and operation cost
of installation and the precise technical requirements to address the presence of PAHs (and
their safe disposal is not known). Information suggests that since the FERA report noted above
was drafted, the NOMIX system has been discontinued, reflecting “commercial risk” and
challenges associated with consumer preference (Treehugger 2014, BBC 2014).
Availability
Taking each measure in turn:
Increasing bioavailability in animal diet: As noted above, further research is required so
availability is currently difficult to assess.
159 See for example: http://www.health.state.mn.us/divs/eh/hazardous/topics/gac.html#types /
https://www.ndspro.com/shop/drainage/catch-basins.html
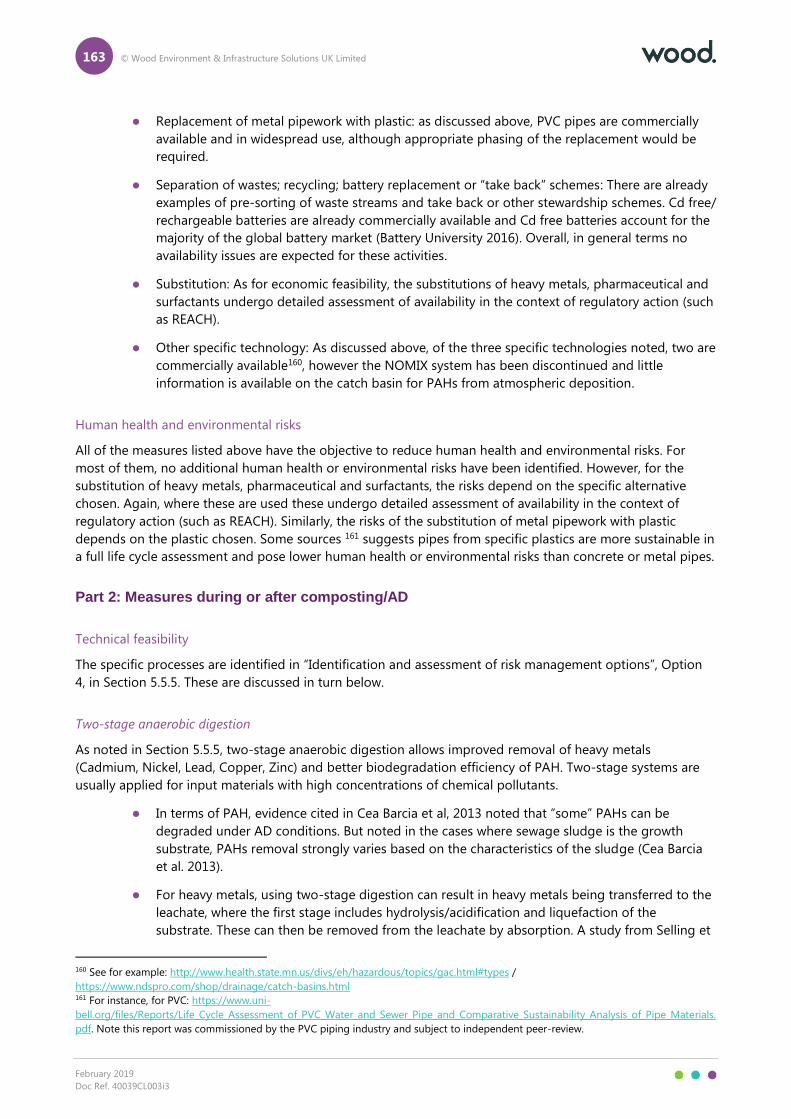
163 © Wood Environment & Infrastructure Solutions UK Limited
February 2019
Doc Ref. 40039CL003i3
Replacement of metal pipework with plastic: as discussed above, PVC pipes are commercially
available and in widespread use, although appropriate phasing of the replacement would be
required.
Separation of wastes; recycling; battery replacement or “take back” schemes: There are already
examples of pre-sorting of waste streams and take back or other stewardship schemes. Cd free/
rechargeable batteries are already commercially available and Cd free batteries account for the
majority of the global battery market (Battery University 2016). Overall, in general terms no
availability issues are expected for these activities.
Substitution: As for economic feasibility, the substitutions of heavy metals, pharmaceutical and
surfactants undergo detailed assessment of availability in the context of regulatory action (such
as REACH).
Other specific technology: As discussed above, of the three specific technologies noted, two are
commercially available160, however the NOMIX system has been discontinued and little
information is available on the catch basin for PAHs from atmospheric deposition.
Human health and environmental risks
All of the measures listed above have the objective to reduce human health and environmental risks. For
most of them, no additional human health or environmental risks have been identified. However, for the
substitution of heavy metals, pharmaceutical and surfactants, the risks depend on the specific alternative
chosen. Again, where these are used these undergo detailed assessment of availability in the context of
regulatory action (such as REACH). Similarly, the risks of the substitution of metal pipework with plastic
depends on the plastic chosen. Some sources 161 suggests pipes from specific plastics are more sustainable in
a full life cycle assessment and pose lower human health or environmental risks than concrete or metal pipes.
Part 2: Measures during or after composting/AD
Technical feasibility
The specific processes are identified in “Identification and assessment of risk management options”, Option
4, in Section 5.5.5. These are discussed in turn below.
Two-stage anaerobic digestion
As noted in Section 5.5.5, two-stage anaerobic digestion allows improved removal of heavy metals
(Cadmium, Nickel, Lead, Copper, Zinc) and better biodegradation efficiency of PAH. Two-stage systems are
usually applied for input materials with high concentrations of chemical pollutants.
In terms of PAH, evidence cited in Cea Barcia et al, 2013 noted that “some” PAHs can be
degraded under AD conditions. But noted in the cases where sewage sludge is the growth
substrate, PAHs removal strongly varies based on the characteristics of the sludge (Cea Barcia
et al. 2013).
For heavy metals, using two-stage digestion can result in heavy metals being transferred to the
leachate, where the first stage includes hydrolysis/acidification and liquefaction of the
substrate. These can then be removed from the leachate by absorption. A study from Selling et
160 See for example: http://www.health.state.mn.us/divs/eh/hazardous/topics/gac.html#types /
https://www.ndspro.com/shop/drainage/catch-basins.html 161 For instance, for PVC: https://www.uni-
bell.org/files/Reports/Life_Cycle_Assessment_of_PVC_Water_and_Sewer_Pipe_and_Comparative_Sustainability_Analysis_of_Pipe_Materials.
pdf. Note this report was commissioned by the PVC piping industry and subject to independent peer-review.

164 © Wood Environment & Infrastructure Solutions UK Limited
February 2019
Doc Ref. 40039CL003i3
al, 2008, noted removal from maize of up to 70% of the Ni, 40% of the Zn and 25% of the Cd,
although this process took six days, and removal of Cu and Pb were lower, further refinements
were proposed that were expected to increase heavy metal removal efficiency (Selling,
Håkansson and Björnsson 2007). Other studies have note that two stage AD can remove heavy
metal presence, but removal efficiency is not quantified (Lehtomäki & Björnsson 2010).
Overall, the limited evidence suggests two stage AD can reduce heavy metal and PAH content, although the
technical feasibility will depend on the specific removal efficiency judged necessary in the risk assessment.
Post-composting
As noted in Section 5.5.5, composting digestate as a post-treatment would lead to higher removal of DEHP,
PAHs and PCB compounds and pesticides.
Reeh et al 2001, notes that DEHP were reduced to “safe” levels in less than two weeks via
composting of sewage sludge and MSW. The same study also noted PAH degradation (not
quantified), but at comparatively slower rates (Reeh and Møller 2002).
Brandli et all (2011) note that “in lab studies, some compounds (e.g., low molecular weight
(LMW polycyclic aromatic hydrocarbons (PAHs)) were observed to decrease during composting,
whereas other compounds (e.g., polychlorinated biphenyls (PCBs), high molecular weight
(HMW) PAHs) remained stable”. They note that, conditions (e.g., availability of the pollutants,
nutrients, temperature) need to be “appropriate” (not defined) for the process to work
successfully. They note the need for further research, with a “probably more promising”
approach to single out particularly contaminated input materials (Brandli et al 2007).
Yuan et al 2000 evaluated the biodegradation of PAHs by an aerobic mixed culture which used
phenanthrene as its carbon source. They note the efficient degradation of pyrene and
acenaphthene, but that “it failed to degrade anthracene and fluorene”. Further, in samples
containing a mixture of the five PAHs, treatment with the aerobic culture increased degradation
rates for fluorene and anthracene and decreased degradation rates for acenaphthene,
phenanthrene and pyrene (Yuan et all 2000). (N.B only the abstract of this source was available).
Overall, the limited evidence suggests post composting may be technically feasible for reducing DEHP, PAH
content, although the technical feasibility will depend on both the fuel type – the extent of contamination of
input materials – and the specific removal efficiency judged necessary in the risk assessment. There appears
rather more limited data on removal efficiency of PCBs.
Thermophilic digestion
As noted in Section 5.5.5, feedstock for anaerobic treatment is processed under: mesophilic (optimum
temperature 37⁰C) and thermophilic (optimum temperature 55⁰C) AD systems. The removal efficiency of
nonylphenol is known to be higher for thermophilic than mesophilic digestion. In Paterakis et al (2012) the
authors note that the “removal of nonylphenol ethoxylates was greater in mixed sludge digestion (>58%)
compared with primary sludge digestion…”. They conclude that anaerobic digestion reduces the
concentrations of […] and would therefore be expected to confer a degree of protection against exposure
and transfer of [nonylphenol ethoxylates] to the receiving/re-use environment”. Specifically, they examine the
effect of temperature and note that the removal efficiency of nonylphenolics in the mixed sludge evaluated
in the study was 92% for thermophilic digestion compared to 58% for mesophilic digestion (Paterakis et al
2012). According to discussions with Wood internal anaerobic digestion technical experts, this adaptation is
in principle applicable to all plants.

165 © Wood Environment & Infrastructure Solutions UK Limited
February 2019
Doc Ref. 40039CL003i3
Overall, the limited evidence suggests this may be technically feasible process for reducing nonylphenol
contamination, although this will depend on the specific removal efficiency judged necessary in the risk
assessment.
As noted in section 5.5.5, no relevant processes (or no scientific data has been identified) to address
contamination of Bisphenol A (BPA).
Economic feasibility
No specific data has been found on capital and operation cost implications nor on process efficiency,
however the available information indicates additional costs would be incurred in all these processes. The
(limited) information identified is below.
Two-stage anaerobic digestion Post-composting Thermophilic digestion
This process requires an additional
reactor vessel, with the associated
capital investment costs, space,
pumping and control complexity.
However, this may be offset by the
higher overall energy recovery from
a two-stage process (IPPTS
Anaerobic Digestion Community
2018).
There is also evidence that the
presence of certain heavy metals
(mercury, cadmium and trivalent
chromium) decreases the overall
efficiency of the AD process (Abdel-
Shafy and Mansour 2014).
The gross/net effects on cost or
efficiency were not quantified.
The implementation of this
process would be associated with
additional space, time and
operational cost.
The extent of additional cost
depends on local conditions and
likely to exhibit considerable
variation (Reeh and Møller 2002).
The primary driver of process cost
is whether the composting occurs
outside in open air (c. €20 per
tonne) or within a plant (c. €45
per tonne) (Eunomia 2002).
Bouskova et al 2005 note that
adaptation from mesophilic
conditions is in theory applicable to
all AD plants, although they note that
post transition stabilisation might
take c.30 days. Whilst more energy
for is required for heating systems,
(given the higher operating
temperatures required), it is
understood that thermophilic
digestion is up to 8 times faster
(Bouskova et al 2005).
Availability
AD is a growing sector with capacity and plant increases experienced over the last decade. Data on the
availability of specific process are rather limited but noted below.
Two-stage anaerobic digestion Post-composting Thermophilic digestion
The European bioplastics association
indicates there as of 2015 there were
between some 290 plants in Europe,
of which c. 100 (Germany); and c., 30
in each of Switzerland, France and
Spain (European Bioplastics 2015).
No data has been identified on
current capacity for post
treatment of digestate for
composting.
Eunomia 2011 note that 62% of AD
plants operate at mesophilic
temperatures across Europe, implying
around c.110 thermophilic plants.
Human health and environmental risks
Composting and anaerobic digestion are generally regarded as a sustainable alternative to landfill and
incineration. However external effects associated with composting (covered and uncovered) and associated
with AD are evaluated in Eunomia 2002:
Composting involves some emission of CO2, N2O and VOCs, but this is offset by a reduction in
pesticide/fertiliser production and use and leachate.

166 © Wood Environment & Infrastructure Solutions UK Limited
February 2019
Doc Ref. 40039CL003i3
AD also involves some emission of CO2, N2O and CH4, VOCs, SOx, NOx (as well as potentially
some chemical impurities), but this is again offset by a reduction in pesticide/fertiliser
production and use. Anaerobic digestion is one of the most efficient biomass-to-energy routes,
using c. 10% of the resources across the life cycle compared to conventional electricity
generation (De Meester et al 2012, Massaro et al 2015).
No information was available to suggest these risks would be significantly higher or lower when the specific
processes discussed above are used.
5.7 Conclusions on the most appropriate (combination of) risk
management options
5.7.1 Justification of risk management at EU-level
Realistic worst case risk assessments have identified potential risks from the use of C/D as fertiliser arising
from several contaminants. The following (groups of) substances have been prioritised for the RMOA (see
Section 5.2):
Heavy metals (Nickel (Ni), Lead (Pb), Copper (Cu), Zinc (Zn), Mercury (Hg));
17α-ethinylestradiol;
PCBs (PCB28);
Dioxins and furans (TCDD, PCDF);
Nonylphenol; and
PFAs (PFOA, PFOS);
Cadmium and PAH16 substances (as a lower priority)162.
For some substances, potential risks were identified, but they have not been prioritised for risk management
for reasons summarised in Table 5.23.
Table 5.23 Substances not prioritised for risk management
Contaminant Explanation
Bisphenol-A (BPA) BPA in C/D can be considered a lower priority for further risk management (low contribution to
background concentrations, available safe limits of human consumption not exceeded).
Di(2-
ethylhexyl)phthalate
(DEHP)
Further monitoring of the development of DEHP concentrations in C/D is required to judge the need for
further risk management in the future.
Hexabromocyclodode
cane (HBCDD)
Following the expiry of the only REACH authorisation, any contribution to HBCDD concentrations in
compost in digestate resulting from industrial release of HBCDD should be eliminated. Can therefore be
considered a lower priority for further risk management.
PFHxA Further monitoring of PFHxA concentrations in C/D is required to judge the need for further risk
management in the future.
162 For these substances, the only main concern identified in the risk assessment was long-term gradual accumulation through repeated
application. These substances are therefore also considered for risk management, but at a lower priority than the above.

167 © Wood Environment & Infrastructure Solutions UK Limited
February 2019
Doc Ref. 40039CL003i3
Microplastics Further monitoring of microplastics concentrations in C/D is required to judge the need for further risk
management in the future.
Existing risk management lacks binding and coherent requirements for all types of C/D and all EU Member
States (see Section 5.5.1). Moreover, the production of digestate as fertiliser is expected to increase
significantly in the short to medium term. Existing risk management is therefore unlikely to adequately
control the identified risks. Coherent rules across the EU could improve user confidence and help support a
common market of C/D as fertiliser. Hence, further risk management on EU-level may be required.
5.7.2 Comparison of the assessed risk management options
The main regulatory risk management measures considered in this RMOA are the introduction of (further)
concentration limits, restrictions on input materials, conditions of use, or the application of specific processes.
Table 5.24 lists the risk management measures judged most appropriate based on the assessment. It also
demonstrates how, in combination, they address the risks identified from prioritised contaminants. Table 5.25
provides an overview of the advantages and disadvantages of the proposed measures, summarising the
more detailed discussion from below and earlier sections.
The appropriateness and initial considerations on the potential scope for each measure are discussed in turn
below. A summary of the expected socio-economic impacts of the proposed measure (based on the more
detailed information provided in Section 5.6) is provided at the end of each measure’s section.

168 © Wood Environment & Infrastructure Solutions UK Limited
February 2019
Doc Ref. 40039CL003i3
Table 5.24 Coverage of the prioritised contaminants by proposed combination of risk management options
Proposed risk management Nic
kel
(Ni)
Lead
(P
b)
Co
pp
er
(Cu
)
Zin
c (Z
n)
Merc
ury
(H
g)
17
α-e
thin
yle
stra
dio
l
PC
Bs
(PC
B2
8)
Dio
xin
s an
d f
ura
ns
(TC
DD
,
PC
DF)
No
nylp
hen
ol
Perf
luo
rocta
no
ic a
cid
(P
FO
A)
Perf
luo
rocta
nesu
lfo
nic
acid
(PFO
S)
Cad
miu
m (
Cd
)
PA
H1
6 (
Ben
zo[a
]pyre
ne,
Ch
ryse
ne, B
en
zo[a
]an
thra
cen
e,
Ben
zo
[b]f
luo
ran
then
e,
Ind
en
o(1
,2,3
-cd
)pyre
ne
Limit values based on
calculated safe limits for
application to agricultural
land
x x
Limit values based on
calculated safe limits for
container growing
x x x x
Limit values based on existing
limit values x (x) (x) (x) (x) x
Restriction on the use of
sewage sludge C/D as a
fertiliser
x x x x x x x x
Restriction on the use of
sewage sludge compost in
container growing*
x x x x x x x x
Restriction on the use of MBT
and sewage sludge* digestate
as a fertiliser except when
using two-stage A/D
x x x x x x

169 © Wood Environment & Infrastructure Solutions UK Limited
February 2019
Doc Ref. 40039CL003i3
Proposed risk management Nic
kel
(Ni)
Lead
(P
b)
Co
pp
er
(Cu
)
Zin
c (Z
n)
Merc
ury
(H
g)
17
α-e
thin
yle
stra
dio
l
PC
Bs
(PC
B2
8)
Dio
xin
s an
d f
ura
ns
(TC
DD
,
PC
DF)
No
nylp
hen
ol
Perf
luo
rocta
no
ic a
cid
(P
FO
A)
Perf
luo
rocta
nesu
lfo
nic
acid
(PFO
S)
Cad
miu
m (
Cd
)
PA
H1
6 (
Ben
zo[a
]pyre
ne,
Ch
ryse
ne, B
en
zo[a
]an
thra
cen
e,
Ben
zo
[b]f
luo
ran
then
e,
Ind
en
o(1
,2,3
-cd
)pyre
ne
Restriction on the use of
sewage sludge digestate as a
fertiliser except when
applying post-composting*
x x
Notes:
*) Only relevant if sewage sludge C/D is not restricted for use as fertiliser in general
(x) Indicates that it is not certain that limit values should be set for these substances.
Table 5.25 Summary comparison of proposed risk management options
Proposed risk management Main advantages Main disadvantages
Option 1)
Concentration limits
Directly limit pollutants to levels considered to pose no (or
an ‘acceptable level’ of) risk.
Setting limit values only for pollutants where concentrations
exceeding safe limits have been found minimises the
regulatory burden (e.g. sampling costs).
Separate limit values for different use scenarios minimises
the share of C/D restricted.
- Sampling costs.
- Setting limit values only for pollutants where
concentrations exceeding safe limits have been found
does not ensure the control of risks from future increases
in concentrations of other contaminants.
- Separate limit values for different use scenarios are more
complicated to enforce.
- Main potential negative impacts: Reduced compost
production; affected compost feedstocks and digestate
have to be disposed of; increased synthetic fertiliser use.

170 © Wood Environment & Infrastructure Solutions UK Limited
February 2019
Doc Ref. 40039CL003i3
Proposed risk management Main advantages Main disadvantages
Measure 1a)
Limit values based on calculated safe limits
for application to agricultural land (zinc,
mercury)
Only a low share of C/D expected to be affected and
potential negative impacts would be modest in scale.
Measure 1b)
Limit values based on calculated safe limits
for container growing (nickel, copper, zinc,
nonylphenol)
For copper and nonylphenol, only a low share of compost is
expected to be affected and potential negative impacts
would be modest in scale.
- For nickel and zinc a large share of compost used in
container growing is expected to be affected, so the
potential negative impacts could be significant for the
container growing segment.
Measure 1c)
Limit values based on existing limit values
(PCBs, PCDD/F, lead, PFAS, PAHs)
Would ensure that the risk from these substances is limited
EU-wide, while minimising the disruption to those markets
where limit values are already in place.
Only a low share of C/D is expected to be affected and
potential negative impacts would be modest in scale.
- It is not clear if existing limits are risk-based and if they
would adequately control the risks.
- Sampling costs, particularly for PCBs, PCDD/F and PFAS,
may render the production/use of some C/D
uneconomical, likely increasing the scale of the potential
negative impacts.
Option 2)
Restriction on input materials
Easier and less costly monitorability and enforceability
compared to limit values (less comprehensive sampling).
Reinforced consumer confidence.
- Risk is not directly controlled (concentration of
contaminants in input materials is subject to variation).
- Some C/D that does not pose a risk may be restricted.
- Not technology neutral (does not encourage innovation
to enable use of restricted input materials).
- Main potential negative impacts: Reduced compost
production; affected compost feedstocks and digestate
have to be disposed of; increased synthetic fertiliser use.
Measure 2a)
Restriction on the use of sewage sludge
based C/D as a fertiliser
Sewage sludge exhibits particularly high concentrations for
most priority substances of concern, including several
substances for which no calculated safe limits are derivable
and concentration sampling is (potentially) particularly
expensive.
Only a low share of C/D is expected to be affected and
potential negative impacts would be modest in scale
- Sewage sludge could be applied directly to agricultural
land instead of being digested first, unless coherent
regulation on direct use of sewage sludge is
implemented.
- Further regulating the direct use of sewage sludge would
increase the scale of impacts related to alternative waste
management for sewage sludge.

171 © Wood Environment & Infrastructure Solutions UK Limited
February 2019
Doc Ref. 40039CL003i3
Proposed risk management Main advantages Main disadvantages
Option 3)
Conditions of use
Aims at reducing exposure, rather than banning certain
composts/digestates or input materials.
No sampling required.
- Risk is not directly controlled (only reduced by
eliminating uses with highest potential for exposure).
- Potential difficulties with monitoring and ensuring
compliance by consumers.
Measure 3a)
Restriction on the use of sewage sludge
compost in container growing*
Addresses the risk associated with container growing, which
is higher than application to agricultural land for most
priority substances of concern (all except zinc and mercury).
Complementary to proposed limit values based on calculated
safe limits (sewage sludge is linked to several substances for
which no calculated safe limits are available).
Only a very low share of compost is expected to be affected
and potential negative impacts would be very modest in
scale.
- Main potential negative impacts if use on agricultural
land is not feasible: Reduced compost production;
sewage sludge has to be disposed of; increased synthetic
fertiliser use.
Option 4)
Obligation to use specific processes
Aims at reducing contamination, rather than banning certain
composts/digestates or input materials.
- Effectiveness in reducing the risks is uncertain.
- Not technology neutral (not supporting innovation and
not leaving choice of most efficient process to
operators).
Measure 4a)
Restriction on the use of MBT and sewage
sludge* based digestate as a fertiliser except
when using two-stage A/D
Targeted at specific risks (contaminants reduced by this
process are particularly linked to sewage sludge).
Associated additional costs are at least partly offset by
operational benefits, so for a share of the affected operators
there may be no negative net effects.
- A significant share of digestate is expected to be affected
and potential negative impacts could be considerable in
scale.
- For a share of the affected operators, there will be a net
cost.
- Main potential negative impacts for operators for which
the additional cost is not feasible: affected digestate (and
MBT feedstocks/sewage sludge if replaced by
alternatives) have to be disposed of; increased synthetic
fertiliser use.
Measure 4b)
Restriction on the use of sewage sludge
Targeted at specific risks (contaminants reduced by this
process are particularly linked to sewage sludge).
- Associated with additional space, time and operational
cost.

172 © Wood Environment & Infrastructure Solutions UK Limited
February 2019
Doc Ref. 40039CL003i3
Proposed risk management Main advantages Main disadvantages
digestate as a fertiliser except when
applying post-composting*
Only a low share of digestate is expected to be affected and
potential negative impacts would be modest in scale.
- Main potential negative impacts for operators for which
the additional cost is not feasible: affected digestate
(and sewage sludge if replaced by alternatives) have to
be disposed of; increased synthetic fertiliser use.
Notes:
Proposed risk management: Advantages and disadvantages associated for the main options are valid for all measures proposed under these options. The advantages and disadvantages associated with the
specific measures proposed under each option are additional to those for the option in general or specify their expected magnitude for the specific measure.
*) Only relevant if sewage sludge C/D is not restricted for use as fertiliser in general.

173 © Wood Environment & Infrastructure Solutions UK Limited
February 2019
Doc Ref. 40039CL003i3
Concentration limits
Concentration limits directly limit pollutants to levels considered to pose no (or an ‘acceptable level’ of) risk.
These levels (‘safe limits’) have been calculated in the risk assessment where possible and appropriate (see
Table 5.26). Note that where concentrations are already below existing safe limits, this implies no further risk
management is required.
Safe limits have been calculated for the realistic worst case of two different use scenarios – container growing
and application to agricultural land. Whether to apply consistent limit values for the same substances in both
scenarios will depend on a judgement between the balance of risk and ease of enforcement/compliance.
Setting different limit values for the different use scenarios would minimise the share of compost/digestate
restricted.
In broad terms, Table 5.26 also shows the share of C/D currently exceeds calculated safe levels and therefore
would be affected by setting concentration limits equal to the calculated safe limits. C/D producers would
likely be able to reduce contaminant concentrations of some C/D to comply with the limit values. However,
the proposed concentration limits for Nickel and Zinc in container growing would likely affect a large share
of C/D.
Table 5.26 Safe limit values calculated in the risk assessment and likely share of compost and digestate
currently exceeding them
Substance Safe limit
concentration in
C/D for application
to agricultural land
Safe limit
concentration in
compost for
container
growing[1]
Likely share of compost and
digestate currently exceeding safe
levels [2]
For comparison: Limit
values in the proposal
for the revised Fertilising
Products Regulation
(FPR)
Cadmium [3] [3] n/a 1.5 mg/kg dry weight
Nickel [3] 7.9 mg/kg dry
weight
Large for container growing: Most
reported median or mean
concentrations exceed the safe level.
50 mg/kg dry weight
Copper [3] 200 mg/kg dry
weight
Very low: Only a few reported
maximum concentrations exceed the
safe level.
300 mg/kg dry weight
Zinc 600 mg/kg dry
weight
70 mg/kg dry weight Very low for application to
agricultural land: Only a few
reported maximum concentrations
exceed the safe level.
Large for container growing: Most
reported median or mean
concentrations exceed the safe level.
800 mg/kg dry weight
Mercury 0.2 mg/kg dry
weight
[3] Low: Most reported median or mean
concentrations are below the safe
level.
1 mg/kg dry weight
Nonylphenol [3] 3.5 mg/kg dry
weight [4]
Low: Most reported median or mean
concentrations are below the safe
level.
None.
Notes:
1) Note that there are some uncertainties associated with the container growing scenario used, as discussed in Section 5.5.2 and
Appendix D, and so the estimated safe limits should be seen as preliminary only.
2) Likely share of compost and digestate currently exceeding safe levels is our judgement based on how many reported median, mean
or average concentrations (data collected in Appendix C) exceed the calculated safe limits. A precise quantification of the scale is not

174 © Wood Environment & Infrastructure Solutions UK Limited
February 2019
Doc Ref. 40039CL003i3
possible based on the available data. The qualitative indications (very low, low, large and very large) are meant to facilitate comparison
between different limit values.
3) Safe limit would be higher than the current levels so this is not currently seen as a concern.
4) As per the definition of ‘safe limit’ earlier in this section, this refers only to the endpoint in question (for nonylphenol this is set out in
Table 4.19). However, nonylphenol also has other adverse effects which can occur at lower concentrations.
Source FPR limit values: http://data.consilium.europa.eu/doc/document/ST-15103-2018-INIT/en/pdf
For PCBs, dioxins and furans, lead, PFAS and PAHs, any level is considered a risk and so safe limits cannot be
defined in the risk assessment. However, existing limits (e.g. in national legislation) could inform the level of
limit values. The most appropriate levels are discussed below:
PCBs: Comparison of limit values is complicated by the fact that some are for PCB6 (three
Member States + Norway, ranging between 0.1-1.2 mg/kg d.m.), some for PCB7 (five limits
from four Member States, ranging between 0.15-0.8 mg/kg d.m.) and one for PCBs in general
(POPs Regulation, not specifically for compost/digestate, 50 mg/kg d.m.). Given that stricter
limit values could still be imposed in specific Member States due to the local conditions, it
would seem more appropriate to adopt an EU-wide limit value at the higher end of the range
of Member State limit values, to ensure this level of risk control is guaranteed consistently
throughout the EU while minimising disruption. The highest limit value is for Norway (not an EU
Member State), the next highest values are 0.8 mg/kg d.m. for PCB7. Most reported
concentrations (as per Appendix C) are below this value.
Dioxins and furans: The identified limit values for two Member States (Austria, Luxembourg)
and Switzerland are all consistent, at 20 ng/kg d.m. for 17 polychlorinated dibenzo-p-
dioxins/furans (PCDD/F) expressed in International Toxicity Equivalents. Germany has a limit
value of 30 ng/kg d.m. for the sum of PCDD/F and dl-PCB, which appears roughly consistent
with the abovementioned values for PCDD/F, while Wallonia’s higher limit of 100 ng/kg d.m. for
PCDD/F is higher. Most reported maximum PCDD/F concentrations (as per Appendix C) are
below 20 ng/kg d.m.
Lead: Three limit values have been identified between 100 and 150 mg/kg d.m. Given the
extensive analysis in JRC (2014) and the proposed FPR, the FPR limit value of 120 mg/kg d.m.,
roughly in the middle of that range, appears appropriate. Most reported maximum
concentrations (as per Appendix C) are below this value.
PFAs: The identified limit values for three Member States (Austria, Denmark and Germany) are
all consistent, at 100 µg/kg d.m. for the sum of PFOA and PFOS. Most reported maximum
concentrations (as per Appendix C) are below this value.
PAHs: Most limit values are for PAH16 (five Member States + Norway + the FPR proposal,
ranging between 3-10 mg/kg d.m.), but one is for PAH11 (Denmark 3 mg/kg d.m.), and one
Member State has limits for individual PAHs (France). Given the extensive analysis in JRC (2014)
and the proposed FPR, the FPR limit value of 6 mg/kg d.m., roughly in the middle of the range
of Member State limits, appears appropriate. Most reported concentrations (as per Appendix C)
are below this value.
Setting limit values would ensure that the risk from these substances is limited EU-wide, while minimising the
disruption to those markets where limit values are already in place. However, we do not know why the
existing limit were set and what they were based on. Hence, it is not clear if existing limits are risk-based and
if they would adequately control the risks. Furthermore, Section 5.5.2 has also shown that adding limit values
for PCBs and PFAs can increase sampling costs significantly.
Of the substances prioritised for further risk management (as per Section 5.2), only for 17α-ethinylestradiol
neither calculated safe limits nor existing limit values are available. Additional criteria would be needed to
judge appropriateness of limit values for 17α-ethinylestradiol.

175 © Wood Environment & Infrastructure Solutions UK Limited
February 2019
Doc Ref. 40039CL003i3
In conclusion, it seems appropriate to set limit values for nickel, copper, zinc, mercury and
nonylphenol equal to safe limits calculated by the risk assessment. However, due to the large share of
compost currently exceeding these levels for nickel and zinc for use in container growing, it is unclear
if these specific limits would be proportionate. Additional limit values could be set for PCBs, PCDD/F,
lead, PFAs and PAHs based on existing limit values, unless the risks from these substances can be
addressed by other types of risk management or costs for sampling of PCBs, PCDD/F and PFAs are
considered prohibitive.
Summary of expected socio-economic impacts of the proposed concentration limits
Limit values based on
calculated safe limits for
application to
agricultural land
(zinc, mercury)
Only a low share of C/D currently exceeds the safe levels, so only a small quantity of C/D would be
affected and all of the below impacts would be modest in scale.
The highest zinc concentrations are found in C/D from MBT and sewage sludge; the highest mercury
concentrations were in C/D from MBT, sewage sludge, green waste and biowaste.
Regarding the affected compost:
Affected composting plants could replace the input materials with the highest concentrations
of these contaminants (see above) with alternative feedstocks, subject to some uncertainty
about economic feasibility.
If this is not feasible the affected compost would likely cease to be produced, leading to
foregone revenue from compost sales. In addition, the compost would have to be replaced
by alternative fertilisers. The most likely alternative, synthetic fertilisers, cannot fulfil
compost’s function of supplying organic matter and is associated with several additional
environmental risks.
In both cases, the input materials previously used to produce the affected compost would
then require alternative waste management, which would likely lead to additional
environmental risks and contradict environmental policy objectives.
Regarding the affected digestate:
The affected digestate may be used for alternative applications, but there is uncertainty
about their technical feasibility.
If this is not feasible, biogas production (and thus digestate production) would likely still
continue largely unchanged, because income from selling or using digestate is often
secondary to AD operators. Hence, the affected digestate would have to be disposed of,
which would likely lead to further waste management costs and additional environmental
risks and could contradict environmental policy objectives.
In addition, the affected digestate would have to be replaced by alternative fertilisers. The
most likely alternative, synthetic fertilisers, cannot fulfil digestate’s function of supplying
organic matter and is associated with several additional environmental risks.
Some AD operators may consider either changing the input materials used (as above for
compost with the same implications of alternative waste management for the input
materials) or employ a two-stage AD process (only addresses zinc). Both are subject to some
uncertainty about economic feasibility. Additional costs are associated with a two-stage AD
process, but at least partly offset by operational benefits.
Limit values based on
calculated safe limits for
container growing
(nickel, copper, zinc,
nonylphenol)
According to the market analysis, the vast majority of digestate produced in the EU is used directly as
fertiliser in agriculture. Based on this, the risk assessment has assumed that only compost is used in
container growing.
Only a low share of compost currently exceeds the safe levels for copper and nonylphenol, so only a
small quantity of compost would be affected and all of the impacts would be modest in scale.
The highest copper concentrations are found in compost from MBT and sewage sludge; the highest
nonylphenol concentrations were in compost from sewage sludge and green waste.
However, for nickel and zinc a large share of compost used in container growing would be affected, so
the impacts could be significant for the container growing segment. Note however that only up to 34%
of compost is used in container growing, corresponding to in the order of 6 million tonnes of compost.
The highest copper concentrations are found in compost from MBT, sewage sludge, green waste and
biowaste; the highest zinc concentrations are found in compost from MBT and sewage sludge.
The types of impacts expected would be the same as for the affected compost in the previous row.

176 © Wood Environment & Infrastructure Solutions UK Limited
February 2019
Doc Ref. 40039CL003i3
Summary of expected socio-economic impacts of the proposed concentration limits
Limit values based on
existing limit values
(PCBs, PCDD/F, lead,
PFAS, PAHs)
Only a low share of C/D currently exceeds the safe levels, so only a small quantity of C/D would be
affected and all of the below impacts would be modest in scale.
The highest lead concentrations are found in C/D from MBT; the highest concentrations of PCDD/F,
PFAS and PAHs are found in C/D from sewage sludge. For PCBs, no clear distinction of concentration
levels between C/D from different input materials could be established.
The types of impacts expected would be the same as for the affected C/D in the first row. However,
there are two additional considerations:
Sampling costs, particularly for PCBs, PCDD/F and PFAS, may render the production of some
composts and the use of some digestates in agriculture/soil improvement uneconomical. The
affected C/D would have to be replaced by alternative fertilisers, subject to additional
environmental risks. The input materials previously used to produce the affected compost, as
well as the produced digestate, would have to be disposed of, subject to additional waste
management costs and environmental risks.
Plants may consider employing certain processes to reduce concentrations of these
contaminants in C/D such as post-composting of digestate (PCBs and PAHs reduction) and
thermal treatment (PFAS extraction), subject to significant uncertainty about technical and
economic feasibility.
Restrictions on input materials
The concentration of contaminants in input materials is subject to variation and so the risk cannot be directly
controlled by restricting input materials. However, it is considered a potentially more workable alternative to
checking concentration limits because it does not require sampling. It would therefore be appropriate to
restrict those input materials that are the most significant sources of contaminants, which are judged of the
greatest concern in the risk assessment, for which concentration sampling is prohibitively expensive, or where
an appropriate concentration limit cannot be set:
As discussed in Section 5.5.3, sewage sludge C/D exhibits generally higher or the maximum
observed concentrations for most priority substances of concern. This includes several
substances for which no calculated safe limits are available, and concentration sampling is
(potentially) particularly expensive: 17α-ethinylestradiol, dioxins and furans, PFOA, PFOS and
PAHs. Sewage sludge also accounts for a small share of C/D input materials and so a restriction
would pose a relatively small disruption to the overall C/D market.
Compost/digestate from biowaste, greenwaste and mechanical biological treatment (MBT)
could only be associated with certainty to high concentrations of heavy metals and
nonylphenol (as discussed in Section 5.5.3). For these contaminants, calculated safe limits (Ni,
Cu, Zn, Hg, Cd) or existing limit values (Pb) to use as a basis for setting limit values are
available, and sampling costs for these contaminants are also considered largely feasible (as
discussed in Section 5.5.25.5.3). Therefore, it seems appropriate to address the risk from these
contaminants with limit values (as discussed above), which means an additional restriction of
MBT C/D might not be required to adequately control the risk. A ban on the use of MBT C/D
could potentially have a large impact on the market because MBT accounts for a significant
share (roughly a quarter) of C/D input materials. Note that it could still be appropriate to
consider an obligation to use two-stage anaerobic digestion for MBT digestate, as is discussed
further in the section on Specific processes below.
Agricultural digestate (manure and energy crops) could not be associated with high
concentrations of any priority substances of concern with certainty.
The above suggests sewage sludge based C/D poses the greatest risk, and prohibiting its use would seem to
cause the least disruption to the market. In addition, a restriction on sewage sludge would also address other

177 © Wood Environment & Infrastructure Solutions UK Limited
February 2019
Doc Ref. 40039CL003i3
contaminants that can be found in sewage sludge but have not been investigated in this report. However,
prohibiting the use of sewage sludge based C/D could reduce the incentive for improvements to treatment
of sewage sludge at waste water treatment plants and/or prevent the use of what is expected to become a
cleaner input material in the future due to these improvements. Moreover, such a restriction could lead to
more sewage sludge being applied directly instead of digested first.
In conclusion, it seems appropriate to consider prohibiting the use as fertiliser of C/D made with
sewage sludge, with an option to allow its use in the future given improvements to its treatment at
waste water treatment plants. The direct application of sewage sludge to agricultural land would have
to be restricted to be coherent with the restriction of sewage sludge C/D.
Summary of expected socio-economic impacts of the proposed restriction on input materials
Restriction on the use of
sewage sludge C/D as a
fertiliser
Only a low share of C/D is currently produced from sewage sludge, so only a small quantity of C/D
would be affected and all of the below impacts would be modest in scale. However, in order to avoid
the unintended consequence that sewage sludge is applied directly to agricultural land instead of
being digested first, coherent regulation would have to be applied to direct use of sewage sludge. This
would in turn affect a large amount of sewage sludge and thus increase the scale of impacts related to
alternative waste management for sewage sludge.
Regarding the affected compost:
Affected composting plants could replace sewage sludge with alternative feedstocks, subject
to some uncertainty about economic feasibility.
If this is not feasible the affected compost would likely cease to be produced, leading to
foregone revenue from compost sales. In addition, the compost would have to be replaced
by alternative fertilisers. The most likely alternative, synthetic fertilisers, cannot fulfil
compost’s function of supplying organic matter and is associated with several additional
environmental risks.
In both cases, sewage sludge would then require alternative waste management, which
would likely lead to additional environmental risks and could contradict environmental policy
objectives.
Regarding the affected digestate:
The affected digestate may be used for alternative applications (such as for algal cultures,
construction materials, bioethanol production or as biopesticide), but there is uncertainty
about their technical feasibility.
If this is not feasible, biogas production (and thus digestate production) would likely still
continue largely unchanged, because income from selling or using digestate is often
secondary to AD operators. Hence, the affected digestate would have to be disposed of,
which would likely lead to further waste management costs and additional environmental
risks and could contradict environmental policy objectives.
In addition, the affected digestate would have to be replaced by alternative fertilisers. The
most likely alternative, synthetic fertilisers, cannot fulfil digestate’s function of supplying
organic matter and is associated with several additional environmental risks.
Some AD operators may consider replacing sewage sludge with alternative feedstocks.
Sewage sludge would then require alternative waste management, which would likely lead to
additional environmental risks and could contradict environmental policy objectives.
Conditions of use
For nickel, copper and nonylphenol, a potential concern (measured concentrations in C/D exceed safe limits)
has only been identified for container growing but not for application to agricultural land. The risk associated
with these substances could therefore be adequately controlled by prohibiting the use of compost in
container growing (digestate does not appear to be currently used in container growing).
For lead, 17α-ethinylestradiol, HBCDD, PCBs, dioxins and furans and PFAs, safe limits could not be calculated,
but exposures at the steady state are higher for the container growing scenario than for application onto
agricultural land, and hence there is a higher risk associated with container growing. This risk could also be
addressed by prohibiting the use of compost in container growing.

178 © Wood Environment & Infrastructure Solutions UK Limited
February 2019
Doc Ref. 40039CL003i3
However, for substances for which limit values are considered appropriate (likely nickel, copper and
nonylphenol, as well as potentially lead, PCBs, dioxins and furans and PFAs), prohibiting use in container
growing would not be required, because the limit values already address the risk while minimising the
amount of C/D prohibited.
To target other specific substances, conditions of use could be applied to compost from specific input
materials. As discussed above, sewage sludge in particular is linked to several substances for which no
calculated safe limits are available.
In conclusion, it appears appropriate to consider a restriction for container growing (if C/D made from
sewage sludge is not restricted for use as fertiliser in general as discussed above).
Summary of expected socio-economic impacts of the proposed use conditions
Restriction on the use of
sewage sludge compost
in container growing
According to the market analysis, the vast majority of digestate produced in the EU is used directly as
fertiliser in agriculture. Based on this, the risk assessment has assumed that only compost is used in
container growing.
Only a low share of compost is currently produced from sewage sludge and only up to 34% of compost
is used in container growing (probably an even smaller share of sewage sludge compost), so only a
very small quantity of compost would be affected and all of the below impacts would be very modest
in scale.
Expected impacts:
If sewage sludge compost is only banned in container growing, it would likely be used in
agriculture instead, subject to some uncertainty about economic feasibility due to the
potential difference in market prices.
Alternatively, affected composting plants could replace sewage sludge with alternative
feedstocks, subject to some uncertainty about economic feasibility.
If both of the above are not feasible, the affected compost would likely cease to be
produced, leading to foregone revenue from compost sales. In addition, the compost would
have to be replaced by alternative fertilisers. The most likely alternative, synthetic fertilisers,
cannot fulfil compost’s function of supplying organic matter and is associated with several
additional environmental risks.
In the cases where sewage sludge is replaced by other input materials or the affected
compost is no longer produced, sewage sludge would require alternative waste
management. This would likely lead to additional waste management cost and
environmental risks and could contradict environmental policy objectives.
Specific processes
An obligation to use specific processes does not seem recommendable where limit values are considered
appropriate. This is because limit values directly control the concentrations of contaminants, while allowing
operators to choose themselves through which processes or other means to achieve these concentrations.
The concentration of contaminants achieved by applying specific processes depends on the removal
efficiency and the concentration of the contaminants in the input materials, both of which depend on
installation-specific conditions.
The most promising processes to reduce contaminants for which limit values have not been proposed above
are:
Two-stage anaerobic digestion can reduce cadmium, lead and PAH16 (as well as nickel, copper
and zinc, for which limit values are recommended). Particularly high cadmium and lead
concentrations have been reported in mechanical biological treatment (MBT) C/D and PAH16 in
sewage sludge C/D.
Post-composting of digestate can reduce PAH16 and PCB, which have been reported in
particularly high concentrations in sewage sludge C/D.
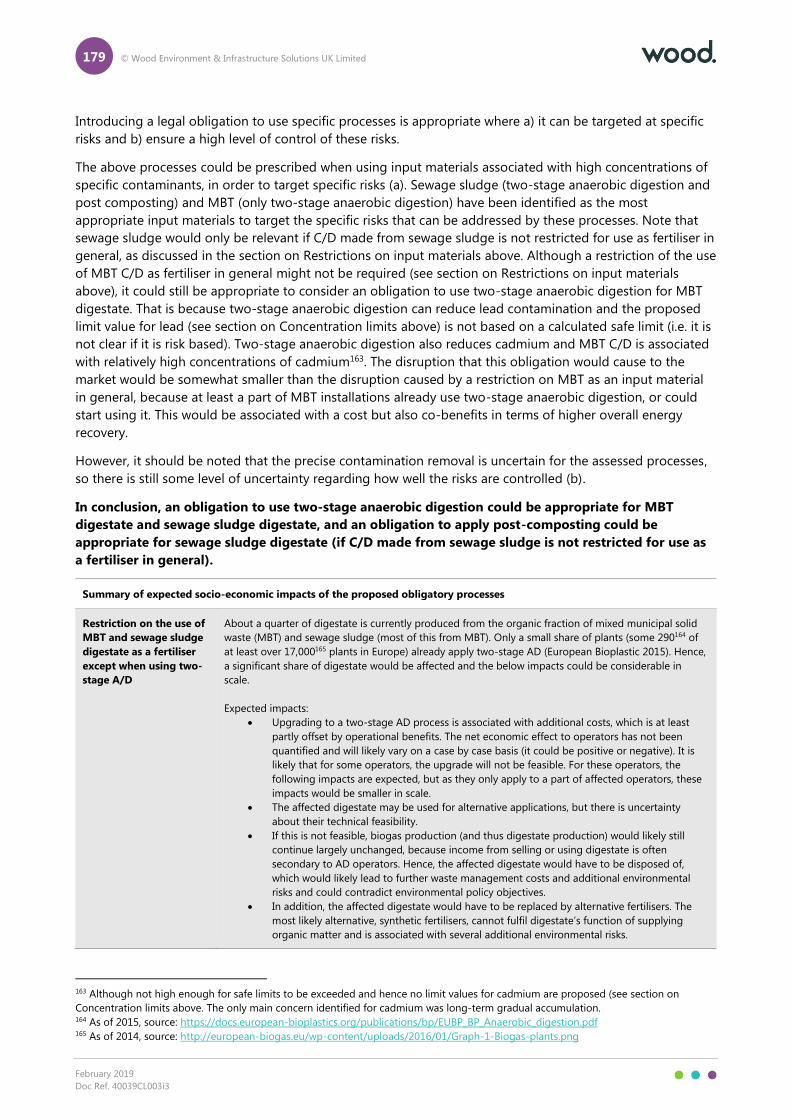
179 © Wood Environment & Infrastructure Solutions UK Limited
February 2019
Doc Ref. 40039CL003i3
Introducing a legal obligation to use specific processes is appropriate where a) it can be targeted at specific
risks and b) ensure a high level of control of these risks.
The above processes could be prescribed when using input materials associated with high concentrations of
specific contaminants, in order to target specific risks (a). Sewage sludge (two-stage anaerobic digestion and
post composting) and MBT (only two-stage anaerobic digestion) have been identified as the most
appropriate input materials to target the specific risks that can be addressed by these processes. Note that
sewage sludge would only be relevant if C/D made from sewage sludge is not restricted for use as fertiliser in
general, as discussed in the section on Restrictions on input materials above. Although a restriction of the use
of MBT C/D as fertiliser in general might not be required (see section on Restrictions on input materials
above), it could still be appropriate to consider an obligation to use two-stage anaerobic digestion for MBT
digestate. That is because two-stage anaerobic digestion can reduce lead contamination and the proposed
limit value for lead (see section on Concentration limits above) is not based on a calculated safe limit (i.e. it is
not clear if it is risk based). Two-stage anaerobic digestion also reduces cadmium and MBT C/D is associated
with relatively high concentrations of cadmium163. The disruption that this obligation would cause to the
market would be somewhat smaller than the disruption caused by a restriction on MBT as an input material
in general, because at least a part of MBT installations already use two-stage anaerobic digestion, or could
start using it. This would be associated with a cost but also co-benefits in terms of higher overall energy
recovery.
However, it should be noted that the precise contamination removal is uncertain for the assessed processes,
so there is still some level of uncertainty regarding how well the risks are controlled (b).
In conclusion, an obligation to use two-stage anaerobic digestion could be appropriate for MBT
digestate and sewage sludge digestate, and an obligation to apply post-composting could be
appropriate for sewage sludge digestate (if C/D made from sewage sludge is not restricted for use as
a fertiliser in general).
Summary of expected socio-economic impacts of the proposed obligatory processes
Restriction on the use of
MBT and sewage sludge
digestate as a fertiliser
except when using two-
stage A/D
About a quarter of digestate is currently produced from the organic fraction of mixed municipal solid
waste (MBT) and sewage sludge (most of this from MBT). Only a small share of plants (some 290164 of
at least over 17,000165 plants in Europe) already apply two-stage AD (European Bioplastic 2015). Hence,
a significant share of digestate would be affected and the below impacts could be considerable in
scale.
Expected impacts:
Upgrading to a two-stage AD process is associated with additional costs, which is at least
partly offset by operational benefits. The net economic effect to operators has not been
quantified and will likely vary on a case by case basis (it could be positive or negative). It is
likely that for some operators, the upgrade will not be feasible. For these operators, the
following impacts are expected, but as they only apply to a part of affected operators, these
impacts would be smaller in scale.
The affected digestate may be used for alternative applications, but there is uncertainty
about their technical feasibility.
If this is not feasible, biogas production (and thus digestate production) would likely still
continue largely unchanged, because income from selling or using digestate is often
secondary to AD operators. Hence, the affected digestate would have to be disposed of,
which would likely lead to further waste management costs and additional environmental
risks and could contradict environmental policy objectives.
In addition, the affected digestate would have to be replaced by alternative fertilisers. The
most likely alternative, synthetic fertilisers, cannot fulfil digestate’s function of supplying
organic matter and is associated with several additional environmental risks.
163 Although not high enough for safe limits to be exceeded and hence no limit values for cadmium are proposed (see section on
Concentration limits above. The only main concern identified for cadmium was long-term gradual accumulation. 164 As of 2015, source: https://docs.european-bioplastics.org/publications/bp/EUBP_BP_Anaerobic_digestion.pdf 165 As of 2014, source: http://european-biogas.eu/wp-content/uploads/2016/01/Graph-1-Biogas-plants.png

180 © Wood Environment & Infrastructure Solutions UK Limited
February 2019
Doc Ref. 40039CL003i3
Some AD operators may consider replacing sewage sludge and the organic fraction of mixed
municipal solid waste (MBT) with alternative feedstocks. Sewage sludge and the mixed
municipal solid waste would then require alternative waste management, which would likely
lead to additional environmental risks and could contradict environmental policy objectives.
Restriction on the use of
sewage sludge digestate
as a fertiliser except
when applying post-
composting
Only a low share of digestate is currently produced from sewage sludge and some (unquantified) share
of AD plants is likely already operating post-composting, so only a very small quantity of digestate
would be affected and all of the below impacts would be very modest in scale.
Expected impacts:
The implementation of this process would be associated with additional space, time and
operational cost.
It is likely that for some operators, the upgrade will not be feasible. For these operators, the
same impacts as in the previous row would be expected, but as they only apply to a part of
affected operators, these impacts would be even smaller in scale.
5.7.3 Legal options
Possible legal options to implement the proposed risk management measures are briefly discussed below:
Article 42(4) of the proposal for the revised Fertilising Products Regulation (FPR)166 gives the
European Commission the authority to amend the annexes167 in the light of new scientific
evidence where a risk assessment shows this is necessary to ensure that EU fertilising products
do not present a risk to human, animal, or plant health, to safety or to the environment. This
gives the Commission the power to change limit values (except for Cadmium), add new limit
values for additional contaminants, change allowed input materials and change process
requirements for composting/digestion. However, the FPR only applies to CE-marked fertilisers.
National fertilisers can still co-exist without following the FPR (European Commission 2018b).
REACH restriction: This is a flexible risk management tool, allowing specific uses of substances
to be banned or otherwise restricted. Depending on the scope and definitions applied, it
therefore has the potential to be effective in addressing the risks to the environment.
Compared to a restriction introduced through a dedicated legal instrument (ad-hoc legislation),
it also has the potential to be implemented rapidly.
Possible bespoke legislation: This is more time-consuming to implement and feasibility
depends on a range of factors including judgement about the relative risk of contamination
from C/D compared to other environmental concerns. However, bespoke legislation may be
necessary if using existing legislation such as the FPR or REACH is not feasible.
Waste Framework Directive: Article 6 (1) and (2) of the Waste Framework Directive
(2008/98/EC) provides a procedure for defining criteria that wastes undergoing a recovery
operation have to fulfil in order to cease to be waste and receive product status (end-of-waste
criteria). According to Article 6(1), these criteria “shall include limit values for pollutants where
necessary and shall take into account any possible adverse environmental effects”. As discussed
in JRC (2014), end-of-waste criteria could be developed for and applied to all C/D, or a sub-
group of C/D (e.g. made from specific input materials). However, the results of JRC (2014) were
in the end not used to define end-of-waste-criteria, but instead to inform provisions under the
revised Fertilising Products Regulation. It is therefore uncertain if end-of-waste criteria are
feasible.
166 http://data.consilium.europa.eu/doc/document/ST-15103-2018-INIT/en/pdf 167 With the exception of cadmium limit values and the definitions, or other elements relating to scope, of product function categories.

181 © Wood Environment & Infrastructure Solutions UK Limited
February 2019
Doc Ref. 40039CL003i3
Other waste legislation: In addition, there are specific pieces of legislation regulating the use of
specific waste streams that are also used as input materials for C/D.
For instance, the Sewage Sludge Directive 86/278/EEC seeks to encourage the use of
sewage sludge in agriculture but also regulates the use of sewage sludge to prevent harmful
effects on the environment and man by setting limit values for heavy metals. This does not
currently apply to treated sewage sludge (such as C/D from sewage sludge). It could be
further investigated whether the Directive could be revised to include limit values for treated
sewage sludge and add limit values for additional contaminants.
The Urban Waste Water Treatment Directive encourages the re-use of sewage sludge
“whenever appropriate”, while “minimising adverse effects on the environment”, however no
targets or risk management measures are specified. It could be further investigated whether
the Directive could be revised to include additional specifications on sewage sludge
resulting from urban waste water treatment. The Directive is currently undergoing an
evaluation, which might trigger revision of the Directive in the future.

182 © Wood Environment & Infrastructure Solutions UK Limited
February 2019
Doc Ref. 40039CL003i3
Glossary
AD: Anaerobic digestion.
BCF: Bioconcentration. Accumulation of a chemical in or on an organism when the source of chemical
is solely water.
BMDL10: Benchmark dose level. Study endpoint that is associated with a 10% extra risk of adverse effect in
the exposed test animals, as compared to the background levels of risk.
BPA: Bisphenol-A.
C/D: Compost and/or digestate.
Cd, Cu, Hg, Ni, Pb, Zn:
Chemical element symbols for the heavy metals cadmium, copper, mercury, nickel, lead and zinc.
DEHP: Di(2-ethylhexyl)phthalates.
dw/dm: dw - dry weight; dm – dry mass.
EBA: European Biogas Association.
ECN: European Compost Network.
ECN-QAS: European Compost Network Quality Assurance Scheme for Compost and Digestate.
EQS: Environmental Quality Standard in accordance with the Water Framework Directive (2000/60/EC).
ESR: Council Regulation (EEC) No 793/93, also known as the Existing Substances Regulation (ESR).
Repealed by the REACH Regulation (EC) No 1907/2006.
EUSES: European Union System for the Evaluation of Substances (EUSES), a decision-support instrument
to carry out rapid and efficient assessments of the general risks posed by chemical substances.
Fertiliser: It should be noted that C/D, particularly compost, fulfil other functions than fertilisation, such as
adding organic matter to the soil. However, for simplicity we refer to the main function as fertiliser
throughout the report, except where the specific function is relevant for the analysis.
Abbreviated fertilisers (N/P/K fertiliser) refer to synthetic fertilisers containing the following
macronutrients: N – nitrogen, P – phosphorus, K – potassium.
FPR: Fertilising Products Regulation (Proposal for a Regulation of the European Parliament and the
Council laying down rules on the making available on the market of CE marked fertilising
products and amending Regulations (EC) No 1069/2009 and (EC) No 1107/2009).
HBCDD: Hexabromocyclododecane.
Input materials:
Feedstocks used to produce compost or in anaerobic digestion (producing biogas and digestate).
Koc/Kow: Koc: Soil Organic Carbon-Water Partitioning Coefficient. The ratio of the adsorbed organic analyte
to the dissolved;
Kow: Octanol-Water Partition Coefficient.
183 © Wood Environment & Infrastructure Solutions UK Limited
February 2019
Doc Ref. 40039CL003i3
MBT: Mechanical Biological Treatment processing mixed waste, particularly mixed municipal solid
waste.
MSW: Municipal solid waste.
PAH: Polycyclic aromatic hydrocarbons.
PAH2, PAH4, PAH16, etc. are indicators to measure PAHs. The most common is:
PAH16= sum of US EPA 16 priority listed polycyclic aromatic hydrocarbons.
PBT: Persistent, bioaccumulative, toxic.
PCB: Polychlorinated biphenyls.
PCB6, PCB7 etc. are indicators to measure PCBs. The most common are:
PCB6=sum of PCBs 28, 52, 101, 138, 153 and 180;
PCB7=sum of PCBs 28, 52, 101, 118, 138, 153 and 180; 2,4,4'-Trichlorobiphenyl (PCB28).
PCDD/F: Dioxins and furans. Sum of 17 polychlorinated dibenzo-p-dioxins/furans expressed in
International Toxicity Equivalents.
Specific dioxins and furans: 2,3,7,8-Tetrachlorodibenzodioxin (TCDD), 2,3,4,7,8-
Pentachlorodibenzofuran (PCDF).
PFAS: Per- and Polyfluoroalkyl Substances.
Specific PFAS: Perfluoroctanoic acid (PFOA), Perfluoroctanesulfonic acid (PFOS), Perfluorohexanoic
acid (PFHxA).
POPs: Persistent Organic Pollutants.
RAC and SEAC:
ECHA's Committee for Socio-economic Analysis (SEAC) and Committee for Risk Assessment
(RAC).
RCR, PEC, PNEC, DNEL: Risk characterisation ratios (RCRs) are derived by comparing exposure levels to
suitable predicted no-effect concentrations (PNECs) or derived no-effect levels (DNELs). For the
environmental end-points, this is the ratio of predicted environmental concentration (PEC) to
PNEC. RCR=PEC/PNEC or Exposure/DNEL.
REACH: Regulation (EC) No 1907/2006 of the European Parliament and of the Council on the Registration,
Evaluation, Authorisation and Restriction of Chemicals.
RMOA: Risk management options analysis.
Safe limit: For the endpoints where conventional quantitative risk characterisation is appropriate, a limit
below which adverse effects are not expected has been calculated. This is referred to as “safe
limit” throughout the report. Note that this does not preclude possible other effects at lower
concentrations, related to other endpoints for which quantitative risk characterisation was not
possible.
Scenario I: Compost and digestate products, handling and application as soil amendment, including
application of compost; whole digestate; crude dry fibre and all liquid products.
Scenario II: Compost used as a growing medium, e.g. for consumer (hobby) and professional growers.
SVHC: Substance of very high concern. Substance on the Candidate List for Authorisation under the
REACH Regulation.

184 © Wood Environment & Infrastructure Solutions UK Limited
February 2019
Doc Ref. 40039CL003i3
TEF/TEQ: Toxic Equivalency Factors (TEFs) and Toxic Equivalent (TEQ) express the weighted concentration
equivalent to the most toxic dioxin 2,3,7,8-tetrachlorodibenzo-p-dioxin (TCDD).
vPvB: Very persistent, very bioaccumulative.

185 © Wood Environment & Infrastructure Solutions UK Limited
February 2019
Doc Ref. 40039CL003i3
Bibliography
A. Bouskova, M. Dohanyos, J.E. Schmidt, I. Angelidaki. (2005). Strategies for changing temperature from
mesophilic to thermophilic conditions in anaerobic CSTR reactors treating sewage sludge. Water Research 39,
1481–1488.
Abdel-Shafy, H. I., & Mansour, M. S. (2014). Biogas production as affected by heavy metals in the anaerobic
digestion of sludge. Egyptian Journal of Petroleum, 23(4), 409-417.
Ademe. (2017) Etude comparative de la Tazation de l’Elimination des Dechets en Europe. [Viewed 21 January
2019] Available at:
https://www.ademe.fr/sites/default/files/assets/documents/etude_comparative_taxation_elimination_dechets_
europe_201703_rapport.pdf
AHDB. (2016). 2016 Pig cost of production in selected countries. [Viewed 21 January 2019] Available at:
https://pork.ahdb.org.uk/media/274535/2016-pig-cost-of-production-in-selected-countries.pdf
AHDB. (2017). Nutrient Management Guide (RB209). [Viewed 21 January 2019] Available at:
https://media.ahdb.org.uk/media/Default/Imported%20Publication%20Docs/RB209%20Organic%20materials.
pdf :
(https://media.ahdb.org.uk/media/Default/Imported%20Publication%20Docs/RB209%20Organic%20material
s.pdf
Almendro-Candel, M. B., Navarro-Pedreño, J., Jordán, M. M., Gómez, I., & Melendez-Pastor, I. (2014). Use
of municipal solid waste compost to reclaim limestone quarries mine spoils as soil amendments: Effects on
Cd and Ni. Journal of Geochemical Exploration, 144, 363-366. [Viewed 21 January 2019] Available at:
https://www.researchgate.net/publication/259127831_Use_of_Municipal_Solid_Waste_Compost_to_reclaim
_limestone_quarries_mine_spoils_as_soil_amendments_effects_on_Cd_and_Ni
Battery University (2016) BU-103: Global Battery Markets. [Viewed 21 January 2019] Available at:
https://batteryuniversity.com/learn/article/global_battery_markets
BBC (2014). Why your toilet needs reinventing. [Viewed 21 January 2019] Available at:
http://www.bbc.com/future/story/20140826-why-your-toilet-needs-reinvention
Biomass Futures (2012). Atlas of EU biomass potentials Deliverable 3.3: Spatially detailed and quantified
overview of EU biomass potential taking into account the main criteria determining biomass availability from
different sources. [Viewed 21 January 2019] Available at:
https://ec.europa.eu/energy/intelligent/projects/sites/iee-
projects/files/projects/documents/biomass_futures_atlas_of_technical_and_economic_biomass_potential_en.p
df
BKH Consulting Engineers, TNO Nutrition and Food Research (2000). Towards the establishment of a priority
list of substances for further evaluation of their role in endocrine disruption. [Viewed 18 January 2019].
Available from: http://ec.europa.eu/environment/archives/docum/pdf/bkh_main.pdf
Borišev, M., Pajević, S., Nikolić, N., Pilipović, A., Arsenov, D., & Župunski, M. (2018). Mine Site Restoration Using
Silvicultural Approach. Bio-Geotechnologies for Mine Site Rehabilitation (pp. 115-130). [Viewed 21 January
2019] Available at:
https://www.researchgate.net/publication/322313605_Mine_Site_Restoration_Using_Silvicultural_Approach
Boušková, A., Dohanyos, M., Schmidt, J. E., & Angelidaki, I. (2005). Strategies for changing temperature from
mesophilic to thermophilic conditions in anaerobic CSTR reactors treating sewage sludge. Water Research,
39(8), 1481-1488.
186 © Wood Environment & Infrastructure Solutions UK Limited
February 2019
Doc Ref. 40039CL003i3
Brändli, R. C. Bucheli, T. D. Kupper, T. Mayer, J. Stadelmann, F. X. Tarradellas, J. (2007). Fate of PCBs, PAHs and
their source characteristic ratios during composting and digestion of source-separated organic waste in full-
scale plants. Environmental Pollution 148, 520-528.
Brändli, R. C., Bucheli, T. D., Kupper, T., Mayer, J., Stadelmann, F. X., & Tarradellas, J. (2007). Fate of PCBs, PAHs
and their source characteristic ratios during composting and digestion of source-separated organic waste in
full-scale plants. Environmental Pollution, 148(2), 520-528. [Viewed 21 January 2019] Available at:
http://citeseerx.ist.psu.edu/viewdoc/download?doi=10.1.1.512.36&rep=rep1&type=pdf
Brendel, S., Fetter, É., Staude, C., Vierke, L., & Biegel-Engler, A. (2018). Short-chain perfluoroalkyl acids:
environmental concerns and a regulatory strategy under REACH. Environmental Sciences Europe, 30(1), 9.
BSEM (2008). The Health Effects of Waste Incinerators. [Viewed 21 January 2019] Available at:
https://consult.environment-agency.gov.uk/psc/mk43-9ly-covanta-energy-
limited/consultation/download_public_attachment?sqId=question.2017-02-24.7741831541-
publishablefilesubquestion&uuId=855014509
Case, S. D., Hou, Y., Oelofse, M., Oenema, O., & Jensen, L. S. FARMER ATTITUDES AND POTENTIAL
BARRIERS TO THE USE OF PROCESSED ORGANIC FERTILISERS. Efficient use of different sources of
nitrogen in agriculture–from theory to practice Skara, Sweden 27 June–29 June 2016, 42. [Viewed 21
January 2019] Available at: http://akkonferens.slu.se/nitrogenworkshop/wp-
content/uploads/sites/18/2014/05/Nitrogen-Absracts-USB_ny.pdf
CBS (2012). Co-vergisting van dierlijke mest 2006–2011. [Viewed 21 January 2019] Available at:
https://www.cbs.nl/-/media/imported/documents/2012/31/2012-co-vergisting-dierlijk-mest-2006-2011-
art.pdf
Cea-Barcia, G., Carrère, H., Steyer, J. P., & Patureau, D. (2013). Evidence for PAH removal coupled to the first
steps of anaerobic digestion in sewage sludge. International Journal of Chemical Engineering, 2013.
CEWEP (2017). Landfill Taxes and Bans Overview. [Viewed 21 January 2019] Available at:
http://www.cewep.eu/wp-content/uploads/2017/12/Landfill-taxes-and-bans-overview.pdf
De Meester, S., Demeyer, J., Velghe, F., Peene, A., Van Langenhove, H., & Dewulf, J. (2012). The environmental
sustainability of anaerobic digestion as a biomass valorization technology. Bioresource technology, 121, 396-
403.
Defra (2013). Advanced Thermal Treatment of Municipal Solid Waste. [Viewed 21 January 2019] Available at:
https://assets.publishing.service.gov.uk/government/uploads/system/uploads/attachment_data/file/221035/p
b13888-thermal-treatment-waste.pdf
Directive 2008/98/EC of 19 November 2008 on waste and repealing certain Directives (“Waste Framework
Directive”). [Viewed 21 January 2019] Available at: https://eur-lex.europa.eu/legal-
content/EN/TXT/?qid=1545405546827&uri=CELEX:02008L0098-20180705
Donatello, S., & Cheeseman, C. R. (2013). Recycling and recovery routes for incinerated sewage sludge ash
(ISSA): A review. Waste Management, 33(11), 2328-2340.
EBA (2013). EBA opinion on the digestate drying at biogas plants. [Viewed 21 January 2019] Available at:
http://european-biogas.eu/wp-content/uploads/files/2013/10/EBA-opinion_Digestate-drying_220513.pdf
EBA (2015). Digestate Factsheet: The value of organic fertilisers for Europe’s economy, society and environment.
[Viewed 21 January 2019] Available at: http://european-biogas.eu/wp-content/uploads/2015/07/Digestate-
paper-final-08072015.pdf
ECHA (2007). ECHA (2007). Guidance for the preparation of an Annex XV dossier for restrictions. [Viewed 18
January 2019]. Available from:

187 © Wood Environment & Infrastructure Solutions UK Limited
February 2019
Doc Ref. 40039CL003i3
https://echa.europa.eu/documents/10162/23036412/restriction_en.pdf/d48a00bf-cd8d-4575-8acc-
c1bbe9f9c3f6
ECHA (2014). Committee for Risk Assessment (RAC) Committee for Socio-economic Analysis (SEAC):
Background document to the Opinion on the Annex XV dossier proposing restrictions on NONYLPHENOL and
NONYLPHENOL ETHOXYLATES. [Viewed 21 January 2019] Available at:
https://echa.europa.eu/documents/10162/8bdb40dc-1367-480e-8d81-b5d308bc5f81
ECHA (2018a). Intentionally added microplastics likely to accumulate in terrestrial and freshwater
environments. [Viewed 18 January 2019]. Available from: https://echa.europa.eu/-/intentionally-added-
microplastics-likely-to-accumulate-in-terrestrial-and-freshwater-environments
ECHA (2018b). Consultation on four phthalates for updating their Authorisation List entries with endocrine
disrupting properties. [Viewed 18 January 2019]. Available from: https://echa.europa.eu/-/consultation-on-
four-phthalates-for-updating-their-authorisation-list-entries-with-endocrine-disrupting-properties
ECHA (2018c). Proposal for Identification of a Substance of Very High Concern on the Basis of the Criteria set
out in REACH Article 57. [Viewed 21 January 2019]. Available from:
https://echa.europa.eu/documents/10162/3b44eacf-e1f4-4ee7-6daa-f09945c8e3a7
ECHA (2018d). Substance information. [Viewed 21 January 2019] Available at:
https://echa.europa.eu/substance-information/-/substanceinfo/100.028.320#parentGroups
ECHA (2018e). New strategy promotes substitution to safer chemicals in the EU. [Viewed 21 January 2019]
Available at: https://echa.europa.eu/-/new-strategy-promotes-substitution-to-safer-chemicals-in-the-eu
ECHA (2019). Registry of restriction intentions. [Viewed 21 January 2019] Available at:
https://echa.europa.eu/registry-of-restriction-intentions/-/dislist/details/0b0236e18244cd73
ECN (2016a). ECN Country Report Lithuania. [Viewed 18 January 2019]. Available from:
https://www.compostnetwork.info/download/country-report-lithuania/
ECN (2016b). Bio-waste Recycling in Europe Against the Backdrop of the Circular Economy Package. [Viewed
21 January 2019] Available at: https://www.compostnetwork.info/download/bio-waste-recycling-europe-
backdrop-circular-economy-package/
ECN (2017). ECN Country Report Hungary. [Viewed 18 January 2019]. Available from:
https://www.compostnetwork.info/download/country-report-hungary/
ECN (2018). ECN Quality Manual ECN-QAS European Quality Assurance Scheme for Compost and Digestate.
[Viewed 21 January 2019] Available at: https://www.compostnetwork.info/ecn-qas/ecn-qas-manual/
Enviropacific (2017). Treatment of PFAS in Soils, Sediments and Water. [Viewed 21 January 2019] Available at:
http://www.enviropacific.com.au/wp-content/uploads/2016/09/Enviropacific_Treatment-of-PFAS.pdf
EPA (1995). A Handbook of Constructed Wetlands. [Viewed 21 January 2019] Available at:
https://www.epa.gov/sites/production/files/2015-10/documents/constructed-wetlands-handbook.pdf
EPA (2014). Guidance Note on Daily and Intermediate cover at Landfills. [Viewed 21 January 2019] Available at:
https://www.epa.ie/pubs/advice/waste/waste/EPA_Guidance_Note_On_Landfill_Daily_And_Intermediate_Cove
r_Final.pdf
Epoxy Resins Committee (2015). The Socio-Economic Value of Epoxy Resins – Main Findings. [Viewed 21
January 2019] Available at: https://epoxy-europe.eu/wp-
content/uploads/2016/09/epoxy_socioeconomic_study_main_findings_may2015.pdf
EPRS (2017). CE marked fertilising products. [Viewed 21 January 2019] Available at:
http://www.europarl.europa.eu/RegData/etudes/BRIE/2016/582010/EPRS_BRI(2016)582010_EN.pdf

188 © Wood Environment & Infrastructure Solutions UK Limited
February 2019
Doc Ref. 40039CL003i3
Eunomia Research & Consulting (2018). Final Implementation Report for Directive 86/278/EEC on Sewage
Sludge: 2013 – 2015 Service request under the framework contract No ENV.C.2/FRA/2013/0023. [Viewed 18
January 2019]. Available from:
http://ec.europa.eu/environment/archives/waste/reporting/pdf/Final_Implementation_Report_2013_2015_Se
wage_Sludge.pdf
Eunomia (2001). Costs for municipal waste management in the EU. [Viewed 21 January 2019] Available at:
http://ec.europa.eu/environment/waste/studies/pdf/eucostwaste.pdf
Eunomia (2002). Economic analysis of options for managing biodegradable municipal waste. [Viewed 21
January 2019] Available at: http://ec.europa.eu/environment/waste/compost/pdf/econanalysis_finalreport.pdf
European Bioplastics (2015). Anaerobic Digestion. [Viewed 21 January 2019] Available at:
https://docs.european-bioplastics.org/publications/bp/EUBP_BP_Anaerobic_digestion.pdf
European Commission (2015). Closing the loop - An EU action plan for the Circular Economy. [Viewed 21
January 2019] Available at: https://eur-lex.europa.eu/resource.html?uri=cellar:8a8ef5e8-99a0-11e5-b3b7-
01aa75ed71a1.0012.02/DOC_1&format=PDF
European Commission (2018). Directive (EU) 2018/850 of the European Parliament and of the Council of 30
May 2018 amending Directive 1999/31/EC on the landfill of waste. [Viewed 21 January 2019] Available at:
https://eur-lex.europa.eu/legal-content/EN/TXT/?uri=uriserv:OJ.L_.2018.150.01.0100.01.ENG
European Commission, Van Dijk Management Consultants, Arcadia International and BiPRO. (2012). Study on
options to fully harmonise the EU legislation on fertilising materials including technical feasibility,
environmental, economic and social impacts. [Viewed 21 January 2019] Available at:
https://publications.europa.eu/en/publication-detail/-/publication/cd71a3b5-ddf3-4896-bd79-
d3a91108a5dd
European Commission (2002). European Union Risk Assessment Report for 4-nonylphenol (branched) and
nonylphenol. [Viewed 18 January 2019]. Available from: https://echa.europa.eu/documents/10162/6c460d8a-
9f18-475f-823c-b8941e18fa3a
European Commission (2005). Common Implementation Strategy for the Water Framework Directive
Environmental Quality Standards (EQS) Substance Data Sheet. [Viewed 18 January 2019]. Available from:
https://circabc.europa.eu/sd/a/337d62ba-6a8f-49ce-9c0e-
591bb248e560/12_DEHP_EQS_Final%20Data%20Sheet.pdf
European Commission (2011). Hexabromocyclododecane EQS. [Viewed 18 January 2019]. Available from:
https://circabc.europa.eu/sd/a/086ffe7c-8e63-4893-baac-
994f3ff0eb34/HBCDD%20EQS%20dossier%202011.pdf
European Commission (2016a). Proposal for a REGULATION OF THE EUROPEAN PARLIAMENT AND OF THE
COUNCIL laying down rules on the making available on the market of CE marked fertilising products and
amending Regulations (EC) No 1069/2009 and (EC) No 1107/2009 COM/2016/0157 final - 2016/084 (COD).
[Viewed 21 January 2019] Available at: https://eur-lex.europa.eu/legal-
content/EN/TXT/?qid=1522845914465&uri=CELEX:52016PC0157
European Commission (2016b). Waste Landfill. [Viewed 21 January 2019] Available at:
http://ec.europa.eu/environment/waste/landfill_index.htm
European Commission (2016c). Directive 2008/98/EC on waste (Waste Framework Directive). [Viewed 21
January 2019] Available at: http://ec.europa.eu/environment/waste/framework/
European Commission (2017). Waste Review of Waste Policy and Legislation. [Viewed 21 January 2019]
Available at: http://ec.europa.eu/environment/waste/target_review.htm

189 © Wood Environment & Infrastructure Solutions UK Limited
February 2019
Doc Ref. 40039CL003i3
European Commission (2018a). Commission Regulation (EU) 2018/2005 of 17 December 2018 amending
Annex XVII to Regulation (EC) No 1907/2006 of the European Parliament and of the Council concerning the
Registration, Evaluation, Authorisation and Restriction of Chemicals (REACH) as regards bis(2-ethylhexyl)
phthalate (DEHP), dibutyl phthalate (DBP), benzyl butyl phthalate (BBP) and diisobutyl phthalate (DIBP).
[Viewed 18 January 2019]. Available from: https://eur-lex.europa.eu/legal-
content/EN/TXT/?uri=CELEX:32018R2005
European Commission (2018b). Interinstitutional File: 2016/0084(COD) Proposal for a REGULATION OF THE
EUROPEAN PARLIAMENT AND OF THE COUNCIL laying down rules on the making available on the market of
CE marked fertilising products and amending Regulations (EC) No 1069/2009 and (EC) No 1107/2009. [Viewed
21 January 2019] Available at: http://data.consilium.europa.eu/doc/document/ST-15103-2018-INIT/en/pdf
European Commission (2018c). Proposal for a review of the Drinking Water Directive adopted by the European
Commission on 1 February 2018. [Viewed 21 January 2019] Available at:
http://ec.europa.eu/environment/water/water-drink/pdf/revised_drinking_water_directive.pdf
European Commission (2018d). Circular Economy: New rules will make EU the global front-runner in waste
management and recycling. [Viewed 21 January 2019] Available at: http://europa.eu/rapid/press-release_IP-
18-3846_en.htm
European Commission (2018e). Circular Economy – Implementation of the Circular Economy Action Plan.
[Viewed 21 January 2019] Available at: http://ec.europa.eu/environment/circular-economy/index_en.htm
European Environmental Agency (2013). Typical charge (gate fee and landfill tax) for legal landfilling of non-
hazardous municipal waste in EU Member States and regions. [Viewed 21 January 2019] Available at:
https://www.eea.europa.eu/data-and-maps/figures/typical-charge-gate-fee-and
European Food Safety Authority, EFSA (2012). Cadmium dietary exposure in the European Population.
European Food Safety Authority, EFSA Journal, 2012, 10(1): 2551.
Eurostat. (2015a). Overview of the agricultural inputs sector in the EU. [Viewed 21 January 2019] Available at:
http://ec.europa.eu/eurostat/statistics-explained/index.php?title=Glossary:Organic_fertiliser
Eurostat (2015b). Archive: Fertiliser consumption and nutrient balance statistics. [Viewed 21 January 2019]
Available at: https://ec.europa.eu/eurostat/statistics-
explained/index.php/Archive:Fertiliser_consumption_and_nutrient_balance_statistics
Eurostat (2018a). File: Municipal waste landfilled, incinerated, recycled and composted in the EU-28, 1995 to
2016 .png. [Viewed 21 January 2019] Available at: https://ec.europa.eu/eurostat/statistics-
explained/index.php?title=File:Municipal_waste_landfilled,_incinerated,_recycled_and_composted_in_the_EU-
28,_1995_to_2016_.png
Eurostat (2018b). Incineration. [Viewed 21 January 2019] Available at:
https://ec.europa.eu/eurostat/web/waste/waste-generation-and-management/management/incineration
Eurostat (2018c). Agri-environmental indicator - mineral fertiliser consumption. [Viewed 21 January 2019]
Available at: https://ec.europa.eu/eurostat/statistics-explained/index.php/Agri-environmental_indicator_-
_mineral_fertiliser_consumption#Further_Eurostat_information
Eurostat (2018d). Agri-environmental indicator – risk of pollution by phosphorus. [Viewed 21 January 2019]
Available at: http://ec.europa.eu/eurostat/statistics-explained/index.php?title=Agri-environmental_indicator_-
_risk_of_pollution_by_phosphorus
Evans G. (2001). Biowaste and biological waste treatment; James & James; ISBN 1-902916-08-05.
Fachverband Biogas, EBA, BiPRO. (2013). Digestate and REACH – Position Paper. [Viewed 18 January 2019].
Available from: http://european-biogas.eu/wp-content/uploads/files/2013/11/2013-11-28-Position-paper-
digestate-and-REACH-EN-final.pdf

190 © Wood Environment & Infrastructure Solutions UK Limited
February 2019
Doc Ref. 40039CL003i3
FAO (2006). Fertilizers use by crop. [Viewed 21 January 2019] Available at:
http://www.fao.org/tempref/docrep/fao/009/a0787e/A0787E00.pdf
Farmers Weekly (2018). Pig production costs at four-year high as feed costs spiral. [Viewed 21 January 2019]
Available at: https://www.fwi.co.uk/business/markets-and-trends/meat-prices/pig-production-costs-at-four-
year-high-as-feed-costs-spiral
Food and Environment Research Agency (FERA) (2011). Assessing the potential for the upstream control of
contaminants present in materials spread to land. Report produced on behalf of Defra. [Viewed 21 January
2019] Available at: http://randd.defra.gov.uk/Document.aspx?Document=SP0578_10137_FRP.pdf
Friends of the Earth (2008). Autoclaving. [Viewed 21 January 2019] Available at:
https://friendsoftheearth.uk/sites/default/files/downloads/autoclaving.pdf
Friends of the Earth (2009). Pyrolysis, gasification and plasma. [Viewed 21 January 2019] Available at:
https://friendsoftheearth.uk/sites/default/files/downloads/gasification_pyrolysis.pdf
Galloway, J. N., Winiwarter, W., Leip, A., Leach, A. M., Bleeker, A., & Erisman, J. W. (2014). Nitrogen
footprints: past, present and future. Environmental Research Letters, 9(11), 115003. [Viewed 21 January 2019]
Available at: http://iopscience.iop.org/article/10.1088/1748-9326/9/11/115003/pdf
HVC. (2018). Dutch Experience of Sludge Management and P-Recovery Pathways. [Viewed 21 January 2019]
Available at: http://www.nweurope.eu/media/3386/1_p4y_environ2018_hvc-snb_ruijter.pdf
IPPTS Anaerobic Digestion. (2018). Two Stage Anaerobic Digestion. [Viewed 21 January 2019] Available at:
https://anaerobic-digestion.com/anaerobic-digestion-technology/two-stage-anaerobic-digestion/
JRC (2012). FATE SEES Results of a Pan-European Snapshot of randomly taken sewage sludge sample. [Viewed
21 January 2019] Available at:
http://ec.europa.eu/environment/archives/waste/sludge/pdf/FATE_SEES_pres.pdf
JRC (2014). End-of-waste criteria for biodegradable waste subjected to biological treatment (compost &
digestate). [Viewed 18 January 2019]. Available from:
http://publications.jrc.ec.europa.eu/repository/bitstream/JRC87124/eow%20biodegradable%20waste%20final
%20report.pdf
Kapanen, A., Vikman, M., Rajasärkkä, J., Virta, M., & Itävaara, M. (2013). Biotests for environmental quality
assessment of composted sewage sludge. Waste management, 33(6), 1451-1460.
Kupper T., Bucheli T. D., Brändli R. C., Ortelli D., Edder P. (2008). Dissipation of pesticides during composting
and anaerobic digestion of source-separated waste at full-scale plants. Bioresource Technology 99, 7088-7994.
Lehtomäki, A., & Björnsson, L. (2006). Two-stage anaerobic digestion of energy crops: methane production,
nitrogen mineralisation and heavy metal mobilisation. Environmental technology, 27(2), 209-218. [Viewed 21
January 2019] Available at: https://www.tandfonline.com/doi/abs/10.1080/09593332708618635
Lemvig Biogas (2008). Biogas Handbook. [Viewed 21 January 2019] Available at:
http://www.lemvigbiogas.com/BiogasHandbook.pdf
Limam I, Mezni M, Guenne A, Madigou C, Driss MR, Bouchez T, Mazéas L. (2012). Evaluation of
biodegradability of phenol and bisphenol A during mesophilic and thermophilic municipal solid waste
anaerobic digestion using 13C-labeled contaminants. Chemosphere.
Liu, T., Chen, X., Hu, F., Ran, W., Shen, Q., Li, H., & Whalen, J. K. (2016). Carbon-rich organic fertilizers to
increase soil biodiversity: evidence from a meta-analysis of nematode communities. Agriculture, Ecosystems
& Environment, 232, 199-207. [Viewed 21 January 2019] Available at:
https://pubag.nal.usda.gov/catalog/5509204 )

191 © Wood Environment & Infrastructure Solutions UK Limited
February 2019
Doc Ref. 40039CL003i3
Madsen PL, Thyme JB, Henriksen K, Moldrup P, Roslev P (1999). Kinetics of di-(2-ethylhexyl) phthalate
mineralization in sludge amended soil. Environ Sci Technol 33:2601–2606.
Massaro, V., Digiesi, S., Mossa, G., & Ranieri, L. (2015). The sustainability of anaerobic digestion plants: a win–
win strategy for public and private bodies. Journal of Cleaner Production, 104, 445-459.
Minamata Convention (2019). Text and Annexes [Viewed 21 January 2019] Available at:
http://www.mercuryconvention.org/Convention/tabid/3426/Default.aspx
Muñoz, M., Garrido, M. A., Gomez-Rico, M. F., & Font, R. (2018). PCDD/F determination in sewage sludge
composting. Influence of aeration and the presence of PCP. Science of The Total Environment, 616, 763-773.
N. Paterakis , T.Y. Chiua , Y.K.K. Kohb , J.N. Lestera , E.J. McAdama , M.D. Scrimshawc , A. Soaresa , E. Cartmella.
(2012). The effectiveness of anaerobic digestion in removing estrogens and nonylphenolethoxylates. Cranfield
University, UK.
NIBusiness Info. How to manage organic waste Physical and chemical treatment of organic waste. [Viewed 21
January 2019] Available at: https://www.nibusinessinfo.co.uk/content/physical-and-chemical-treatment-
organic-waste
Paterakis, N., Chiu, T.Y., Koh, Y.K.K., Lester, J.N., McAdam, E.J., Scrimshaw, M.D., Soares, A. and Cartmell, E.,
2012. The effectiveness of anaerobic digestion in removing estrogens and nonylphenol ethoxylates. Journal of
hazardous materials, 199, pp.88-95. [Viewed 21 January 2019] Available at:
https://bura.brunel.ac.uk/bitstream/2438/8869/9/Fulltext.pdf
R. Selling, T. Håkansson and L. Björnsson (2007). Two-stage anaerobic digestion enables heavy metal removal.
[Viewed 21 January 2019] Available at:
http://documents.er.dtu.dk/Projects/Biogasoresund/Library/AD11/Sverige/PP5C.4_Selling.pdf
Reeh, U., & Møller, J. (2002). Evaluation of different biological waste treatment strategies. Urban Areas-Rural
Areas and Recycling-The organic way forward. [Viewed 21 January 2019] Available at:
http://orgprints.org/1924/1/1924.pdf
Resource. (2018). Car Battery Recycling: Staying in Charge. [Viewed 21 January 2019] Available at:
https://resource.co/article/car-battery-recycling-staying-charge-12833
S. Y. Yuan, S. H. Wei, and B. V. Chang (2000). Biodegradation of polycyclic aromatic hydrocarbons by a mixed
culture. Chemosphere, vol. 41, no. 9, pp. 1463–1468.
SCAHT (2015). Cadmium in mineral fertilisers – human and environmental risk update. [Viewed 21 January
2019] Available at:
https://www.researchgate.net/profile/Nicolas_Roth/publication/307923835_Cadmium_in_mineral_fertilizers_-
_human_and_environmental_risk_update/links/57d1b73c08ae5f03b48abbe2/Cadmium-in-mineral-fertilizers-
human-and-environmental-risk-update.pdf
Schröder, J. J., Smit, A. L., Cordell, D., & Rosemarin, A. (2011). Improved phosphorus use efficiency in
agriculture: a key requirement for its sustainable use. Chemosphere, 84(6), 822-831. [Viewed 21 January 2019]
Available at: https://www.sciencedirect.com/science/article/pii/S0045653511001056
Scottish Water (2006). National Sludge Strategy. [Viewed 21 January 2019] Available at:
http://www2.scottishwater.co.uk/portal/page/portal/SW_PAGE_GROUP_PS_ADMIN_01082018/SW_PUB_SCHE
ME_ADMIN_HOLDING/TAB65572/National%20Sludge%20Strategy.pdf
Selling R., Håkansson T., Björnsson L. (2008). Two-stage anaerobic digestion enables heavy metal removal.
Water Science and Technology, 57 (4):553-8.
Sheoran, V., Sheoran, A. S., & Poonia, P. (2010). Soil reclamation of abandoned mine land by revegetation: a
review. International Journal of Soil, Sediment and Water, 3(2), 13. [Viewed 21 January 2019] Available at:

192 © Wood Environment & Infrastructure Solutions UK Limited
February 2019
Doc Ref. 40039CL003i3
https://scholarworks.umass.edu/cgi/viewcontent.cgi?referer=https://www.google.com/&httpsredir=1&article
=1107&context=intljssw
Staples CA, Peterson DR, Parkerton TF, Adams WJ (1997). The environmental fate of phthalate esters: a
literature review. Chemosphere 35:667–749.
Treehugger (2014). Urine-separating toilets are not quite as wonderful as we keep saying they are. [Viewed 21
January 2019] Available at: https://www.treehugger.com/bathroom-design/urine-separating-toilets-are-not-
quite-wonderful-we-keep-saying-they-are.html
Vaneeckhaute et al. (2018). Nutrient recovery from digestate: Systematic technology review and product
classification. Waste Biomass Valor. 8, pp. 21–40.
Weber, O., Delince, J., Duan, Y., Maene, L., McDaniels, T., Mew, M., Schneidewind, U. and Steiner, G.,
(2014). Trade and finance as cross-cutting issues in the global phosphate and fertiliser market. Sustainable
Phosphorus Management (pp. 275-299). Springer, Dordrecht. [Viewed 21 January 2019] Available at:
https://link.springer.com/chapter/10.1007/978-94-007-7250-2_7
Which (2019). How to buy the best rechargeable batteries. [Viewed 21 January 2019] Available at:
https://www.which.co.uk/reviews/rechargeable-batteries/article/how-to-buy-the-best-rechargeable-batteries
Wood (then Amec Foster Wheeler), Peter Fisk Associates and Environment Agency of Austria. (2017).
Intentionally added microplastics in products. [Viewed 21 January 2019] Available at:
http://ec.europa.eu/environment/chemicals/reach/pdf/39168%20Intentionally%20added%20microplastics%2
0-%20Final%20report%2020171020.pdf
World Bank (2000). Glossary Urban Solid Waste Management. [Viewed 21 January 2019] Available at:
http://web.worldbank.org/WBSITE/EXTERNAL/TOPICS/EXTURBANDEVELOPMENT/EXTUSWM/0,,contentMDK:
20241717~menuPK:4153320~pagePK:210058~piPK:210062~theSitePK:463841,00.html#l
World Bank (2012). What a Waste, available. [Viewed 21 January 2019] Available at:
https://siteresources.worldbank.org/INTURBANDEVELOPMENT/Resources/336387-
1334852610766/What_a_Waste2012_Final.pdf
WRAP (2012). Enhancement and treatment of digestates from anaerobic digestion. [Viewed 18 January 2019].
Available from:
http://www.wrap.org.uk/sites/files/wrap/Digestates%20from%20Anaerobic%20Digestion%20A%20review%20
of%20enhancement%20techniques%20and%20novel%20digestate%20products_0.pdf
WRAP (2016). Digestate and Compost Use In Agriculture – Good Practice Guidance. [Viewed 21 January 2019]
Available at:
http://www.wrap.org.uk/sites/files/wrap/Digestate_compost_good_practice_guide_reference_version.pdf
Yuan, S. Y., Wei, S. H., & Chang, B. V. (2000). Biodegradation of polycyclic aromatic hydrocarbons by a mixed
culture. Chemosphere, 41(9), 1463-1468. [Viewed 21 January 2019] Available at:
https://www.sciencedirect.com/science/article/pii/S0045653599005226?via%3Dihub

A1 © Wood Environment & Infrastructure Solutions UK Limited
February 2019
Doc Ref. 40039CL003i3
Appendix A
Overview of market analysis data

A2 © Wood Environment & Infrastructure Solutions UK Limited
February 2019
Doc Ref. 40039CL003i3
This appendix presents the available data on the tonnages of compost (Table A.1) and digestate (Table A.2)
for each EU Member State. The tables also explain how the total estimate of compost/digestate tonnage
used in this study was derived from the various data sources. In addition, Table A.3 presents Member State
market data specifically for digestate from separated bio-waste, agri-food industry and sewage sludge, for
which no EU-level estimates of digestate quantity were available.

A3 © Wood Environment & Infrastructure Solutions UK Limited
February 2019
Doc Ref. 40039CL003i3
Table A.1 Compost market data by country
Country JRC 2014 (data
for 2005-
2009):
Tonnes of
compost
produced
Eurostat
material flow
accounts 2014:
Tonnes of
compost
applied
Data from
consultation:
Tonnes of
compost
Data from
literature review:
Tonnes of
compost
Estimate for this
study:
Tonnes of compost
(central estimate)
Estimate for this
study:
Tonnes of compost
(range)
Estimate for this study:
Explanation of the basis for the estimate
EU28 14,360,000 17,920,000
ECN response:
12,100,000-
16,150,000
(excluding
sewage sludge
compost)
17,300,000 12,900,000-
17,900,000
Central: Sum of country estimates;
Range: Sum of ECN consultation response
and estimate for sewage sludge compost
(See Section 2.2.4, Eurostat data on sewage
sludge disposed as ‘compost and other
applications');
All rounded to closest 100,000.
Germany 4,380,000 4,340,000
BDE response:
4,300,000
German Federal
Environment
Agency 2017:
3,900,000
4,300,000 4,300,000-4,380,000 BDE consultation response, Eurostat material
flow accounts 2014 and JRC 2014 (all in close
agreement)
United Kingdom 2,040,000 2,550,000
ECN country
report 2017:
3,470,000
2,800,000 2,040,000-3,470,000 Central: Midpoint of range (rounded to
closest 100,000) (note this is also close to
Eurostat material flow accounts 2014);
Range: JRC 2014 – ECN country report 2017.
France 2,490,000 2,540,000
2,500,000 2,490,000-2,540,000 Eurostat material flow accounts 2014 and
JRC 2014 (both in close agreement) (central
estimate rounded to closest 100,000).
Italy 1,000,000 2,430,000 CIC response:
1,900,000
ECN country
report 2017:
1,760,000
2,200,000 1,900,000-2,430,000 Central: Midpoint of range (rounded to
closest 100,000);
Range: CIC consultation response - Eurostat
material flow accounts 2014.

A4 © Wood Environment & Infrastructure Solutions UK Limited
February 2019
Doc Ref. 40039CL003i3
Country JRC 2014 (data
for 2005-
2009):
Tonnes of
compost
produced
Eurostat
material flow
accounts 2014:
Tonnes of
compost
applied
Data from
consultation:
Tonnes of
compost
Data from
literature review:
Tonnes of
compost
Estimate for this
study:
Tonnes of compost
(central estimate)
Estimate for this
study:
Tonnes of compost
(range)
Estimate for this study:
Explanation of the basis for the estimate
Netherlands 1,600,000 1,210,000 1,400,000 1,210,000-1,600,000 Central: Midpoint of range (rounded to
closest 100,000);
Range: JRC 2014 - Eurostat material flow
accounts 2014.
Spain 610,000 1,450,000 1,000,000 610,000-1,450,000 Central: Midpoint of range (rounded to
closest 100,000);
Range: JRC 2014 - Eurostat material flow
accounts 2014.
Poland 630,000 580,000 600,000 580,000-630,000 Central: Midpoint of range (rounded to
closest 100,000);
Range: JRC 2014 - Eurostat material flow
accounts 2014.
Belgium 500,000 490,000 ECN country
report 2017:
360,000 (only
Flanders)
500,000 490,000-500,000 Central: Midpoint of range (rounded to
closest 100,000);
Range: JRC 2014 - Eurostat material flow
accounts 2014.
Denmark 370,000 410,000 400,000 370,000-410,000 Central: Midpoint of range (rounded to
closest 100,000);
Range: JRC 2014 - Eurostat material flow
accounts 2014.
Sweden 200,000 350,000 300,000 200,000-350,000 Central: Midpoint of range (rounded to
closest 100,000);
Range: JRC 2014 - Eurostat material flow
accounts 2014.

A5 © Wood Environment & Infrastructure Solutions UK Limited
February 2019
Doc Ref. 40039CL003i3
Country JRC 2014 (data
for 2005-
2009):
Tonnes of
compost
produced
Eurostat
material flow
accounts 2014:
Tonnes of
compost
applied
Data from
consultation:
Tonnes of
compost
Data from
literature review:
Tonnes of
compost
Estimate for this
study:
Tonnes of compost
(central estimate)
Estimate for this
study:
Tonnes of compost
(range)
Estimate for this study:
Explanation of the basis for the estimate
Austria 0 0 Kompost- und
Biogasverband
Österreich:
580,000m³
300,000 Estimated based on Kompost- und
Biogasverband Österreich.1)
Romania 0 200,000 200,000 200,000-200,000 Eurostat material flow accounts 2014.
Finland 180,000 190,000 200,000 180,000-190,000 Central: Midpoint of range (rounded to
closest 100,000);
Range: JRC 2014 - Eurostat material flow
accounts 2014.
Hungary 50,000 120,000 ECN country
report 2017:
200,000 (excluding
mechanical
biological
treatment of
550,000 t of MSW)
200,000 120,000-480,000 Central: ECN country report 2017 (excluding
mechanical biological treatment);
Range: Eurostat material flow accounts 2014
- ECN country report 2017 (including
estimated 275,000 t of compost resulting
from mechanical biological treatment of
550,000 t of MSW).2)
Estonia 0 210,000 ECN country
report 2017:
39,000 (only
biowaste and
sewage sludge)
100,000 40,000-210,000 Central: Midpoint of range (rounded to
closest 100,000);
Range: ECN country report 2017 - Eurostat
material flow accounts 2014.
Ireland 100,000 180,000 100,000 100,000-180,000 Central: Midpoint of range (rounded to
closest 100,000);
Range: JRC 2014 - Eurostat material flow
accounts 2014.

A6 © Wood Environment & Infrastructure Solutions UK Limited
February 2019
Doc Ref. 40039CL003i3
Country JRC 2014 (data
for 2005-
2009):
Tonnes of
compost
produced
Eurostat
material flow
accounts 2014:
Tonnes of
compost
applied
Data from
consultation:
Tonnes of
compost
Data from
literature review:
Tonnes of
compost
Estimate for this
study:
Tonnes of compost
(central estimate)
Estimate for this
study:
Tonnes of compost
(range)
Estimate for this study:
Explanation of the basis for the estimate
Portugal 30,000 180,000 100,000 30,000-180,000 Central: Midpoint of range (rounded to
closest 100,000);
Range: JRC 2014 - Eurostat material flow
accounts 2014.
Slovakia 30,000 170,000 100,000 30,000-170,000 Central: Midpoint of range (rounded to
closest 100,000);
Range: JRC 2014 - Eurostat material flow
accounts 2014.
Greece 10,000 80,000 <100,000 10,000-80,000 JRC 2014, Eurostat material flow accounts
2014.
Slovenia 0 70,000 <100,000 Up to 70,000 JRC 2014, Eurostat material flow accounts
2014.
Lithuania 0 60,000 <100,000 Up to 60,000 JRC 2014, Eurostat material flow accounts
2014.
Czech Republic 80,000 50,000 <100,000 50,000-80,000 JRC 2014, Eurostat material flow accounts
2014.
Luxembourg 20,000 30,000 <100,000 20,000-30,000 JRC 2014, Eurostat material flow accounts
2014.
Bulgaria 0 30,000 <100,000 Up to 30,000 JRC 2014, Eurostat material flow accounts
2014.
Croatia 0 20,000 <100,000 Up to 20,000 JRC 2014, Eurostat material flow accounts
2014.

A7 © Wood Environment & Infrastructure Solutions UK Limited
February 2019
Doc Ref. 40039CL003i3
Country JRC 2014 (data
for 2005-
2009):
Tonnes of
compost
produced
Eurostat
material flow
accounts 2014:
Tonnes of
compost
applied
Data from
consultation:
Tonnes of
compost
Data from
literature review:
Tonnes of
compost
Estimate for this
study:
Tonnes of compost
(central estimate)
Estimate for this
study:
Tonnes of compost
(range)
Estimate for this study:
Explanation of the basis for the estimate
Cyprus 0 10,000 <100,000 Up to 10,000 JRC 2014, Eurostat material flow accounts
2014.
Latvia 0 0 unknown
Malta 0 0 unknown
Sources:
Wood 2018 based on:
JRC technical proposals on end-of-waste criteria for biodegradable waste subjected to biological treatment, 2014, available at: http://ipts.jrc.ec.europa.eu/publications/pub.cfm?id=6869;
Eurostat material flow accounts - domestic processed output [env_ac_mfadpo], compost ‘supplied by the national economy and taken up by the natural environment’ in 2014;
Consultation responses from ECN (European Compost Network), BDE (German Waste, Water and Raw Materials Management Industry Association), and CIC (Italian Compost Consortium);
ECN country reports, available at https://www.compostnetwork.info/publications/;
German Federal Environment Agency: Bioabfallkomposte und -gärreste in der Landwirtschaft. position // januar 2017. Available at:
https://www.umweltbundesamt.de/sites/default/files/medien/377/publikationen/170131_uba_pos_bioabfall_bf.pdf;
Kompost- und Biogasverband Österreich: http://www.kompost-biogas.info/kompost/statistik-kompost/.
Notes: 1) Mass of compost produced in Austria was estimated from the 580,000m3 volume as follows: The volume in m3 was converted to litres by multiplying with 1,000. The volume in litres was then converted to
weight in kg assuming an average density of the compost of 0.5kg/l (See for instance: https://www.hotbincomposting.com/blog/quick-composting-faqs.html or
http://www.severnwaste.com/composting/greengrow/). The mass in kg was then converted to tonnes by multiplying with 1,000. 2) The mass of compost produced from mechanical biological treatment of 550,000 t of municipal solid waste (MSW) in Hungary was estimated using the assumption that the average weight of compost
produced is about half the weight of the feedstocks used (this is roughly the ratio of compost weight to feedstock weight indicated by the figures in ECN’s consultation response).

A8 © Wood Environment & Infrastructure Solutions UK Limited
February 2019
Doc Ref. 40039CL003i3
Table A.2 Digestate market data by country (all types of digestate)
Country JRC 2014:
Tonnes of
digestate
Estimation
based on 2016
biogas
production1):
Tonnes of
digestate
(central
estimate)
Estimation
based on 2016
biogas
production1):
Tonnes of
digestate
(range)
Data from
consultation:
Tonnes of
digestate
Data from
literature review:
Tonnes of digestate
Estimate for
this study:
Tonnes of
digestate
(central
estimate)
Estimate for
this study:
Tonnes of
digestate
(range)
Estimate for this study:
Explanation of the basis for the estimate
EU28 56,000,000 118,180,000 35,750,000-
1,312,800,000
EBA response:
Ca. 120,000,000
(agricultural
plants only);
Ca. 55,000,000t
organic fraction
of mixed MSW
treated in
mechanical
biological
treatment plants
Digestate and
REACH Position
Paper 2013:
80,000,000
176,000,000
Sum of the following:
Agricultural digestate (EBA consultation
response);
Mixed MSW digestate (estimation based on
feedstock from mechanical biological
treatment plants according to EBA
consultation response);2)
Source separated biowaste, agro-food
industry and sewage sludge digestate
(several country-specific sources, see Table
A.3 for more details).
Rounded to closest 1 million tonnes.
Note that this matches reasonably well with the
sum of central estimates for the 28 Member
States (170,100,000t).
Germany 36,000,000 57,630,000 17,430,000-
640,190,000
EBA response:
60,000,000
(agricultural
plants only)
French Environment
and Energy
Management
Agency 2014:
86,680,000
87,000,000 60,000,000-
96,000,000
Central: French Environment and Energy
Management Agency 2014 (rounded to closest
100,000);
Range: EBA consultation response (agricultural
only) - JRC 2014 extrapolated from 2008 to 2016
based on increase in biogas production over this
period3).

A9 © Wood Environment & Infrastructure Solutions UK Limited
February 2019
Doc Ref. 40039CL003i3
Country JRC 2014:
Tonnes of
digestate
Estimation
based on 2016
biogas
production1):
Tonnes of
digestate
(central
estimate)
Estimation
based on 2016
biogas
production1):
Tonnes of
digestate
(range)
Data from
consultation:
Tonnes of
digestate
Data from
literature review:
Tonnes of digestate
Estimate for
this study:
Tonnes of
digestate
(central
estimate)
Estimate for
this study:
Tonnes of
digestate
(range)
Estimate for this study:
Explanation of the basis for the estimate
United
Kingdom
124,000 18,520,000 5,600,000-
205,690,000
WRAP 2015:
4,500,000
18,500,000 4,500,000-? Central: Estimation based on 2016 biogas
production (rounded to closest 100,000);
Range: WRAP 2015 (note that it seems unlikely
this covers all digestate in the UK given this is
lower than the lower end of the range based on
2016 biogas production) - no data for upper end
of range available4).
Italy 83,100 13,350,000 4,040,000-
148,290,000
Italian Biogas
Association quoted
in EBA 2015:
Up to 30,000,000
30,000,000 13,400,000-
30,000,000
Central: Italian Biogas Association quoted in EBA
2015;
Range: Estimation based on 2016 biogas
production - Italian Biogas Association quoted in
EBA 2015.
France 5,410,000 1,640,000-
60,110,000
Panorama du Gaz
Renouvable 2016:
1,030,000t of
feedstocks for
biogas injected into
the natural gas
network
5,400,000 900,000-? Central: Estimation based on 2016 biogas
production (rounded to closest 100,000);
Range: Estimation based on feedstock according
to Panorama du Gaz Renouvable 20162) - no
data for upper end of range available4).
Czech
Republic
80,000 4,280,000 1,290,000-
47,530,000
4,300,000 500,000-? Central: Estimation based on 2016 biogas
production (rounded to closest 100,000);
Range: JRC 2014 extrapolated from 2008 to 2016
based on increase in biogas production over this
period3) - no data for upper end of range
available4).

A10 © Wood Environment & Infrastructure Solutions UK Limited
February 2019
Doc Ref. 40039CL003i3
Country JRC 2014:
Tonnes of
digestate
Estimation
based on 2016
biogas
production1):
Tonnes of
digestate
(central
estimate)
Estimation
based on 2016
biogas
production1):
Tonnes of
digestate
(range)
Data from
consultation:
Tonnes of
digestate
Data from
literature review:
Tonnes of digestate
Estimate for
this study:
Tonnes of
digestate
(central
estimate)
Estimate for
this study:
Tonnes of
digestate
(range)
Estimate for this study:
Explanation of the basis for the estimate
Netherlands 2,270,000 690,000-
25,200,000
Dutch Central
Bureau of Statistics
2012:
1,930,000;
Groen Gas Forum
2014:
3,770,000t of
feedstocks for
biogas production
2,900,000 2,200,000-
3,500,000
Central: Midpoint of range (rounded to closest
100,000);
Range: Dutch Central Bureau of Statistics 2012 -
Renewable gas route map 2014 (both
extrapolated from 2011 and 2012 respectively to
2016 based on increase in biogas production
over these periods3))
Austria 2,230,000 670,000-
24,760,000
FABbiogas national
report:
Capacity of 860,000t
of waste as
feedstock for biogas
production (actual
use in 2006 was
410,000t)
2,200,000 900,000-? Central: Estimation based on 2016 biogas
production (rounded to closest 100,000);
Range: Estimation based on feedstock according
to FABbiogas national report2) - no data for
upper end of range available4).
Poland 1,860,000 560,000-
20,650,000
Global Methane
2014:
1,580,000t of
feedstock for biogas
production
(agricultural only)
1,300,000 600,000-
1,900,000
Central: Estimation based on feedstock
according to Global Methane 2014 (agricultural
only) 2);
Range: Lower end of range to central estimate of
the estimation based on 2016 biogas production
(rounded to closest 100,000, note that the lower
and central estimates were used because they
are reasonably close to Global Methane 2012).

A11 © Wood Environment & Infrastructure Solutions UK Limited
February 2019
Doc Ref. 40039CL003i3
Country JRC 2014:
Tonnes of
digestate
Estimation
based on 2016
biogas
production1):
Tonnes of
digestate
(central
estimate)
Estimation
based on 2016
biogas
production1):
Tonnes of
digestate
(range)
Data from
consultation:
Tonnes of
digestate
Data from
literature review:
Tonnes of digestate
Estimate for
this study:
Tonnes of
digestate
(central
estimate)
Estimate for
this study:
Tonnes of
digestate
(range)
Estimate for this study:
Explanation of the basis for the estimate
Spain 504,000 1,750,000 530,000-
19,390,000
Spanish Ministry of
Agriculture, Fishing,
Food and the
Environment
Statistical Year Book
2016:
400,000t of sewage
sludge and
municipal (bio)
waste digested
1,800,000 300,000-? Central: Estimation based on 2016 biogas
production (rounded to closest 100,000);
Range: Estimation based on feedstock according
to Spanish Ministry of Agriculture, Fishing, Food
and the Environment Statistical Year Book 2016
(sewage sludge and municipal waste only)2) - no
data for upper end of range available4).
Belgium 800,000 1,610,000 490,000-
17,940,000
ECN country report:
1,300,000 (Flanders
only)
1,600,000 1,300,000-? Central: Estimation based on 2016 biogas
production (rounded to closest 100,000);
Range: ECN country report 2015 (Flanders only) -
no data for upper end of range available4).
Denmark 1,560,000 470,000-
17,280,000
1,600,000 Central: Estimation based on 2016 biogas
production (rounded to closest 100,000);
Range: No data available4).
Sweden 389,000 1,240,000 370,000-
13,720,000
French Environment
and Energy
Management
Agency 2014:
7,220,000 (relating
to 2010)
7,200,000 1,200,000-
11,300,000
Central: French Environment and Energy
Management Agency 2014;
Range: Estimation based on 2016 biogas
production (central estimate, rounded to closest
100,000) - French Environment and Energy
Management Agency 2014 extrapolated from
2010 to 2016 based on increase in biogas
production over this period3).
Slovakia 1,080,000 330,000-
12,010,000
1,100,000 Central: Estimation based on 2016 biogas
production (rounded to closest 100,000);
Range: No data available.

A12 © Wood Environment & Infrastructure Solutions UK Limited
February 2019
Doc Ref. 40039CL003i3
Country JRC 2014:
Tonnes of
digestate
Estimation
based on 2016
biogas
production1):
Tonnes of
digestate
(central
estimate)
Estimation
based on 2016
biogas
production1):
Tonnes of
digestate
(range)
Data from
consultation:
Tonnes of
digestate
Data from
literature review:
Tonnes of digestate
Estimate for
this study:
Tonnes of
digestate
(central
estimate)
Estimate for
this study:
Tonnes of
digestate
(range)
Estimate for this study:
Explanation of the basis for the estimate
Finland 800,000 240,000-
8,870,000
800,000 Central: Estimation based on 2016 biogas
production (rounded to closest 100,000);
Range: No data available.
Greece 720,000 220,000-
8,040,000
700,000 Central: Estimation based on 2016 biogas
production (rounded to closest 100,000);
Range: No data available.
Latvia 640,000 190,000-
7,110,000
600,000 Central: Estimation based on 2016 biogas
production (rounded to closest 100,000);
Range: No data available.
Hungary 630,000 190,000-
7,000,000
ECN country report:
350,000t of sewage
sludge and
agricultural waste or
liquid manure and
agricultural residues
digested
600,000 300,000-? Central: Estimation based on 2016 biogas
production (rounded to closest 100,000);
Range: Estimation based on feedstock according
to ECN country report2) - no data for upper end
of range available4).
Portugal 570,000 170,000-
6,350,000
600,000 Central: Estimation based on 2016 biogas
production (rounded to closest 100,000);
Range: No data available.
Bulgaria 430,000 130,000-
4,740,000
400,000 Central: Estimation based on 2016 biogas
production (rounded to closest 100,000);
Range: No data available.
Ireland 400,000 120,000-
4,450,000
400,000 Central: Estimation based on 2016 biogas
production (rounded to closest 100,000);
Range: No data available.

A13 © Wood Environment & Infrastructure Solutions UK Limited
February 2019
Doc Ref. 40039CL003i3
Country JRC 2014:
Tonnes of
digestate
Estimation
based on 2016
biogas
production1):
Tonnes of
digestate
(central
estimate)
Estimation
based on 2016
biogas
production1):
Tonnes of
digestate
(range)
Data from
consultation:
Tonnes of
digestate
Data from
literature review:
Tonnes of digestate
Estimate for
this study:
Tonnes of
digestate
(central
estimate)
Estimate for
this study:
Tonnes of
digestate
(range)
Estimate for this study:
Explanation of the basis for the estimate
Croatia 330,000 100,000-
3,690,000
300,000 Central: Estimation based on 2016 biogas
production (rounded to closest 100,000);
Range: No data available.
Lithuania 230,000 70,000-
2,530,000
200,000 Central: Estimation based on 2016 biogas
production (rounded to closest 100,000);
Range: No data available.
Slovenia 210,000 70,000-
2,390,000
200,000 Central: Estimation based on 2016 biogas
production (rounded to closest 100,000);
Range: No data available.
Luxembourg 177,000 140,000 40,000-
1,570,000
100,000 Central: Estimation based on 2016 biogas
production (rounded to closest 100,000);
Range: No data available.
Romania 130,000 40,000-
1,400,000
100,000 Central: Estimation based on 2016 biogas
production (rounded to closest 100,000);
Range: No data available.
Cyprus 80,000 30,000-930,000 100,000 Central: Estimation based on 2016 biogas
production (rounded to closest 100,000);
Range: No data available.
Estonia 80,000 20,000-850,000 100,000 Central: Estimation based on 2016 biogas
production (rounded to closest 100,000);
Range: No data available.
Malta 10,000 <10,000-
150,000
<100,000 Central: Estimation based on 2016 biogas
production (rounded to closest 100,000);
Range: No data available.
Sources:

A14 © Wood Environment & Infrastructure Solutions UK Limited
February 2019
Doc Ref. 40039CL003i3
Wood 2018 based on:
JRC technical proposals on end-of-waste criteria for biodegradable waste subjected to biological treatment, 2014, available at: http://ipts.jrc.ec.europa.eu/publications/pub.cfm?id=6869;
Eurostat data on biogas production for 2016 (in: supply, transformation and consumption of renewable energies - annual data [nrg_107a]) and several sources to inform assumptions on estimating the
resulting quantities of digestate – these are described on more detail in Section 2.2.4;
Consultation response from EBA (European Biogas Association);
Spanish Ministry of Agriculture, Fishing, Food and the Environment Statistical Year Book 2016, available at http://www.mapama.gob.es/estadistica/pags/anuario/2016/AE16.pdf;
ECN country reports, available at https://www.compostnetwork.info/publications/;
Fachverband Biogas / EBA / BiPRO: Digestate and REACH – Position Paper, 2013, available at: http://european-biogas.eu/wp-content/uploads/files/2013/11/2013-11-28-Position-paper-digestate-and-
REACH-EN-final.pdf;
French Environment and Energy Management Agency (ADEME): Benchmark des stratégies européennes des filières de production et de valorisation de biogaz et prospectives pour la filière française de
méthanisation, 2014, available at https://www.actu-environnement.com/media/pdf/news-24244-benchmark-strategies-europ-biogaz.pdf;
WRAP: Organics recycling industry status report 2015, available at: http://www.wrap.org.uk/sites/files/wrap/asori%202015.pdf;
Italian Biogas Association quoted in EBA Digestate Factsheet, 2015, available at: http://european-biogas.eu/wp-content/uploads/2015/07/Digestate-paper-final-08072015.pdf;
Panorama du gaz renouvelable au 31 décembre 2016, available at: https://www.actu-environnement.com/media/pdf/news-28505-panorama-gaz-2016-SER-GRDF.pdf;
Dutch Central Bureau of Statistics (CBS): Co-vergisting van dierlijke mest 2006–2011, 2012, available at https://www.cbs.nl/-/media/imported/documents/2012/31/2012-co-vergisting-dierlijk-mest-2006-
2011-art.pdf;
Groen Gas Forum: Routekaart hernieuwbaar gas, 2014, available at: https://www.rvo.nl/sites/default/files/2014/07/Routekaart%20Hernieuwbaar%20gas.pdf;
FABbiogas: Biogas production and biogas potentials from residues of the European Food and beverage industry – Austria – national situation, available at:
http://www.fabbiogas.eu/fileadmin/user_upload/Download/National_Report_AUSTIRA_german.pdf;
Global Methane Initiative: The agricultural biogas plants in Poland, 2014, available at: https://www.globalmethane.org/documents/Poland-Ag-Biogas-Plants-April-2014.pdf.
Notes: 1) The quantity of digestate produced as a result of biogas production according to Eurostat data was estimated for each country based on a set of assumptions described on more detail in Section 2.2.4. 2) Where only the tonnage of feedstocks used for anaerobic digestion was available, the resulting amount of digestate was estimated as follows: The tonnage of feedstocks was multiplied with 0.84, the
midpoint between the mass reductions from feedstock to digestate suggested by the EBA consultation response and WRAP 2012. 3) 2016 tonnages of digestate were extrapolated from older figures based on the assumption that digestate production increased at the same rate as biogas production in terms of energy (Eurostat: Supply,
transformation and consumption of renewable energies - annual data [nrg_107a]). This implies the assumption that on average similar production techniques and feedstocks have been used which produce a
similar amount of energy per weight of input material used. The extrapolation was calculated as follows: the old figure of digestate tonnage was divided by the biogas production in the same year and
country, and then multiplied by the biogas production in 2016 in the same country. 4) The ranges reflect estimates that we consider to reflect likely minimum values or underestimates on the one end, and likely maximum values or overestimates on the other end. Central estimates reflect
what we consider the most likely value. In some cases, no estimates above what we consider the most likely value (central estimate) were available, so there was no basis for an upper end of the range.
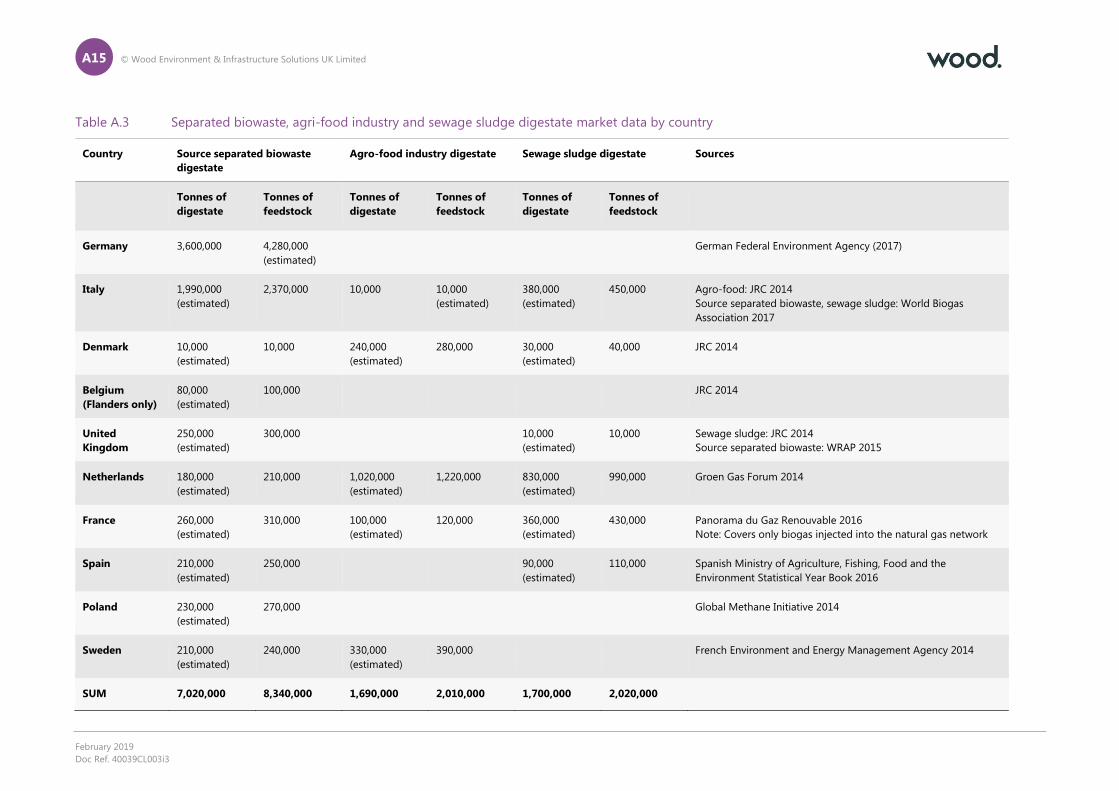
A15 © Wood Environment & Infrastructure Solutions UK Limited
February 2019
Doc Ref. 40039CL003i3
Table A.3 Separated biowaste, agri-food industry and sewage sludge digestate market data by country
Country Source separated biowaste
digestate
Agro-food industry digestate Sewage sludge digestate Sources
Tonnes of
digestate
Tonnes of
feedstock
Tonnes of
digestate
Tonnes of
feedstock
Tonnes of
digestate
Tonnes of
feedstock
Germany 3,600,000 4,280,000
(estimated)
German Federal Environment Agency (2017)
Italy 1,990,000
(estimated)
2,370,000 10,000 10,000
(estimated)
380,000
(estimated)
450,000 Agro-food: JRC 2014
Source separated biowaste, sewage sludge: World Biogas
Association 2017
Denmark 10,000
(estimated)
10,000 240,000
(estimated)
280,000 30,000
(estimated)
40,000 JRC 2014
Belgium
(Flanders only)
80,000
(estimated)
100,000
JRC 2014
United
Kingdom
250,000
(estimated)
300,000
10,000
(estimated)
10,000 Sewage sludge: JRC 2014
Source separated biowaste: WRAP 2015
Netherlands 180,000
(estimated)
210,000 1,020,000
(estimated)
1,220,000 830,000
(estimated)
990,000 Groen Gas Forum 2014
France 260,000
(estimated)
310,000 100,000
(estimated)
120,000 360,000
(estimated)
430,000 Panorama du Gaz Renouvable 2016
Note: Covers only biogas injected into the natural gas network
Spain 210,000
(estimated)
250,000
90,000
(estimated)
110,000 Spanish Ministry of Agriculture, Fishing, Food and the
Environment Statistical Year Book 2016
Poland 230,000
(estimated)
270,000
Global Methane Initiative 2014
Sweden 210,000
(estimated)
240,000 330,000
(estimated)
390,000
French Environment and Energy Management Agency 2014
SUM 7,020,000 8,340,000 1,690,000 2,010,000 1,700,000 2,020,000

A16 © Wood Environment & Infrastructure Solutions UK Limited
February 2019
Doc Ref. 40039CL003i3
Sources:
Wood 2018 based on:
German Federal Environment Agency: Bioabfallkomposte und -gärreste in der Landwirtschaft. position // januar 2017. available at:
https://www.umweltbundesamt.de/sites/default/files/medien/377/publikationen/170131_uba_pos_bioabfall_bf.pdf;
World Biogas Association: Anaerobic Digestion Market Report Italy, 2017, available at: http://www.worldbiogasassociation.org/wp-content/uploads/2017/07/WBA-italy-4ppa4_v1.pdf;
WRAP: Organics recycling industry status report 2015, available at: http://www.wrap.org.uk/sites/files/wrap/asori%202015.pdf;
Groen Gas Forum: Routekaart hernieuwbaar gas, 2014, available at: https://www.rvo.nl/sites/default/files/2014/07/Routekaart%20Hernieuwbaar%20gas.pdf;
Panorama du gaz renouvelable au 31 décembre 2016, available at: https://www.actu-environnement.com/media/pdf/news-28505-panorama-gaz-2016-SER-GRDF.pdf;
Spanish Ministry of Agriculture, Fishing, Food and the Environment Statistical Year Book 2016, available at http://www.mapama.gob.es/estadistica/pags/anuario/2016/AE16.pdf;
Global Methane Initiative: The agricultural biogas plants in Poland, 2014, available at: https://www.globalmethane.org/documents/Poland-Ag-Biogas-Plants-April-2014.pdf;
French Environment and Energy Management Agency (ADEME): Benchmark des stratégies européennes des filières de production et de valorisation de biogaz et prospectives pour la filière française de
méthanisation, 2014, available at https://www.actu-environnement.com/media/pdf/news-24244-benchmark-strategies-europ-biogaz.pdf.
Notes:
All figure marked with “(estimated)”: Where only the tonnage of feedstocks used for anaerobic digestion was available, the resulting amount of digestate was estimated as follows: The tonnage of feedstocks
was multiplied with 0.84, the midpoint between the mass reductions from feedstock to digestate suggested by the EBA consultation response and WRAP 2012
(http://www.wrap.org.uk/sites/files/wrap/Digestates%20from%20Anaerobic%20Digestion%20A%20review%20of%20enhancement%20techniques%20and%20novel%20digestate%20products_0.pdf). Vice
versa, where only the tonnage of amount of digestate was available, the underlying amount of digestate was estimated by dividing the tonnage of digestate by 0.84.

B1 © Wood Environment & Infrastructure Solutions UK Limited
February 2019
Doc Ref. 40039CL003i3
Appendix B
Overview of further processing techniques for
digestate

B2 © Wood Environment & Infrastructure Solutions UK Limited
February 2019
Doc Ref. 40039CL003i3
The use of digestate as fertiliser is sometimes hindered by practical and economic issues (large volumes of
digestate, high transportation and storage costs), as well as environmental issues (nitrogen and phosphorus
fertilisation limits in high nutrient areas) (Vaneeckhaute et al. 2018). Further processing of digestate allows
concentration and recovery of the nutrients in digestate in order to be more easily stored, transported and/or
applied were most needed.
The following digestate processing technologies have been identified and are discussed in this section:
Separation of liquid and solid fractions;
Digestate drying;
Ammonia stripping;
Phosphorous precipitation/Struvite crystallisation;
Phosphorous (P) extraction;
Micro filtration/Membrane filtration; and
Microalgae production.
The choice of technology used to recover nutrients from digestate depends on the characteristics of waste
input, and strongly affects the properties of fertiliser end-products. With the exception of separation, drying
and ammonia stripping, the majority of these digestate treatment processes are still in the embryonic stages
of development (According to EBA consultation response and Vaneeckhaute et al. 2018). This is largely due
to high costs and is further hindered by problematic waste classification of digestate and its associated
derivates. For example, in the European Union, all derivates of animal manure are normally classified as waste
in fertiliser legislation, requiring further processing to make high quality end-products (Vaneeckhaute et al.
2018).
Separation of liquid and solid fractions
According to the EBA consultation response, this is a well-established process which creates two outputs that
need to be handled separately. The drier fraction can then go on to be stored, while lowering the volume of
liquid makes storage of the liquid fraction easier. This can then be pumped later. Mechanical methodologies
for the separation process and their efficacy are summarised for instance in Lukehurst et al. 2010.
Digestate drying
Drying of digestate liquor and sludge is also an established processing technique according to the EBA
consultation response. It reduces the handling and spreading of digestate, as well as allowing for easier
storage. Furthermore, the dry end-product can be used as animal bedding as well as organic fertiliser and
biomass for green energy168. However, according to the European Biogas Association, digestate drying is a
questionable process due to the unnecessary wasting of heat. Furthermore, during the drying process, if
there is no effective air scrubbing in place, ammonium gets released into the air (EBA 2013).
Following separation, thermal treatment (drying) can be used to remove water and further increase dry solids
content. Digestate is dried to over 90% dry matter to facilitate long term storage. Drying typically occurs in
two forms:
Direct: hot air (300-600˚C) flows through the vessel containing digestate;
168 https://stronga.com/drying-material/drying-digestate/

B3 © Wood Environment & Infrastructure Solutions UK Limited
February 2019
Doc Ref. 40039CL003i3
Indirect: digestate is separated from the source of heat by metal walls where heat is passed to
digestate by conduction. Temperatures are typically lower than with direct systems e.g. using
steam at 135-215°C or thermal oil at 200-250°C (NNFCC 2016).
Ammonia stripping
This method involves converting NH4 from the waste stream in question to a gas. This gas is then transferred
to a scrubber which recovers a concentrated solution of ammonium sulphate as an end-product. According
to the EBA consultation response, ammonia stripping is used at waste water treatment facilities. According to
Vaneeckhaute et al (2018), the implementation of this process to treat N-rich digestate and manure is
gaining traction.
Phosphorous precipitation - Struvite crystallisation
The controlled precipitation of struvite from waste water could contribute to the reduction of phosphorous in
effluent. Due to struvite’s fertilising properties, it has potential to produce valuable fertiliser. A range of
processes (i.e. stirred tank reactors, air agitated and fluidised bed reactors) have been assessed as possible
means for this further processing. According to Corre et al. (2009), fluidised bed reactors are the most
promising, with the potential to remove up to 70% phosphorous or more, while Vaneeckhaute et al. (2018)
estimates this figure at 80-90%.169 According to Vaneeckhaute et al. (2018), this process has been fully
implemented for wastewater, sludge and manure treatment the uptake of this technology has not been
widespread due to economic and legislative developments and the difficulty in guaranteeing a pure product.
Phosphorous (P) extraction
Several companies have designed processes to extract P from ashes from the combustion of bio wastes and
materials including digestate (Vaneeckhaute et al. 2018). The ashes generally contain P, K, Al, Si compounds,
as well as potentially heavy metals. The phosphorus is bound as CaHPO4 and can then be sold on as a
chemical mineral fertiliser substitute. In a lot of countries digestate is eligible for recycling as a soil
conditioner and therefore not authorised to be converted into energy by combustion/pyrolysis according to
environmental legislation (Vaneeckhaute et al. 2018).
Micro filtration/Membrane filtration
Microfiltration, (MF) ultrafiltration (UF), nanofiltration (NF) and reverse osmosis (RO) are forms of pressure-
driven membrane filtration used in the treatment of wastewater. Thus far, they have not been established as
a valuable option for digestate treatment and few commercial pilot studies have been installed to date –
most are only on a short-term basis due to high upfront capital costs (Vaneeckhaute et al. 2018). RO has
been implemented at full-scale for NH3-stripping of liquid digestate in Denmark. In general, the application
of this process for digestate treatment is not widespread due to uncertainty over costs - membrane clogging,
and associated cleaning and replacement poses high energy and capital costs (Masse et al. 2007,
Vaneeckhaute et al. 2018).
Microalgae production
According to Fenton & Ó hUallacháin (2012), digestate has the potential to be used as a substitute for
inorganic fertiliser for the commercial production of algae. The harvested alga/macrophytes can be used as
feedstock for biofuels, animal feed or as an organic fertiliser. However, it is predicted that the breakthrough
of algae in the bio-based economy will take another 5–15 years, due to high costs compared to other types
of biomass (Vaneeckhaute et al. 2018).
169 This process has been fully implemented for wastewater, sludge and manure treatment

C1 © Wood Environment & Infrastructure Solutions UK Limited
February 2019
Doc Ref. 40039CL003i3
Appendix C
Evaluation matrix
The evaluation matrix is attached as separate excel document. It includes:
the evaluation sheet for all substances;
a literature list;
identified and evaluated information for each substance group;
a sheet describing the evaluation steps 1 to 3; and
the relevant substance list used for step 1.

D1 © Wood Environment & Infrastructure Solutions UK Limited
February 2019
Doc Ref. 40039CL003i3
Appendix D
Risk assessment supporting report

D2 © Wood Environment & Infrastructure Solutions UK Limited
February 2019
Doc Ref. 40039CL003i3
Executive Summary
Realistic worst case risk assessments have been carried out for selected priority chemicals that have
been detected in composts and digestates in Europe in recent literature. The focus of the exposure
assessments is the environment and humans exposed via food and drinking water. Exposures and risks
for two local scale scenarios are characterised. These scenarios consider the use of composts and
digestates as a fertiliser and soil conditions and use of composts as a growing media as follows:
I. Compost and digestate products, handling and application as soil amendment
application of compost; whole digestate; crude dry fibre and all liquid products
use on both large and small-scales by farmers/growers and the general public
any application onto soil post-use following use in container growing.
II. Compost used as a growing medium
use by professional and general public (amateur) growers.
The risk assessments combine an assessment of exposure with an analysis of hazard in order to
determine the likelihood of negative impacts. Were possible the significance of the estimated
exposures derived by modelling has been assessed by comparison with available measurements of soil
and water quality and/or from estimated exposures arising from the industrial lifecycle where this has
previously been assessed in an exposure assessment.
Where appropriate, estimated exposure levels are also compared with threshold levels associated with
toxicity hazards. In the risk assessment of chemical substances, the hazard is normally determined
based on the intrinsic properties of the substance. The risk is normally determined by the comparison
of an acceptable level of hazard (i.e. a ‘no effect concentration’) to the exposure concentration, in order
to derive a ratio of the exposure level to the no-effect level (a risk characterisation ratio (RCR)). This is
valid determinant for the cases where a safe threshold can be established. For some substances (e.g.
those which are SVHCs based on persistent, bioaccumulative and toxic (PBT) or very persistent and
very bioaccumulative (vPvB) properties, or those with a non-threshold toxicological effect) such a
comparison is not appropriate. In these cases, the focus of the risk assessment is on understanding of
how such substances of concern present in digestate and compost can migrate between the different
environmental compartments, at what concentrations, and with what environmental burden. This
information is useful in assessing if these concentrations can be reduced in the risk management
option analysis and analysis of alternatives.
The priority substances and chemical families considered in the risk assessment are as follows:
Heavy metals – represented by cadmium, nickel, lead, copper, zinc and mercury.
Bisphenol-A.
Phthalates – represented by di(2-ethylhexyl)phthalate (DEHP).
Pharmaceuticals – represented by 17α-Ethinylestradiol (EE2).
Hexabromocyclododecane (HBCDD).
Dioxins, furans and dioxin-like PCBs – represented by 2,3,7,8-tetrachlorodibenzodioxin
(2,3,7,8-TCDD) and 2,3,4,7,8-pentachlorodibenzofuran (2,3,4,7,8-PCDF).
Other PCB – represented by 2,4,4’-Trichlorobiphenyl (PCB-28).
Nonylphenol isomers and ethoxylates – represented by nonylphenol.

D3 © Wood Environment & Infrastructure Solutions UK Limited
February 2019
Doc Ref. 40039CL003i3
Polycyclic aromatic hydrocarbons (PAH) – represented by benzo[a]pyrene, chrysene,
benz[a]anthracene, benzo[b]fluoranthene and indeno[,2,3-cd]pyrene.
Perfluoralkyl substances (PFAs) – represented by perfluoroctanesulfonic acid (PFOS) and
undecafluorohexanoic acid (PFHxA).
Physical impurities – represented by microplastics.
It is important to note that a relatively simplistic realistic worst-case approach has be used in the risk
assessment in order to simplify the risk assessment process. The results of the risk assessment are
therefore subject to a number of uncertainties:
Assumptions made in defining the local exposure scenarios.
Amounts of compost and digestate used.
Concentrations of the substances within those composts and digestates.
Uncertainties over the properties of the substances.
Of these a key uncertainty is the concentrations of the substances found within composts and
digestates. The available data for many of the substances considered is limited, covering only a small
number of samples from a small number of regions/countries. In addition, the concentrations found in
compost and digestate is variable for some substances, with the range reported spanning several
orders of magnitude. Further some of the reported concentrations in the literature may reflect past use
of the substance and this may be an important consideration for substances where usage has declined
(or discontinued) in recent years. The uncertainties associated with each substance have been
considered as part of each risk assessment.
The main findings of the risk assessments are outlined below.
For substances where it was possible to estimated risk characterisation ratios, RCRs >1 (indicating a
potential risk) were found at the local scale in the following cases.
Nickel. The overall range of reported nickel concentrations in composts and digestates is
typically <10 to 39 mg/kg dry wt. However, levels above this (up to 250 mg/kg dry wt. in
compost and 40 mg/kg dry wt.) have been measured in some samples. A potential risk
from use of composts for container growing was identified and a safe limit of 7.9 mg/kg
dry wt. was estimated for this use. No risks were identified for use of compost and
digestate on agricultural land from the typical concentrations found, but a potential risk
was identified for this use when the maximum concentration measured in compost was
considered. This risk would be controlled if the concentration of nickel in compost or
digestate applied to agricultural land is 130 mg/kg dry wt. or lower; the majority of the
measured data are below this value. The available data set of occurrences in composts
and digestates covers only a limited number of countries. The nickel from compost and
digestate is estimated to contribute up to around 20% of the total background nickel
present in soil.
Copper. The overall range of reported copper levels in compost and digestate is up to
980 mg/kg dry wt., but more typically the levels are around 50-60 mg/kg dry wt. A
potential risk from use of composts for container growing was identified and a safe limit
of 200 mg/kg dry wt. was estimated for this use. The available data set of occurrences in
composts and digestates covers only a limited number of countries. Copper is an
essential element. Therefore, accumulation through the food chain is not a relevant
concept for copper and no quantitative assessment of secondary poisoning or man
D4 © Wood Environment & Infrastructure Solutions UK Limited
February 2019
Doc Ref. 40039CL003i3
exposed via the environment has been carried out. The copper from compost and
digestate is estimated to contribute up to around twice the amount of the background
level of copper present in soil.
Zinc. The overall range of reported zinc levels in compost and digestate is 132 to
1098 mg/kg dry wt., but median values are typically around 200-280 mg/kg dry wt. A
potential risk from use of composts and digestates on agricultural land and composts for
container growing was identified. A safe limit of 600 mg/kg dry wt. was derived for
application of compost and digestate to agricultural land, and a safe limit of 70 mg/kg
dry wt. was estimated for use as compost. The available data set of occurrences in
composts and digestates covers only a limited number of countries and there are also
uncertainties over the risk assessment at the regional level. Zinc is an essential element.
Therefore, accumulation through the food chain is not a relevant concept for zinc and no
quantitative assessment of secondary poisoning or man exposed via the environment
has been carried out. The input of zinc to agricultural soil from compost and digestate is
relatively small (around 10% of the total) compared with other sources.
Mercury. The overall range of reported mercury levels in compost and digestate <0.018
to 0.98 mg/kg dry wt. A safe limit of 0.2 mg/kg dry wt. was derived for application of
compost and digestate to agricultural land. Transport over long-distances is a possibility.
The available data set of occurrences in composts and digestates covers only a limited
number of countries. The overall contribution from compost and digestate to the total
concentration of mercury in agricultural soil is low.
Nonylphenol. The overall range of reported nonylphenol levels in compost and digestate
was <0.1 - 50 mg/kg dry wt.. A safe limit of 3.5 mg/kg dry wt. was derived for use of
compost in container growing. The available data set of occurrences in composts and
digestates covers only a limited number of countries. The estimated regional exposures
arising from the application of compost and digestate are very low compared with
natural background concentrations in fresh water and sediments based on data cited in
the ESR RAR (2008). The annual average EQS for inland surface waters (Directive
2008/105/EC as amended (2013/39/EU)) is not predicted to be exceeded.
No risks (RCRs<1) were identified in the following cases.
Cadmium. Many cadmium compounds have been identified as SVHCs under REACH
based on their carcinogenicity and in some case their mutagenicity. However, threshold
values have been established for cadmium exposure and these have been used in the
risk assessment. The median range of reported cadmium concentrations in composts and
digestates is approximately 0.2-0.8 mg/kg. No risks were identified at the limit value
from the proposal for the revised Fertilising Products Regulation (FPR). The majority of
the measured data are below this limit. However there is uncertainty over the safe
threshold for dietary exposure. In addition, the data set of occurrence in composts and
digestates covers only a limited number of countries. The contribution from compost
and digestate to the total cadmium present in soil from all sources is relatively small.
Substances for which quantitative RCRs or safe limit concentrations could not be determined are listed
below. For the following assessed substances, regional plus continental amounts exceeding ~10
tonnes were found at steady state.
Lead. Lead compounds are non-threshold neurotoxic substances. The overall range of
reported lead concentrations in composts and digestates is <2.5 to 230 mg/kg dry wt.,

D5 © Wood Environment & Infrastructure Solutions UK Limited
February 2019
Doc Ref. 40039CL003i3
but more typically <2.5 to 91 mg dry wt. The total steady-state mass predicted in the
region + continent is estimates as 1.41E+06 tonnes resulting from compost and
digestate use. A significant contribution from compost and digestate to the total
background level of lead in soil is predicted.
DEHP is an SVHC in REACH based on toxicity to reproduction and endocrine disrupting
properties. The overall range of reported DEHP concentrations in composts and
digestates is 0.6 to at least 140 mg/kg dry wt. (the upper limit value is reportedly an
average). The total steady-state mass predicted in the region + continent is estimates as
1850 tonnes resulting from compost and digestate use.
PAH are of concern in respect of CMR, PBT and vPvB properties; several are SVHC based
on these properties. The overall range of reported concentrations in composts and
digestates is <0.04 – 0.52 mg benzo[a]pyrene/kg dry wt., <0.04 – 0.61 mg chrysene/kg
dry wt., <0.04 – 0.33 mg benz[a]anthracene/kg dry wt., 0.12-2.14 mg
benzo[b]fluoranthene/kg dry wt., <0.04-2.32 mg indeno[1,2,3-cd]pyrene /kg dry wt., and
<0.3 – 20.8 mg total PAH/kg. The total estimated steady-state mass predicted in the
region + continent at steady state varies between ca 14 t (indeno[1,2,3-cd]pyrene) and ca
170 t (benzo[b]fluoranthene) resulting from compost and digestate use.

D6 © Wood Environment & Infrastructure Solutions UK Limited
February 2019
Doc Ref. 40039CL003i3
Introduction
This Appendix and its annex outlines the application scenarios assessed for compost and digestate
products, which can be differentiated in a meaningful way and for which separate assessment
scenarios are therefore useful. On this basis, the team has defined two local scenarios. This project has
applied these scenarios in assessing several priority chemicals that have been detected in composts
and digestates in Europe in recent literature. The section also sets out some of the inter-relationships
between various key input parameters and outputs from the EUSES model.
The focus of the risk assessment in this project is the environment, and humans exposed via food and
drinking water. The methods applied follow ECHA guidance1, as far as possible. The assessment uses
standard exposure models to estimate the distribution of chemical contaminants from the application
of fertilisers on agricultural land, and as a result of similar uses such as in domestic or allotment
gardening.
The focus is on composts and digestates applied to soil as a fertiliser and soil conditioner and those
used as a growing medium. As agreed with the European Commission at the inception meeting, the
assessment has used exposure scenarios developed for the known contexts of use of compost or
digestate. The assessment also takes account of the use of different types of product by different types
of user (i.e. domestic garden, consumer allotment garden, commercial agriculture).
The type of modelling usually applied for exposure estimation within risk assessment of chemicals is
based on fugacity. This is the propensity for a substance, based on its physicochemical properties
(such as the octanol-water partition coefficient and Henry’s law constant), to move from one
environmental medium (compartment) to another. In this, case the partitioning between interstitial
water and organic carbon within the compost/digestate and soil matrix, along with the degradation
potential, are important factors that affect the environmental fate and hence the modelled predicted
environmental concentrations (PECs).
Risk assessment is an analysis of hazard and exposure to determine the likelihood of negative impacts.
The significance of the estimated exposures derived by modelling is assessed by comparison with
available measurements of soil and water quality and/or from estimated exposures arising from the
industrial life cycle where this has previously been assessed in an exposure assessment2.
Comparison with reliable measured data is a useful validation of the model method used. However, it
is important to note that such survey data may be influenced by sources of the substances other than
compost and digestate, for example many metals occur naturally in soil and processes such as
atmospheric deposition onto crops may also be important for some substances. This context can be
important for some cases. Likewise, in other cases, measured data may not be available for
environmental concentrations influenced substantially by compost and digestate application.
Where appropriate, the assessment characterises risk, by comparing estimated exposure levels with
threshold safe limit levels (associated with toxicity hazards) relevant in the EU. In the risk assessment of
chemical substances, the hazard is normally determined based on the intrinsic properties of the
substance. The risk is normally determined by the comparison of an acceptable level of hazard (i.e. a
‘no effect concentration’) to the exposure concentration, in order to derive a ratio of the exposure level
to the no-effect level (a risk characterisation ratio). This is valid for the cases where a safe threshold (no
adverse effect level) can be established. For some substances this is not appropriate (e.g. for
2 Extensive literature searching for exposures arising from industrial use is outside the scope of the present work.

D7 © Wood Environment & Infrastructure Solutions UK Limited
February 2019
Doc Ref. 40039CL003i3
substances which are SVHC based on PBT/vPvB or equivalent concern or those with a non-threshold
toxicological effect such as various carcinogens). What is important in these cases, however, is
understanding of how substances of concern that are present in digestate and compost can migrate
between the different environmental compartments, at what concentrations, and with what
environmental burden based on total load. This information is useful in assessing if these
concentrations can be reduced in the risk management option analysis and analysis of alternatives.
The exposure assessment uses simple scenarios, focusing on the use of composts and digestates
applied to soil as a fertiliser and soil conditioner, and additionally use of compost as a growing
medium. The assessments cover the environment and humans exposed via the environment for a
series of selected chemicals. The protection targets for assessment are the terrestrial environment,
aquatic environment (surface water and groundwater) and humans exposed via the environment
(particularly via diet and drinking water). Some exclusions from the scope, agreed during the inception
phase of the present project, are noted (under a specific subheading) below; these have not been
assessed further.

D8 © Wood Environment & Infrastructure Solutions UK Limited
February 2019
Doc Ref. 40039CL003i3
1. Scenario development
1.1 Models, tools and defaults
ECHA Guidance on information requirements and chemical safety assessment, Part R.16 (ECHA, 2016)
defines the approach to assessing soil exposure to chemicals via the application of sewage sludge and
related models. This is the basis of the risk assessment approach in the current project.
The methods outlined in ECHA Guidance R.16 are applied via the EUSES3 tool (including spreadsheet
versions). The team also consulted the sector-specific environmental assessment parameters published
by industry groups European Crop Protection Agency4 (ECPA) and Fertilizers Europe5 (intended for use
by REACH registrants).
The important variables for the risk assessment, and how these have been dealt with within the risk
assessment scenarios in this project, are discussed in connection with each assessed substance and
illustrated in subsections on ‘Sensitivity to specific variables’. The Annex to this report presents further
discussion of defaults assumed in the R.16 default scenario and how they influence the exposures
estimated in this work.
1.2 Compost and digestate products and their applications
WRAP (2011a) reports that there are three main types of digestate commercially available (termed
whole, liquid or liquor, and fibre), since digester plant operators may choose to separate the product
for operational reasons. Whole digestate was reportedly the most commonly available type at the time
of that report. The separated fibre fraction still retains moisture and is typically between 20% and 40%
dry matter, while the liquid fraction is reportedly between 1% and 4% dry matter, although these
proportions will vary depending upon the separation process or processes employed. Refer to the
Annex Section 4.1 for further details of the characteristics of composts and digestates.
Whole digestate, digestate fibre, and compost can be assessed together using exposure scenarios
defined in terms of mass as dry weight per hectare (ha) or as concentration in dry weight terms.
The raw material feedstocks from which composts and digestates are prepared can originate from a
range of sources. The literature research indicates in many cases both the raw material types and
preparation/treatment methods associated with each sample.
The occurrence of chemical contaminants in such products would typically arise from their presence in
the raw materials prior to the composting or anaerobic digestion process. The conditions under which
composting and anaerobic digestion processes take place could affect the chemistry of contaminant
substances, for example: pH conditions; moisture levels; aerobic or anaerobic conditions; or thermal
decomposition (composting and anaerobic digesters can reach temperatures of 60-70°C or higher
(Saveyn and Eder, EC, 2014)). The literature research has focussed on substance concentrations found
in C/D products after processing and ready for application, hence it is not necessary to adjust for these
factors in the exposure assessment.
3 The European Union System for the Evaluation of Substances: https://ec.europa.eu/jrc/en/scientific-tool/european-union-
system-evaluation-substances. 4 http://www.ecpa.eu/pre-market-resources-for-industry/reach-registration-evaluation-authorisation-and-restriction-chemicals 5 http://www.reachfertilizers.com/

D9 © Wood Environment & Infrastructure Solutions UK Limited
February 2019
Doc Ref. 40039CL003i3
For some of the selected priority chemicals for assessment within the scope of this project, a standard
environmental exposure assessment or risk assessment was conducted under the previous Existing
Substances Regulation. Where these assessments exist they already cover a quantitative assessment of
the same target organisms and populations, usually based on estimated releases from the industrial
life cycle via wastewater treatment plant sludge. The present assessment expands on any such pre-
existing assessment, by applying measured concentrations in the C/D.
The present assessment also offers the opportunity to refine aspects of the use scenario for compost
or digestate in agriculture and related uses. This does not in any way undermine the standard
approach defined in guidance part R.16 which is entirely fit for purpose.
1.3 The compost and digestate life cycle
The life cycle of digestates and composts in the agricultural context is illustrated overleaf.

D10 © Wood Environment & Infrastructure Solutions UK Limited
February 2019
Doc Ref. 40039CL003i3
Figure 1.1 Summary life cycle of composts and digestates

D11 © Wood Environment & Infrastructure Solutions UK Limited
February 2019
Doc Ref. 40039CL003i3
1.4 Defining exposure scenarios for quantitative exposure
assessment
Given the limited amount of quantitative data that are available, the scenarios developed are relatively
simple. However, it is important not to neglect releases e.g. from the handling and use of products by
users alongside the main mode of use.
Two separate local scenarios are discussed in the following sections:
I. C/D products, handling and application as soil amendment
application of compost; whole digestate; crude dry fibre and all liquid products
use on both large and small-scales by farmers/growers and the general public
any application onto soil post-use following use in container growing.
II. Compost used as a growing medium
use by professional and general public (amateur) growers.
Agreed exclusions are outlined below.
The assessment made in this project focuses on the exposure resulting from application of
contaminated C/D. Possible exposure from industrial point sources and wide-dispersive uses is not
included in the modelling.
Exposure and risks for workers and consumers handling the compost/digestate product is outside the
scope of this work, as is environmental exposure assessment for site location(s) where the
compost/digestate product is processed and prepared prior to application.
A full environmental exposure assessment covering all contributing sources would normally take into
account exposure via air, which could contribute to predicted environmental concentrations and
dietary exposures at the background level, particularly from other environmental pathways such as the
industrial life cycle of the same contaminant chemical. However as this exposure route is not
considered relevant for application of C/D, direct releases to air are excluded.
The option to assess application of liquid digestate fertiliser by aerial spraying in a fully separate
scenario was considered early in the project, but it was agreed with the client to merge the scenarios
with no need to consider this separately. If applicable, any application by spraying is covered by Local
Scenario I6.
6 The user consultation suggests this is not a significant form of application, which called into question the relevance and realism
of the scenario; the frequency of application is assumed to be the same as for use of other digestate forms, while the application
area and degree of incorporation differ. The exposure is proportionate to loading rate, which is expected to be the same
regardless of application method in view that the user will adapt the loading of digestate accordingly to deliver the desired
amount of nutrients, whichever form of digestate fertiliser is chosen.

D12 © Wood Environment & Infrastructure Solutions UK Limited
February 2019
Doc Ref. 40039CL003i3
1.5 Scenario I: Compost and digestate products, handling and
application as soil amendment: key assumptions and
parameters
1.5.1 Nature of the products and mode of use
This scenario applies to both composts and digestates, which can be derived from a range of starting
materials.
The main product types considered are:
Compost
Whole digestate
Separated digestate fibre
Liquid digestate
Whole digestate may be separated into dry fibre and aqueous liquor.
In simplistic terms, the application to soil of either compost or solid digestate is analogous to the
application of sewage sludge as an essentially solid material directly to soil. The ECHA risk assessment
framework assumes application of the sewage sludge at a standard rate once per year to either
agricultural soil or grassland, with incorporation to a standard depth once applied to the soil. The
yearly application is considered to occur for ten consecutive years. In the absence of specific
information from the consultation and research phase, it is reasonable to consider that the ECHA
scenario is applicable when compost, whole digestate or digestate fibre are used.
Liquid digestate is rich in organics and nutrients and may be used as a fertiliser separately from the
solid. The aqueous concentration of contaminant chemicals in liquor will depend on the physical and
chemical composition of the digestate (for example the content of particulates and fibres; dissolved
and dispersed organic carbon and the contaminant chemical’s solubility in water and affinity for
organic carbon). Concentrations of substances in digestates are generally reported in terms of mg/kg
dry weight of digestate solids. Furthermore, it is not fully clear whether reported concentrations in
digestates relate to whole digestates or separated fibre portion. The reported values are also quite
variable in some cases. In view of these contributing uncertainties it is not appropriate to develop
complex scenarios given the data currently available. Annex 4.4 of this report describes the approach
taken in the assessments.
In the event that liquid digestate is applied using spraying equipment, there is potential for overspray
(spray drift) to occur with a resulting potential for direct discharge into surface water (for example into
a stream or river bordering a field). It is acknowledged that consultation (particularly the response by
EBA, 2018, presented in the (draft) final report and corroborated by WRAP, 2016) suggests that, of the
application methods available, direct application (using equipment which minimises the possibility of
volatile losses of the useful nitrogen compounds as well as managing odour), appears likely to account
for the majority of liquid digestate use. Exposure of contaminant substances introduced via liquid
products that are incorporated into soil by injection can be assessed using the same scenario as whole
products and composts. This has an advantage of simplicity in that it does not require assumptions to
be made over the fraction of the digestate that is applied in whole form or in liquid form or using
specific application equipment.
Regardless of the application method or the form of the compost/digestate, the potential exists for
handling losses which could pass to waste water or direct to surface water: arising from

D13 © Wood Environment & Infrastructure Solutions UK Limited
February 2019
Doc Ref. 40039CL003i3
loading/unloading of the transportation container / on-site storage container; cleaning of on-site
storage container and application equipment. Such releases will be small in absolute quantity
compared to the application to land, but have the potential to enter watercourses directly. A small
surface water release would also cover any incidental release to water during application (e.g.
overspray, spillages, run-off). The absolute mass releases associated with each of these possible
contributing scenarios is not known precisely and consultation in the scope of this project has not
revealed definitive information. Therefore, a pragmatic approach has been taken. Specific
Environmental Release categories (SPERCs) defined by sector groups relevant for agricultural scenarios,
from ECPA and FEE, are defined with fraction release to water values of between 1.6 (FEE SPERC value
is 1.57%-3.32% depending on crop type) and 2.8% (ECPA SPERC value is 2.8%), for release to water
arising from overspray during application. Whilst the evidence suggests that application by spraying is
not extensive, it is postulated that a release of this size should cover any loss from
storage/handling/cleaning and/or any direct release from application (e.g. overspray, overspill, runoff
during application) at the local site. Effectively the reasoning is that the releases from all these
contributing sources combined will be similar to those from overspray where applicable. In the worst
case this release could enter the surface water directly without passing through a wastewater
treatment plant. All of the remainder of the substance (e.g. 100%-2.8%=97.2%) is applied to soil either
as compost, whole digestate or liquid digestate.
1.5.2 Parameters associated with application
Growers apply compost, solid digestate or liquid digestate as a fertiliser with a relatively high nutrient content, with additional benefits as a soil improver. Using such products can be beneficial in pH stabilisation, aeration, increase of soil organic matter, and improving water retention.
The standard ECHA REACH guidance scenario (ECHA, 2016) assumes once-annual application of
biosolid on agricultural land and grassland for ten consecutive years. Research has not revealed
evidence to directly support or contradict this. In principle it appears that, provided any restrictions
such as existing national specified limits are complied with (where applicable), European farmers may
apply the products as needed.
To avoid loss of soluble nutrients over time, the guidance recommends applying the fertilisers shortly
before planting, subject to specified grazing and harvest intervals which may apply. For example,
WRAP (2016) presents a summary of the recommended timings of application for different grades of
C/D in light of the context (the nature of the crops; no-graze periods for livestock grassland/forage;
and no-harvest intervals for crops; and dependent on whether the compost or digestate is pasteurised
to the applicable BSI standards). In case of application more than once-annually, in terms of the
exposure assessment, the degree of degradation of a substance in soil since the preceding application
could be affected by this. A simplistic approach within EUSES would be to model a larger single
application to account for the total applied per year. While other exposure modelling tools (ECPA-LET,
Steps 1-2 in FOCUS) allow for repeat application, EUSES was selected as the primary exposure
modelling tool in this project in view of its models being fully aligned to the standard approaches
defined in ECHA R.16 guidance and this was considered more important for the work than an
alternative model that included the possibility to adapt for repeat application, particularly when
definite evidence is lacking.
In principle, repeated applications of C/D could actually increase the soil horizon and hence slightly
dilute the contaminants (ECN, 2015) in the long-term. The ECHA risk assessment framework assumes a
10-year application period in estimating the local concentrations, so in order to simplify the approach,
the effects of such dilution do not require detailed adjustment.

D14 © Wood Environment & Infrastructure Solutions UK Limited
February 2019
Doc Ref. 40039CL003i3
1.5.3 Local Scenario I: defining the scenario in EUSES
The release values of specific substances due to the handling and application of C/D products as a soil
amendment (local scenario I) derive from the concentrations in C/D reported in literature, using
equations developed for the purpose of the present project. These values are key inputs in EUSES for
the exposure model of local scenario I. The inputs used, and calculation method where applicable, are
set out in Table 1.1 below.
The release to water in this scenario is the total amount of chemical entering a local surface
watercourse per day based on a single tankerload (arising from spillages, use in field, and cleaning of
equipment, and subsequent run-off passing directly into local water rather than being diverted to the
wastewater treatment system). It is set as release to waste-water, but without subsequent waste-water
treatment in a sewage-treatment plant. Different approaches were investigated early in the project to
quantify the release to water. All are subject to uncertainties. The calculation approach described
below is considered to be reasonably conservative as well as being a convenient way to use the
features of EUSES to incorporate regional background for surface water in addition to this realistic
worst case contribution coming from the immediate locality.
Table 1.1 Key parameters of EUSES set-up for Scenario I (local)
EUSES input
Parameter
Value Comment
Chemical properties
(physicochemical,
degradation,
transport/distribution,
PNECs (where
defined)
Substance-specific Values to be used are set according to existing
regulatory assessments
Daily release rate to
waste water (kg/d)
(entered at the local
releases screen)
Calculate based on
0.25 * 140 kg dry wt./d * Concentration in dry
sewage sludge value (see below) in mg/kg dry
wt. * 1E-06
The value of 0.25 in this equation comes from an
assumption that the release to water is likely to
occur over the course of a few days owing to
rainfall and slow drainage of run-off. For
example, runoff/drainage in the ECPA scenario is
calculated over 4 days following the (final)
application.
The value of 140 kg/d is derived as 0.028 * 5 t
(dw) (taken to be the approximate dry weight
equivalent of a tanker load sized delivery of dry
or slurry product).
The value of 0.028 used in the equation above is
the release of plant protection product to surface
water during use assumed in ECPA SPERCs.
The value of 1E-06 is a units correction factor to
convert mg/d to kg/d
SimpleTreat settings Set SimpleTreat to ‘bypass STP’ so that the
release to waste water calculated above
passes to local surface water
Conservative in respect of freshwater and
associated food chains. Risks in WWTP
microorganisms are outside the scope of the
present work but would have been characterised
in any pre-existing mainstream exposure
assessment looking at industrial use.

D15 © Wood Environment & Infrastructure Solutions UK Limited
February 2019
Doc Ref. 40039CL003i3
EUSES input
Parameter
Value Comment
Concentration in dry
sewage sludge
(mg/kg dry wt.)
(entered at the
SimpleTreat outputs
screen)
Concentration (highest reliable value) from
literature for concentration in any compost or
digestate product, used directly
Based on literature evidence for contaminant
concentration of the assessed chemical
Where useful to examine sensitivity to this
variable, the assessment also uses an alternative
concentration based on mid-range values
(particularly where the worst-case assessment
indicates concerns).
Note that EUSES uses this value even though
Simpletreat is set to ‘Bypass STP’
Note: unless stated otherwise, standard defaults are assumed
1.6 Scenario II: Composts used as a growing medium, for
professional or consumer use
1.6.1 Nature of the products and mode of use
This scenario applies specifically to composts, which can be derived from a range of starting materials.
For composts used for professional or consumer use, compost may be used directly as a component of
the growing medium. Saveyn and Eder (2014, quoting WRAP guidelines) indicate that such composts
‘would normally be suitable for use as a growing medium constituent at a maximum rate of 33% by
volume in combination with peat and/or other suitable low nutrient substrate(s) such as bark,
processed wood, forestry coproducts or coir’ and remark that higher rates usually affect plant growth
negatively because of the compost’s naturally high conductivity. The realistic worst case scenario
therefore assumes use in a diluted form (33% w/w). However, in the worst case, a compost product
could possibly be used as such as growing medium and it would be hard to control that, particularly in
regard to use by the general population.
The subsequent intake into root crops and leaf crops for human exposure is modelled in EUSES by the
usual methods as described in ECHA R.16 guidance (ECHA, 2016, Section A.16-3.3.9 Humans exposed
indirectly via the environment). The sensitivity of the outcomes for Scenario II to possible losses from
the system by leaching has been explored using a fugacity method, as discussed further in Section 2.2.
The scope of Scenario II covers use of compost in growing medium in container beds, bags, or pots;
which may vary in the physical design, materials, porosity, size and management of the system. The
substance introduced into the container system via contaminated compost can be expected to
distribute according to its chemical properties between the growing medium solid phase (organic and
inorganic constituents); interstitial water (soil pore-water) and air; be taken up into plants and other
soil biota. Leaching of substances out of the system via drainage of interstitial water, as well as loss
from the system by volatilisation could occur.
The purpose and intention of the local scenario II is to assess well managed container growing
resulting in edible crops which are consumed by humans, under realistic worst case conditions. As such
loss from these mechanisms are assumed to be negligible in the baseline assessments for local
Scenario II.

D16 © Wood Environment & Infrastructure Solutions UK Limited
February 2019
Doc Ref. 40039CL003i3
1.6.2 Local Scenario II: defining the scenario in EUSES
For this use there would be no direct addition to soil in the course of use7 and there is limited potential
for leaching from soil into groundwater or surface water. However, the substances of interest could be
present in the compost and be available for uptake into plants grown in that compost, with
subsequent potential for human exposure if those plants are edible crops. In order to take this into
account the assessment calculates the concentration of specific substances in compost in a mixed
growing medium (local scenario II), used in EUSES in place of the concentration of the substance in
agricultural soil. EUSES models the subsequent uptake into plants and the resulting human exposure.
The release values derive directly from the concentrations in compost specifically, as reported in
literature, using equations developed for the purpose of the present project. These values are then
entered in EUSES as key inputs for the exposure model of local scenario II. The inputs used are set out
in Table 1.2 below.
Table 1.2 Key parameters of EUSES set-up for Scenario II (local)
Parameter Value Comment
Chemical properties
(physicochemical, degradation,
transport/distribution, PNECs (where
defined)
Substance-specific Values to be used are set according to
existing regulatory assessments
Daily release rate to waste water
(kg/d)
(entered at the local releases screen)
0
SimpleTreat settings n/a Assuming no local releases to waste
water
Concentration in agric. soil averaged
over 30 / 180 days (mg/kg dry wt.)
(entered at the Local concentrations
and depositions screen)
Calculate based on
0.33 * Concentration (highest reliable
value) from literature for concentration
in compost specifically
Based on literature evidence for
contaminant concentration of the
assessed chemical
0.33 comes from the assumption that
best practice would be to dilute the
compost by mixing in a ratio of 1:2 with
other media prior to use, and
represents the realistic worst case, but
it is noted this is difficult to enforce. In
the worst case the compost could be
used unmixed.
Concentration in grassland averaged
over 180 days (mg/kg dry wt.) 0 The pasture grazing exposure route is
not applicable for this scenario
7 It is noted that spent compost could be disposed of onto soil at the end of the growing season, but exposure in this
circumstance would not exceed that from the general fertiliser and soil improver scenario.

D17 © Wood Environment & Infrastructure Solutions UK Limited
February 2019
Doc Ref. 40039CL003i3
1.7 Regional background exposure
1.7.1 Nature of the products and mode of use
The background exposure covers both composts and digestates, which can be derived from a range
of starting materials, and both use by application to land and in container growing.
There are two objectives in making a regional releases estimate in this project: firstly, to take account
of the background contribution to local exposure arising from the compost/digestate use at a regional
level, making use of the quantitative data available for EU member states; secondly it allows the
estimated exposure via the use of C/D to be quantified which can then be compared with existing
regional background values which take into account other sources of the same substance (such as
releases from industrial sites); this allows the C/D exposure to be understood in context.
The EUSES model uses a regional8 concentration (PECregional) in water, sediment, soil and air, to
represent the background concentration of the substance in a heavily industrialised area. These
regional concentrations add to the predicted concentration from a local source (such as resulting from
application of digestate to a field) to give the final local predicted environmental concentration
(PEClocal).
The regional concentration is normally determined based on the consideration of the entire life-cycle
of a substance and takes into account the release from all possible sources. Full determination of the
regional concentration for all of the substances considered in this report is beyond the scope of the
project.
A regional concentration from the use of digestate and/or compost alone has been generated by
EUSES based on the knowledge of the total amount of digestate and/or compost containing the
substance in the EU. The regional emissions and calculations are always averaged over 365 days. It is
noted that this “added risk” method relates to the contribution to regional background due specifically
to the long-term use of compost or digestate and disregarding other exposure pathways (such as
industrial releases), at steady-state and will not take account of other sources of the contaminants.
The resulting regional PECs can be compared with existing regional background concentrations from
existing risk assessment or risk evaluation reports where possible. This could include modelled values
from prior EUSES-based assessments, and/or values based on measurements. Chemicals which are
already under regulatory control may be in a phase of declining use in Europe since the time that the
pre-existing risk assessment was conducted. The present-day accuracy of the reported European
background concentrations will therefore vary from case to case.
1.7.2 Regional scale: defining the scenario in EUSES
The regional assessment assumes that 10% of the total C/D is applied in a region. This is conservative
but consistent with the known amounts of C/D used in EU countries, taking into account the
agricultural land use in those countries (refer to Section 6.5 in the Annex).
8 Within the ECHA (2016) approach the region is taken to be a typical densely populated and heavily industrialised area (size 200
km x 200 km with a population of 20 million inhabitants) in which 10% of the total EU industrial activity takes place.

D18 © Wood Environment & Infrastructure Solutions UK Limited
February 2019
Doc Ref. 40039CL003i3
Table 1.3 Key parameters of EUSES set-up for regional and continental exposure
Parameter Value Comment
Mass of substance in EU-28 in
compost (kg/y) 1 Calculated as
EU total mass compost (t/y dw) *
Concentration (mean or median) in
compost (mg/kg dry wt.) * 1E-03
Value derived from available literature
concentrations in compost products
specifically
Mass of substance in EU-28 in
digestate (kg/y) 1 Calculated as
EU total mass digestate (dw) *
Concentration (mean or median) in
digestate (mg/kg dry wt.)
Value derived from available literature
concentrations in digestate products
specifically
Total regional emission to surface
water (kg/d)
(entered in Regional and continental
total emissions screen)
Calculated as
0.1 * 0.028 *(Mass of substance in EU-
28 in compost + Mass of substance in
EU-28 in digestate)/365
The value of 0.028 in this equation is
the release of plant protection product
to surface water during use assumed in
ECPA SPERCs
The value of 0.1 in this equation relates
to the fraction of overall EU use in the
main region. The value of 0.1 is the
default in EU R.16 guidance and in
EUSES for wide-dispersive uses and was
found to be reasonably conservative
based on EUROSTAT land use data9
Total regional emission to
agricultural soil (kg/d)
(entered in Regional and continental
total emissions screen)
Calculated as
0.1 * 0.972 *(Mass of substance in EU-
28 in compost + Mass of substance in
EU-28 in digestate)/365
The value of 0.972 in this equation is
calculated as 1-0.028 (see comment
above)
The value of 0.1 in this equation relates
to the fraction of overall EU use in the
main region. The value of 0.1 is the
default in EU R.16 guidance and in
EUSES for wide-dispersive uses and was
found to be reasonably conservative
based on EUROSTAT land use data
Total continental emission to surface
water (kg/d)
(entered in Regional and continental
total emissions screen)
Calculated as
0.9 * 0.028 *(Mass of substance in EU-
28 in compost + Mass of substance in
EU-28 in digestate)/365
This relates to the EU continent
excluding the main region (for the
contributions within the main region,
refer to the rows above)
The value of 0.028 in this equation is
the release of plant protection product
to surface water during use assumed in
ECPA SPERCs
Total continental emission to
agricultural soil (kg/d) Calculated as This relates to the EU continent
excluding the main region (for the
9 This is discussed further in Annex 6.5.

D19 © Wood Environment & Infrastructure Solutions UK Limited
February 2019
Doc Ref. 40039CL003i3
Parameter Value Comment
(entered in Regional and continental
total emissions screen)
0.9 * 0.972 *(Mass of substance in EU-
28 in compost + Mass of substance in
EU-28 in digestate)/365
contributions within the main region,
refer to the rows above)
The value of 0.972 in this equation is
calculated as 1-0.028 (see comment
above)
Note: 1 - Calculated outside EUSES

D20 © Wood Environment & Infrastructure Solutions UK Limited
February 2019
Doc Ref. 40039CL003i3
2. Discussion of some specific topics
2.1 Approach to assessment of substances with non-threshold
hazards and effects
Several of the assessed substances are persistent, bioaccumulative and toxic (PBT); very persistent and
very bioaccumulative (vPvB); carcinogens, mutagens or toxic to reproduction (CMR); endocrine
disrupting; and/or persistent organic pollutants (POPs). There may or may not be precedent for an
effect threshold, but even where these exist a true quantitative risk characterisation ratio as such would
not be considered meaningful in a REACH context. As discussed and agreed in the course of the
project, it is not appropriate to quantify a risk characterisation ratio in these circumstances. Specifically,
for any non-threshold hazard affecting a target population (i.e. humans via the environment, or
environmental organisms), it is not feasible to derive or interpret a quantitative risk characterisation
ratio that takes into account these hazardous properties, which are considered to be of greater
significance than any other hazards to the same target populations, for which a PNEC or DNEL could
be determined.
Therefore, for substances with a non-threshold environmental concern the following approach has
been used:
This report presents PECs.
In case a PNEC had been developed in a prior regulatory assessment in the public
domain, this is noted. EQS in the public domain are presented and predicted
concentrations in water and in predators’ diet (fish, earthworms) are compared with the
applicable EQS limit values.
RCRs are not derived.
For substances with a non-threshold human health concern the following approach has been used:
Human local total daily intake levels, and predator exposure levels via diet, are
presented.
In case a DNEL, NOAEL, or tolerable daily intake had been developed in a prior
regulatory assessment in the public domain, this is noted.
RCRs are not derived.
The following information is presented (where sufficient information is available to allow calculation):
Total amount of the substance that will be present in C/Ds – this is estimated using the
concentration(s) in the compost/digestate(s) and the amount(s) of compost/digestate(s)
generated.
The estimated steady state masses and percentage distribution in the various
environmental compartments. This has been estimated from the regional model within
EUSES and represents the steady state distribution following continuous use of the
compost/digestate10.
10 Please note that the steady state predicted by the model are the amounts and distribution of the substance at the regional
and continental scale arising from the compost and digestate use application pathway only. Adding in the release of the same
substances via other pathways (air and waste water) could lead to a different steady state balance.

D21 © Wood Environment & Infrastructure Solutions UK Limited
February 2019
Doc Ref. 40039CL003i3
2.2 Sources of uncertainty in the risk assessment and approach to
evaluation of sensitivity
The key sources of uncertainty in the assessment are:
Uncertainties in the assumptions made in defining the local exposure scenarios.
Uncertainties in the amounts of C/D used.
Uncertainties in the concentrations of the substances within those composts and
digestates.
Uncertainties over the properties of the substances.
Each of these contributing uncertainties is discussed below.
Uncertainties in the assumptions made in defining the local exposure scenarios
The specific parameters of the local assessments could vary from one location to another depending
on the facilities, quantities and working practices.
In respect of local Scenario I, the general principles of application to agricultural and grass land with a
small fraction passing direct to water has clear precedents and is a reasonable basis for a realistic worst
case screening examination.
Furthermore, an assessment at the regional scale has also been made, which takes account of
degradation and distribution processes.
In respect of local Scenario II, the sensitivity of the outcomes to possible losses from the system by
leaching has been explored using a fugacity method, described below.
Both the physicochemical characteristics of the contaminant chemical, and also the design and
management of the container growing system, affect the possible significance of volatilisation and
leaching to lead to loss of substance from the container altogether and impact the estimate of local
PEC for local Scenario II. The design and management aspect will vary from situation to situation. For
example:
If the container stands in a drip tray this would keep compost in contact and in
equilibrium with any excess water that drains out of the compost; whereas if the
container is free draining then any leached chemical would be lost from the system.
A regime of watering heavily from above could lead to more water exchange throughout
the system than if water is provided mainly from a tray below the container by
absorption.
If a surface mulch of organic matter, card or polythene is in place at the upper surface of
the growing medium this could inhibit volatile losses to some extent.
The assessment of this sensitivity used a Microsoft Excel spreadsheet-based multi-media fugacity
model based on equations established by Mackay (1991)11. This model approach has its own
uncertainties, but it gives at least some insights. The soil matrix is treated as four phases: air, water,
11 Mackay 1991: Multimedia environmental models: The fugacity approach. Donald Mackay. Lewis Publishers,
Michigan, USA. 1991

D22 © Wood Environment & Infrastructure Solutions UK Limited
February 2019
Doc Ref. 40039CL003i3
organic matter and mineral matter. The volume fractions and densities of the four phases, the soil area
and depth and concentration of the chemical are specified. The chemical is assumed to be evenly
distributed throughout the soil volume and the fugacity calculation is completed using the
physicochemical property data of the chemical. This gives the equilibrium distribution of the chemical
between the four phases.
It is to be expected that the water content of the system will vary as water is added and lost by
volatilisation/transpiration by plants. As long as the water holding capacity is not exceeded, substances
present will partition between phases, but remain within the system/container.
Leaching as such could occur when excess water is added to a system already at capacity. If excess
clean water is then introduced to such a system, it could displace some or all of the system’s interstitial
water (along with any substance dissolved in it). Hence to assess the sensitivity of a substance to be
leached out, an adjusted system composition is modelled to reflect a much higher water content than
the EUSES standard soil, approaching or exceeding the water holding capacity. The adjusted ‘high
water content’ composition is defined as 16% solids, 64% water and 20% air by volume (for
comparison, a standard soil defined in ECHA R.16 guidance is 60% solids, 20% water and 20% air). The
water holding capacity of the compost component of the solids is based on a range 3.5-4.4 g water/g
dry matter for compost (El-Sayed G. Khater, 2015).
Hence substances which have more than a few % distributed to the interstitial water at equilibrium
under these ‘high water content’ conditions are seen as sensitive to the approach to water
management in Scenario II, for which PECs and indirect exposure of humans estimated in the ‘baseline’
assessments could be too high. This is noted case by case. For the majority of substances assessed as
part of this project it was found that the proportion of substance in interstitial water in the system and
hence sensitive to leaching is low (a few percent or less).
It is reasonable to expect that agricultural growers are likely to manage watering with some degree of
care to maximise yields and quality, since water-logging can contribute to problems such as plant
disease and rotting of root tissue. With regard to human exposure via fruit and vegetables, container
growing with poor water management is less likely to produce good-quality edible produce.
Uncertainties in the model tools and scenarios
The substance-specific assessments are deliberately conservative and relatively broad, intended to give
a (realistic) worst case.
The industry sector group ECPA has made available the ECPA-LET tool within which spreadsheet
macros apply key elements from the STEPS 1-2 in FOCUS model for plant protection products. Some
of the assumptions and parameters differ from ECHA standard models, for example, degradation is
assumed when calculating local PECs in freshwater and sediment; the local water and sediment
compartments have different dimensions than in EUSES; the methodology for PEC soil includes an
adjustment for volatilisation removal which can be significant for substances of high vapour pressure;
and the methodology for calculating local PECs for water and particularly for sediment differ from
EUSES, resulting in quite different PEC values.
In general, the methodology of EUSES is more conservative and more adaptable and allows a self-
contained scenario to be constructed. It is therefore appropriate to carry out all modelling within
EUSES within the scope of the current study.
It is noted that a project is in progress to adapt EUSES. The models associated with aerial deposition
and re-volatilisation from soil are potentially affected but the effect is unlikely to be significant for local

D23 © Wood Environment & Infrastructure Solutions UK Limited
February 2019
Doc Ref. 40039CL003i3
PECs for the types of substances assessed in this project, particularly given that the major exposure is
direct application and incorporation into the soil surface.
Uncertainties in the amounts of compost and digestate used
The quantity of compost or digestate applied will be approximately proportional to the local
concentration, when the concentration of contaminant chemical is constant. However, the amount of
information on application rates is very limited. In addition, the range in magnitude of application
rates is much narrower than either the range of chemical concentrations reported in the compost or
digestate (which can vary by many orders of magnitude), or the variability in geographical extent to which application takes place (in terms of how representative the results are).
The models account for repeated exposure, based on a fundamental (and standard) assumption of ten
years annual application to soil. In case application is more frequent than once annually, the models
might under-estimate predicted exposure concentrations to some extent. This should not be
significant for substances which tend to remain mainly in soil at steady state with slow degradation
rates as the loss of the substance from soil predicted in the models between the yearly applications
will be relatively small, allowing the increase in concentration from repeated applications (in this case
10) to be modelled.
Therefore, the uncertainties in the application rates are not considered further as part of this risk
assessment. They can be expected to be small compared with the uncertainties in the concentrations
of substances in the compost/digestate.
Uncertainties in the concentrations of the substances within those composts and digestates
For the substance concentration, a range of concentrations is usually available. The realistic worst case
would be to take a representative high concentration (e.g. maximum value or a high percentile value)
within that range and the ‘baseline’ assessment of each substance has used that approach. Where proposed FPR limit values are available (EU 2018) gives values for e.g. metals) these have also been
considered in selecting the representative high concentration used in the baseline assessment, but the
uncertainty analysis considers the overall range of concentrations available.
A secondary less-conservative assessment has been made in which lower concentrations from the
reported range have been applied at both the local and regional scales. This is useful particularly
where the reported range spans several orders of magnitude, so that the uncertainty can be better
understood.
Hence, in general, exposures for each assessed substance have been estimated for two concentration
scenarios, to provide information about sensitivity to the concentration inputs:
A more conservative (baseline) assessment is derived using the representative maximum
reported concentrations in estimating the local releases from the two scenarios, with a
mid-range concentration used in estimating the regional background.
Where appropriate, a less conservative assessment is derived separately using the mid-
range reported concentrations in estimating the local releases from the two scenarios,
with a minimum concentration used in estimating the regional background.
It is important to note that the concentrations of substances in digestate/compost from the literature
may reflect past use of the substance, particularly if the data are from several years ago. This may be
an important consideration for the substances where usage has been in decline (or discontinued) in
recent years.

D24 © Wood Environment & Infrastructure Solutions UK Limited
February 2019
Doc Ref. 40039CL003i3
Uncertainties over the properties of the substances.
Uncertainties over the properties of the substances (e.g. physicochemical properties, effects,
biodegradation) had been expected to be outside of the scope of the current project because de novo
assembly of data sets was not expected to be necessary. Such uncertainties were minimised as far as
possible by utilising precedent data sets from existing regulatory risk assessments preferably made in
EUSES (especially ESR risk assessment reports), reviews and evaluations (where available). However, in
some cases literature data and predictions have been necessary. In such cases the sensitivity of
predicted exposure concentrations to specific inputs has been explored.

D25 © Wood Environment & Infrastructure Solutions UK Limited
February 2019
Doc Ref. 40039CL003i3
3. Assessment of specific priority substances
3.1 Introduction and approach to assessment
The approach to assessing the priority substances and chemical families is summarised below. Sections
3.2 to 3.24 present and discuss the data, approach, and findings for each individual assessed
substance.
Chemical category or
family
Representative substances
assessed
Comments
Heavy metals Cadmium, Nickel, Lead, Copper,
Zinc and Mercury
The assessment includes exposure and risk
characterisation. Natural background and active
accumulation mechanisms present a challenge.
The assessments are in terms of total metal although in the
environmental media it could be present in different forms.
This is discussed as part of the individual assessments.
Bisphenol A Conventional quantitative risk characterisation is not
appropriate, but exposures at the steady state are
discussed
Phthalates DEHP Conventional quantitative risk characterisation is not
appropriate, but exposures at the steady state are
discussed
Pharmaceuticals 17α-Ethinylestradiol Conventional quantitative risk characterisation is not
appropriate, but exposures at the steady state are
discussed
Hexabromocyclododecane Conventional quantitative risk characterisation is not
appropriate, but exposures at the steady state are
discussed
Dioxins, furans and
dioxin-like PCBs
2,3,7,8-TCDD, 2,3,4,7,8-PCDF Conventional quantitative risk characterisation is not
appropriate, but exposures at the steady state are
discussed
Other PCB PCB-28 Conventional quantitative risk characterisation is not
appropriate, but exposures at the steady state are
discussed
Nonylphenol isomers
and ethoxylates
Nonylphenol The assessment includes exposure and risk
characterisation.
PAH16 Benzo[a]pyrene, chrysene,
benz[a]anthracene,
benzo[b]fluoranthene,
indeno[,2,3-cd]pyrene
Collectively the first two are termed PAH2 and the first four
are termed PAH4. Conventional quantitative risk
characterisation is not appropriate, but exposures at the
steady state are discussed and estimated human exposures
are compared with the BMDL10.
PFAs PFOA, PFHxA Conventional quantitative risk characterisation is not
appropriate, but exposures at the steady state are
discussed
Physical impurities Microplastics The assessment includes a generic estimate only; fugacity
modelling is not reliable

D26 © Wood Environment & Infrastructure Solutions UK Limited
February 2019
Doc Ref. 40039CL003i3
For the endpoints where conventional quantitative risk characterisation is appropriate, a limit below
which adverse effects are not expected has been calculated. This is referred to as “safe limit”
throughout the report. Note that this does not preclude possible other effects at lower concentrations,
related to other endpoints for which quantitative risk characterisation was not possible.
3.2 Cadmium (Cd)
Background information and remarks
Cadmium metal (CAS 7740-43-9) has been subject to a comprehensive EU risk assessment (EC, 2007).
Cadmium has been identified as a substance of very high concern (SVHC) under the EU REACH
Regulation based on its carcinogenicity (it is classified as carcinogen category 1B) and based on its
adverse effects on kidney and bone tissue after prolonged exposure (ECHA, 2013a). Three cadmium
salts (cadmium carbonate, cadmium hydroxide and cadmium nitrate) are separately additionally listed
as SVHCs based on their mutagenicity.
ECHA (2013a) noted that, in terms of exposure of the general public, food was the main intake route of
cadmium in non-smokers and that deposition from air dominates the input of cadmium into soil. A
Tolerable Weekly Intake (TWI) of 2.5 µg/kg bw has been derived in Europe for cadmium exposure via
diet (EFSA, 2009 and 2012a), although ECHA (2013a) notes that there are some uncertainties over the
actual “safe” level for cadmium exposure for humans.
Chemical properties and hazards data set
The relevant property data are summarised in Table 3.1 below. The data are taken mainly from EC
(2007). Where information from other sources is included this is indicated in the Table.
The EU harmonised CLP classification for cadmium (non-pyrophoric) is: Acute Tox 2. – H330; Muta. 2 –
H341; Carc. 1B – H350; Repr. 2 – H361fd; STOT RE 1 – H372; Aquatic Acute 1 – H400; Aquatic Chronic 1
– H410. PNECs and DNELs are available from existing published assessments. In addition, an EU TWI is
also available for dietary exposure.
Table 3.1 Property information for cadmium (from EC (2007) unless otherwise indicated)
Property Value Comment
Molecular weight 112.41 g/mol
Melting point 321°C Value from ECHA (2013a)
Boiling point 765°C
Vapour pressure Negligible at 25°C
Water solubility 2.3 mg/l at 20°C Value from ECHA (2013a).
Solubility varies with the salt. This
should not affect the assessment as the
Henry's law constant has been set to be
very low.
log Kow Not relevant for metals
Henry’s law constant No data Assumed to be very small.
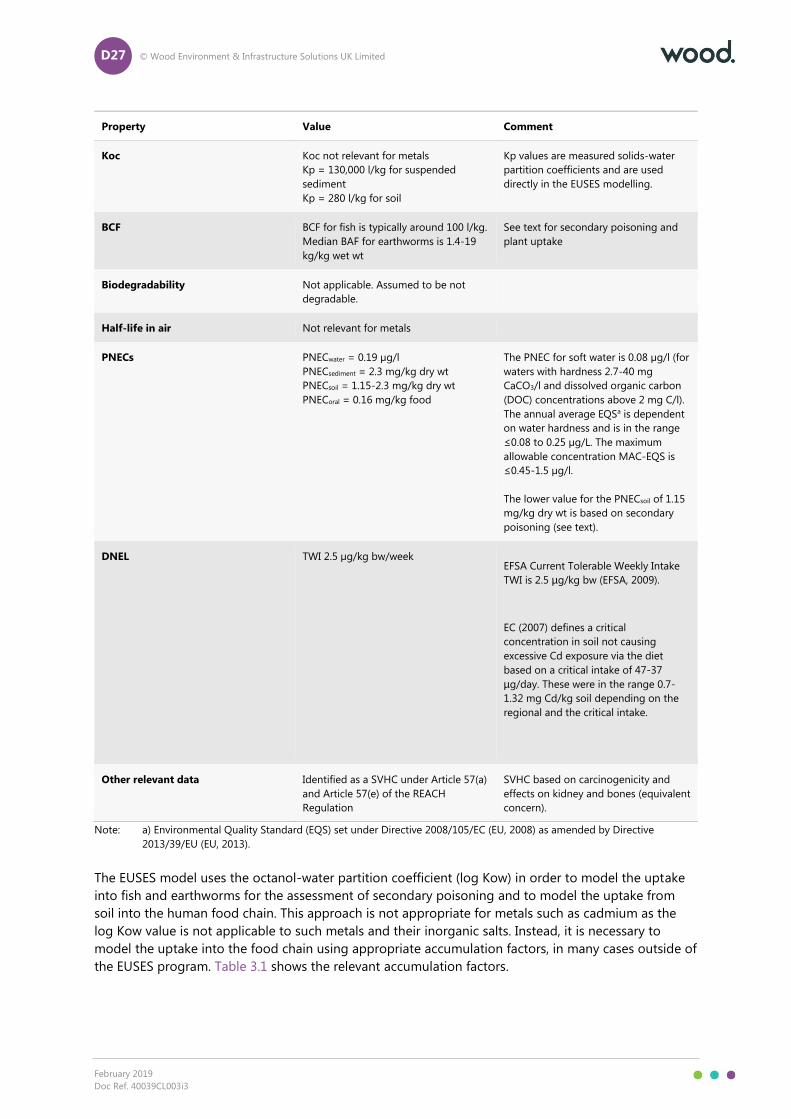
D27 © Wood Environment & Infrastructure Solutions UK Limited
February 2019
Doc Ref. 40039CL003i3
Property Value Comment
Koc Koc not relevant for metals
Kp = 130,000 l/kg for suspended
sediment
Kp = 280 l/kg for soil
Kp values are measured solids-water
partition coefficients and are used
directly in the EUSES modelling.
BCF BCF for fish is typically around 100 l/kg.
Median BAF for earthworms is 1.4-19
kg/kg wet wt
See text for secondary poisoning and
plant uptake
Biodegradability Not applicable. Assumed to be not
degradable.
Half-life in air Not relevant for metals
PNECs PNECwater = 0.19 µg/l
PNECsediment = 2.3 mg/kg dry wt
PNECsoil = 1.15-2.3 mg/kg dry wt
PNECoral = 0.16 mg/kg food
The PNEC for soft water is 0.08 µg/l (for
waters with hardness 2.7-40 mg
CaCO3/l and dissolved organic carbon
(DOC) concentrations above 2 mg C/l).
The annual average EQSa is dependent
on water hardness and is in the range
≤0.08 to 0.25 µg/L. The maximum
allowable concentration MAC-EQS is
≤0.45-1.5 µg/l.
The lower value for the PNECsoil of 1.15
mg/kg dry wt is based on secondary
poisoning (see text).
DNEL TWI 2.5 µg/kg bw/week EFSA Current Tolerable Weekly Intake
TWI is 2.5 µg/kg bw (EFSA, 2009).
EC (2007) defines a critical
concentration in soil not causing
excessive Cd exposure via the diet
based on a critical intake of 47-37
µg/day. These were in the range 0.7-
1.32 mg Cd/kg soil depending on the
regional and the critical intake.
Other relevant data Identified as a SVHC under Article 57(a)
and Article 57(e) of the REACH
Regulation
SVHC based on carcinogenicity and
effects on kidney and bones (equivalent
concern).
Note: a) Environmental Quality Standard (EQS) set under Directive 2008/105/EC (EU, 2008) as amended by Directive
2013/39/EU (EU, 2013).
The EUSES model uses the octanol-water partition coefficient (log Kow) in order to model the uptake
into fish and earthworms for the assessment of secondary poisoning and to model the uptake from
soil into the human food chain. This approach is not appropriate for metals such as cadmium as the
log Kow value is not applicable to such metals and their inorganic salts. Instead, it is necessary to
model the uptake into the food chain using appropriate accumulation factors, in many cases outside of
the EUSES program. Table 3.1 shows the relevant accumulation factors.

D28 © Wood Environment & Infrastructure Solutions UK Limited
February 2019
Doc Ref. 40039CL003i3
Occurrence data set
Table 3.2 presents a summary of the reported concentrations of cadmium in composts and digestates.
This is based on the survey of the available literature collected in Task 2 of the project and reported in
the main project report. Consultation and literature research suggests contamination rates of cadmium
typically of up to around 0.8 mg/kg dry wt in digestate and compost. The proposed FPR limit value is
1.5 mg/kg dry wt (EU, 2018).
These values have been applied in estimating the exposure concentrations for this substance arising
from use of composts and digestates. The exposure assessment uses the following realistic worst case
scenario.
A conservative but realistic worst case assessment is derived using the proposed FPR
limit value in estimating the local releases from the two scenarios, with a mid-range
concentration used in estimating the regional background. The majority of the available
measured data for cadmium in C/D are close to or below this limit value, and the limit
value represents the likely upper limit of the concentrations in composts and digestates
going forward.
It is relevant to note, however, that there are a limited number of reported occurrences of cadmium in
C/D at higher concentrations than assumed in the assessment. The EC (2014) study reported one
occurrence at 2.5 mg/kg dry wt. in digestate derived from biowaste and around 20% of the values in
compost derived from mechanical biological treatment were >1.5 mg/kg dry wt., with a maximum
reported of 2.75 mg/kg dry wt. The significance of this is assessed in the section on sensitivity to
specific variables (see below).
Table 3.2 Reported occurrence of cadmium in composts and digestates
Concentrations in
composts/digestates
Value - units of mg/kg
dry wt Remarks
Composts - data availability
Most of data from one study in DE-Bavaria. A study from
Austria, Belgium, Czech Republic, Germany, Denmark,
Spain, Finland, France, Italy, Luxembourg, Malta,
Netherlands, Portugal, Sweden, UK, Switzerland gives
upper limit values for concentration of ≤1.3 mg/kg dry
wt for compost from biowaste and green waste, ≤1.5
mg/kg dry wt. green waste compost, ≤1 mg/kg dry wt.
for sewage sludge compost and ≤2.75 mg/kg dry wt. in
mechanical biological treatment compost.
Compost - minimum
concentration 0.032 Estimated as 1/10 of the lowest median or mean value
Compost - mid-range or
average concentration 0.4 Most mean and median values are around this value
Compost - maximum
concentration 1.5
Proposed FPR limit value is assumed in the main
assessment. There are a limited number of reported
occurrences above this value and these are considered
further in the section on sensitivity to specific variables
below.
Digestates - data availability
Most of data from one study in DE-Bavaria and one in
Norway. A study from Austria, Belgium, Czech Republic,
Germany, Denmark, Spain, Finland, France, Italy,
Luxembourg, Malta, Netherlands, Portugal, Sweden, UK,
Switzerland gives upper limit values for concentration of
≤2.5 mg/kg dry wt for digestate from biowaste and

D29 © Wood Environment & Infrastructure Solutions UK Limited
February 2019
Doc Ref. 40039CL003i3
Concentrations in
composts/digestates
Value - units of mg/kg
dry wt Remarks
green waste and ≤0.4 mg/kg dry wt. in mechanical
biological treatment digestate.
Data for UK gives maximum of 0.003 kg/ha and with a
limit value (PAS110; WRAP) of 0.036 kg/ha and
commented that the quantities applied in digestates are
very low and will have little effect on soil concentration.
Digestate - minimum
concentration 0.02 Estimated as 1/10 of the lowest median or mean value
Digestate - mid-range or
average concentration 0.45 Most mean and median values are around this value
Digestate - maximum
concentration 1.5
Proposed FPR limit value is assumed in the main
assessment. There are a limited number of reported
occurrences above this value and these are considered
further in the section on sensitivity to specific variables
below.
These concentrations in compost and in digestate equate to the following release amounts at the
regional and continental scale.
Table 3.3 Estimated regional and continental release amounts
Parameter Value
Mass of substance in EU-28 in compost (kg/year) 3528
Mass of substance in EU-28 in digestate (kg/year) 15876
Total regional emission to surface water (kg/day) 0.15
Total regional emission to soil (kg/day) 5.2
Total continental emission to surface water (kg/day) 1.3
Total continental emission to agricultural soil (kg/day) 47
Table 3.4 shows the reported regional background concentrations of cadmium, taking into account all
sources of cadmium. The data are taken from EC (2007).
Table 3.4 Reported background concentrations of cadmium in the environment (from EC (2007))
PECregional Value Remarks
Air 0.55 ng/m3
Surface water 0.11 µg/l
Sediment 2.66 mg/kg dry wt
Based on measured data (average of the 90th
percentiles of surveys). Predicted value is 3.88 mg/kg
wet wt.
Agricultural soil 0.363 mg/kg wet wt
Soil pore water/ground
water No data
Natural soil 0.322 mg/kg wet wt

D30 © Wood Environment & Infrastructure Solutions UK Limited
February 2019
Doc Ref. 40039CL003i3
PECregional Value Remarks
Urban/industrial soil 0.322 mg/kg wet wt
Other relevant data
Generic exposure scenario outcomes
The assessment has estimated local and background exposures of cadmium resulting from the use
scenarios defined in Section 1, using the chemical property data and concentration in composts and
digestates in the previous sections as inputs. The predicted environmental exposure concentrations are
as summarised in Table 3.5.
Table 3.5 Predicted exposures for cadmium arising from use of composts and digestates
Scenario I Units
PECagricultural soil 2.47E-02 [mg/kg dry wt.]
PECgrassland soil 9.79E-03 [mg/kg dry wt.]
PEC in groundwater 8.83E-05 [mg/l]
PECfreshwater 4.15E-06 [mg/l]
PECfreshwater-sediment 5.40E-01 [mg/kg dry wt.]
Humans via the environment:
local total daily intake See text [mg.kg-1.d-1]
Humans via the environment:
daily dose via drinking water 3.06E-06 [mg.kg-1.d-1]
Humans via the environment:
dominant exposure source and
fraction
See text
Secondary poisoning –
freshwater fish-eating birds and
mammals
3.71E-04 [mg/kg wet wt.]
Secondary poisoning – worm-
eating birds and mammals 6.19E-03 [mg.kg-1]
Scenario II Units
PECagricultural soil 4.95E-01 [mg/kg dry wt.]
Humans via the environment:
local total daily intake See text [mg.kg-1.d-1]
Humans via the environment:
dominant exposure source and
fraction
See text
Secondary poisoning – worm-
eating birds and mammals 4.16E-02 [mg.kg-1]
Table 3.6 presents the results of the quantitative risk characterisation along with the predicted steady
state mass balance in the region and continent. Please note that the steady state predicted by the
model are the amounts and distribution at the regional and continental scale arising from the C/D use

D31 © Wood Environment & Infrastructure Solutions UK Limited
February 2019
Doc Ref. 40039CL003i3
application pathway only. Adding in the release of the same substances via other pathways (air and
waste water) could lead to a different steady state balance.
Table 3.6 Quantitative risk characterisation conclusions for cadmium in compost and digestates
Scenario I
RCR for local soil 1.08E-02
RCR for local freshwater 2.19E-02
RCR for local freshwater-sediment 2.35E-01
RCR for Humans via the environment: local total daily
intake 0.019-0.035
RCR for fish-eating birds and mammals (fresh water) 2.32E-03
RCR for worm-eating birds and mammals 3.87E-02
Scenario II
RCR for local soil 2.15E-01
RCR for Humans via the environment: local total daily
intake 0.38-0.71
RCR for worm-eating birds and mammals 2.60E-01
Regional
RCR for regional soil 2.49E-02
RCR for regional freshwater 1.72E-02
RCR for regional freshwater-sediment 3.69E-01
Steady state mass Units
Total steady-state mass (region +
continent) 4.27E+03 [t]
Steady-state mass in regional
freshwater (kg) 3.46E+01 [kg]
Steady-state mass in regional
seawater (kg) 3.48E+00 [kg]
Steady-state mass in regional air (kg) 5.92E-10 [kg]
Steady-state mass in regional
agricultural soil (kg) 4.13E+05 [kg]
Steady-state mass in regional natural
soil (kg) 3.23E-03 [kg]
Steady-state mass in regional
industrial soil (kg) 1.20E-03 [kg]
Steady-state mass in regional
freshwater sediment (kg) 7.63E+03 [kg]
Steady-state mass in regional
seawater sediment (kg) 4.11E+02 [kg]
Steady-state mass in continental
freshwater (kg) 3.93E+02 [kg]

D32 © Wood Environment & Infrastructure Solutions UK Limited
February 2019
Doc Ref. 40039CL003i3
Steady-state mass in continental
seawater (kg) 5.55E+03 [kg]
Steady-state mass in continental air
(kg) 5.35E-09 [kg]
Steady-state mass in continental
agricultural soil (kg) 3.72E+06 [kg]
Steady-state mass in continental
natural soil (kg) 1.47E-02 [kg]
Steady-state mass in continental
industrial soil (kg) 5.46E-03 [kg]
Steady-state mass in continental
freshwater sediment (kg) 8.67E+04 [kg]
Steady-state mass in continental
seawater sediment (kg) 3.28E+04 [kg]
Steady state mass fraction Units
Total steady-state mass fraction
(region + continent)
Steady-state mass fraction in
regional freshwater (%) 5.44E-04 [%]
Steady-state mass fraction in
regional seawater (%) 5.47E-05 [%]
Steady-state mass fraction in
regional air (%) 9.29E-15 [%]
Steady-state mass fraction in
regional agricultural soil (%) 6.49E+00 [%]
Steady-state mass fraction in
regional natural soil (%) 5.08E-08 [%]
Steady-state mass fraction in
regional industrial soil (%) 1.88E-08 [%]
Steady-state mass fraction in
regional freshwater sediment (%) 1.20E-01 [%]
Steady-state mass fraction in
regional seawater sediment (%) 6.46E-03 [%]
Steady-state mass in continental
freshwater (kg) 6.18E-03 [%]
Steady-state mass in continental
seawater (kg) 8.72E-02 [%]
Steady-state mass in continental air
(kg) 8.40E-14 [%]
Steady-state mass in continental
agricultural soil (kg) 5.84E+01 [%]
Steady-state mass in continental
natural soil (kg) 2.32E-07 [%]
Steady-state mass in continental
industrial soil (kg) 8.58E-08 [%]
Steady-state mass in continental
freshwater sediment (kg) 1.36E+00 [%]
Steady-state mass in continental
seawater sediment (kg) 5.15E-01 [%]

D33 © Wood Environment & Infrastructure Solutions UK Limited
February 2019
Doc Ref. 40039CL003i3
The RCRs for soil, water and sediment are all <1 in the realistic worst case assessment, indicating a low
risk from the use of C/D containing cadmium at the levels currently identified.
For the assessment of secondary poisoning, the model for uptake into fish and earthworms uses the
measured bioconcentration factor (BCF) of 100 l/kg for fish and the earthworm bioaccumulation factor
(BAF) of 19 kg/kg wet weight as input data for EUSES (see Table 3.1). These values reflect the range of
median values reported in EC (2007).
Using these factors, the RCRs are <1 for exposure scenario I for both the fish and earthworm food
chains. Secondary poisoning via the fish food chain is not relevant for exposure scenario II.
Exposure via the food chain for metals is complicated as the default methods in EUSES are not
appropriate for metals. The modelling of the uptake of cadmium from soil into food was considered in
EC (2007) and this used an approach whereby a critical concentration in soil that would not cause
excessive cadmium exposure via the diet was determined. This critical concentration in soil was in the
range 0.7-1.32 mg Cd/kg soil based on a critical intake of 37-47 µg/day. The realistic worst case,
concentrations in agricultural soil predicted for cadmium from the use of C/D are below this critical
concentration (0.0247 mg/kg dry weight for scenario I (RCR 0.019-0.035) and 0.495 mg/kg dry weight
for scenario II (RCR 0.38-0.71), suggesting that the risk from exposure of man via crops would be low.
The current tolerable weekly intake (TWI) value for cadmium from diet is reported as 2.5 µg/kg bw.
This figure is not directly comparable with the approach used in EC (2007). However for a typical adult
body weight of 70 kg, the critical intake figure of 37-47 µg/day used in EC (2007) would be equivalent
to a weekly intake of 3.7-4.7 µg/kg bw, which is similar to the EFSA (2012a) TWI.
The realistic worst case regional concentration in agricultural soil predicted for the use of C/D is 0.0422
mg/kg wet weight (0.0479 mg/kg dry weight). For comparison, EC (2007) gives the regional
background concentration from all sources as 0.363 mg/kg wet weight in agricultural soil and 0.322
mg/kg wet weight in natural soil (see above). Therefore, the contribution from C/D to the total
background cadmium present in soil from all sources is relatively small.
It is important to note that the realistic worst case exposure assessment has been based on the
concentrations in composts and digestates given in Table 3.2. For cadmium the local concentrations
were both based on the FPR limit values, as the majority of the available measured data for cadmium
are close to or below this limit value. The mean and median concentrations actually measured in
composts and digestates are around one third to one quarter of this limit value, and the resulting RCRs
would be correspondingly lower if assessed based on the mean and median concentrations. However,
it is important to note that there are a limited number of reported occurrences of cadmium in C/D at
concentrations slightly above this limit value. The significance of these higher concentrations is
assessed in the section on sensitivity to specific variables below.
Sensitivity to specific variables
The assessment above is based on a cadmium concentration in C/D of 1.5 mg/kg dry wt. As noted
earlier there are a small number of data above this concentration, up to 2.75 mg/kg dry wt. in compost
and 2.5 mg/kg dry wt. in digestate. The RCRs obtained If these highest concentrations are used in the
worst case local scenario are shown in Table 3.7.
In respect of local Scenario II, the sensitivity of the outcomes to possible losses from the system by
leaching and drainage of excess water has been explored using a fugacity method. For this substance
the proportion of substance in the system distributed to the interstitial water at equilibrium under
‘high water content’ conditions, and hence sensitive to leaching, is ≤1% of the substance present in the

D34 © Wood Environment & Infrastructure Solutions UK Limited
February 2019
Doc Ref. 40039CL003i3
system. Hence, the sensitivity of the exposure scenario to such variations in water management is
considered to be low.
Table 3.7 Quantitative risk characterisation conclusions for cadmium in compost and digestates
using the highest measured concentrations in compost and digestate
Scenario I
RCR for local soil 1.97E-02
RCR for local freshwater 2.58E-02
RCR for local freshwater-sediment 2.77E-01
RCR for Humans via the environment: local total daily
intake see text
RCR for fish-eating birds and mammals (fresh water) 2.56E-03
RCR for worm-eating birds and mammals 4.77E-02
Scenario II
RCR for local soil 3.95E-01
RCR for Humans via the environment: local total daily
intake see text
RCR for worm-eating birds and mammals 4.9E-01
For the exposure of humans via the food chain, the concentrations predicted in agricultural soil using
the maximum concentrations are 0.045 mg/kg dry wt. for local scenario I and 0.91 mg/kg dry wt. for
local scenario II. The predicted concentrations in agricultural soil are below the critical concentration of
0.7-1.32 mg/Cd/kg soil for scenario I (RCR 0.034-0.064) but are within this critical range for scenario II
(RCR 0.69-1.3). Whether this presents an actual risk or not is highly uncertain as a) it assumes that the
human’s diet consists of crops grown entirely in compost containing the maximum recorded level of
cadmium; the latter assumption is unlikely given that the majority of the measured cadmium
concentrations in compost are below this maximum level, and b) that the consumption of such crops
occurs daily by the same human; whilst this is not impossible it may not apply to a large population
especially if consuming a balanced diet.
Summary of findings
Table 3.8 below presents the summary of key findings from the risk assessment of cadmium that has
been made in this project. The findings are discussed further below the table.
Table 3.8 Summary of key findings for exposure of cadmium via use of compost and digestates
Key findings of the risk assessment of cadmium in contaminated composts and digestates
Overall range of compost and digestate concentrations Median values approximately 0.2 to 0.8 mg/kg dry wt. The
maximum values reported are 2.75 mg/kg dry wt. in compost
and 2.5 mg/kg dry wt. in digestate.
Major raw material sources Only limited data are available. Concentrations broadly
similar across different raw material sources (renewable raw
materials, co-digestion, biowaste and green waste, and solid
and liquid biowaste). The highest concentrations reported

D35 © Wood Environment & Infrastructure Solutions UK Limited
February 2019
Doc Ref. 40039CL003i3
Key findings of the risk assessment of cadmium in contaminated composts and digestates
are in mechanical biological treatment compost and in
digestate from biowaste and green waste. It is not possible
to differentiate whether natural or anthropogenic in origin12.
Safe limit concentration in compost and digestate No risks identified at the proposed FPR limit value. The
majority of the measured data are below this limit. The safe
limit would be higher than the current levels so this is not
currently seen as a concern.
Main concern(s) arising Cumulative loads at steady state.
Effects considered in the main concern hazard(s) Toxicity to kidney and bone via dietary exposure. The
European Food Safety Authority (EFSA) has identified that at
least in the case of children, the tolerable weekly intake of
cadmium via total diet, could be exceeded. Cadmium in
compost and digest could contribute to this dietary
exposure.
Uncertainties and their implications Uncertainty over the safe threshold for dietary exposure.
Small occurrence data set covering limited number of
countries.
The highest concentrations reported could present a risk to
humans exposed via crops, however this significance of this
is highly uncertain.
Sensitivity of exposures to variations in water management
in the local container growing scenario is low.
Other remarks The contribution from C/D to the total cadmium present in
soil from all sources is relatively small.
The realistic worst case analysis carried out indicates that the risks to the environment from the
presence of cadmium in C/D are generally low. The contribution from C/D to the total cadmium
present in soil from all sources is relatively small. For man exposed via the diet, the levels predicted are
below the available toxicity threshold values. However, it should be noted that cadmium and its salts
have been identified as SVHC based on mutagenicity and/or carcinogenicity and effects on kidney and
bones and, according to ECHA (2013), there is some uncertainty over the safe threshold for dietary
exposure. ECHA (2013) indicated that atmospheric deposition to soil was the major source of cadmium
entering the diet and recommended that action should be taken at Community level to control and
reduce cadmium pollution. Although the input of cadmium into soil, and hence the diet, from C/D
appears to be small compared with other sources, C/D will contribute to the total dietary intake of
cadmium.
At steady state, 67% of the total mass remains within the region + continent13, suggesting that there is
relatively low transfer over long distances following release via the handling and application of C/D.
The realistic worst case mass of cadmium in the region + continent at steady state as a result of use of
C/D is estimated to be around 4.27×10⁶ kg assuming that all compost contains cadmium at the mid-
12 The presence of heavy metals in compost/digestate could result from natural occurrence, industrial sources or a
combination of both. Metals will generally be present (at relatively low levels) in most living matter and survive the
processes associated with anaerobic digestion / composting. 13 This refers to the regional and continental spatial scales in the EUSES model. Refer to Section 1.7 and the Annex for further
information.
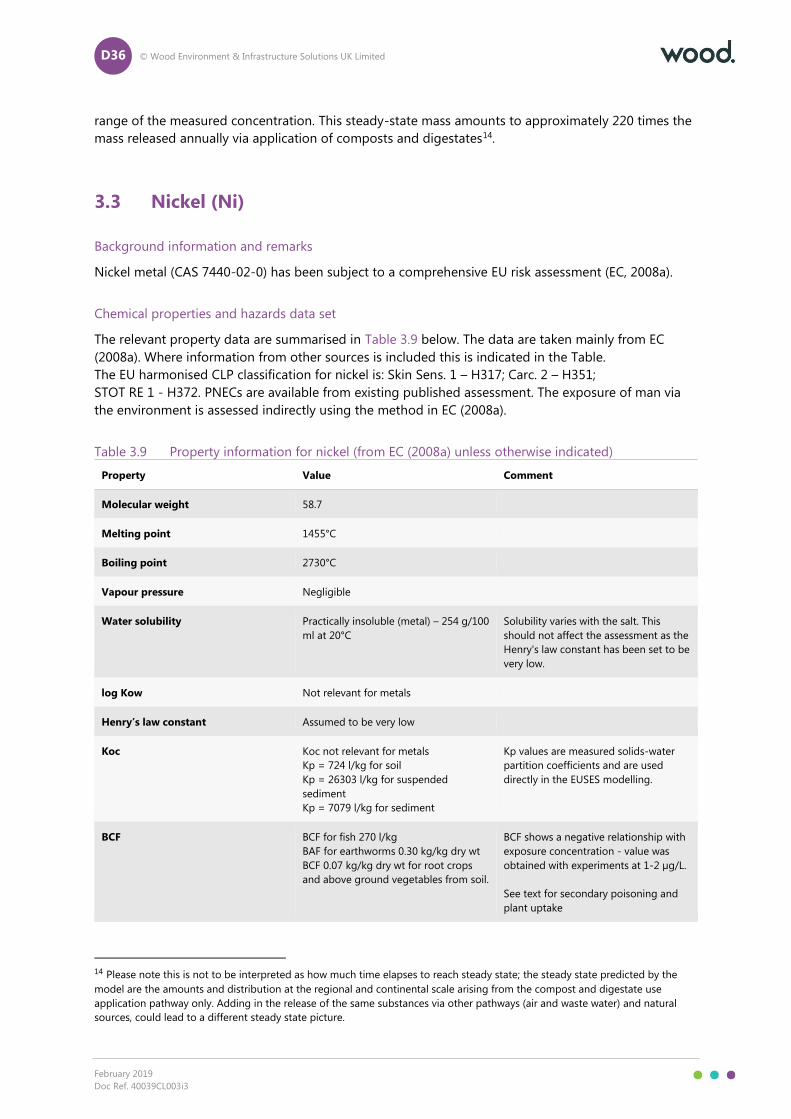
D36 © Wood Environment & Infrastructure Solutions UK Limited
February 2019
Doc Ref. 40039CL003i3
range of the measured concentration. This steady-state mass amounts to approximately 220 times the
mass released annually via application of composts and digestates14.
3.3 Nickel (Ni)
Background information and remarks
Nickel metal (CAS 7440-02-0) has been subject to a comprehensive EU risk assessment (EC, 2008a).
Chemical properties and hazards data set
The relevant property data are summarised in Table 3.9 below. The data are taken mainly from EC
(2008a). Where information from other sources is included this is indicated in the Table.
The EU harmonised CLP classification for nickel is: Skin Sens. 1 – H317; Carc. 2 – H351;
STOT RE 1 - H372. PNECs are available from existing published assessment. The exposure of man via
the environment is assessed indirectly using the method in EC (2008a).
Table 3.9 Property information for nickel (from EC (2008a) unless otherwise indicated)
Property Value Comment
Molecular weight 58.7
Melting point 1455°C
Boiling point 2730°C
Vapour pressure Negligible
Water solubility Practically insoluble (metal) – 254 g/100
ml at 20°C
Solubility varies with the salt. This
should not affect the assessment as the
Henry's law constant has been set to be
very low.
log Kow Not relevant for metals
Henry’s law constant Assumed to be very low
Koc Koc not relevant for metals
Kp = 724 l/kg for soil
Kp = 26303 l/kg for suspended
sediment
Kp = 7079 l/kg for sediment
Kp values are measured solids-water
partition coefficients and are used
directly in the EUSES modelling.
BCF BCF for fish 270 l/kg
BAF for earthworms 0.30 kg/kg dry wt
BCF 0.07 kg/kg dry wt for root crops
and above ground vegetables from soil.
BCF shows a negative relationship with
exposure concentration - value was
obtained with experiments at 1-2 µg/L.
See text for secondary poisoning and
plant uptake
14 Please note this is not to be interpreted as how much time elapses to reach steady state; the steady state predicted by the
model are the amounts and distribution at the regional and continental scale arising from the compost and digestate use
application pathway only. Adding in the release of the same substances via other pathways (air and waste water) and natural
sources, could lead to a different steady state picture.

D37 © Wood Environment & Infrastructure Solutions UK Limited
February 2019
Doc Ref. 40039CL003i3
Property Value Comment
Biodegradability Not applicable. Assumed to be not
degradable.
Half-life in air Not relevant
PNECs PNECwater = 2.74 µg/l dissolved nickel
PNECsediment = 47 mg/kg dry wt
PNECsoil = 29.9 mg/kg dry wt.
(reasonable worst case value)
PNECsoil = 20.4 mg/kg dry wt. (added
risk approach)
PNECoral = 0.73 mg/kg food (generic
PNEC for mammals)
Directive 2008/105/ECa annual average
EQS 4 µg/L (related to the bioavailable
fraction) and maximum acceptable
concentration 34 µg/l.
PNEC for sediment is taken from ECHA
(2012).
DNEL In EC (2008a) man exposed via the
environment is assessed via an internal
dose – see text.
Other relevant data
Note: a) Environmental Quality Standard (EQS) set under Directive 2008/105/EC (EU, 2008) as amended by Directive
2013/39/EU (EU, 2013).
The EUSES model uses the octanol-water partition coefficient (log Kow) in order to model the uptake
into fish and earthworms for the assessment of secondary poisoning and to model the uptake from
soil into the human food chain. This approach is not appropriate for metals such as nickel as the log
Kow value is not applicable to such metals and their inorganic salts. Instead, it is necessary to model
the uptake into the food chain using appropriate accumulation factors, in many cases outside of the
EUSES program. Table 3.9 shows the relevant accumulation factors.
Occurrence data set
Table 3.10 presents a summary of the reported concentrations of nickel in composts and digestates.
This is based on the survey of the available literature collected in Task 2 of the project and reported in
the main project report. Consultation and literature research suggest typical contamination rates of
nickel in the range <10 to 31 mg/kg dry weight in digestate and up to around 39 mg/kg dry weight in
compost.
These values have been applied in estimating the exposure concentrations for this substance arising
from use of composts and digestates. Exposure has been estimated for two concentration scenarios:
A more conservative assessment is derived using the maximum reported concentrations
in estimating the local releases from the two scenarios, with a mid-range concentration
used in estimating the regional background. The proposed FPR limit value (EU, 2018) is
slightly higher than the range of typically reported concentrations and is also taken into
account in the generic exposure outcomes (see summary of findings below).
A less conservative assessment is derived separately using the mid-range reported
concentrations in estimating the local releases from the two scenarios, with a minimum
concentration used in estimating the regional background.
It is relevant to note that there are a limited number of reported concentrations higher than assumed
in the conservative assessment above. The proposed FPR limit value is 50 mg/kg dry weight (EU, 2018).
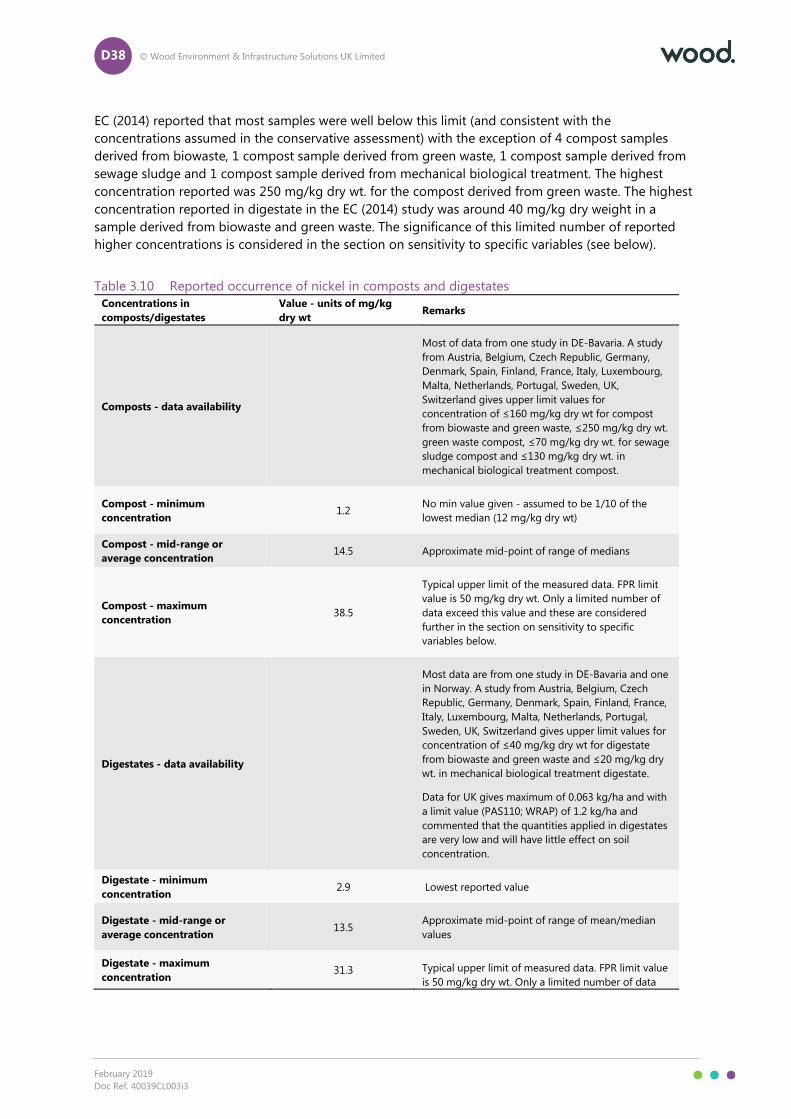
D38 © Wood Environment & Infrastructure Solutions UK Limited
February 2019
Doc Ref. 40039CL003i3
EC (2014) reported that most samples were well below this limit (and consistent with the
concentrations assumed in the conservative assessment) with the exception of 4 compost samples
derived from biowaste, 1 compost sample derived from green waste, 1 compost sample derived from
sewage sludge and 1 compost sample derived from mechanical biological treatment. The highest
concentration reported was 250 mg/kg dry wt. for the compost derived from green waste. The highest
concentration reported in digestate in the EC (2014) study was around 40 mg/kg dry weight in a
sample derived from biowaste and green waste. The significance of this limited number of reported
higher concentrations is considered in the section on sensitivity to specific variables (see below).
Table 3.10 Reported occurrence of nickel in composts and digestates
Concentrations in
composts/digestates
Value - units of mg/kg
dry wt Remarks
Composts - data availability
Most of data from one study in DE-Bavaria. A study
from Austria, Belgium, Czech Republic, Germany,
Denmark, Spain, Finland, France, Italy, Luxembourg,
Malta, Netherlands, Portugal, Sweden, UK,
Switzerland gives upper limit values for
concentration of ≤160 mg/kg dry wt for compost
from biowaste and green waste, ≤250 mg/kg dry wt.
green waste compost, ≤70 mg/kg dry wt. for sewage
sludge compost and ≤130 mg/kg dry wt. in
mechanical biological treatment compost.
Compost - minimum
concentration 1.2
No min value given - assumed to be 1/10 of the
lowest median (12 mg/kg dry wt)
Compost - mid-range or
average concentration 14.5 Approximate mid-point of range of medians
Compost - maximum
concentration 38.5
Typical upper limit of the measured data. FPR limit
value is 50 mg/kg dry wt. Only a limited number of
data exceed this value and these are considered
further in the section on sensitivity to specific
variables below.
Digestates - data availability
Most data are from one study in DE-Bavaria and one
in Norway. A study from Austria, Belgium, Czech
Republic, Germany, Denmark, Spain, Finland, France,
Italy, Luxembourg, Malta, Netherlands, Portugal,
Sweden, UK, Switzerland gives upper limit values for
concentration of ≤40 mg/kg dry wt for digestate
from biowaste and green waste and ≤20 mg/kg dry
wt. in mechanical biological treatment digestate.
Data for UK gives maximum of 0.063 kg/ha and with
a limit value (PAS110; WRAP) of 1.2 kg/ha and
commented that the quantities applied in digestates
are very low and will have little effect on soil
concentration.
Digestate - minimum
concentration 2.9 Lowest reported value
Digestate - mid-range or
average concentration 13.5
Approximate mid-point of range of mean/median
values
Digestate - maximum
concentration 31.3 Typical upper limit of measured data. FPR limit value
is 50 mg/kg dry wt. Only a limited number of data

D39 © Wood Environment & Infrastructure Solutions UK Limited
February 2019
Doc Ref. 40039CL003i3
exceed this value and these are considered further in
the section on sensitivity to specific variables below).
These concentrations in compost and in digestate equate to the following release amounts at the
regional and continental scale.
Table 3.11 Estimated regional and continental release amounts
Parameter Value
Mass of substance in EU-28 in compost (kg/year) 127,890
Mass of substance in EU-28 in digestate (kg/year) 476,280
Total regional emission to surface water (kg/day) 4.6
Total regional emission to soil (kg/day) 161
Total continental emission to surface water (kg/day) 42
Total continental emission to agricultural soil (kg/day) 1448
Table 3.12 shows the reported regional background concentrations of nickel, taking into account all
sources of nickel. The data are taken from EC (2008a).
Table 3.12 Reported background concentrations of nickel in the environment
PECregional Value Remarks
Air 2.69 ng/m3 Modelled.
Surface water 3.29 µg/L - dissolved Modelled. 2.9 µg/L based on
measurements.
Sediment 23.3 mg/kg dry wt Modelled. 33.5 mg/kg dry wt based on
measurements.
Agricultural soil 19 mg/kg dry wt.
Modelled. 26.2 mg/kg dry wt in agricultural
soil and 35.8 mg/kg dry wt in grassland
based on measurements.
Soil pore water/ground
water No data
Natural soil 16.9 mg/kg dry wt. Modelled. 27.8 mg/kg dry wt. in forest soil
based on measurements.
Urban/industrial soil 17.6 mg/kg dry wt. Modelled.
Other relevant data None.
Generic exposure scenario outcomes
The assessment has estimated local and background exposures of nickel resulting from the use
scenarios defined in Section 1, using the chemical property data and concentration in composts and
digestates in the previous sections as inputs. The predicted environmental exposure concentrations are
as summarised in Table 3.13.

D40 © Wood Environment & Infrastructure Solutions UK Limited
February 2019
Doc Ref. 40039CL003i3
Table 3.13 Predicted exposures for nickel arising from use of composts and digestates
Scenario I Units
PECagricultural soil 6.39E-01 [mg/kg dry wt.]
PECgrassland soil 2.54E-01 [mg/kg dry wt.]
PEC in groundwater 8.82E-04 [mg/l]
PECfreshwater 4.12E-04 [mg/l]
PECfreshwater-sediment 1.08E+01 [mg/kg dry wt.]
Humans via the environment: local
total daily intake see text [mg.kg-1.d-1]
Humans via the environment: daily
dose via drinking water 2.52E-05 [mg.kg-1.d-1]
Humans via the environment:
dominant exposure source and
fraction
Approximately 86% from crops - see
text
Secondary poisoning – freshwater
fish-eating birds and mammals 1.05E-01 [mg/kg wet wt.]
Secondary poisoning – worm-eating
birds and mammals 2.11E-01 [mg.kg-1]
Scenario II Units
PECagricultural soil 1.27E+01 [mg/kg dry wt.]
Humans via the environment: local
total daily intake see text [mg.kg-1.d-1]
Humans via the environment:
dominant exposure source and
fraction
Approximately 99% from crops - see
text
Secondary poisoning – worm-eating
birds and mammals 7.53E-01 [mg.kg-1]
Table 3.14 presents the results of the quantitative risk characterisation along with the predicted steady
state mass balance in the region and continent. Please note that the steady state predicted by the
model are the amounts and distribution at the regional and continental scale arising from the C/D use
application pathway only. Adding in the release of the same substances via other pathways (air and
waste water) could lead to a different steady state balance.
Table 3.14 Quantitative risk characterisation conclusions for nickel in compost and digestates
Scenario I
RCR for local soil 2.14E-02
RCR for local freshwater 1.50E-01
RCR for local freshwater-sediment 2.30E-01
RCR for Humans via the environment: local total daily
intake see text
RCR for fish-eating birds and mammals (fresh water) 1.43E-01

D41 © Wood Environment & Infrastructure Solutions UK Limited
February 2019
Doc Ref. 40039CL003i3
RCR for worm-eating birds and mammals 2.90E-01
Scenario II
RCR for local soil 4.25E-01
RCR for Humans via the environment: local total daily
intake see text
RCR for worm-eating birds and mammals 1.03E+00
Regional
RCR for regional soil 1.35E-01
RCR for regional freshwater 1.33E-01
RCR for regional freshwater-sediment 4.04E-01
Steady state mass Units
Total steady-state mass (region +
continent) 2.95E+05 [t]
Steady-state mass in regional
freshwater (kg) 1.83E+03 [kg]
Steady-state mass in regional
seawater (kg) 1.93E+02 [kg]
Steady-state mass in regional air (kg) 2.83E-24 [kg]
Steady-state mass in regional
agricultural soil (kg) 2.92E+07 [kg]
Steady-state mass in regional natural
soil (kg) 1.22E-07 [kg]
Steady-state mass in regional
industrial soil (kg) 4.78E-08 [kg]
Steady-state mass in regional
freshwater sediment (kg) 1.71E+05 [kg]
Steady-state mass in regional
seawater sediment (kg) 6.61E+03 [kg]
Steady-state mass in continental
freshwater (kg) 2.48E+04 [kg]
Steady-state mass in continental
seawater (kg) 3.69E+05 [kg]
Steady-state mass in continental air
(kg) 2.54E-23 [kg]
Steady-state mass in continental
agricultural soil (kg) 2.62E+08 [kg]
Steady-state mass in continental
natural soil (kg) 5.00E-07 [kg]
Steady-state mass in continental
industrial soil (kg) 1.84E-07 [kg]
Steady-state mass in continental
freshwater sediment (kg) 2.33E+06 [kg]
Steady-state mass in continental
seawater sediment (kg) 6.30E+05 [kg]

D42 © Wood Environment & Infrastructure Solutions UK Limited
February 2019
Doc Ref. 40039CL003i3
Steady state mass fraction Units
Total steady-state mass fraction
(region + continent)
Steady-state mass fraction in
regional freshwater (%) 4.77E-04 [%]
Steady-state mass fraction in
regional seawater (%) 5.05E-05 [%]
Steady-state mass fraction in
regional air (%) 7.40E-31 [%]
Steady-state mass fraction in
regional agricultural soil (%) 7.62E+00 [%]
Steady-state mass fraction in
regional natural soil (%) 3.19E-14 [%]
Steady-state mass fraction in
regional industrial soil (%) 1.25E-14 [%]
Steady-state mass fraction in
regional freshwater sediment (%) 4.47E-02 [%]
Steady-state mass fraction in
regional seawater sediment (%) 1.73E-03 [%]
Steady-state mass in continental
freshwater (kg) 6.49E-03 [%]
Steady-state mass in continental
seawater (kg) 9.64E-02 [%]
Steady-state mass in continental air
(kg) 6.63E-30 [%]
Steady-state mass in continental
agricultural soil (kg) 6.86E+01 [%]
Steady-state mass in continental
natural soil (kg) 1.31E-13 [%]
Steady-state mass in continental
industrial soil (kg) 4.82E-14 [%]
Steady-state mass in continental
freshwater sediment (kg) 6.08E-01 [%]
Steady-state mass in continental
seawater sediment (kg) 1.65E-01 [%]
The RCRs for soil, water and sediment are all <1 in the realistic worst case assessment, indicating a low
risk from the use of C/D containing nickel at the levels currently present (this is also true if the
proposed FPR limit concentration of 50 mg/kg dry weight (EU, 2018) is assumed). However, it is
relevant to note that there are a limited number of reported occurrences of nickel in C/D at
concentrations above this limit value. The significance of these higher concentrations is assessed in the
section on sensitivity to specific variables below.
For secondary poisoning, the uptake into fish and earthworms has been modelled using the measured
bioconcentration factor (CF) of 270 for fish and the bioaccumulation factor (BAF) of 0.30 mg/kg on a
dry weight basis (equivalent to 0.048 mg/kg on a wet weight basis) as input data for EUSES. These
values were the selected values reported in EC (2008a).
Using these factors, the RCRs are <1 for exposure scenario I for both the fish and earthworm food
chains. Secondary poisoning via the fish food chain is not relevant for exposure scenario II. The RCR for
the earthworm food chain for scenario II is >1 in the realistic worst case assessment.

D43 © Wood Environment & Infrastructure Solutions UK Limited
February 2019
Doc Ref. 40039CL003i3
The modelling of the uptake of nickel from soil into food for the man via the environment assessment
was considered in EC (2008a). The uptake from soil into both root crops and above ground vegetables
was modelled in EC (2008a) in terms of a concentration factor of 0.07 on a dry weight basis (the same
factor was applicable for both root crops and leaf crops).
The realistic worst case concentrations in agricultural soil predicted for nickel from the use of C/D are
0.639 mg/kg dry weight for scenario I and 12.7 mg/kg dry weight for scenario II). Thus the
concentrations in leaf crops and root crops can be estimated as 0.045 mg/kg dry weight for scenario I
and 0.89 mg/kg dry weight for scenario I. EC (2008a) assumed an average moisture content of 11% for
plants and so the wet weight concentrations in leaf and root crops can be estimated to be 0.040
mg/kg wet weight for scenario I and 0.79 mg/kg wet weight for scenario II.
For the risk characterisation for man exposed via the food chain, EC (2008a) considered the exposure
and effects in terms of an internal dose. The internal dose from environmental exposure was estimated
assuming an absorption factor of 50% for inhalation, 30% for drinking water, 5% for soil/dust and 5%
for food. Using this approach the internal dose from environmental exposure can be estimated as
5.3×10⁻⁵ mg/kg bw/day for scenario I and 8.9×10⁻⁴ mg/kg bw/day for scenario II. Around 86-99% of
these predicted doses is estimated to come from crops for these scenarios.
No DNEL was derived in EC (2008a). Instead the margin of safety (MOS) was estimated using a relevant
toxicological threshold value, and the MOS was then compared with a reference MOSref. If the MOS
calculated is >MOSref then it can be concluded that the exposure represents a low risk. For man
exposed via the environment, the relevant toxicological thresholds and MOSref used in EC (2008a), all
based on absorbed dose, was 0.11 mg Ni/kg bw/day with a MOSref of 300 for repeated dose systemic
toxicity, and 0.055 mg Ni/kg bw/day with a MOSref of 200-300 for developmental toxicity. The MOS
calculated for scenario I using these threshold values is >1000 for scenario I (in terms of RCRs15 this
can be interpreted in terms of RCRs of 0.14-0.29) of but only 62 (based on developmental effects;
equivalent RCR = 3.3-4.9) or 123 (based on repeated dose systemic toxicity; equivalent RCR = 2.4) for
scenario II. This suggests a possible risk for scenario II. These conclusions would also apply at the
proposed FPR limit value of 50 mg/kg dry wt.
When the less conservative scenario is considered (assuming the approximate mean or median
concentration measured in C/D) the predicted internal dose for scenario II reduces from 8.9×10⁻⁴
mg/kg bw/day to 3.4×10⁻⁴ mg/kg bw/day. The MOS for the less conservative scenario is 326
(equivalent RCR of 0.92) for repeated dose systemic toxicity but 163 (equivalent RCR of 1.2-1.8) for
developmental effects. Again this suggests a possible risk for scenario II when the typical levels of
nickel present in C/D are considered.
For scenario II, the levels in soil, earthworms and crops are directly proportional to the level in
compost. In order to give an adequate MOS (or a RCR <1) the maximum level of nickel present in
compost would need to be around 7.9 mg/kg dry weight.
The realistic worst case regional concentration in agricultural soil predicted for the use of C/D is 3.57
mg/kg wet weight (4.05 mg/kg dry weight). For comparison, EC (2008a) gives the regional background
concentration from all sources as 19 mg/kg dry weight in agricultural soil and 17 mg/kg dry weight in
natural soil based on model calculations. Measured data are also reported in EC (2008a) and these
show similar regional background concentrations around 26 mg/kg dry weight in agricultural soil and
36 mg/kg dry weight in grassland. Therefore, the nickel from C/D contributes up to around 20% of the
total background nickel present in soil.
15 The RCR can be approximated by the ratio of the calculated MOSref/calculated MOS.

D44 © Wood Environment & Infrastructure Solutions UK Limited
February 2019
Doc Ref. 40039CL003i3
Sensitivity to specific variables
The assessment above is based on the typical range of nickel concentrations in C/D of up to 39 mg/kg
dry wt. in compost and 31 mg/kg dry wt. in digestate. As noted earlier there are a small number of
data above these concentrations, up to 250 mg/kg dry wt. in compost and 40 mg/kg dry wt. in
digestate.
The RCRs obtained, if these highest concentrations are used in the worst case local scenario, are shown
in Table 3.15.
In respect of local Scenario II, the sensitivity of the outcomes to possible losses from the system by
leaching and drainage of excess water has been explored using a fugacity method. For this substance
the proportion of substance in the system distributed to the interstitial water at equilibrium under
‘high water content’ conditions, and hence sensitive to leaching, is ≤1% of the substance present in the
system. Hence, the sensitivity of the exposure scenario to such variations in water management is
considered to be low.
Table 3.15 Quantitative risk characterisation conclusions for nickel in compost and digestates using
the highest measured concentrations in compost and digestate
Scenario I
RCR for local soil 0.14
RCR for local freshwater 2.45E-01
RCR for local freshwater-sediment 3.75E-01
RCR for Humans via the environment: local total daily
intake see text
RCR for fish-eating birds and mammals (fresh water) 1.69E-02
RCR for worm-eating birds and mammals 5.05E-01
Scenario II
RCR for local soil 2.76
RCR for Humans via the environment: local total daily
intake see text
RCR for worm-eating birds and mammals 5.33
Using the same approach as above, the estimated exposure for humans via the environment would be
as an internal dose of 3.4×10⁻⁴ mg/kg bw/day for scenario I and 5.8×10⁻³ mg/kg bw/day for scenario II.
For scenario I, no unacceptable risks are identified using the highest concentration measured in
compost for soil freshwater, sediment or secondary poisoning. The estimated human exposure via diet
for this scenario results in an MOS of 323 (equivalent RCR 0.93) for repeated dose systemic toxicity but
161 ((equivalent RCR of 1.2-1.8) for developmental effects. This suggests a possible risk at the highest
concentrations found. In order to control this risk the concentration of nickel in C/D would need to be
limited to around 130 mg/kg dry wt. The majority of the measured data are below this value.
As before, for scenario II, the estimated exposures for humans via the environment and for secondary
poisoning in a possible risk using the highest concentrations in compost. In addition, a possible risk to
soil itself is indicated for scenario II. As before the maximum level of nickel in compost to give an

D45 © Wood Environment & Infrastructure Solutions UK Limited
February 2019
Doc Ref. 40039CL003i3
adequate margin of safety is derived as 7.9 mg/kg (see previous section). The maximum
concentrations in compost are well above this value.
Summary of findings
Table 3.16 below presents the summary of key findings from the risk assessment of nickel that has
been made in this project. The findings are discussed further below the table.
Table 3.16 Summary of key findings for exposure of nickel via use of compost and digestates
Key findings of the risk assessment of nickel in contaminated composts and digestates
Overall range of compost and digestate concentrations Typically <10 to 39 mg/kg dry wt.. The maximum values
reported are 250 mg/kg dry wt. in compost and 40 mg/kg
dry wt. in digestate.
Major raw material sources Only limited data are available. Concentrations broadly
similar across different raw material sources (renewable raw
materials, co-digestion, biowaste and green waste, and solid
and liquid biowaste). The highest overall concentrations have
been reported in compost samples derived from biowaste,
green waste, sewage sludge and mechanical biological
treatment. It is not possible to differentiate whether natural
or anthropogenic in origin16.
Safe limit concentration in compost and digestate 7.9 mg/kg dry wt for compost for container growing.
130 mg/kg dry wt. for compost or digestate for application
to agricultural land. The majority of measured data are below
this value.
Main concern(s) arising Human exposure through crops from use of compost in
container growing.
Secondary poisoning from use of compost in container
growing.
Cumulative loads at steady state.
Effects considered in the main concern hazard(s) Human toxicity based on mammalian developmental toxicity
Uncertainties and their implications Small occurrence data set covering limited number of
countries.
Sensitivity of exposures to variations in water management
in the local container growing scenario is low.
Other remarks The nickel from C/D contributes up to around 20% of the
total background nickel present in soil.
The realistic worst case analysis carried out indicates a potential risk for secondary poisoning and
human exposure through use of compost containing nickel for scenario II. No risks are identified for
use of compost or digestate containing nickel in scenario I based on the typical range of
concentrations and the proposed FPR limit value. However, there are a limited number of measured
concentrations in nickel in compost above this limit value and these would indicate a potential risk to
humans via diet if the concentration exceeds around 130 mg/kg dry wt. The majority of the available
measured data are below this value.
16 The presence of heavy metals in compost/digestate could result from natural occurrence, industrial sources or a
combination of both. Metals will generally be present (at relatively low levels) in most living matter and survive the
processes associated with anaerobic digestion / composting.

D46 © Wood Environment & Infrastructure Solutions UK Limited
February 2019
Doc Ref. 40039CL003i3
In order to control the risks from scenario II the level of nickel present in compost would need to be
around 7.9 mg/kg dry weight or below.
The contribution from C/D to the total nickel present in agricultural soil from all sources is relatively
small. At steady state, 77% of the total mass remains within the region + continent17, suggesting that
there is relatively low transfer over long distances following release via the handling and application of
C/D. The realistic worst case mass of nickel in the region + continent at steady state as a result of use
of C/D is estimated to be around 2.95×10⁸ kg assuming that all compost contains nickel at the mid-
range of the reported measured levels. This steady-state mass amounts to approximately 490 times
the mass released annually via application of composts and digestates18.
3.4 Lead (Pb)
Background information and remarks
Lead metal (CAS No 7439-92-1) has been subject to a risk assessment (LDAI, 2008). The risk
assessment was carried out voluntarily by the lead industry but underwent a detailed review procedure
by the EU’s Technical Committee on New and Existing Substances (TCNES, 2008a and 2008b). The risk
assessment was also reviewed by the EU Scientific Committee on Health and Environmental Risks
(SCHER, 2009a and 2009b).
Chemical properties and hazards data set
The relevant property data are summarised in Table 3.17 below. The data are taken mainly from LDAI
(2008). Where information from other sources is included this is indicated in the Table.
The EU harmonised CLP classification for lead is: Lact. – H362; Repr. 1A – H360FD (CLP Inventory entry
for lead powder with particle size <1mm, checked 11 October 2018).
Lead is a non-threshold neurotoxic substance and the risks to humans via the environment cannot be
adequately addressed in a quantitative way (e.g. by derivation of DNELs) (ECHA, 2017a).
Table 3.17 Property information for lead (from LDAI (2008) unless otherwise indicated)
Property Value Comment
Molecular weight 207.2
Melting point 326°C
Boiling point >600°C
Vapour pressure Negligible at 20°C
Water solubility 185 mg/l at 20°C Solubility varies with the salt. This
should not affect the assessment as the
17 This refers to the regional and continental spatial scales in the EUSES model. Refer to Section 1.7 and the Annex for further
information. 18 Please note this is not to be interpreted as how much time elapses to reach steady state; the steady state predicted by the
model are the amounts and distribution at the regional and continental scale arising from the compost and digestate use
application pathway only. Adding in the release of the same substances via other pathways (air and waste water) and natural
sources, could lead to a different steady state picture.

D47 © Wood Environment & Infrastructure Solutions UK Limited
February 2019
Doc Ref. 40039CL003i3
Property Value Comment
Henry's law constant has been set to be
very low.
log Kow Not relevant for metals
Henry’s law constant No data Assumed to be very small
Koc Koc not relevant for metals
Kp = 295,121 l/kg for suspended
sediment
Kp = 154,882 l/kg for sediment
Kp = 6,400 l/kg for soil
Kp values are measured solids-water
partition coefficients and are used
directly in the EUSES modelling.
Kp suspended sediment 10th-90th
percentile 50,119 -1,698,244 l/kg.
Kp sediment 10th-90th percentile
35,481 - 707,946 l/kg.
Kp soil 10th-90th percentile 600 -
43,000 l/kg.
BCF BAF for fish 23 l/kg.
BAF for earthworms 0.10 kg/kg
Fish BAF includes both
bioconcentration (BCF) and
biomagnification (BMF).
In LDAI (2008) man exposed via the
environment is assessed based on
measured data in food (see text).
Biodegradability Not applicable. Assumed to be not
degradable.
Half-life in air Not relevant
PNECs PNECwater = 2.7 µg/l
PNECsediment = 174 mg/kg dry wt
PNECsoil = 166 mg/kg dry wt.
PNECoral = 49 mg/kg food
Critical concentration in soil for
secondary poisoning = 491 mg/kg dry
wt.
Directive 2008/105/ECa is annual
average EQS of 1.2 µg/L (related to the
bioavailable fraction) and maximum
acceptable concentration of 14 µg/l.
DNEL Non-threshold Lead is a non-threshold neurotoxic
substance and the risks to humans via
the environment cannot be adequately
addressed in a quantitative way (e.g. by
derivation of DNELs) (ECHA, 2017a).
Other relevant data
Note: a) Environmental Quality Standard (EQS) set under Directive 2008/105/EC (EU, 2008) as amended by Directive
2013/39/EU (EU, 2013).
The EUSES model uses the octanol-water partition coefficient (log Kow) in order to model the uptake
into fish and earthworms for the assessment of secondary poisoning and to model the uptake from
soil into the human food chain. This approach is not appropriate for metals such as lead as the log
Kow value is not applicable to such metals and their inorganic salts. Instead, it is necessary to model
the uptake into the food chain using appropriate accumulation factors, in many cases outside of the
EUSES program. Table 3.17 shows the relevant accumulation factors.

D48 © Wood Environment & Infrastructure Solutions UK Limited
February 2019
Doc Ref. 40039CL003i3
Occurrence data set
Table 3.18 presents a summary of the reported concentrations of lead in composts and digestates. This
is based on the survey of the available literature collected in Task 2 of the project and reported in the
main project report. Consultation and literature research suggest typical contamination rates of lead in
the range <2.5 to 80 mg/kg dry weight in digestate and up to 90.8 mg/kg dry weight in compost. The
proposed FPR limit value is 120 mg/kg dry weight (EU, 2018) and the vast majority of the reported
data are below this value (see below).
These values have been applied in estimating the exposure concentrations for this substance arising
from use of composts and digestates. Exposures have been estimated for one concentration scenario:
A conservative assessment is derived using the maximum reported concentrations in
estimating the local releases from the two scenarios, with a mid-range concentration
used in estimating the regional background. The proposed FPR limit value of 120 mg/kg
dry weight (EU, 2018) is also taken into account in the generic exposure outcomes (see
summary of findings below).
It is relevant to note that there are a limited number of reported concentrations higher than assumed
in the conservative assessment above. EC (2014) reported that most samples of C/D showed lead levels
below the proposed FPR limit value of 120 mg/kg dry wt. The one exception to this was compost from
mechanical biological treatment in which lead was present at a maximum concentration of 230 mg/kg
dry wt. and exceeded the 120 mg/kg dry wt. limit in four samples overall (approximately 30% of the
mechanical biological treatment samples). For the other sources of compost considered in the study,
most of the measured levels were <75 mg/kg dry wt. with one sample of compost derived from
sewage sludge showing a level of 105 mg/kg dry wt. The levels of lead in digestate found in this study
were generally lower than found in compost. The significance of this limited number of reported
higher concentrations is considered in the section on sensitivity to specific variables (see below).
Table 3.18 Reported occurrence of lead in composts and digestates
Concentrations in
composts/digestates
Value - units of mg/kg dry
wt Remarks
Composts - data availability
Most of data from one study in DE-Bavaria. A study
from Austria, Belgium, Czech Republic, Germany,
Denmark, Spain, Finland, France, Italy, Luxembourg,
Malta, Netherlands, Portugal, Sweden, UK, Switzerland
gives upper limit values for concentration of ≤75
mg/kg dry wt for compost from biowaste and green
waste, ≤70 mg/kg dry wt. green waste compost, ≤105
mg/kg dry wt. for sewage sludge compost and ≤230
mg/kg dry wt. in mechanical biological treatment
compost.
Compost - minimum
concentration 2.3
No minimum - assumed to be 1/10 of lowest median
(23.3 mg/kg dry wt.).
Compost - mid-range or average
concentration 33.8 Approximate mid-point of range of median values.
Compost - maximum
concentration 90.8
Typical upper limit of the measured data. Only a very
limited number of data exceed this value (see text).
Proposed FPR limit value of 120 mg/kg dry wt. Only a
limited number of data exceed this value and these are
considered further in the section on sensitivity to
specific variables below.
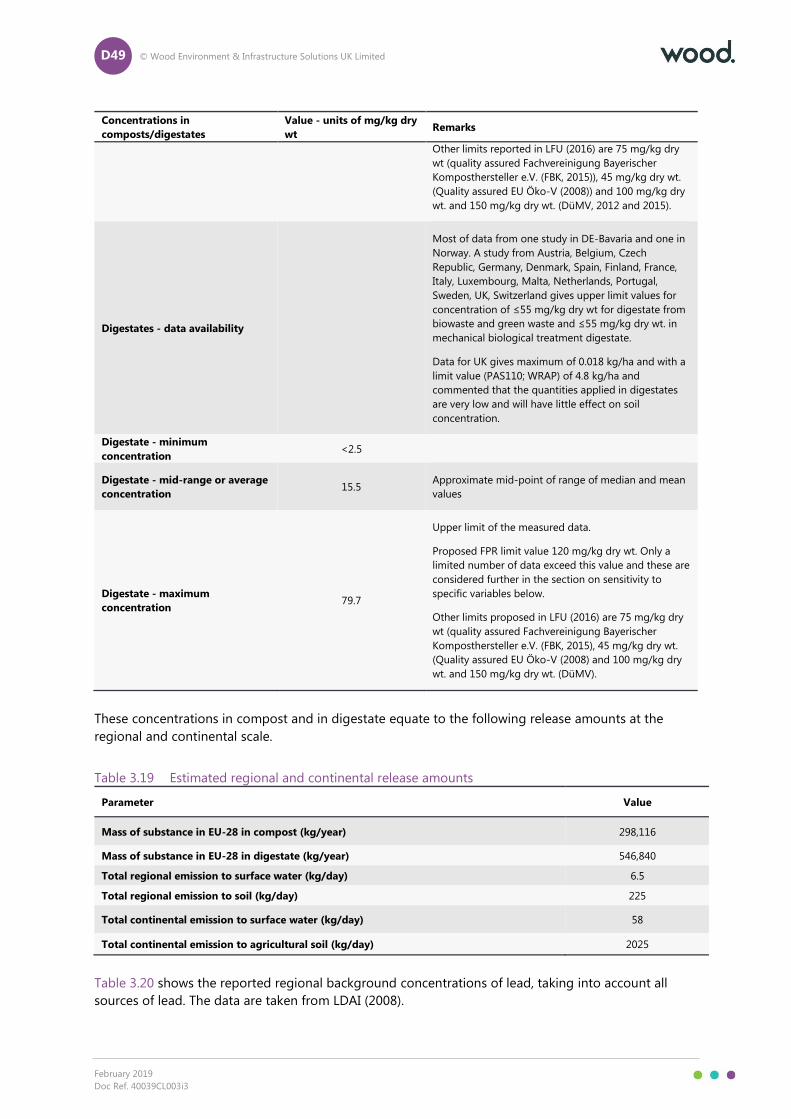
D49 © Wood Environment & Infrastructure Solutions UK Limited
February 2019
Doc Ref. 40039CL003i3
Concentrations in
composts/digestates
Value - units of mg/kg dry
wt Remarks
Other limits reported in LFU (2016) are 75 mg/kg dry
wt (quality assured Fachvereinigung Bayerischer
Komposthersteller e.V. (FBK, 2015)), 45 mg/kg dry wt.
(Quality assured EU Öko-V (2008)) and 100 mg/kg dry
wt. and 150 mg/kg dry wt. (DüMV, 2012 and 2015).
Digestates - data availability
Most of data from one study in DE-Bavaria and one in
Norway. A study from Austria, Belgium, Czech
Republic, Germany, Denmark, Spain, Finland, France,
Italy, Luxembourg, Malta, Netherlands, Portugal,
Sweden, UK, Switzerland gives upper limit values for
concentration of ≤55 mg/kg dry wt for digestate from
biowaste and green waste and ≤55 mg/kg dry wt. in
mechanical biological treatment digestate.
Data for UK gives maximum of 0.018 kg/ha and with a
limit value (PAS110; WRAP) of 4.8 kg/ha and
commented that the quantities applied in digestates
are very low and will have little effect on soil
concentration.
Digestate - minimum
concentration <2.5
Digestate - mid-range or average
concentration 15.5
Approximate mid-point of range of median and mean
values
Digestate - maximum
concentration 79.7
Upper limit of the measured data.
Proposed FPR limit value 120 mg/kg dry wt. Only a
limited number of data exceed this value and these are
considered further in the section on sensitivity to
specific variables below.
Other limits proposed in LFU (2016) are 75 mg/kg dry
wt (quality assured Fachvereinigung Bayerischer
Komposthersteller e.V. (FBK, 2015), 45 mg/kg dry wt.
(Quality assured EU Öko-V (2008) and 100 mg/kg dry
wt. and 150 mg/kg dry wt. (DüMV).
These concentrations in compost and in digestate equate to the following release amounts at the
regional and continental scale.
Table 3.19 Estimated regional and continental release amounts
Parameter Value
Mass of substance in EU-28 in compost (kg/year) 298,116
Mass of substance in EU-28 in digestate (kg/year) 546,840
Total regional emission to surface water (kg/day) 6.5
Total regional emission to soil (kg/day) 225
Total continental emission to surface water (kg/day) 58
Total continental emission to agricultural soil (kg/day) 2025
Table 3.20 shows the reported regional background concentrations of lead, taking into account all
sources of lead. The data are taken from LDAI (2008).

D50 © Wood Environment & Infrastructure Solutions UK Limited
February 2019
Doc Ref. 40039CL003i3
Table 3.20 Reported background concentrations of lead in the environment
PECregional Value Remarks
Air 20 ng/m3 Median ambient regional PEC for Europe based on measured data
Surface water 0.61 µg/l dissolved Median ambient regional PEC for Europe based on measured data
Sediment 100.1 mg/kg dry wt Median ambient regional PEC for Europe based on measured data
Agricultural soil 29.7 mg/kg dry wt Median measured value in agricultural soils in Europe
Soil pore water/ground
water No data
Natural soil 28.3 mg/kg dry wt Modelled value
Urban/industrial soil
Other relevant data
Generic exposure scenario outcomes
The assessment has estimated local and background exposures of lead resulting from the use
scenarios defined in Section 1, using the chemical property data and concentration in composts and
digestates in the previous sections as inputs. The predicted environmental exposure concentrations are
as summarised in Table 3.21.
Table 3.21 Predicted exposures for lead arising from use of composts and digestates
Scenario I Units
PECagricultural soil 1.51E+00 [mg/kg dry wt.]
PECgrassland soil 6.04E-01 [mg/kg dry wt.]
PEC in groundwater 2.36E-04 [mg/l]
PECfreshwater 8.54E-05 [mg/l]
PECfreshwater-sediment 2.52E+01 [mg/kg dry wt.]
Humans via the environment: local
total daily intake see text [mg.kg-1.d-1]
Humans via the environment: daily
dose via drinking water 6.74E-06 [mg.kg-1.d-1]
Humans via the environment:
dominant exposure source and
fraction
see text
Secondary poisoning – freshwater
fish-eating birds and mammals 1.63E-03 [mg/kg wet wt.]
Secondary poisoning – worm-eating
birds and mammals 9.43E-01 [mg.kg-1]
Scenario II Units

D51 © Wood Environment & Infrastructure Solutions UK Limited
February 2019
Doc Ref. 40039CL003i3
PECagricultural soil 3.00E+01 [mg/kg dry wt.]
Humans via the environment: local
total daily intake see text [mg.kg-1.d-1]
Humans via the environment:
dominant exposure source and
fraction
see text
Secondary poisoning – worm-eating
birds and mammals 2.22E+00 [mg.kg-1]
Table 3.22 presents the results of the quantitative risk characterisation for water, soil and sediment,
along with the predicted steady state mass balance in the region and continent. Please note that the
steady state predicted by the model are the amounts and distribution at the regional and continental
scale arising from the C/D use application pathway only. Adding in the release of the same substances
via other pathways (air and waste water) could lead to a different steady state balance.
Table 3.22 Quantitative risk characterisation conclusions for lead in composts and digestates
Scenario I
RCR for local soil 9.10E-03
RCR for local freshwater 7.12E-02
RCR for local freshwater-sediment 1.45E-01
RCR for Humans via the environment: local total daily
intake non-threshold
RCR for fish-eating birds and mammals (fresh water) 3.32E-05
RCR for worm-eating birds and mammals 1.93E-02
Scenario II
RCR for local soil 1.81E-01
RCR for Humans via the environment: local total daily
intake non-threshold
RCR for worm-eating birds and mammals 4.53E-02
Regional
RCR for regional soil 1.17E-01
RCR for regional freshwater 4.68E-02
RCR for regional freshwater-sediment 1.90E-01
Steady state mass Units
Total steady-state mass (region +
continent) 1.41E+06 [t]
Steady-state mass in regional
freshwater (kg) 1.10E+03 [kg]
Steady-state mass in regional
seawater (kg) 1.06E+02 [kg]
Steady-state mass in regional air
(kg) 3.09E-12 [kg]
Steady-state mass in regional
agricultural soil (kg) 1.40E+08 [kg]

D52 © Wood Environment & Infrastructure Solutions UK Limited
February 2019
Doc Ref. 40039CL003i3
Steady-state mass in regional
natural soil (kg) 1.22E-02 [kg]
Steady-state mass in regional
industrial soil (kg) 4.52E-03 [kg]
Steady-state mass in regional
freshwater sediment (kg) 2.98E+05 [kg]
Steady-state mass in regional
seawater sediment (kg) 1.90E+04 [kg]
Steady-state mass in continental
freshwater (kg) 1.20E+04 [kg]
Steady-state mass in continental
seawater (kg) 1.61E+05 [kg]
Steady-state mass in continental
air (kg) 2.79E-11 [kg]
Steady-state mass in continental
agricultural soil (kg) 1.26E+09 [kg]
Steady-state mass in continental
natural soil (kg) 5.56E-02 [kg]
Steady-state mass in continental
industrial soil (kg) 2.06E-02 [kg]
Steady-state mass in continental
freshwater sediment (kg) 3.27E+06 [kg]
Steady-state mass in continental
seawater sediment (kg) 1.44E+06 [kg]
Steady state mass fraction Units
Total steady-state mass fraction
(region + continent)
Steady-state mass fraction in
regional freshwater (%) 7.38E-05 [%]
Steady-state mass fraction in
regional seawater (%) 7.16E-06 [%]
Steady-state mass fraction in
regional air (%) 2.08E-19 [%]
Steady-state mass fraction in
regional agricultural soil (%) 9.45E+00 [%]
Steady-state mass fraction in
regional natural soil (%) 8.22E-10 [%]
Steady-state mass fraction in
regional industrial soil (%) 3.04E-10 [%]
Steady-state mass fraction in
regional freshwater sediment (%) 2.01E-02 [%]
Steady-state mass fraction in
regional seawater sediment (%) 1.28E-03 [%]
Steady-state mass in continental
freshwater (kg) 8.11E-04 [%]
Steady-state mass in continental
seawater (kg) 1.08E-02 [%]
Steady-state mass in continental
air (kg) 1.88E-18 [%]
Steady-state mass in continental
agricultural soil (kg) 8.50E+01 [%]

D53 © Wood Environment & Infrastructure Solutions UK Limited
February 2019
Doc Ref. 40039CL003i3
Steady-state mass in continental
natural soil (kg) 3.74E-09 [%]
Steady-state mass in continental
industrial soil (kg) 1.39E-09 [%]
Steady-state mass in continental
freshwater sediment (kg) 2.20E-01 [%]
Steady-state mass in continental
seawater sediment (kg) 9.69E-02 [%]
The RCRs for soil, water and sediment are all <1 in the realistic worst case assessment, indicating a low
risk from the use of C/D containing lead at the levels currently present (this is also true if the proposed
FPR limit concentration of 120 mg/kg dry weight is assumed). However, it is relevant to note that there
are a limited number of reported occurrences of lead in C/D at concentrations above this limit value.
The significance of these higher concentrations is assessed in the section on sensitivity to specific
variables below.
For secondary poisoning the uptake into fish and earthworms has been modelled using the measured
bioaccumulation factor (BAF) of 23 for fish (this value takes into both bioconcentration and
biomagnification) and the bioaccumulation factor (BAF) of 0.10 mg/kg on a dry weight basis
(equivalent to 0.016 mg/kg on a wet weight basis) as input data for EUSES. These values were the
selected values reported in the voluntary risk assessment report for lead (LDAI, 2008).
Using these factors, the RCRs are <1 for exposure scenario I for both the fish and earthworm food
chains. Secondary poisoning via the fish food chain is not relevant for exposure scenario II. However, it
is important to note that lead is a non-threshold neurotoxic substance in humans and so the relevance
of the quantitative risk characterisation to other mammals can be questioned.
The exposure of man via the environment was estimated in LDAI (2008) using measured data on the
concentrations of lead in food. This approach is not possible for the use of C/D containing lead and so
no exposure calculations for man via the environment are carried out. In addition, lead is a non-
threshold neurotoxic substance and the risks to humans via the environment cannot be adequately
addressed in a quantitative way (ECHA, 2017a) and so no risk characterisation is carried out for man
exposed via the environment.
The realistic worst case regional concentration in agricultural soil predicted for the use of C/D is 17.2
mg/kg wet weight (19.5 mg/kg dry weight). This is based on the mid-range lead concentration
measured in C/D. For comparison, LDAI (2008) gives the regional background concentration from all
sources as 29.7 mg/kg dry weight in agricultural soil (median measured value in agricultural soils in
Europe). Therefore, the lead from C/D contributes up to around 66% of the total background lead
present in soil based on the mid-range lead concentrations measured; the contribution would be
higher if the highest concentrations or the proposed FPR limit value is assumed.
Sensitivity to specific variables
The assessment above is based on the typical range of lead concentrations in C/D of up to 90.8 mg/kg
dry wt. in compost and 80 mg/kg dry wt. in digestate. As noted earlier there are a small number of
data above these concentrations, up to 230 mg/kg dry wt. in compost.
The RCRs obtained if this highest concentration is used in the worst case local scenario are shown in
Table 3.23.
In respect of local Scenario II, the sensitivity of the outcomes to possible losses from the system by
leaching and drainage of excess water has been explored using a fugacity method. For this substance
the proportion of substance in the system distributed to the interstitial water at equilibrium under
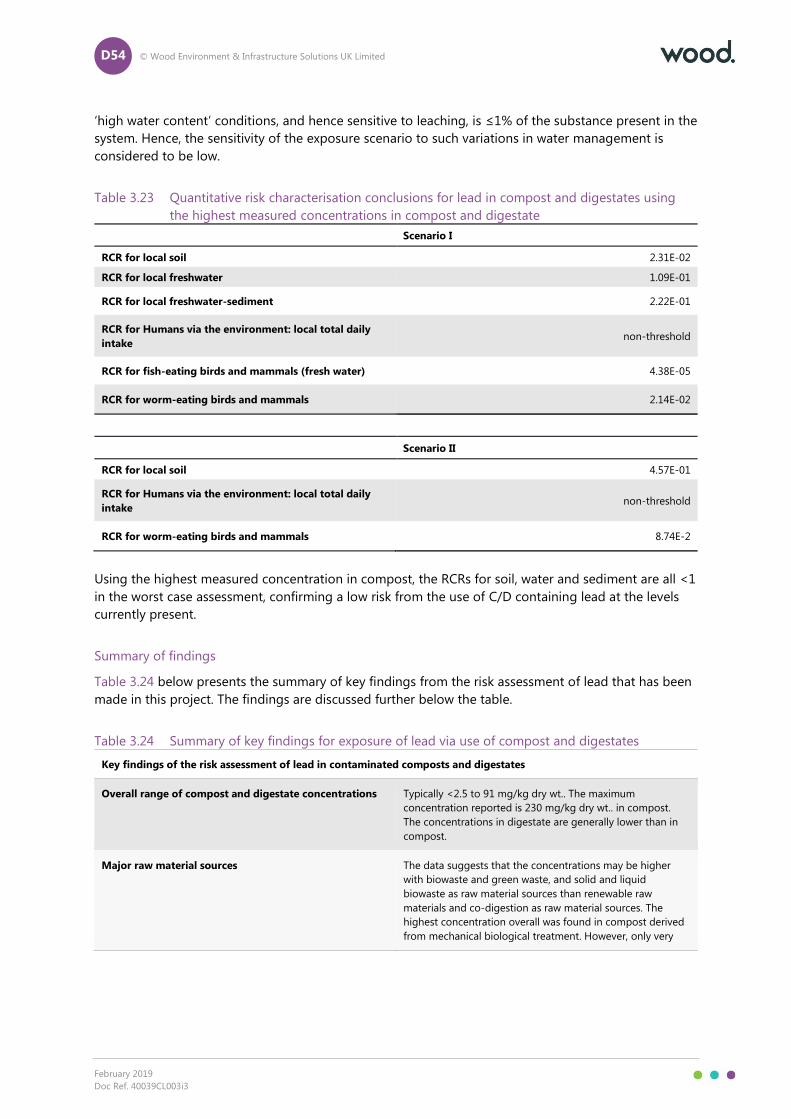
D54 © Wood Environment & Infrastructure Solutions UK Limited
February 2019
Doc Ref. 40039CL003i3
‘high water content’ conditions, and hence sensitive to leaching, is ≤1% of the substance present in the
system. Hence, the sensitivity of the exposure scenario to such variations in water management is
considered to be low.
Table 3.23 Quantitative risk characterisation conclusions for lead in compost and digestates using
the highest measured concentrations in compost and digestate
Scenario I
RCR for local soil 2.31E-02
RCR for local freshwater 1.09E-01
RCR for local freshwater-sediment 2.22E-01
RCR for Humans via the environment: local total daily
intake non-threshold
RCR for fish-eating birds and mammals (fresh water) 4.38E-05
RCR for worm-eating birds and mammals 2.14E-02
Scenario II
RCR for local soil 4.57E-01
RCR for Humans via the environment: local total daily
intake non-threshold
RCR for worm-eating birds and mammals 8.74E-2
Using the highest measured concentration in compost, the RCRs for soil, water and sediment are all <1
in the worst case assessment, confirming a low risk from the use of C/D containing lead at the levels
currently present.
Summary of findings
Table 3.24 below presents the summary of key findings from the risk assessment of lead that has been
made in this project. The findings are discussed further below the table.
Table 3.24 Summary of key findings for exposure of lead via use of compost and digestates
Key findings of the risk assessment of lead in contaminated composts and digestates
Overall range of compost and digestate concentrations Typically <2.5 to 91 mg/kg dry wt.. The maximum
concentration reported is 230 mg/kg dry wt.. in compost.
The concentrations in digestate are generally lower than in
compost.
Major raw material sources The data suggests that the concentrations may be higher
with biowaste and green waste, and solid and liquid
biowaste as raw material sources than renewable raw
materials and co-digestion as raw material sources. The
highest concentration overall was found in compost derived
from mechanical biological treatment. However, only very

D55 © Wood Environment & Infrastructure Solutions UK Limited
February 2019
Doc Ref. 40039CL003i3
Key findings of the risk assessment of lead in contaminated composts and digestates
limited data are available. It is not possible to differentiate
whether natural or anthropogenic in origin19.
Safe limit concentration in compost and digestate Not applicable (risk characterisation ratio not definable).
Main concern(s) arising Non-threshold neurotoxic substance.
Cumulative loads at steady state. Significant contribution
from C/D to the total background level of lead in soil.
Effects associated with the main concern hazard(s) Non-threshold neurotoxin.
Uncertainties and their implications Small occurrence data set covering limited number of
countries.
Sensitivity of exposures to variations in water management
in the local container growing scenario is low.
Other remarks -
The realistic worst case analysis carried out indicates RCRs <1 for soil, sediment, water and secondary
poisoning based on the realistic worst case assumptions for both scenario I and scenario II. However,
lead is a non-threshold neurotoxic substance and so it is not possible to carry out a quantitative risk
characterisation for man exposed via the environment (refer to Section 2.1).
The contribution from C/D to the total background levels of lead present in soil from all sources is
significant (estimated to be up to 66% based on the mid-range measured levels; this would be higher
if the highest measured levels or the proposed FPR limit value is assumed).
At steady state, 95% of the total mass remains within the region + continent20, suggesting that there is
relatively low transfer over long distances following release via the handling and application of C/D.
The realistic worst case mass of lead in the region + continent at steady state as a result of use of C/D
is estimated to be more than 1 million tonnes assuming that all compost contains lead at the mid-
range of the reported measured levels. This steady-state mass amounts to approximately 1,670 times
the mass released annually via application of composts and digestates21.
3.5 Copper (Cu)
Background information and remarks
Copper metal (CAS No 7440-50-8) has been subject to a comprehensive voluntary risk assessment ECI,
2008). The risk assessment was carried out voluntarily by the copper industry but underwent a detailed
review procedure by the EU’s Technical Committee on New and Existing Substances (TCNES, 2008c
19 The presence of heavy metals in compost/digestate could result from natural occurrence, industrial sources or a
combination of both. Metals will generally be present (at relatively low levels) in most living matter and survive the
processes associated with anaerobic digestion / composting. 20 This refers to the regional and continental spatial scales in the EUSES model. Refer to Section 1.7 and the Annex for further
information. 21 Please note this is not to be interpreted as how much time elapses to reach steady state; the steady state predicted by the
model are the amounts and distribution at the regional and continental scale arising from the compost and digestate use
application pathway only. Adding in the release of the same substances via other pathways (air and waste water) and natural
sources, could lead to a different steady state picture.

D56 © Wood Environment & Infrastructure Solutions UK Limited
February 2019
Doc Ref. 40039CL003i3
and 2008d). The risk assessment was also reviewed by the EU Scientific Committee on Health and
Environmental Risks (SCHER, 2008 and 2009c).
Chemical properties and hazards data set
The relevant property data are summarised in Table 3.25 below. The data are taken mainly from ECI
(2008). Where information from other sources is included this is indicated in the Table.
There is no EU harmonised CLP classification for copper. A proposal for a harmonised classification of
copper (granulated) as Eye Irrit. 2 – H319 and Aquatic Chronic 2 – H411) has been submitted in
relation to the Biocidal Products Regulation22.
Table 3.25 Property information for copper (from ECI (2008) unless otherwise indicated)
Property Value Comment
Molecular weight 63.55 g/mole
Melting point 1083°C
Boiling point 2595°C
Vapour pressure Negligible at 20°C
Water solubility Practically insoluble to soluble Solubility varies with the salt. This
should not affect the assessment as the
Henry's law constant has been set to be
very low.
log Kow Not relevant for metals
Henry’s law constant Assumed to be very low In the EUSES modelling the Henry’s law
constant was set to a value of 1E-10 Pa
m3 mol-1 as the substance is assumed
to be non-volatile.
Koc Koc not relevant for metals.
Kp= 30,246 l/kg for suspended
sediment
Kp = 24,409 l/kg for sediment
Kp = 2,120 l/kg for soil
Kp values are measured solids-water
partition coefficients and are used
directly in the EUSES modelling. The
values given are the median values
used in ECI (2008).
BCF BCF not applicable owing to
homeostasis
See text
Biodegradability Not applicable. Assumed to be not
degradable.
Half-life in air Not relevant
PNECs PNECwater = 7.8-27.2 µg/l
PNECsediment = 1741 mg/kg organic
carbon (indicative value)
PNECsoil = 73.1-172.8 mg/kg dry wt.
PNECoral – no value available
Values reported reflect different
methods for derivation used in ECI
(2008). The lowest values have been
considered in the risk characterisation.
The PNEC for sediment is considered
an indicative value (SCHER, 2009c). The
indicative PNEC of 1741 mg/kg organic
carbon is equivalent to a PNEC for 174
22 https://www.echa.europa.eu/web/guest/registry-of-clh-intentions-until-outcome/-/dislist/details/0b0236e180748711

D57 © Wood Environment & Infrastructure Solutions UK Limited
February 2019
Doc Ref. 40039CL003i3
Property Value Comment
mg/kg dry weight for a freshwater
sediment normalised to 10% organic
carbon (the default value assumed in
EUSES for the local assessment).
No PNECoral was derived in ECI (2008).
The no observed adverse effect level
(NOAEL) was given as 255 mg/kg dry
diet for mammals and 288 mg/kg dry
diet for birds.
DNEL See text
Other relevant data Copper is an essential element
The EUSES model uses the octanol-water partition coefficient (log Kow) in order to model the uptake
into fish and earthworms for the assessment of secondary poisoning and to model the uptake from
soil into the human food chain. This approach is not appropriate for metals such as copper as the log
Kow is not applicable to such metals and their inorganic salts. Instead, it is necessary to model the
uptake into the food chain using appropriate accumulation factors, in many cases outside of the EUSES
program. The relevant accumulation factors for copper are discussed in the section on generic
exposure outcomes below.
Occurrence data set
Table 3.26 presents a summary of the reported concentrations of copper in composts and digestates.
This is based on the survey of the available literature collected in Task 2 of the project and reported in
the main project report. Consultation and literature research suggest contamination rates of copper up
to 981 mg/kg dry weight in digestate and up to 350 mg/kg dry weight in compost. The highest
concentrations measured in both C/D are above the proposed FPR limit of 200 mg/kg dry weight (EU,
2018). These maximum concentrations may be outlier values as the majority of the remaining
measurements in both digestate and compost are <200 mg/kg dry weight (approximate mid-range
values are 50 mg/kg dry wt. in compost and 61 mg/kg dry weight in digestate).
These values have been applied in estimating the exposure concentrations for this substance arising
from use of composts and digestates. The assessment estimates exposures for the following realistic
worst case scenario:
A conservative assessment is derived using the maximum reported concentrations in
estimating the local releases from the two scenarios, with a mid-range concentration
used in estimating the regional background. The proposed FPR limit value is below the
maximum reported concentrations (see summary of findings below).
Table 3.26 Reported occurrence of copper in composts and digestates
Concentrations in
composts/digestates
Value - units of mg/kg dry
wt Remarks
Composts - data availability
Most of data from one study in DE-Bavaria. A study
from Austria, Belgium, Czech Republic, Germany,
Denmark, Spain, Finland, France, Italy, Luxembourg,
Malta, Netherlands, Portugal, Sweden, UK, Switzerland
gives upper limit values for concentration of ≤110
mg/kg dry wt. for compost from biowaste and green
waste, ≤110 mg/kg dry wt. green waste compost,
≤350 mg/kg dry wt. for sewage sludge compost and

D58 © Wood Environment & Infrastructure Solutions UK Limited
February 2019
Doc Ref. 40039CL003i3
Concentrations in
composts/digestates
Value - units of mg/kg dry
wt Remarks
≤210 mg/kg dry wt. in mechanical biological treatment
compost.
Compost - minimum
concentration 3.4
No minimum value given – assumed 1/10 of the
lowest median (34.4 mg/kg dry wt.)
Compost - mid-range or average
concentration 50 Approximate mid-point of median values.
Compost - maximum
concentration 350
Proposed FPR limit value 200 mg/kg dry weight. The
maximum reported value is above this limit.
Digestates - data availability
Most of data from one study in DE-Bavaria and one in
Norway. A study from Austria, Belgium, Czech
Republic, Germany, Denmark, Spain, Finland, France,
Italy, Luxembourg, Malta, Netherlands, Portugal,
Sweden, UK, Switzerland gives upper limit values for
concentration of ≤325 mg/kg dry wt. for digestate
from biowaste and green waste and ≤50 mg/kg dry
wt. in mechanical biological treatment digestate.
Data for UK gives maximum of 0.041 kg/ha and with a
limit value (PAS110; WRAP) of 4.8 kg/ha and
commented that the quantities applied in digestates
are very low and will have little effect on soil
concentration.
Digestate - minimum
concentration 2.9
No clear minimum – assumed 1/10 of the lowest
median (28.7 mg/kg dry wt.)
Digestate - mid-range or average
concentration 61 Approximate mid-point of median/mean values
Digestate - maximum
concentration 981.3
Highest value may be an outlier. The next highest
value is 151 mg/kg dry wt. Proposed FPR limit value
200 mg/kg dry weight. The maximum value reported is
above this limit.
These concentrations in compost and in digestate equate to the following release amounts at the
regional and continental scale.
Table 3.27 Estimated regional and continental release amounts
Parameter Value
Mass of substance in EU-28 in compost (kg/year) 441,000
Mass of substance in EU-28 in digestate (kg/year) 2,152,080
Total regional emission to surface water (kg/day) 20
Total regional emission to soil (kg/day) 691
Total continental emission to surface water (kg/day) 179
Total continental emission to agricultural soil (kg/day) 6215
Table 3.28 presents the reported regional background concentrations of copper, taking into account
all sources of copper. The data are taken from SCHER (2008).
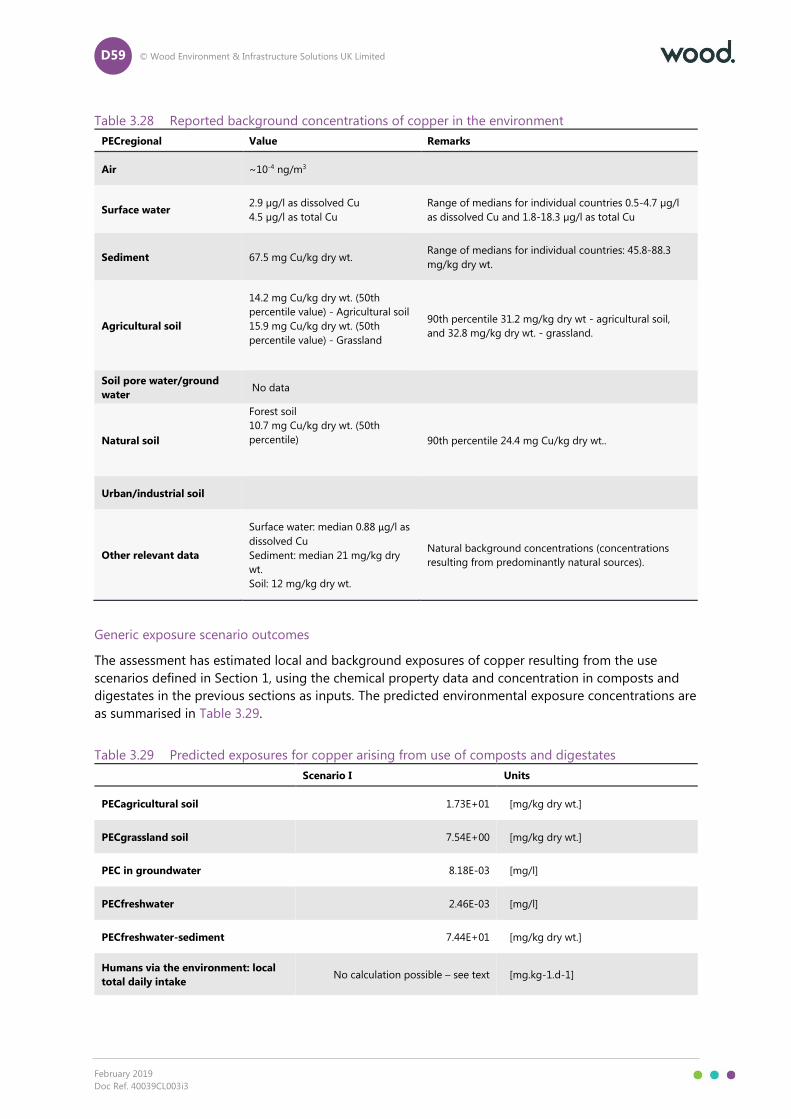
D59 © Wood Environment & Infrastructure Solutions UK Limited
February 2019
Doc Ref. 40039CL003i3
Table 3.28 Reported background concentrations of copper in the environment
PECregional Value Remarks
Air ~10-4 ng/m3
Surface water 2.9 µg/l as dissolved Cu
4.5 µg/l as total Cu
Range of medians for individual countries 0.5-4.7 µg/l
as dissolved Cu and 1.8-18.3 µg/l as total Cu
Sediment 67.5 mg Cu/kg dry wt. Range of medians for individual countries: 45.8-88.3
mg/kg dry wt.
Agricultural soil
14.2 mg Cu/kg dry wt. (50th
percentile value) - Agricultural soil
15.9 mg Cu/kg dry wt. (50th
percentile value) - Grassland
90th percentile 31.2 mg/kg dry wt - agricultural soil,
and 32.8 mg/kg dry wt. - grassland.
Soil pore water/ground
water No data
Natural soil
Forest soil
10.7 mg Cu/kg dry wt. (50th
percentile)
90th percentile 24.4 mg Cu/kg dry wt..
Urban/industrial soil
Other relevant data
Surface water: median 0.88 µg/l as
dissolved Cu
Sediment: median 21 mg/kg dry
wt.
Soil: 12 mg/kg dry wt.
Natural background concentrations (concentrations
resulting from predominantly natural sources).
Generic exposure scenario outcomes
The assessment has estimated local and background exposures of copper resulting from the use
scenarios defined in Section 1, using the chemical property data and concentration in composts and
digestates in the previous sections as inputs. The predicted environmental exposure concentrations are
as summarised in Table 3.29.
Table 3.29 Predicted exposures for copper arising from use of composts and digestates
Scenario I Units
PECagricultural soil 1.73E+01 [mg/kg dry wt.]
PECgrassland soil 7.54E+00 [mg/kg dry wt.]
PEC in groundwater 8.18E-03 [mg/l]
PECfreshwater 2.46E-03 [mg/l]
PECfreshwater-sediment 7.44E+01 [mg/kg dry wt.]
Humans via the environment: local
total daily intake No calculation possible – see text [mg.kg-1.d-1]

D60 © Wood Environment & Infrastructure Solutions UK Limited
February 2019
Doc Ref. 40039CL003i3
Humans via the environment: daily
dose via drinking water 2.34E-04 [mg.kg-1.d-1]
Humans via the environment:
dominant exposure source and
fraction
No calculation possible – see text
Secondary poisoning – freshwater
fish-eating birds and mammals No calculation possible – see text [mg/kg wet wt.]
Secondary poisoning – worm-eating
birds and mammals No calculation possible – see text [mg.kg-1]
Scenario II Units
PECagricultural soil 1.17E+02 [mg/kg dry wt.]
Humans via the environment: local
total daily intake No calculation possible – see text [mg.kg-1.d-1]
Humans via the environment:
dominant exposure source and
fraction
No calculation possible – see text
Secondary poisoning – worm-eating
birds and mammals No calculation possible – see text [mg.kg-1]
Table 3.30 presents the results of the quantitative risk characterisation for water, sediment and soil,
along with the predicted steady state mass balance in the region and the continent.
Table 3.30 Quantitative risk characterisation conclusions for copper in compost and digestates
Scenario I
RCR for local soil 2.37E-01
RCR for local freshwater 3.15E-01
RCR for local freshwater-sediment 4.27E-01
RCR for Humans via the environment: local total daily
intake No calculation possible – see text
RCR for fish-eating birds and mammals (fresh water) No calculation possible – see text
RCR for worm-eating birds and mammals No calculation possible – see text
Scenario II
RCR for local soil 1.59E+00
RCR for Humans via the environment: local total daily
intake No calculation possible – see text
RCR for worm-eating birds and mammals No calculation possible – see text
Regional
RCR for regional soil 4.73E-01

D61 © Wood Environment & Infrastructure Solutions UK Limited
February 2019
Doc Ref. 40039CL003i3
RCR for regional freshwater 1.64E-01
RCR for regional freshwater-sediment 8.88E-01
Steady state mass Units
Total steady-state mass (region +
continent) 2.50E+06 [t]
Steady-state mass in regional
freshwater (kg) 6.69E+03 [kg]
Steady-state mass in regional seawater
(kg) 7.11E+02 [kg]
Steady-state mass in regional air (kg) 2.36E+01 [kg]
Steady-state mass in regional
agricultural soil (kg) 2.49E+08 [kg]
Steady-state mass in regional natural
soil (kg) 8.29E+05 [kg]
Steady-state mass in regional industrial
soil (kg) 3.07E+05 [kg]
Steady-state mass in regional
freshwater sediment (kg) 6.95E+05 [kg]
Steady-state mass in regional seawater
sediment (kg) 2.80E+04 [kg]
Steady-state mass in continental
freshwater (kg) 8.81E+04 [kg]
Steady-state mass in continental
seawater (kg) 1.91E+06 [kg]
Steady-state mass in continental air
(kg) 3.78E+02 [kg]
Steady-state mass in continental
agricultural soil (kg) 2.23E+09 [kg]
Steady-state mass in continental
natural soil (kg) 6.71E+06 [kg]
Steady-state mass in continental
industrial soil (kg) 2.48E+06 [kg]
Steady-state mass in continental
freshwater sediment (kg) 9.16E+06 [kg]
Steady-state mass in continental
seawater sediment (kg) 3.76E+06 [kg]
Steady state mass fraction Units
Total steady-state mass fraction
(region + continent)

D62 © Wood Environment & Infrastructure Solutions UK Limited
February 2019
Doc Ref. 40039CL003i3
Steady-state mass fraction in regional
freshwater (%) 2.24E-04 [%]
Steady-state mass fraction in regional
seawater (%) 2.38E-05 [%]
Steady-state mass fraction in regional
air (%) 7.91E-07 [%]
Steady-state mass fraction in regional
agricultural soil (%) 8.32E+00 [%]
Steady-state mass fraction in regional
natural soil (%) 2.78E-02 [%]
Steady-state mass fraction in regional
industrial soil (%) 1.03E-02 [%]
Steady-state mass fraction in regional
freshwater sediment (%) 2.33E-02 [%]
Steady-state mass fraction in regional
seawater sediment (%) 9.36E-04 [%]
Steady-state mass in continental
freshwater (kg) 2.95E-03 [%]
Steady-state mass in continental
seawater (kg) 6.40E-02 [%]
Steady-state mass in continental air
(kg) 1.27E-05 [%]
Steady-state mass in continental
agricultural soil (kg) 7.47E+01 [%]
Steady-state mass in continental
natural soil (kg) 2.24E-01 [%]
Steady-state mass in continental
industrial soil (kg) 8.31E-02 [%]
Steady-state mass in continental
freshwater sediment (kg) 3.07E-01 [%]
Steady-state mass in continental
seawater sediment (kg) 1.26E-01 [%]
The RCRs for water and sediment are all <1 in the realistic worst case assessment, indicating a low risk
from the use of C/D containing copper at the levels currently present. For soil, the RCRs based on the
maximum reported concentrations of copper are <1 for scenario I but just over 1 (RCR 1.59) for
scenario II. The calculation for scenario II is based on a copper content in the compost of 350 mg/kg
dry weight. This value is above the proposed FPR limit value of 200 mg/kg dry weight, and the majority
of the other measured data are below this limit value. It is therefore not clear if the value of 350 mg/kg
is representative of current levels of copper in composts, or is an outlier value. If the maximum copper
content in compost is assumed to be up to <200 mg/kg dry weight as a maximum, the RCR for soil for
scenario II reduces to <0.9. Thus it can be concluded that at concentrations up to the proposed FPR
limit value of 200 mg/kg would present a low risk to soil in this scenario.

D63 © Wood Environment & Infrastructure Solutions UK Limited
February 2019
Doc Ref. 40039CL003i3
Copper is an essential element and the levels within an organism are controlled by homeostasis.
Therefore, accumulation through the food chain is not a relevant concept for copper and no
assessment of secondary poisoning is carried out. This is in line with the approach used in ECI (2008).
For the exposure of man via the environment, the uptake of copper from soil into plants is complicated
as homeostasis reduces the concentrations at higher soil concentrations. Therefore, it is not possible to
reliably quantify the exposure of man via the environment from the use of C/D.
The risk characterisation for man exposed via the environment carried out in ECI (2008) used measured
data on the concentrations of copper in drinking water as a realistic worst case (leaching from copper
pipes was considered to be the main source of dietary exposure from copper). No risks to man
exposed via the environment were identified in ECI (2008) using this approach. Therefore, it is
considered that dietary intake of copper from plants grown on compost- or digestate-amended soils
would not contribute significantly to the risks from dietary copper.
The realistic worst case regional concentration in agricultural soil predicted for the use of C/D is 30.5
mg/kg wet weight (34.5 mg/kg dry weight). For comparison, ECI (2008) gives the regional background
concentration from all sources as 14.2 mg/kg dry weight in agricultural soil and 15.9 mg/kg dry weight
in grassland (both 50th percentile measured values). Therefore, the copper from C/D contributes up to
around twice the amount of the background level of copper present in soil.
Sensitivity to specific variables
In respect of local Scenario II, the sensitivity of the outcomes to possible losses from the system by
leaching and drainage of excess water has been explored using a fugacity method. For this substance
the proportion of substance in the system distributed to the interstitial water at equilibrium under
‘high water content’ conditions, and hence sensitive to leaching, is ≤1% of the substance present in the
system. Hence, the sensitivity of the exposure scenario to such variations in water management is
considered to be low.
Summary of findings
Table 3.31 below presents the summary of key findings from the risk assessment of copper that has
been made in this project. The findings are discussed further below the table.
Table 3.31 Summary of key findings for exposure of copper via use of compost and digestates
Key findings of the risk assessment of copper in contaminated composts and digestates
Overall range of compost and digestate concentrations Up to 980 mg/kg dry wt.
More typically 50-60 mg/kg dry wt.
Major raw material sources Only limited data are available. Concentrations broadly
similar across different raw material sources (renewable raw
materials, co-digestion, biowaste and green waste, and solid
and liquid biowaste). It is not possible to differentiate
whether natural or anthropogenic in origin23.
Safe limit concentration in compost and digestate 200 mg/kg dry weight for compost for container growing
23 The presence of heavy metals in compost/digestate could result from natural occurrence, industrial sources or a
combination of both. Metals will generally be present (at relatively low levels) in most living matter and survive the
processes associated with anaerobic digestion / composting.

D64 © Wood Environment & Infrastructure Solutions UK Limited
February 2019
Doc Ref. 40039CL003i3
Key findings of the risk assessment of copper in contaminated composts and digestates
Main concern(s) arising Soil organisms for compost for container growing.
Cumulative loads at steady state.
Effects considered in the main concern hazard(s) PNEC for soil organism is estimated statistically from a
species sensitivity distribution of the available toxicity data
for plants, soil invertebrates and soil microorganisms.
Uncertainties and their implications Small occurrence data set covering limited number of
countries.
Sensitivity of exposures to variations in water management
in the local container growing scenario is low.
Other remarks Copper is an essential element. Therefore, accumulation
through the food chain is not a relevant concept for copper
and no quantitative assessment of secondary poisoning or
man exposed via the environment is carried out.
The copper from C/D contributes up to around twice the
amount of the background level of copper present in soil.
The realistic worst case analysis carried out indicates RCRs <1 for water, sediment and soil in scenario I
for both C/D. However, the highest concentration measured in compost would lead to a RCR of 1.02
for soil for scenario II. The highest concentration measured in compost is above the proposed FPR limit
value for copper (200 mg/kg dry wt), and therefore it is unclear if this concentration represents current
typical levels in soil. Most of the other available measured data show that the concentration of copper
measured in C/D is below this limit value, and the resulting RCR for soil in scenario II is <1 for copper
concentrations in compost ≤200 mg/kg dry wt. Therefore, it can be concluded that if the C/D meets
the proposed FPR limit value, the risk to water, sediment and soil would be low in both scenarios.
Copper is an essential element and the levels within an organism are controlled by homeostasis.
Therefore, accumulation through the food chain is not a relevant concept for copper and no
quantitative assessment of secondary poisoning or man exposed via the environment is carried out.
The contribution from C/D to the total background levels of copper present in soil from all sources is
significant. At steady state, 84% of the total mass remains within the region + continent24, suggesting
that there is relatively low transfer over long distances following release via the handling and
application of C/D. The realistic worst case mass of copper in the region + continent at steady state as
a result of use of C/D is estimated to be around 2.5×10⁹ kg assuming that all compost contains copper
at the mid-range of the levels that have been measured. This steady-state mass amounts to 960 times
the mass released annually via application of composts and digestates25.
3.6 Zinc (Zn)
Background information and remarks
Zinc metal (7740-66-6) has been subject to a comprehensive EU risk assessment (EC, 2010a).
24 This refers to the regional and continental spatial scales in the EUSES model. Refer to Section 1.7 and the Annex for further
information. 25 Please note this is not to be interpreted as how much time elapses to reach steady state; the steady state predicted by the
model are the amounts and distribution at the regional and continental scale arising from the compost and digestate use
application pathway only. Adding in the release of the same substances via other pathways (air and waste water) and natural
sources, could lead to a different steady state picture.

D65 © Wood Environment & Infrastructure Solutions UK Limited
February 2019
Doc Ref. 40039CL003i3
Chemical properties and hazards data set
The relevant property data are summarised in Table 3.32 below. The data are taken mainly from EC
(2010). Where information from other sources is included this is indicated in the Table.
The EU harmonised CLP classification for zinc dust (pyrophoric) is: Pyr. Sol. 1 – H250; Water-react.1 -
H260; Aquatic Acute 1 – H400; Aquatic Chronic 1 – H410.
Table 3.32 Property information for zinc (from EC (2010) unless otherwise indicated)
Property Value Comment
Molecular weight 65.38 g/mole
Melting point 420°C
Boiling point 908°C
Vapour pressure 31 Pa at 450°C
assumed to be negligible at 20°C
Water solubility Practically insoluble to soluble Solubility varies with the salt. This
should not affect the assessment as the
Henry's law constant has been set to be
very low.
log Kow Not relevant for metals
Henry’s law constant Assumed to be very low
Koc Koc not relevant for metals
Kp = 110000 l/kg for suspended
sediment
Kp = 73000 l/kg for sediment
Kp = 158 l/kg for soil
Kp values are measured solids-water
partition coefficients and are used
directly in the EUSES modelling.
BCF BCF not applicable owing to
homeostasis
See text
Biodegradability Not applicable. Assumed to be not
degradable.
Half-life in air Not relevant
PNECs PNECwater = 7.8 µg/l as dissolved zinc
PNECsediment = 49 mg/kg dry wt.
PNECsoil = 26 mg/kg dry wt.
PNECoral – no concern for secondary
poisoning owing to zinc homeostasis
The PNECs refer to added zinc (i.e. zinc
added above the background
concentration).
PNECwater for very soft water is 3.1 µg/l
as dissolved zinc
DNEL See text
Other relevant data Zinc is an essential element
The EUSES model uses the octanol-water partition coefficient (log Kow) in order to model the uptake
into fish and earthworms for the assessment of secondary poisoning and to model the uptake from
soil into the human food chain. This approach is not appropriate for metals such as zinc as the log Kow
is not applicable to such metals and their inorganic salts. Instead, it is necessary to model the uptake
into the food chain using appropriate accumulation factors, in many cases outside of the EUSES

D66 © Wood Environment & Infrastructure Solutions UK Limited
February 2019
Doc Ref. 40039CL003i3
program. The relevant accumulation factors for zinc are discussed in the section on generic exposure
outcomes below.
Occurrence data set
Table 3.33 presents a summary of the reported concentrations of zinc in composts and digestates. This
is based on the survey of the available literature collected in Task 2 of the project and reported in the
main project report. Consultation and literature research suggest contamination rates of zinc up to
1098 mg/kg dry weight in digestate and 650 mg/kg dry weight in compost. The proposed FPR limit
value is 600 mg/kg dry weight (EU, 2018). The highest values measured in C/D are above this limit
value however most of the other measured data are below this limit. It is not clear if the value of 1098
mg/kg dry weight is representative of the current maximum level likely or is an outlier.
These values have been applied in estimating the exposure concentrations for this substance arising
from use of composts and digestates. Exposures have been estimated for two concentration scenarios:
A more conservative assessment is derived using the maximum reported concentrations
in estimating the local releases from the two scenarios, with a mid-range concentration
used in estimating the regional background. The proposed FPR limit value is lower than
the maximum reported concentration in both digestate and compost (see summary of
findings below).
A less conservative assessment is derived separately using a minimum concentration
used in estimating the regional background. This scenario is used to further define the
regional background concentration.
Table 3.33 Reported occurrence of zinc in composts and digestates
Concentrations in
composts/digestates
Value - units of mg/kg dry
wt Remarks
Composts - data availability
Most of data from one study in DE-Bavaria. Another
study from Austria, Belgium, Czech Republic, Germany,
Denmark, Spain, Finland, France, Italy, Luxembourg,
Malta, Netherlands, Portugal, Sweden, UK, Switzerland
gives upper limit values for concentration of ≤250
mg/kg dry wt. for compost from biowaste and green
waste, ≤200 mg/kg dry wt. green waste compost,
≤650 mg/kg dry wt. for sewage sludge compost and
≤500 mg/kg dry wt. in mechanical biological treatment
compost.
Compost - minimum
concentration 13.6
No minimum given – assumed 1/10 of the lowest
median (136 mg/kg dry wt.)
Compost - mid-range or average
concentration 197 Approximate mid-point of the range of medians
Compost - maximum
concentration 650
Highest actual (non-limit) value reported. One sample
is stated to be 1000 mg/kg but this looks to be an
outlier.
Proposed FPR limit value 600 mg/kg dry wt. Other limit
values in Germany reported in LFU (2016) are 5000
mg/kg dry wt. (DüMV, 2012 and 2015), 200 mg/kg dry
weight (quality assured Fachvereinigung Bayerischer
Komposthersteller e.V (FBK, 2015)), and 200 mg/kg dry
wt. (quality assured EU Öko-V (2008)).

D67 © Wood Environment & Infrastructure Solutions UK Limited
February 2019
Doc Ref. 40039CL003i3
Concentrations in
composts/digestates
Value - units of mg/kg dry
wt Remarks
Digestates - data availability
Digestate - minimum
concentration 132
Digestate - mid-range or average
concentration 276
Digestate - maximum
concentration 1098
Proposed FPR limit value is 600 mg/kg dry wt. The
highest reported concentration is above this value.
These concentrations in compost and in digestate equate to the following release amounts at the
regional and continental scale.
Table 3.34 Estimated regional and continental release amounts
Parameter Value
Mass of substance in EU-28 in compost (kg/year) 1,737,540
Mass of substance in EU-28 in digestate (kg/year) 9,737,280
Total regional emission to surface water (kg/day) 88
Total regional emission to soil (kg/day) 3056
Total continental emission to surface water (kg/day) 792
Total continental emission to agricultural soil (kg/day) 27,501
The reported regional background concentrations of zinc, taking into account all sources of zinc, are
shown in Table 3.35. The data are taken from EC (2010).
Table 3.35 Reported background concentrations of zinc in the environment
PECregional Value Remarks
Air 0.04 µg/m3 Based on measured data. Natural background component
is assumed to be negligible.
Surface water 6.7-8.8 µg/l Based on monitoring data. Dissolved concentration.
PNEC.
Sediment Regional PEC was not defined for the added risk approach
used in EC (2010)
Agricultural soil Regional PEC was not defined for the added risk approach
used in EC (2010)
Soil pore water/ground
water No data
Natural soil 0.5 mg/kg wet wt. Calculated PECadd value.
Urban/industrial soil Regional PEC was not defined for the added risk approach
used in EC (2010)

D68 © Wood Environment & Infrastructure Solutions UK Limited
February 2019
Doc Ref. 40039CL003i3
PECregional Value Remarks
Other relevant data
Surface water: 3-12 µg/l.
Sediment: 140 mg/kg dry wt.
(range 70-175 mg/kg dry wt.)
Soil: Large variation in natural
background in soil - 140 mg/kg
dry wt. for Dutch reference soil
Air: <1 µg/m3. .
Natural background concentrations (concentrations
resulting from predominantly natural sources).
Generic exposure scenario outcomes
The assessment has estimated local and background exposures of zinc resulting from the use scenarios
defined in Section 1, using the chemical property data and concentration in composts and digestates
in the previous sections as inputs. The predicted environmental exposure concentrations are as
summarised in Table 3.36.
Table 3.36 Predicted exposures for zinc arising from use of composts and digestates
Scenario I Units
PECagricultural soil 1.80E+01 [mg/kg dry wt.]
PECgrassland soil 7.06E+00 [mg/kg dry wt.]
PEC in groundwater 1.14E-01 [mg/l]
PECfreshwater 2.99E-03 [mg/l]
PECfreshwater-sediment 3.29E+02 [mg/kg dry wt.]
Humans via the environment: local
total daily intake No calculation possible – see text [mg.kg-1.d-1]
Humans via the environment: daily
dose via drinking water 3.25E-03 [mg.kg-1.d-1]
Humans via the environment:
dominant exposure source and
fraction
No calculation possible – see text
Secondary poisoning – freshwater
fish-eating birds and mammals No calculation possible – see text [mg/kg wet wt.]
Secondary poisoning – worm-eating
birds and mammals No calculation possible – see text [mg.kg-1]
Scenario II Units
PECagricultural soil 2.15E+02 [mg/kg dry wt.]
Humans via the environment: local
total daily intake No calculation possible – see text [mg.kg-1.d-1]
Humans via the environment:
dominant exposure source and
fraction
No calculation possible – see text
Secondary poisoning – worm-eating
birds and mammals No calculation possible – see text [mg.kg-1]

D69 © Wood Environment & Infrastructure Solutions UK Limited
February 2019
Doc Ref. 40039CL003i3
Table 3.37 presents the results of the quantitative risk characterisation along with the predicted steady
state mass balance in the region and continent. Please note that the steady state predicted by the
model are the amounts and distribution at the regional and continental scale arising from the C/D use
application pathway only. Adding in the release of the same substances via other pathways (air and
waste water) could lead to a different steady state balance.
Table 3.37 Quantitative risk characterisation conclusions for zinc in composts and digestates
Scenario I
RCR for local soil 6.91E-01
RCR for local freshwater 3.83E-01
RCR for local freshwater-sediment 6.71E+00
RCR for Humans via the environment: local total daily
intake No calculation possible – see text
RCR for fish-eating birds and mammals (fresh water) 0.00E+00
RCR for worm-eating birds and mammals 0.00E+00
Scenario II
RCR for local soil 8.25E+00
RCR for Humans via the environment: local total daily
intake No calculation possible – see text
RCR for worm-eating birds and mammals 0.00E+00
Regional
RCR for regional soil 7.66E-01
RCR for regional freshwater 2.90E-01
RCR for regional freshwater-sediment 1.02E+01
Steady state mass Units
Total steady-state mass (region +
continent) 1.51E+06 [t]
Steady-state mass in regional
freshwater (kg) 2.16E+04 [kg]
Steady-state mass in regional seawater
(kg) 2.19E+03 [kg]
Steady-state mass in regional air (kg) 4.68E-20 [kg]
Steady-state mass in regional
agricultural soil (kg) 1.43E+08 [kg]
Steady-state mass in regional natural
soil (kg) 1.54E-06 [kg]
Steady-state mass in regional industrial
soil (kg) 5.70E-07 [kg]
Steady-state mass in regional
freshwater sediment (kg) 4.48E+06 [kg]

D70 © Wood Environment & Infrastructure Solutions UK Limited
February 2019
Doc Ref. 40039CL003i3
Steady-state mass in regional seawater
sediment (kg) 2.32E+05 [kg]
Steady-state mass in continental
freshwater (kg) 2.48E+05 [kg]
Steady-state mass in continental
seawater (kg) 3.53E+06 [kg]
Steady-state mass in continental air
(kg) 4.24E-19 [kg]
Steady-state mass in continental
agricultural soil (kg) 1.29E+09 [kg]
Steady-state mass in continental
natural soil (kg) 7.02E-06 [kg]
Steady-state mass in continental
industrial soil (kg) 2.60E-06 [kg]
Steady-state mass in continental
freshwater sediment (kg) 5.14E+07 [kg]
Steady-state mass in continental
seawater sediment (kg) 1.88E+07 [kg]
Steady state mass fraction Units
Total steady-state mass fraction
(region + continent)
Steady-state mass fraction in regional
freshwater (%) 7.76E-04 [%]
Steady-state mass fraction in regional
seawater (%) 7.86E-05 [%]
Steady-state mass fraction in regional
air (%) 1.68E-27 [%]
Steady-state mass fraction in regional
agricultural soil (%) 5.15E+00 [%]
Steady-state mass fraction in regional
natural soil (%) 5.53E-14 [%]
Steady-state mass fraction in regional
industrial soil (%) 2.05E-14 [%]
Steady-state mass fraction in regional
freshwater sediment (%) 1.61E-01 [%]
Steady-state mass fraction in regional
seawater sediment (%) 8.36E-03 [%]
Steady-state mass in continental
freshwater (kg) 8.91E-03 [%]
Steady-state mass in continental
seawater (kg) 1.27E-01 [%]
Steady-state mass in continental air
(kg) 1.52E-26 [%]
Steady-state mass in continental
agricultural soil (kg) 4.64E+01 [%]
Steady-state mass in continental
natural soil (kg) 2.52E-13 [%]

D71 © Wood Environment & Infrastructure Solutions UK Limited
February 2019
Doc Ref. 40039CL003i3
Steady-state mass in continental
industrial soil (kg) 9.35E-14 [%]
Steady-state mass in continental
freshwater sediment (kg) 1.85E+00 [%]
Steady-state mass in continental
seawater sediment (kg) 6.75E-01 [%]
The realistic worst case RCRs for water and soil for scenario I, indicating a low risk from the use of C/D
for water and soil. However, the RCRs are >1 for sediment for scenario I and soil for scenario II. These
are based on a maximum concentration in digestate of 1098 mg/kg dry weight and a maximum
concentration in compost of 650 mg/kg dry wt. Further, the realistic worst case approach leads to a
regional RCR of 10.2 for sediment when the approximately mid-range concentration in C/D is
considered. When the regional RCRs are calculated using a more conservative scenario assuming that
the concentration in C/D is at the minimum level reported the regional RCR is reduced to 4.2.
It is important to note that the regional RCRs have a high uncertainty associated with them. The
calculations are steady-state calculations assuming a continuous input of zinc. The timescales involved
before steady-state is reached (in the model) are large and may run and may be over hundreds if not
thousands of years and are highly uncertain. The regional concentrations predicted also impact on the
local RCRs as they act as the background concentration for the local concentrations. There is also some
uncertainty resulting from the form of zinc at the regional level; this may not necessarily be
bioavailable.
The potential uncertainties in the regional background for zinc were considered in EC (2010) and in
that risk assessment the PNECs were all defined in terms of added zinc, that is freshly added zinc over
that present in the background. This effectively ignores the regional background concentration and
focuses more on the concentration resulting from the freshly added zinc over that of the background
concentration. This is known as the “added risk approach”.
When the added risk approach is used for the current scenarios, RCRs >1 are still obtained in the
realistic worst case scenarios for sediment for scenario I and soil for scenario II. For scenario I this is
based on the highest measured digestate concentration of 1098 mg/kg dry weight. This concentration
is above the proposed FPR limit value of 600 mg/kg dry weight. When the concentration in digestate is
≤600 mg/kg dry weight the RCR for sediment for scenario I is ≤0.89. For scenario II the concentration
in compost would need to be ≤70 mg/kg dry weight in order to achieve RCRs <1 for soil. For
comparison, the approximate mid-range concentration measured in compost is higher than this limit
(mid-range concentration around 197 mg/kg dry weight).
Zinc is an essential element and the levels within an organism are controlled by homeostasis.
Therefore, accumulation through the food chain is not a relevant concept for zinc and no assessment
of secondary poisoning is carried out. This is in line with the approach used in EC (2010).
The human health parts of the EU risk assessment for zinc (EC 2010) are not publicly available and so
the approach taken in the EU risk assessment for man exposed via the environment is unclear.
Similar to copper, the uptake of zinc from soil into plants is complicated as homeostasis will tend to
reduce the concentrations in plants at higher soil concentrations. Therefore, it is not possible to
reliably quantify the exposure of man via the environment from the use of C/D.
The conclusions of the risk characterisation for man exposed via the environment carried out in EC
(2010) reported no risk to man via the environment from exposure via the food chain from the

D72 © Wood Environment & Infrastructure Solutions UK Limited
February 2019
Doc Ref. 40039CL003i3
industrial use of zinc, including from agricultural activities (e.g. the presence in fertiliers). Therefore, it is
considered that dietary intake of zinc from plants grown on compost- or digestate-amended soils
would not contribute significantly to the risks from dietary zinc.
The realistic worst case regional concentration in agricultural soil predicted for the use of C/D is 17.6
mg/kg wet weight (19.9 mg/kg dry weight). For comparison, EC (2010) gives the natural background
concentration (e.g. the concentration resulting from natural sources alone) as up to 140 mg/kg dry
weight, although it was noted that there was a large variation in this value. Therefore, the
concentration in soil resulting from zinc from C/D is less than the natural background (around 14%),
and this strengthens the above conclusion that C/D would not significantly contribute to the risks from
dietary zinc.
EC (2010) also considers the input of zinc from soil from agricultural uses (including presence in
fertilisers) and estimates that the total input to soil from all agricultural uses was around 17,000
tonnes/year (equivalent to an input of 0.124 kg zinc/ha across the EU). The amount of zinc input to soil
from use in C/D is estimated to be around 1,700 tonnes/year assuming the mid-range concentration.
Again, this suggests that the input of zinc to soil from C/D is relatively small (around 10%) compared
with other sources.
Sensitivity to specific variables
In respect of local Scenario II, the sensitivity of the outcomes to possible losses from the system by
leaching and drainage of excess water has been explored using a fugacity method. For this substance
the proportion of substance in the system distributed to the interstitial water at equilibrium under
‘high water content’ conditions, and hence sensitive to leaching, is 1.1% of the substance present in
the system. Hence, the sensitivity of the exposure scenario to such variations in water management is
considered to be low.
Summary of findings
Table 3.38 below presents the summary of key findings from the risk assessment of zinc that has been
made in this project. The findings are discussed further below the table.
Table 3.38 Summary of key findings for exposure of zinc via use of compost and digestates
Key findings of the risk assessment of zinc in contaminated composts and digestates
Overall range of compost and digestate concentrations 132 to 1098 mg/kg dry wt.
Median values typically around 200-280 mg/kg dry wt.
Major raw material sources Only limited data are available. Concentrations broadly
similar across different raw material sources (renewable raw
materials, co-digestion, biowaste and green waste, and solid
and liquid biowaste). It is not possible to differentiate
whether natural or anthropogenic in origin26.
Safe limit concentration in compost and digestate 600 mg/kg dry weight for application of compost or
digestate to agricultural land.
70 mg/kg dry weight for compost used in container growing.
26 The presence of heavy metals in compost/digestate could result from natural occurrence, industrial sources or a
combination of both. Metals will generally be present (at relatively low levels) in most living matter and survive the
processes associated with anaerobic digestion / composting.

D73 © Wood Environment & Infrastructure Solutions UK Limited
February 2019
Doc Ref. 40039CL003i3
Key findings of the risk assessment of zinc in contaminated composts and digestates
Main concern(s) arising Sediment for scenario I, related to application of compost or
digestate onto agricultural land.
Soil for scenario II, related to compost use in container
growing.
High cumulative loads at steady state and high predicted
regional RCRs in sediment.
Effects considered in the main concern hazard(s) PNEC for sediment is derived from survival and growth data
for benthic organisms.
PNEC for soil is based on toxicity to soil microbial processes,
plants and soil inverbrates derived from species sensitivity
distributions.
Uncertainties and their implications Small occurrence data set covering limited number of
countries.
Uncertainties over the risk at the regional level.
Sensitivity of exposures to variations in water management
in the local container growing scenario is low.
Other remarks Zinc is an essential element. Therefore, accumulation
through the food chain is not a relevant concept for zinc and
no quantitative assessment of secondary poisoning or man
exposed via the environment is carried out.
The input of zinc to agricultural soil from C/D is relatively
small (around 10% of the total) compared with other sources.
The realistic worst case analysis carried out indicates RCRs <1 for water and soil for scenario I,
indicating a low risk. However the realistic worst case analysis results in RCRs >1 for sediment for
scenario I and soil for scenario II. RCRs >1 are also indicated for sediment at a regional level when
calculated using the approximate mid-range concentration in C/D, however the regional risk
assessment for zinc is highly uncertain.
When the added risk approach is used, RCRs for scenario I for sediment, water and soil are all <1 when
the concentration in digestate or compost is limited to ≤600 mg/kg dry weight, which corresponds to
the proposed limit value for FPR for zinc (EU, 2018). This shows that the proposed limit value would
be sufficient to control the risks from this scenario. For scenario II (which relates to compost only), the
concentration in compost would need to be limited to ≤70 mg/kg dry weight in order to achieve RCRs
<1. This is below the proposed FPR limit value, and also lower than the approximate mid-range of the
measured data.
Zinc is an essential element and the levels within an organism are controlled by homeostasis.
Therefore, accumulation through the food chain is not a relevant concept for zinc and no quantitative
assessment of secondary poisoning or man exposed via the environment is carried out.
The contribution from C/D to the total background levels, including other agricultural uses and natural
sources, of zinc present in soil from all sources is small. The total EU input of zinc into agricultural soil
from C/D (assuming the concentration present is around the mid-range level) estimated to be around
1,700 tonnes; this compares with an estimate of the total EU input of zinc into agricultural soil of
17,000 tonnes from all agricultural uses. The natural background of zinc in soil is also relatively high. At
steady state, 54% of the total mass remains within the region + continent27, suggesting that there is
27 This refers to the regional and continental spatial scales in the EUSES model. Refer to Section 1.7 and the Annex for further
information.

D74 © Wood Environment & Infrastructure Solutions UK Limited
February 2019
Doc Ref. 40039CL003i3
some transfer over long distances following release via the handling and application of C/D28. The
realistic worst case mass of zinc in the region + continent at steady state as a result of use of C/D is
estimated to be around 1.51×10⁹ kg assuming that all compost contains zinc at the mid-range of the
levels that have been measured. This steady-state mass amounts to 130 times the mass released
annually via application of composts and digestates29.
3.7 Mercury (Hg)
Background information and remarks
Mercury (CAS 7439-97-6) has been subject to a number of international health and or environmental
evaluations including those carried out by the World Health Organization under the International
Programme on Chemical Safety (WHO, 1976, 1989a, 1990 and 1991), United Nations Environment
Programme (UNEP, 2013) and evaluations of dietary intake undertaken by the European Food Safety
Authority (EFSA, 2008a and 2012b). These evaluations have been used as the basis of the chemical
properties and hazard data set for mercury.
In the environment, mercury can undergo biological methylation to form methyl-mercury compounds,
which is a more bioaccumulative form of mercury. Therefore the properties of methyl-mercury
compounds have also been considered in relation to the assessment of secondary poisoning and
exposure of man via the environment.
The EU has adopted a Community Strategy on Mercury30. The strategy includes a comprehensive plan
aimed at addressing mercury use and pollution. The European Union is also a signatory to the
Minamata Convention on Mercury31. The Minamata Convention is a global treaty to protect human
health and the environment from the adverse effects of mercury and entered into force on 16 August
2017.
Chemical properties and hazards data set
The relevant property data are summarised in Table 3.39 below. Based on global cycling (see below),
assess the concentrations in water, soil, air and sediment in terms of elemental Hg but secondary
poisoning and fish based on the appropriate log Kow and BCFs for dimethyl mercury.
The EU harmonised CLP classification for mercury is: Acute Tox. 2; STOT RE 1 – H372; Repr. 1B; Aquatic
Acute 1 – H400; Aquatic Chronic 1 – H410.
Table 3.39 Property information for mercury
Property Value Comment
Molecular weight 200.59 g/mol - elemental
251.1 g/mol - methylmercury chloride
EFSA (2008a).
28 The possibility or not for transfer over long distance is largely an inherent property of the substances themselves, but it is
interesting if this is expressed even when the pathway into the environment is so dominated by incorporation into soil. 29 Please note this is not to be interpreted as how much time elapses to reach steady state; the steady state predicted by the
model are the amounts and distribution at the regional and continental scale arising from the compost and digestate use
application pathway only. Adding in the release of the same substances via other pathways (air and waste water) and natural
sources, could lead to a different steady state picture. 30 Community Strategy Concerning Mercury. Communication from the Commission to the Council and the European Parliament.
COM (2005) 20 final. http://ec.europa.eu/environment/chemicals/mercury/strategy_en.htm 31 http://www.mercuryconvention.org/Countries/tabid/3428/Default.aspx

D75 © Wood Environment & Infrastructure Solutions UK Limited
February 2019
Doc Ref. 40039CL003i3
Property Value Comment
230.7 g/mol - dimethyl mercury
Melting point -38.8°C – elemental
Boiling point
Vapour pressure 0.18 Pa at 20°C - elemental
1.76 Pa at 25°C - methylmercury
chloride
8300 Pa at 25°C - dimethyl mercury
EFSA (2008a).
Water solubility 5.6×10⁻⁵ g/l at 25°C - elemental
5-6 g/l at 25°C - methylmercury
chloride
Practically insoluble - dimethyl mercury
EFSA (2008a). Dimethyl mercury is
thermodynamically unstable in water
below pH 5 and is spontaneously
converted to methyl mercury.
log Kow 0.62 - elemental
0.41 - methylmercury chloride
2.28 - dimethyl mercury
EFSA (2008a).
Henry’s law constant 729 Pa m3/mol at 20°C - elemental
0.038 Pa m3/mol at 15°C and pH 5.2 -
methylmercury chloride
646 Pa m3/mol at 25°C - dimethyl
mercury"
Koc Kp = 6,300 l/kg for soil (same value
assumed for sediment and suspended
sediment)
Much of mercury in natural waters is
strongly bound to sediment or organic
material and is unavailable to
organisms (WHO, 1989a).
Kp values are measured solids-water
partition coefficients and are used
directly in the EUSES modelling. The Kp
value is taken from the dissemination
dossier for mercury available on the
ECHA website.
BCF BCF for fish ~8000 l/kg
BMF 10
BAF plant leaves 0.002-0.03
BAF plant roots 0.05-0.12"
For methyl mercury.
WHO (1990) gives bioaccumulation
factors of 10,000-100,000 for fish
including biomagnification.
Plant BAFs are based on concentration
in plant/concentration in soil, both on a
dry weight basis.
Biodegradability Assumed not be biodegradable
Half-life in air Assumed not to be degradable
PNECs Maximum allowable concentration
MAC-EQS = 0.07 µg/l
EQS for biota = 20 µg/kg wet weight.
No PNECs have been derived in EU Risk
Assessment reports. Directive
2008/105/ECa sets maximum allowable
concentration MAC-EQS 0.07 µg/l for
surface water and an EQS for biota of
20 µg/kg wet weight (Directive
2008/105/EC as amended

D76 © Wood Environment & Infrastructure Solutions UK Limited
February 2019
Doc Ref. 40039CL003i3
Property Value Comment
(2013/39/EU)). The EQS values are for
mercury and its compounds.
No published PNECs have been located
for sediment or soil. WHO (1989a)
summarises the available terrestrial
toxicity data but indicates that the data
are difficult to interpret and may not
reflect the field situation. Therefore it is
not currently possible to carry out a
meaningful qualitative assessment for
the soil and sediment compartment.
DNEL TWI = 4 µg Hg/kg bw/week for
inorganic mercury
TWI = 1.3 µ Hg/kg bw/week for methyl
mercury
EFSA Tolerable Weekly Intake (TWI)
values (EFSA, 2012).
Other relevant data Limit value for drinking water 1 µg/l
(Council Directive 98/83/EC).
Maximum levels (ML) in fish for
mercury are 0.5 mg/kg wet wt or 1
mg/kg wet wt depending on species
(Commission Regulation (EC) No
1881/2006 amended by Commission
Regulation (EC) No 629/2008).
EFSA (2012)
Note: a) Environmental Quality Standard (EQS) set under Directive 2008/105/EC (EU, 2008) or proposed EQS (EC, 2012).
Occurrence data set
Table 3.40 presents a summary of the reported concentrations of mercury in composts and digestates.
This is based on the survey of the available literature collected in Task 2 of the project and reported in
the main project report. Consultation and literature research suggest that contamination rates of
mercury between <0.018 and 0.21 mg/kg dry weight to in digestate and 0.085 and 0.98 in compost.
The proposed FPR limit value is 1 mg/kg dry weight (EU, 2018) and all of the measured data are below
this value.
These values have been applied in estimating the exposure concentrations for this substance arising
from use of composts and digestates. Exposures have been estimated for the following realistic worst
case concentration scenario:
A conservative assessment is derived using the maximum reported concentrations in
estimating the local releases from the two scenarios, with a mid-range concentration
used in estimating the regional background. The proposed FPR limit value is slightly
higher than the maximum reported concentrations (see summary of findings below).
Table 3.40 Reported occurrence of mercury in composts and digestates
Concentrations in
composts/digestates
Value - units of mg/kg dry
wt Remarks
Composts - data availability
One study from DE-Bavaria. Input material greenwaste
or biowaste. Data may show a declining trend over the
years 2000 to 2013/14 but cannot be certain owing to
limited data.
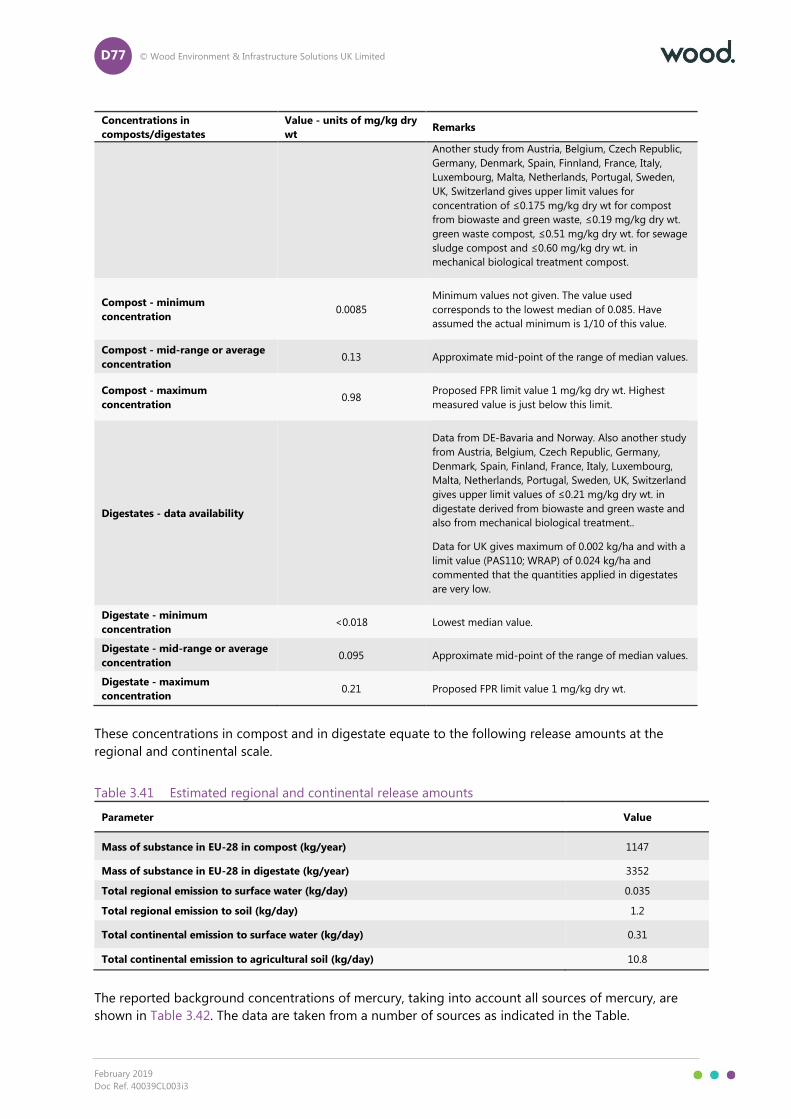
D77 © Wood Environment & Infrastructure Solutions UK Limited
February 2019
Doc Ref. 40039CL003i3
Concentrations in
composts/digestates
Value - units of mg/kg dry
wt Remarks
Another study from Austria, Belgium, Czech Republic,
Germany, Denmark, Spain, Finnland, France, Italy,
Luxembourg, Malta, Netherlands, Portugal, Sweden,
UK, Switzerland gives upper limit values for
concentration of ≤0.175 mg/kg dry wt for compost
from biowaste and green waste, ≤0.19 mg/kg dry wt.
green waste compost, ≤0.51 mg/kg dry wt. for sewage
sludge compost and ≤0.60 mg/kg dry wt. in
mechanical biological treatment compost.
Compost - minimum
concentration 0.0085
Minimum values not given. The value used
corresponds to the lowest median of 0.085. Have
assumed the actual minimum is 1/10 of this value.
Compost - mid-range or average
concentration 0.13 Approximate mid-point of the range of median values.
Compost - maximum
concentration 0.98
Proposed FPR limit value 1 mg/kg dry wt. Highest
measured value is just below this limit.
Digestates - data availability
Data from DE-Bavaria and Norway. Also another study
from Austria, Belgium, Czech Republic, Germany,
Denmark, Spain, Finland, France, Italy, Luxembourg,
Malta, Netherlands, Portugal, Sweden, UK, Switzerland
gives upper limit values of ≤0.21 mg/kg dry wt. in
digestate derived from biowaste and green waste and
also from mechanical biological treatment..
Data for UK gives maximum of 0.002 kg/ha and with a
limit value (PAS110; WRAP) of 0.024 kg/ha and
commented that the quantities applied in digestates
are very low.
Digestate - minimum
concentration <0.018 Lowest median value.
Digestate - mid-range or average
concentration 0.095 Approximate mid-point of the range of median values.
Digestate - maximum
concentration 0.21 Proposed FPR limit value 1 mg/kg dry wt.
These concentrations in compost and in digestate equate to the following release amounts at the
regional and continental scale.
Table 3.41 Estimated regional and continental release amounts
Parameter Value
Mass of substance in EU-28 in compost (kg/year) 1147
Mass of substance in EU-28 in digestate (kg/year) 3352
Total regional emission to surface water (kg/day) 0.035
Total regional emission to soil (kg/day) 1.2
Total continental emission to surface water (kg/day) 0.31
Total continental emission to agricultural soil (kg/day) 10.8
The reported background concentrations of mercury, taking into account all sources of mercury, are
shown in Table 3.42. The data are taken from a number of sources as indicated in the Table.

D78 © Wood Environment & Infrastructure Solutions UK Limited
February 2019
Doc Ref. 40039CL003i3
Table 3.42 Reported background concentrations of mercury in the environment
PECregional Value Remarks
Air 1.5-1.7 ng/m3 Natural background level in Northern Hemisphere. EFSA (2012)
Surface water 1-20 ng/l
<5 ng/l
Total background mercury in freshwater is 1-20 ng/l (EFSA, 2012). EFSA
(2008) gives concentration in uncontaminated freshwater as <5 ng/l
total mercury.
EFSA (2012): methyl mercury can contribute up to 30% of the total
mercury in freshwaters.
Sediment
Levels at uncontaminated sites similar to levels in soil. Contribution of
methyl mercury to total mercury in sediments is about 1-1.5%. (EFSA,
2012; WHO, 1976)
Agricultural soil 0.02-0.4 mg/kg
dry wt. "Normal" range in agricultural soils from EFSA (2008a).
Soil pore water/ground
water No data
Natural soil 0.02-0.625 mg/kg
dry wt. General background levels in soil (WHO, 1989a)
Urban/industrial soil
Other relevant data
Global emissions to atmosphere in 2010 from human activities 1960
tonnes/year (range 1010-4070 tonnes/year). The EU 27 account for
around 4.5% of this or around 87.5 tonnes/year (range 44.5-226
tonnes/year) (UNEP, 2013).
Global emissions to air from natural degassing of earths' crust - 2,700-
6,000 tonnes/year (WHO, 1990).
Anthropogenic sources of mercury emission account for about 30%
and re-emission and remobilization account for around 60% of the
total amount of mercury entering the atmosphere each year (UNEP,
2013).
Global cycling is mainly as inorganic forms but methylation is important
for accumulation (WHO, 1990). Monomethyl mercury is predominant
product of biological methylation at near neutral pH (WHO, 1989a).
Generic exposure scenario outcomes
The assessment has estimated local and background exposures of mercury resulting from the use
scenarios defined in Section 1, using the chemical property data and concentration in composts and
digestates in the previous sections as inputs. The predicted realistic worst case environmental exposure
concentrations are as summarised in Table 3.43.
Table 3.43 Predicted exposures for mercury arising from use of composts and digestates
Scenario I Units

D79 © Wood Environment & Infrastructure Solutions UK Limited
February 2019
Doc Ref. 40039CL003i3
PECagricultural soil 1.33E-02 [mg/kg dry wt.]
PECgrassland soil 4.40E-03 [mg/kg dry wt.]
PEC in groundwater 2.08E-06 [mg/l]
PECfreshwater 1.66E-06 [mg/l]
PECfreshwater-sediment 1.04E-02 [mg/kg dry wt.]
Humans via the environment: local
total daily intake 2.79E-05 (see text) [mg.kg-1.d-1]
Humans via the environment: daily
dose via drinking water 5.95E-08 [mg.kg-1.d-1]
Humans via the environment:
dominant exposure source and fraction Fish 78%
Secondary poisoning – freshwater fish-
eating birds and mammals 6.98E-02 [mg/kg wet wt.]
Secondary poisoning – worm-eating
birds and mammals 6.54E-04 [mg.kg-1]
Scenario II Units
PECagricultural soil 3.24E-01 [mg/kg dry wt.]
Humans via the environment: local
total daily intake 8.07E-06 (see text) [mg.kg-1.d-1]
Humans via the environment:
dominant exposure source and fraction Air 74.8%
Secondary poisoning – worm-eating
birds and mammals 1.47E-02 [mg.kg-1]
Table 3.44 presents the results of the quantitative risk characterisation along with the predicted steady
state mass balance in the region and continent. Please note that the steady state predicted by the
model are the amounts and distribution at the regional and continental scale arising from the C/D use
application pathway only. Adding in the release of the same substances via other pathways (air and
waste water) could lead to a different steady state balance.
Table 3.44 Quantitative risk characterisation conclusions for mercury in composts and digestates
Scenario I
RCR for local soil no estimate possible
RCR for local freshwater 2.37E-02
RCR for local freshwater-sediment no estimate possible
RCR for Humans via the environment: local total daily
intake see text
RCR for fish-eating birds and mammals (fresh water) 3.49E+00
RCR for worm-eating birds and mammals 3.27E-02
Scenario II

D80 © Wood Environment & Infrastructure Solutions UK Limited
February 2019
Doc Ref. 40039CL003i3
RCR for local soil no estimate possible
RCR for Humans via the environment: local total daily
intake see text
RCR for worm-eating birds and mammals 7.33E-01
Regional
RCR for regional soil no estimate possible
RCR for regional freshwater 1.28E-03
RCR for regional freshwater-sediment no estimate possible
Steady state mass Units
Total steady-state mass (region
+ continent) 4.24E+02 [t]
Steady-state mass in regional
freshwater (kg) 3.55E-01 [kg]
Steady-state mass in regional
seawater (kg) 1.29E-01 [kg]
Steady-state mass in regional air
(kg) 8.53E+02 [kg]
Steady-state mass in regional
agricultural soil (kg) 9.86E+03 [kg]
Steady-state mass in regional
natural soil (kg) 1.83E+02 [kg]
Steady-state mass in regional
industrial soil (kg) 6.78E+01 [kg]
Steady-state mass in regional
freshwater sediment (kg) 1.02E+01 [kg]
Steady-state mass in regional
seawater sediment (kg) 1.17E+00 [kg]
Steady-state mass in continental
freshwater (kg) 1.12E+01 [kg]
Steady-state mass in continental
seawater (kg) 1.84E+04 [kg]
Steady-state mass in continental
air (kg) 1.48E+05 [kg]
Steady-state mass in continental
agricultural soil (kg) 2.16E+05 [kg]
Steady-state mass in continental
natural soil (kg) 1.60E+04 [kg]
Steady-state mass in continental
industrial soil (kg) 5.93E+03 [kg]
Steady-state mass in continental
freshwater sediment (kg) 3.19E+02 [kg]
Steady-state mass in continental
seawater sediment (kg) 8.38E+03 [kg]
Steady state mass fraction Units
Total steady-state mass fraction
(region + continent)
Steady-state mass fraction in
regional freshwater (%) 2.45E-06 [%]

D81 © Wood Environment & Infrastructure Solutions UK Limited
February 2019
Doc Ref. 40039CL003i3
Steady-state mass fraction in
regional seawater (%) 8.87E-07 [%]
Steady-state mass fraction in
regional air (%) 5.89E-03 [%]
Steady-state mass fraction in
regional agricultural soil (%) 6.81E-02 [%]
Steady-state mass fraction in
regional natural soil (%) 1.26E-03 [%]
Steady-state mass fraction in
regional industrial soil (%) 4.68E-04 [%]
Steady-state mass fraction in
regional freshwater sediment
(%)
7.01E-05 [%]
Steady-state mass fraction in
regional seawater sediment (%) 8.07E-06 [%]
Steady-state mass in continental
freshwater (kg) 7.70E-05 [%]
Steady-state mass in continental
seawater (kg) 1.27E-01 [%]
Steady-state mass in continental
air (kg) 1.02E+00 [%]
Steady-state mass in continental
agricultural soil (kg) 1.49E+00 [%]
Steady-state mass in continental
natural soil (kg) 1.10E-01 [%]
Steady-state mass in continental
industrial soil (kg) 4.09E-02 [%]
Steady-state mass in continental
freshwater sediment (kg) 2.20E-03 [%]
Steady-state mass in continental
seawater sediment (kg) 5.79E-02 [%]
For surface water, the realistic worst case assessment results in RCRs <1 for both scenario I and
scenario II suggesting the risk to surface water from use of C/D at current levels is low.
Unlike the other metals considered, the accumulative form of mercury is as methyl-mercury
compounds, and appropriate log Kow values exist. For secondary poisoning the concentrations in fish
have been estimated using an experimental BCF value of 8,000 l/kg (from WHO, 1989a) and a
biomagnification factor of 10. The uptake into earthworms has been estimated using the default
methods in EUSES.
Using these factors, the RCR is <1 for exposure scenario I for the earthworm food chains but is >1 for
the fish food chain, indicating a potential risk. Secondary poisoning via the fish food chain is not
relevant for exposure scenario II.
With the exception of fish (for which an experimental BCF value of 8000 l/kg has been used (WHO,
1989a), the uptake into the food chain has therefore been estimated using the default methods within
EUSES. This gives the total daily intake for humans as 2.79×10⁻⁵ mg/kg bw/day for scenario I and
8.07×10⁻⁶ mg/kg bw/day for scenario II.
For comparison, accumulation factors from soil are available for mercury for plant leaves (0.002-0.03)
and plant roots (0.05-0.12), both related to the concentration in plant/concentration in soil on a dry
weight basis (WHO, 1990). The predicted concentrations in agricultural soil for scenario I and scenario
II are respectively 0.0133 mg/kg dry weight and 0.324 mg/kg dry weight respectively. Therefore, the
concentrations in leaf crops can be estimated to be approximately 2.7×10⁻⁵-4.0×10⁻⁴ mg/kg dry weight
D82 © Wood Environment & Infrastructure Solutions UK Limited
February 2019
Doc Ref. 40039CL003i3
for scenario I and 6.5×10⁻⁴-9.7×10⁻³ mg/kg dry weight. Similarly, the concentrations in root crops can
be estimated to be approximately 6.7×10⁻⁴-1.6×10⁻³ mg/kg dry weight for scenario I and 0.016-0.039
mg/kg dry weight. Assuming that the leaf crops and root crops are approximately 11% water (as
assumed earlier for nickel), and assuming the EUSES default daily intake rates of leaf crops and root
crops, the daily human intake can be estimated to be approximately 3.7×10⁻⁶-1.4×10⁻⁵ mg/kg bw/day
(0.026-0.097 µg/kg bw/week) for scenario I and 8.9×10⁻⁵-3.4×10⁻⁴ mg/kg bw/day (0.62-2.4 µg/kg
bw/week) for scenario I using these data. These values are all below the EFSA Tolerable Weekly Intake
(TWI) value for mercury (4 µg Hg/kg bw/week) but the top end of the range for scenario II (very much
a worst case estimate) is slightly above the EFSA TWI for methyl mercury of 1.3 µg Hg/kg bw/week
only if it is assumed that the crops from this source are eaten every day of the week, which is highly
unlikely.
Overall, it is concluded that the use of C/D with the currently assessed levels of mercury are unlikely to
lead to a risk to humans through the food chain, but may present a risk to fish-eating birds and
mammals in scenario I. In order to control this risk, the maximum concentration of mercury in compost
or digestate would need to be limited to ≤0.2 mg/kg dry weight. This value is below the proposed FPR
limit value for mercury of 1 mg/kg dry weight (EU, 2018). The highest reported concentration of
mercury in digestate is 0.21 mg/kg dry weight, which would lead to RCRs close to, but above 1 for
secondary poisoning but the majority of data are below this concentration. The mid-range
concentration reported in compost are <0.2 mg/kg dry weight, which would not lead to a risk based
on these calculations, but the highest reported concentration in compost (0.98 mg/kg dry weight)
would lead to RCRs >1 for secondary poisoning.
It is important to note that no quantitative risk characterisation for sediment or soil has been carried
out as reliable PNECs have not been located for sediment or soil.
The regional concentration of mercury in agricultural soil calculated using the mid-range concentration
for both C/D is 1.21×10⁻³ mg/kg wet weight (1.4×10⁻⁴ mg/kg dry weight). The “normal” range of
mercury in agricultural soil is 0.02-0.4 mg/kg dry weight. Therefore the overall contribution from C/D
to the total concentration of mercury in soil is low.
Sensitivity to specific variables
In respect of local Scenario II, the sensitivity of the outcomes to possible losses from the system by
leaching and drainage of excess water has been explored using a fugacity method. For this substance
the proportion of substance in the system distributed to the interstitial water at equilibrium under
‘high water content’ conditions, and hence sensitive to leaching, is ≤1% of the substance present in the
system. Hence, the sensitivity of the exposure scenario to such variations in water management is
considered to be low.
Summary of findings
Table 3.45 below presents the summary of key findings from the risk assessment of mercury that has
been made in this project. The findings are discussed further below the table.
Table 3.45 Summary of key findings for exposure of mercury via use of compost and digestates
Key findings of the risk assessment of mercury in contaminated composts and digestates
Overall range of compost and digestate concentrations <0.018-0.98 mg/kg dry wt.
Major raw material sources The data suggests that the concentrations may be higher
with biowaste and green waste, and solid and liquid
biowaste as raw material sources than renewable raw

D83 © Wood Environment & Infrastructure Solutions UK Limited
February 2019
Doc Ref. 40039CL003i3
Key findings of the risk assessment of mercury in contaminated composts and digestates
materials and co-digestion as raw material sources. However,
only very limited data are available. It is not possible to
differentiate whether natural or anthropogenic in origin32.
Safe limit concentration in compost and digestate 0.2 mg/kg dry wt for C/D applied to agricultural land
Main concern(s) arising Secondary poisoning.
Transfer over long distances.
Effects considered in the main concern hazard(s) Concerns for secondary poisoning are based on the existing
EQS for biota. The effects considered in deriving the EQS are
not clear.
Uncertainties and their implications No quantitative risk characterisation for sediment or soil has
been carried out. Therefore the risks to these protection
goals is unclear.
Small occurrence data set covering limited number of
countries.
Sensitivity of exposures to variations in water management in
the local container growing scenario is low.
Other remarks The overall contribution from C/D to the total concentration
of mercury in agricultural soil is low.
European Union is a signatory to the UN Minamata
Convention on Mercury.
The realistic worst case analysis carried out indicates RCRs <1 for water for scenario I and scenario II,
indicating a low risk. However the realistic worst case analysis results in RCRs >1 for secondary
poisoning for scenario I. In order to control this risk, the maximum concentration of mercury in
compost or digestate would need to be limited to ≤0.2 mg/kg dry weight. This value is below the
proposed FPR limit value for mercury. The highest reported concentration of mercury in digestate is
0.17 mg/kg dry weight and the mid-range concentration reported in compost are <0.2 mg/kg dry
weight, which would not lead to a risk based on these calculations, but the highest report
concentration in compost (0.98 mg/kg dry weight) would lead to RCRs >1 for secondary poisoning.
The contribution from C/D to the total background levels of mercury present in agricultural soil from
all sources is small. At steady state, ~3% of the total mass remains within the region + continent33,
suggesting that there is potential for transfer over long distances following release via the handling
and application of C/D34. The realistic worst case mass of mercury in the region + continent at steady
state as a result of use of C/D is estimated to be around 4.24×10⁵ kg assuming that all compost
contains mercury at the mid-range of the levels that have been measured. This steady-state mass
amounts to 10 times the mass released annually via application of composts and digestates35. It is
32 The presence of heavy metals in compost/digestate could result from natural occurrence, industrial sources or a
combination of both. Metals will generally be present (at relatively low levels) in most living matter and survive the
processes associated with anaerobic digestion / composting. 33 This refers to the regional and continental spatial scales in the EUSES model. Refer to Section 1.7 and the Annex for further
information. 34 The possibility or not for transfer over long distance is largely an inherent property of the substances themselves, but it is
interesting if this is expressed even when the pathway into the environment is so dominated by incorporation into soil. 35 Please note this is not to be interpreted as how much time elapses to reach steady state; the steady state predicted by the
model are the amounts and distribution at the regional and continental scale arising from the compost and digestate use
application pathway only. Adding in the release of the same substances via other pathways (air and waste water) and natural
sources, could lead to a different steady state picture.

D84 © Wood Environment & Infrastructure Solutions UK Limited
February 2019
Doc Ref. 40039CL003i3
important to note, however, that a significant proportion (~97%) of the steady-state mass of mercury
is predicted to have transported out of the region and continent to more remote areas.
It should be noted that the European Union is a signatory to the UN Minamata Convention on
Mercury. The Minamata Convention is a global treaty to protect human health and the environment
from the adverse effects of mercury and entered into force on 16th August 2017. Among other things
the Convention covers control measures on emissions to air and on releases to land and water, and
disposal of mercury once it becomes waste; hence it could be anticipated that levels of mercury in raw
materials for composts and digestates would consequently be reduced in future.
3.8 Bisphenol-A (BPA)
Background information and remarks
BPA (4,4'-isopropylidenediphenol, Bisphenol A, CAS 80-05-7), a plastics additive, has been subject to a
comprehensive EU risk assessment (EC, 2010b).
The main source of uncertainty for the present exposure assessment is that the data set for reported
occurrence in composts and digestates is small.
Chemical properties and hazards data set
The European Commission identifies BPA as an SVHC substance under the REACH Regulation on the
basis of it being toxic for reproduction (Article 57c of REACH) and its endocrine disrupting properties
in relation to both human health and the environment (Article 57f of REACH). There are restrictions
under REACH (Annex XVII), and BPA is under evaluation in CoRAP.
Harmonised classification and labelling applies in the EU under CLP (Eye Dam. 1 - H318; Skin Sens. 1 -
H317; STOT SE 3 - H335; Repr. 1B - H360F); some CLP notifiers also self-classify for the environment.
PNECs and DNELs are available from existing published assessments.
The substance property data has been taken mainly from the EU risk assessment (EC, 2010b) risk
assessment. Documentation relating to the Restriction has also been referred to. The key property
information from EC (2010b) needed for the modelling is summarised in Table 3.46. Where information
from other sources is included this is indicated in the Table.
Table 3.46 Property information for BPA (from EC (2010b) unless otherwise indicated)
Property Value Comment
Molecular weight 228.29 g/mol
Melting point 155°C
Boiling point 360°C Decomposes.
Vapour pressure 5.3×10⁻⁹ kPa at 25°C
Water solubility 300 mg/l at room temperature
log Kow 3.4
Henry’s law constant 4.03×10⁻⁶ Pa m3/mol at 25°C
Koc 715 l/kg

D85 © Wood Environment & Infrastructure Solutions UK Limited
February 2019
Doc Ref. 40039CL003i3
Property Value Comment
BCF 67 l/kg (fish)
7.9 kg/kg (earthworms)
Note: ECHA guidance part R16
recommends a value of 1 l/kg wet wt.
as RHOearthworm. The assessment
uses a value of 7.9 l/kg wet wt. in
EUSES.
Biodegradability Readily biodegradable fulfilling the 10-
day window
Half-life in air 0.2 day
PNECs PNECwater = 1.5 µg/l
PNECsediment = 63 µg/kg dry wt.t
PNECsoil 3.7 mg/kg dry wt
PNECoral = 2.67 mg/kg food
The PNEC for water derived using
species sensitivity distributions. Higher
values are given in the REACH
registration dossier for water and
sediment: PNECwater = 0.018 mg/l,
PNECsediment = 1.2 mg/kg dry wt.t.
DNEL DNELoral for the general population =
0.004 mg/kg bw/day
Value reported is the t-TDI derived
value (from EFSA (2015), also adopted
by RAC (2015) and used in the REACH
registration dossier) in respect of
effects on mammary gland,
reproductive, neurobehavioural,
immune and metabolic systems.
Other relevant data BPA is identified as a SVHC substance
under the REACH Regulation on the
basis of toxicity for reproduction
(Article 57c of REACH) and its
endocrine disrupting properties in
relation to both human health and the
environment (Article 57f of REACH).
Occurrence data set
Table 3.47 presents a summary of the reported concentrations of bisphenol-A in composts and
digestates. This is based on the survey of the available literature collected in Task 2 of the project and
reported in the main project report. It is notable that the data set for concentrations in composts and
digestates is small, but the reason for this is unknown; it may be the case that this contaminant is not
often found.
Table 3.47 Reported occurrence of bisphenol-A in composts and digestates (All values derived from
Bayerisches Landesamt für Umwelt (BayLfU), 2016)
Concentrations in
composts/digestates
Value - units of mg/kg dry
wt. Remarks
Composts - data availability One range result only which is a range for a specific region
(2015, Bavaria)
Compost - minimum
concentration 0.01
Very few values reported and no limit value mentioned.
The range given is <10-170 µg/kg TM.

D86 © Wood Environment & Infrastructure Solutions UK Limited
February 2019
Doc Ref. 40039CL003i3
Concentrations in
composts/digestates
Value - units of mg/kg dry
wt. Remarks
Compost - mid-range or
average concentration 0.085
It is not possible to be sure if the range mentioned is
representative. The mid-range value is therefore set as
0.5* the maximum value of the reported range.
Compost - maximum
concentration 0.17 The maximum value of the reported range.
Digestates - data availability Two range results only which are ranges and relate to a
specific region (2015, Bavaria)
Digestate - minimum
concentration 0.01
The ranges reported are <10-1000 µg/kg and <10-390
µg/kg TM.
Digestate - mid-range or
average concentration 0.39
It is not possible to be sure if the range mentioned is
representative. The mid-range value is set as the upper
range limit from the two reported ranges.
Digestate - maximum
concentration 1 The maximum value reported (upper limit of higher range)
These concentrations in compost and in digestate equate to the following release amounts at the
regional and continental scale.
Table 3.48 Estimated regional and continental release amounts
Parameter Value
Mass of substance in EU-28 in compost (kg/year) 750
Mass of substance in EU-28 in digestate (kg/year) 13,759
Total regional emission to surface water (kg/day) 0.11
Total regional emission to soil (kg/day) 3.9
Total continental emission to surface water (kg/day) 1.0
Total continental emission to agricultural soil (kg/day) 35
Consultation and literature research suggests contamination rates of BPA in the range <10-1000 µg/kg
in digestate and <10-170 µg/kg in compost.
These values have been applied in estimating the exposure concentrations for this substance arising
from use of composts and digestates. Exposures have been estimated for two concentration scenarios.
These scenarios are particularly useful to provide information about sensitivity in view that little
evidence is available on concentrations:
A more conservative assessment is derived using the maximum reported concentrations
in estimating the local releases from the two scenarios, with a mid-range concentration
used in estimating the regional background.
A less conservative assessment is derived separately using the mid-range reported
concentrations in estimating the local releases from the two scenarios, with a minimum
concentration used in estimating the regional background.

D87 © Wood Environment & Infrastructure Solutions UK Limited
February 2019
Doc Ref. 40039CL003i3
Table 3.49 below summarises background exposure data compiled as part of the ESR risk assessment
(EC, 2010b).
The EC (2010b) gives the following concentrations to represent the regional background (PECregional).
Modelled values relate to the industrial use pattern as assessed at the time in 2010 using EUSES. It
should be noted that these regional concentrations are likely to reflect the past use of BPA rather than
the current use36.
Table 3.49 Reported background concentrations of bisphenol-A in the environment
PECregional Value Remarks
Surface water
32 ng/l (modelled)
10 ng/l (median, measured)
42 ng/l (75%ile, measured)
PECregional modelled as part of the EU risk assessment
(ESR, EC 2010b). Median value from the whole freshwater
measured data set is reported as 10 ng/l, 75%ile value
from the data set as 42 ng/l.
Sediment
0.52 μg/kg wet wt. (modelled)
10-20 μg/kg wet wt. (25-50
ng/g dwt) (mid-range
measured)
PECregional modelled as part of the EU risk assessment
(ESR, EC 2010). The RAR reports that "the highest of the
95%iles from the measured values are higher than
calculated. The higher calculated values are similar to the
middle of the range of measured levels, 10-20 μg/kg wet
wt. (25-50 ng/g dwt)."
Agricultural soil 0.07 μg/kg wet wt. (modelled) PECregional modelled as part of the EU risk assessment
(ESR, EC 2010). No measured data reported.
Generic exposure scenario outcomes
The assessment has estimated local and background exposures of bisphenol-A resulting from the use
scenarios defined in Section 1, using the chemical property data and concentration in composts and
digestates in the previous sections as inputs. The predicted environmental exposure concentrations are
as summarised in Table 3.50 below.
Table 3.50 Predicted exposures for bisphenol-A arising from use of composts and digestates
Scenario I Units
PECagricultural soil 1.20E-03 [mg/kg dry wt.]
PECgrassland soil 1.56E-04 [mg/kg dry wt.]
PEC in groundwater 2.72E-05 [mg/l]
PECfreshwater 2.28E-06 [mg/l]
PECfreshwater-sediment 1.71E-04 [mg/kg dry wt.]
Humans via the environment: local total daily intake 7.34E-06 [mg.kg-1.d-1]
36BPA has since been added to the candidate list of substances of very high concern for authorisation. In addition, some uses of
BPA are subject to restrictions under Annex XVII of REACH. This means that the use pattern of BPA may have changed markedly
since the EC (2010) risk assessment was carried out.

D88 © Wood Environment & Infrastructure Solutions UK Limited
February 2019
Doc Ref. 40039CL003i3
Scenario I Units
Humans via the environment: daily dose via
drinking water 7.78E-07 [mg.kg-1.d-1]
Humans via the environment: dominant exposure
source and fraction Root Crops 51.3%
Secondary poisoning – freshwater fish-eating birds
and mammals 9.39E-05 [mg/kg wet wt.]
Secondary poisoning – worm-eating birds and
mammals 1.21E-04 [mg.kg-1]
Scenario II Units
PECagricultural soil 5.61E-02 [mg/kg dry wt.]
Humans via the environment: local total daily intake 9.01E-04 [mg.kg-1.d-1]
Humans via the environment: dominant exposure
source and fraction Root Crops 59.6%
Secondary poisoning – worm-eating birds and
mammals 1.63E-02 [mg.kg-1]
Table 3.51 presents the predicted steady state mass balance in the region and continent. Please note
that the steady state predicted by the model are the amounts and distribution at the regional and
continental scale arising from the C/D use application pathway only. Adding in the release of the same
substances via other pathways (air and waste water) could lead to a different steady state balance.
Table 3.51 Predicted background exposures for bisphenol-A at steady state arising from use of
composts and digestates
Steady state mass Units
Total steady-state mass (region + continent) 1.69E+00 [t]
Steady-state mass in regional freshwater (kg) 1.90E+00 [kg]
Steady-state mass in regional seawater (kg) 1.96E-01 [kg]
Steady-state mass in regional air (kg) 3.25E-09 [kg]
Steady-state mass in regional agricultural soil (kg) 1.65E+02 [kg]
Steady-state mass in regional natural soil (kg) 3.32E-05 [kg]
Steady-state mass in regional industrial soil (kg) 1.23E-05 [kg]
Steady-state mass in regional freshwater sediment (kg) 3.54E-01 [kg]

D89 © Wood Environment & Infrastructure Solutions UK Limited
February 2019
Doc Ref. 40039CL003i3
Steady state mass Units
Steady-state mass in regional seawater sediment (kg) 8.69E-03 [kg]
Steady-state mass in continental freshwater (kg) 2.22E+01 [kg]
Steady-state mass in continental seawater (kg) 1.00E+01 [kg]
Steady-state mass in continental air (kg) 2.98E-08 [kg]
Steady-state mass in continental agricultural soil (kg) 1.49E+03 [kg]
Steady-state mass in continental natural soil (kg) 1.54E-04 [kg]
Steady-state mass in continental industrial soil (kg) 5.70E-05 [kg]
Steady-state mass in continental freshwater sediment (kg) 4.13E+00 [kg]
Steady-state mass in continental seawater sediment (kg) 2.22E-02 [kg]
Steady state mass
fraction Units
Total steady-state mass fraction (region + continent) 9.98E+01 [%]
Steady-state mass fraction in regional freshwater (%) 1.12E-01 [%]
Steady-state mass fraction in regional seawater (%) 1.16E-02 [%]
Steady-state mass fraction in regional air (%) 1.92E-10 [%]
Steady-state mass fraction in regional agricultural soil (%) 9.74E+00 [%]
Steady-state mass fraction in regional natural soil (%) 1.96E-06 [%]
Steady-state mass fraction in regional industrial soil (%) 7.24E-07 [%]
Steady-state mass fraction in regional freshwater sediment (%) 2.08E-02 [%]
Steady-state mass fraction in regional seawater sediment (%) 5.11E-04 [%]
Steady-state mass in continental freshwater (kg) 1.31E+00 [%]
Steady-state mass in continental seawater (kg) 5.91E-01 [%]
Steady-state mass in continental air (kg) 1.76E-09 [%]
Steady-state mass in continental agricultural soil (kg) 8.78E+01 [%]
Steady-state mass in continental natural soil (kg) 9.06E-06 [%]
Steady-state mass in continental industrial soil (kg) 3.35E-06 [%]
Steady-state mass in continental freshwater sediment (kg) 2.43E-01 [%]

D90 © Wood Environment & Infrastructure Solutions UK Limited
February 2019
Doc Ref. 40039CL003i3
Steady state mass Units
Steady-state mass in continental seawater sediment (kg) 1.31E-03 [%]
Sensitivity to specific variables
In respect of local Scenario II, the sensitivity of the outcomes to possible losses from the system by
leaching and drainage of excess water has been explored using a fugacity method. For this substance
the proportion of substance in the system distributed to the interstitial water at equilibrium under
‘high water content’ conditions, and hence sensitive to leaching, is 3.7% of the substance present in
the system. Hence, the sensitivity of the exposure scenario to such variations in water management is
considered to be low.
Summary of findings
Table 3.52 below presents the summary of key findings from the risk assessment of bisphenol-A that
has been made in this project. The findings are discussed further below the table.
Table 3.52 Summary of key findings for exposure of bisphenol-A via use of compost and digestates
Key findings of the risk assessment of bisphenol-A in contaminated composts and digestates
Overall range of compost and digestate concentrations Very limited data, all for one specific sampled region (2015,
Bavaria) <0.01 - 1 mg/kg dry wt.
Major raw material sources renewable raw materials, or not stated
Safe limit concentration in compost and digestate Not applicable (risk characterisation ratio not definable).
Main concern(s) arising Reprotoxin and endocrine disruptor (SVHC)
Effects considered in the main concern hazard(s) SVHC (reproduction; endocrine disrupting in relation to both
human health and the environment)
DNELoral for the general population available in respect of
effects on mammary gland, reproductive, neurobehavioural,
immune and metabolic systems.
PNECs are available derived using species sensitivity
distributions.
Quantitative risk characterisation has not been attempted in
this study.
Uncertainties and their implications Very limited data set of concentrations in composts /
digestates means release amounts could be under- or over-
estimated in this model.
Sensitivity of exposures to variations in water management in
the local container growing scenario is low. In circumstances
where a) the system is watered in excess of the water holding
capacity of the growing medium and b) where the container
design means that excess water will drain away and not
remain in contact with the container/growing medium, then
a small proportion of the substance could be lost from the
system in the drained water.
Other remarks None
Bisphenol A is an SVHC (toxic for reproduction with endocrine disrupting properties in respect of both
the environment and human health) and in view of these hazardous properties, quantitative risk

D91 © Wood Environment & Infrastructure Solutions UK Limited
February 2019
Doc Ref. 40039CL003i3
characterisation has not been attempted in this study. However, it is noted that the predicted local
total daily intake for humans does not exceed the DNEL used by EFSA and RAC, and the PNECs
adopted in the 2010 ESR risk assessment (EC, 2010b) are not exceeded. The highest contribution(s) to
human exposure via the environment arising from the application of C/D is mainly associated with
dietary consumption of root vegetables.
The regional scale predicted environmental concentration (PEC) in agricultural soil arising from the
application of C/D is well below the background concentration arising from the industrial life cycle,
calculated in the ESR risk assessment.
At steady state, >99% of the total mass remains within the region + continent37, of which the
significant majority remains within soil. This suggests there is low mobility and little potential for
transfer over long distances following release via the handling and application of C/D. The total mass
in the region + continent at steady state is however relatively low, less than 2 t in total even when a
conservative concentration in the compost/digestate is assumed. This steady-state mass amounts to a
small fraction (~0.1) of the mass released annually via application of composts and digestates38,
suggesting that long-term gradual accumulation is not anticipated from exposure via this source.
3.9 Di(2-ethylhexyl)phthalate (DEHP)
Background information and remarks
DEHP (Bis(2-ethylhexyl) phthalate, CAS 117-81-7) has been used as a plastics additive with the
potential for exposure from numerous industrial and wide-dispersed uses largely relating to plastics,
articles and medical devices.
DEHP has been subject to a comprehensive EU risk assessment (EC, 2008b) and has been reviewed by
the member state committee (ECHA, 2014a) in respect of equivalent concern based on endocrine
disrupting properties. The substance property data used in this assessment has been taken mainly
from those prior assessment documents.
Chemical properties and hazards data set
DEHP has been identified as an SVHC substance under the REACH Regulation on the basis of it being
toxic for reproduction (Article 57c of REACH) and its endocrine disrupting properties in relation to both
human health and the environment (Article 57f of REACH); requiring Authorisation (Annex XIV) under
REACH, Restrictions in REACH (Annex XVII).
Harmonised classification and labelling applies in the EU under CLP (Repr. 1b – H360FD); some CLP
notifiers also self-classify for the environment. PNECs and DNELs are available from existing published
assessments.
The key property information from ECHA (2014a) or EC (2008b) needed for the modelling is
summarised in Table 3.53. Where information from other sources is included this is indicated in the
Table.
37 This refers to the regional and continental spatial scales in the EUSES model. Refer to Section 1.7 and the Annex for further
information. 38 Please note this is not to be interpreted as how much time elapses to reach steady state; the steady state predicted by the
model are the amounts and distribution at the regional and continental scale arising from the compost and digestate use
application pathway only. Adding in the release of the same substances via other pathways (air and waste water) could lead to a
different steady state picture.

D92 © Wood Environment & Infrastructure Solutions UK Limited
February 2019
Doc Ref. 40039CL003i3
Table 3.53 Property information for DEHP (from ECHA (2014a) unless otherwise indicated)
Property Value Comment
Molecular weight 390.6 g/mol
Melting point -50°C
Boiling point 385°C
Vapour pressure 3.4×10⁻⁵ Pa at 20°C
Water solubility 3 µg/l at c.a. 20°C
log Kow 7.5 A value of 7 (the maximum
recommended) was used in the EUSES
calculations carried out in EC (2008b).
Henry’s law constant 4.43 Pa m3/mol at 20°C
Koc 165,000 l/kg
BCF 840 l/kg (fish)
2700 l/kg (invertebrates)
1 kg/kg (earthworms)
Note: ECHA guidance part R16
recommends a value of 1 l/kgwwt as
RHOearthworm. Therefore a value of 1
l/kg wet wt. is used in EUSES.
Biodegradability Readily biodegradable fulfilling the 10-
day window; 50d half life in surface
water at 12C; 300 d half life in soil at
12C
Half-life for mineralisation in soil
estimated in EC (2008b) to be around
300 days at 10°C. For surface water the
half-life was set to 50 days and for
sediment the half-life was set to 3,000
days.
Half-life in air 1 day
PNECs PNECwater cannot be derived.
PNECsediment >100 mg/kg dry wt.t
PNECsoil >13 mg/kg dry wt
PNECoral = 3.3 mg/kg food
The same values are given in the
REACH registration dossier.
An annual average EQS of 1.3 µg/l is
applicable (Directive 2008/105/EC as
amended (2013/39/EU)) for inland
surface waters. No MAC EQS is defined.
DNEL DNELoral for the general population =
0.048 mg/kg bw/day (ECHA/Danish
EPA, 2016)
DNELoral (internal dose) for the general
population =0.034 mg/kg bw/day (RAC
No DNEL derived in EC (2008b). This
value is taken from Table 6 of
ECHA/Danish EPA (2016). The REACH
registration dossier uses a value of 3.6
kg bw/d.
Other relevant data Kplant-water = 1,940 m3/m3
Occurrence data set
Table 3.54 presents a summary of the reported concentrations of DEHP in composts and digestates.
This is based on the survey of the available literature collected in Task 2 of the project and reported in
the main project report.

D93 © Wood Environment & Infrastructure Solutions UK Limited
February 2019
Doc Ref. 40039CL003i3
Table 3.54 Reported occurrence of DEHP in composts and digestates
Concentrations in
composts/digestates
Value - units of mg/kg dry
wt. Remarks
Composts - data
availability
Data available for two locations (Finland, Kapanen et al 2013
and Germany, Bay LfU 2015).
Compost - minimum
concentration 0.6
lowest value overall (bottom of a range reported for German
composts)
Compost - mid-range
or average
concentration
16 Concentration reported in compost after 1 year, representing a
conservative mid-range value.
Compost - maximum
concentration 38
Highest value overall for composts (derived municipal sewage
sludge after 3 months composting)
Digestates - data
availability
Data available for several locations (Finland, Kapanen et al 2013,
Germany, Bay LfU 2015, Norway, Govasmark et al 2011, and
from EU data reported by Saveyn and Eder). The range of values
covers about 2 orders of magnitude.
Digestate - minimum
concentration 2
1.9 mg/kg dry wt. reported as bottom of range in two German
digestates.
Digestate - mid-range
or average
concentration
40
An average has been calculated to be approximately 40 mg/kg
dry wt., although several of the reported values are already
stated to be averages.
Digestate - maximum
concentration 140
140 is the highest mentioned figure overall, for a liquid
digestate product in the Norway 2011 data set. This is actually
reportedly an average value. A second value of 100 mg/kg is
also available from the Finland 2013 data set. It is notable that
regulatory limit values are applicable for BE (AGW du
14/06/2001 favorisant la valorisation de certains déchets (BE)),
DK (Slambekendtgørelsen) and Norway (Forskrift om organisk
gjødsel; Mattilsynet, 2005), 50 mg/kg dry wt. in each case. Both
the Finland and Norway data sets include values in excess of 50
mg/kg dry wt..
These concentrations in compost and in digestate equate to the following release amounts at the
regional and continental scale.
Table 3.55 Estimated regional and continental release amounts
Parameter Value
Mass of substance in EU-28 in compost (kg/year) 141,120
Mass of substance in EU-28 in digestate (kg/year) 1,411,200
Total regional emission to surface water (kg/day) 12
Total regional emission to soil (kg/day) 413
Total continental emission to surface water (kg/day) 107
Total continental emission to agricultural soil (kg/day) 3,720
Consultation and literature research has indicated that DEHP has been detected in a range of
composts and digestates. The reported concentrations typically lie in the range 1-100 mg/kg dry wt.
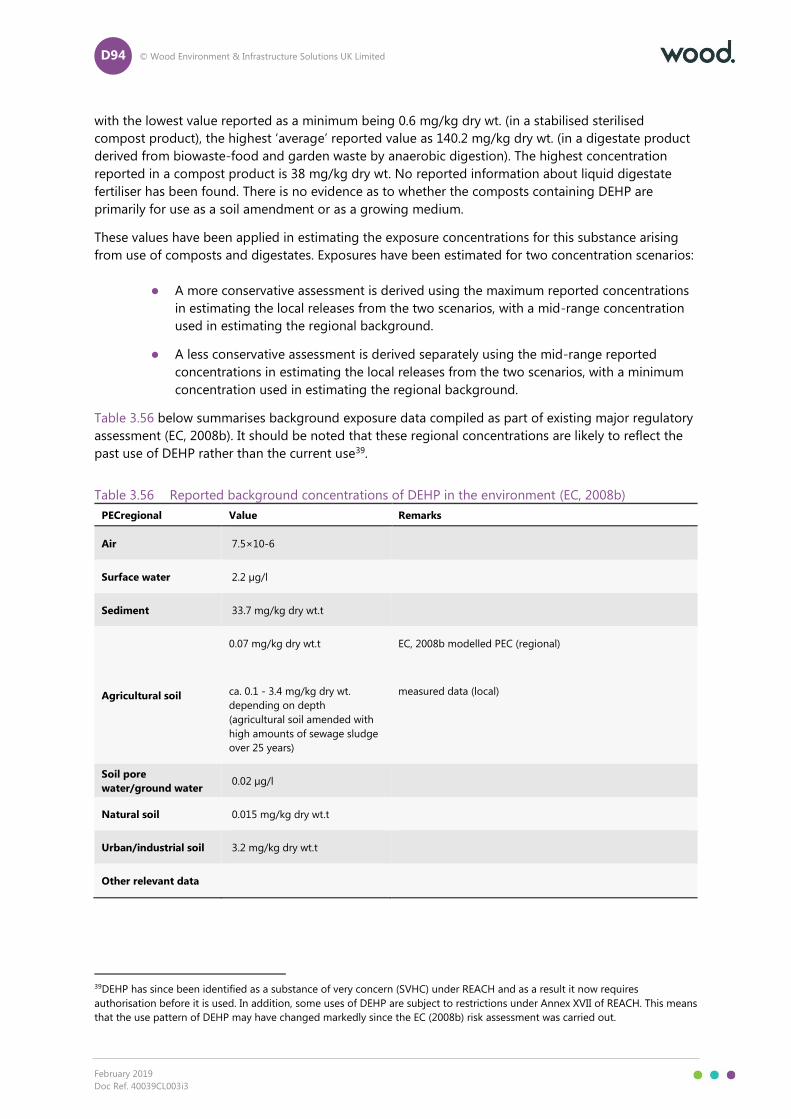
D94 © Wood Environment & Infrastructure Solutions UK Limited
February 2019
Doc Ref. 40039CL003i3
with the lowest value reported as a minimum being 0.6 mg/kg dry wt. (in a stabilised sterilised
compost product), the highest ‘average’ reported value as 140.2 mg/kg dry wt. (in a digestate product
derived from biowaste-food and garden waste by anaerobic digestion). The highest concentration
reported in a compost product is 38 mg/kg dry wt. No reported information about liquid digestate
fertiliser has been found. There is no evidence as to whether the composts containing DEHP are
primarily for use as a soil amendment or as a growing medium.
These values have been applied in estimating the exposure concentrations for this substance arising
from use of composts and digestates. Exposures have been estimated for two concentration scenarios:
A more conservative assessment is derived using the maximum reported concentrations
in estimating the local releases from the two scenarios, with a mid-range concentration
used in estimating the regional background.
A less conservative assessment is derived separately using the mid-range reported
concentrations in estimating the local releases from the two scenarios, with a minimum
concentration used in estimating the regional background.
Table 3.56 below summarises background exposure data compiled as part of existing major regulatory
assessment (EC, 2008b). It should be noted that these regional concentrations are likely to reflect the
past use of DEHP rather than the current use39.
Table 3.56 Reported background concentrations of DEHP in the environment (EC, 2008b)
PECregional Value Remarks
Air 7.5×10⁻⁶
Surface water 2.2 µg/l
Sediment 33.7 mg/kg dry wt.t
Agricultural soil
0.07 mg/kg dry wt.t
ca. 0.1 - 3.4 mg/kg dry wt.
depending on depth
(agricultural soil amended with
high amounts of sewage sludge
over 25 years)
EC, 2008b modelled PEC (regional)
measured data (local)
Soil pore
water/ground water 0.02 µg/l
Natural soil 0.015 mg/kg dry wt.t
Urban/industrial soil 3.2 mg/kg dry wt.t
Other relevant data
39DEHP has since been identified as a substance of very concern (SVHC) under REACH and as a result it now requires
authorisation before it is used. In addition, some uses of DEHP are subject to restrictions under Annex XVII of REACH. This means
that the use pattern of DEHP may have changed markedly since the EC (2008b) risk assessment was carried out.

D95 © Wood Environment & Infrastructure Solutions UK Limited
February 2019
Doc Ref. 40039CL003i3
Generic exposure scenario outcomes
The assessment has estimated local and background exposures of DEHP resulting from the use
scenarios defined in Section 1, using the chemical property data and concentration in composts and
digestates in the previous sections as inputs. The predicted environmental exposure concentrations are
as summarised in Table 3.57 below.
Table 3.57 Predicted exposures for DEHP arising from use of composts and digestates
Scenario I Units
PECagricultural soil 3.88E-01 [mg/kg dry wt.]
PECgrassland soil 1.28E-01 [mg/kg dry wt.]
PEC in groundwater 9.90E-05 [mg/l]
PECfreshwater 2.24E-04 [mg/l]
PECfreshwater-sediment 3.69E+00 [mg/kg dry wt.]
Humans via the environment: local total daily intake 1.85E-03 [mg.kg-1.d-1]
Humans via the environment: daily dose via drinking water 2.83E-06 [mg.kg-1.d-1]
Humans via the environment: dominant exposure source
and fraction Root Crops 81.3%
Secondary poisoning – freshwater fish-eating birds and
mammals 1.05E-01 [mg/kg wet wt.]
Secondary poisoning – worm-eating birds and mammals 1.58E-02 [mg.kg-1]
Scenario II Units
PECagricultural soil 1.25E+01 [mg/kg dry wt.]
Humans via the environment: local total daily intake 5.76E-02 [mg.kg-1.d-1]
Humans via the environment: dominant exposure source
and fraction Root Crops 99.9%
Secondary poisoning – worm-eating birds and mammals 5.64E-01 [mg.kg-1]
Regional background Units
Regional PEC in surface water (total) 3.40E-05 [mg/l]
Regional PEC in air (total) 1.94E-07 [mg.m-3]
Regional PEC in agricultural soil
(total) 2.13E-02 [mg/kg wet wt.]
Regional PEC in pore water of
agricultural soils 7.32E-06 [mg/l]
Regional PEC in natural soil (total) 3.53E-04 [mg/kg wet wt.]

D96 © Wood Environment & Infrastructure Solutions UK Limited
February 2019
Doc Ref. 40039CL003i3
Regional PEC in industrial soil (total) 3.53E-04 [mg/kg wet wt.]
Regional PEC in sediment (total) 1.93E-01 [mg/kg wet wt.]
Table 3.58 presents the predicted steady state mass balance in the region and continent. Please note
that the steady state predicted by the model are the amounts and distribution at the regional and
continental scale arising from the C/D use application pathway only. Adding in the release of the same
substances via other pathways (air and waste water) could lead to a different steady state balance.
Table 3.58 Predicted background exposures for DEHP at steady state arising from use of composts
and digestates
Steady state mass Units
Total steady-state mass (region + continent) 1.85E+03 [t]
Steady-state mass in regional freshwater (kg) 1.23E+02 [kg]
Steady-state mass in regional seawater (kg) 1.20E+01 [kg]
Steady-state mass in regional air (kg) 7.83E+00 [kg]
Steady-state mass in regional agricultural soil (kg) 1.74E+05 [kg]
Steady-state mass in regional natural soil (kg) 3.24E+02 [kg]
Steady-state mass in regional industrial soil (kg) 1.20E+02 [kg]
Steady-state mass in regional freshwater sediment
(kg) 8.00E+03 [kg]
Steady-state mass in regional seawater sediment (kg) 2.64E+02 [kg]
Steady-state mass in continental freshwater (kg) 1.32E+03 [kg]
Steady-state mass in continental seawater (kg) 2.44E+03 [kg]
Steady-state mass in continental air (kg) 1.55E+02 [kg]
Steady-state mass in continental agricultural soil (kg) 1.57E+06 [kg]
Steady-state mass in continental natural soil (kg) 3.25E+03 [kg]
Steady-state mass in continental industrial soil (kg) 1.20E+03 [kg]
Steady-state mass in continental freshwater sediment
(kg) 8.62E+04 [kg]
Steady-state mass in continental seawater sediment
(kg) 2.68E+03 [kg]
Steady state mass fraction Units
Total steady-state mass fraction (region + continent) 9.98E+01 [%]

D97 © Wood Environment & Infrastructure Solutions UK Limited
February 2019
Doc Ref. 40039CL003i3
Steady-state mass fraction in regional freshwater (%) 6.63E-03 [%]
Steady-state mass fraction in regional seawater (%) 6.49E-04 [%]
Steady-state mass fraction in regional air (%) 4.23E-04 [%]
Steady-state mass fraction in regional agricultural soil
(%) 9.40E+00 [%]
Steady-state mass fraction in regional natural soil (%) 1.75E-02 [%]
Steady-state mass fraction in regional industrial soil
(%) 6.50E-03 [%]
Steady-state mass fraction in regional freshwater
sediment (%) 4.32E-01 [%]
Steady-state mass fraction in regional seawater
sediment (%) 1.43E-02 [%]
Steady-state mass in continental freshwater (kg) 7.15E-02 [%]
Steady-state mass in continental seawater (kg) 1.32E-01 [%]
Steady-state mass in continental air (kg) 8.40E-03 [%]
Steady-state mass in continental agricultural soil (kg) 8.47E+01 [%]
Steady-state mass in continental natural soil (kg) 1.76E-01 [%]
Steady-state mass in continental industrial soil (kg) 6.51E-02 [%]
Steady-state mass in continental freshwater sediment
(kg) 4.66E+00 [%]
Steady-state mass in continental seawater sediment
(kg) 1.45E-01 [%]
Sensitivity to specific variables
In respect of local Scenario II, the sensitivity of the outcomes to possible losses from the system by
leaching and drainage of excess water has been explored using a fugacity method. For this substance
the proportion of substance in the system distributed to the interstitial water at equilibrium under
‘high water content’ conditions, and hence sensitive to leaching, is ≤1% of the substance present in the
system. Hence, the sensitivity of the exposure scenario to such variations in water management is
considered to be low.
Summary of findings
Table 3.59 below presents the summary of key findings from the risk assessment of DEHP that has
been made in this project. The findings are discussed further below the table.
Table 3.59 Summary of key findings for exposure of DEHP via use of compost and digestates
Key findings of the risk assessment of DEHP in contaminated composts and digestates
Overall range of compost and digestate concentrations 0.6-140 mg/kg dry wt. (or higher; the upper limit value is
reportedly an average)

D98 © Wood Environment & Infrastructure Solutions UK Limited
February 2019
Doc Ref. 40039CL003i3
Key findings of the risk assessment of DEHP in contaminated composts and digestates
Major raw material sources High concentrations associated with digestates prepared
from biowaste-food and garden waste (Norway), and
municipal sewage sludge from wastewater treatment plants
(Finland)
Safe limit concentration in compost and digestate Not applicable (risk characterisation ratio not definable).
Main concern(s) arising Humans via dietary exposure (container growing);
High cumulative loads at steady state;
Absolute concentrations in compost/digestate exceeding
existing local limit values / guide values
Local PEC in freshwater (local scenario I) exceeds annual
average EQS (Directive 2008/105/EC as amended
(2013/39/EU)) (though regional background PEC does not)
Effects considered in the main concern hazard(s) SVHC (toxic for reproduction, endocrine disrupting in relation
to both human health and environment). Basis of the EQS
(AA-QS) is not stated in the Directive but is understood to
relate to secondary poisoning of predators40.
Uncertainties and their implications Concentrations in composts and digestates have high
variability – local PECs would similarly be variable and could
be still higher than modelled here.
Sensitivity of exposures to variations in water management in
the local container growing scenario is low.
Other remarks Measured concentration in sludge-amended soil support the
local estimated concentration.
The highest reported occurrence values in digestate exceed a national limit value of 50 mg/kg
digestate d.w. applicable (or relevant as a guide value) in several European countries. This in itself
indicates a potential issue. These high occurrence concentrations were reported in digestates prepared
from biowaste-food and garden waste (Norway), and municipal sewage sludge from wastewater
treatment plants (Finland).
As an SVHC (toxic for reproduction with endocrine disrupting properties for environment and human
health), risk characterisation has not been quantified. However, it is noted that the local total daily
intake for humans associated with local scenario II slightly exceed the DNELoral for general population
defined by ECHA/Danish EPA (2016). Additionally, the predicted exposures in soil in local scenario II
are approaching the PNEC value defined by EC (2008b).
The estimated regional exposures in agricultural soils and grassland arising from the application of C/D
are below the estimated background PECs derived from the EC (2008b) ESR risk assessment based on
the industrial life cycle. The estimated local exposures in agricultural soils from Scenario I is within the
range measured for a sludge-fertilised agricultural soil.
The highest contribution to human exposure via the environment arising from the use of C/D in either
scenario is mainly associated with dietary consumption of root vegetables.
40 EQS Substance Data Sheet (2005) available online at https://circabc.europa.eu/sd/a/337d62ba-6a8f-49ce-9c0e-
591bb248e560/12_DEHP_EQS_Final%20Data%20Sheet.pdf

D99 © Wood Environment & Infrastructure Solutions UK Limited
February 2019
Doc Ref. 40039CL003i3
At steady state, >99% of the total mass remains within the region + continent41, with the vast majority
of substance remaining in the agricultural soil. This suggests there is low potential for transfer over
long distances following release via the handling and application of C/D.
The total mass in the region + continent at steady state is very high (>1000 t) based on the more
conservative interpretation of the available concentration data, and still significant (90 t) even when
releases are based on a less conservative, relatively low concentration of DEHP in compost/digestate.
This steady-state mass amounts to 1.2 times the mass released annually via application of composts
and digestates42, suggesting that long-term gradual accumulation is not anticipated from exposure via
this source.
3.10 17α-Ethinylestradiol
Background information and remarks
17α-Ethinylestradiol (EC no 200-342-2, CAS no 57-63-6) is a human pharmaceutical used for its
estrogenic properties. It was nominated as a priority substance under the WFD 2000/60/EC and at
present is on a water quality ‘watch list’. A precedent regulatory risk assessment for the environment
was conducted by RIVM (2011).
Chemical properties and hazards data set
The chemical property inputs used in the present assessment are based on those applied by RIVM
(2011) in its environmental risk assessment. This assessment did not include secondary poisoning or
humans via the environment. Table 3.60 below summarises the data used, as used in RIVM, 2011 risk
assessment unless otherwise stated in the table.
Table 3.60 Property information for 17α-ethinylestradiol
Property Value Remarks
Molecular
weight 296.4
HSDB data set citing Lide, D.R. CRC Handbook of
Chemistry and Physics 88TH Edition 2007-2008. CRC
Press, Taylor & Francis, Boca Raton, FL 2007, p.3-
234
Melting point 142-146 °C. May also exist in a polymorphic
modification with mp 180-186 °C
HSDB data set citing Lewis, R.J. Sr.; Hawley's Condensed
Chemical Dictionary 15th Edition. John Wiley &
Sons, Inc. New York, NY 2007., p. 515
Boiling point
Vapour pressure
2.6E-07 Pa at 25C used by RIVM (2011 risk
assessment of 18 pharmaceuticals); no
source stated; thought to be equivalent to
the EPI value.
1.9X10⁻⁹ mm Hg at 25 °C
the HSDB value is estimated and is equivalent to 2.53E-
07 Pa
41 This refers to the regional and continental spatial scales in the EUSES model. Refer to Section 1.7 and the Annex for further
information. 42 Please note this is not to be interpreted as how much time elapses to reach steady state; the steady state predicted by the
model are the amounts and distribution at the regional and continental scale arising from the compost and digestate use
application pathway only. Adding in the release of the same substances via other pathways (air and waste water) could lead to a
different steady state picture.

D100 © Wood Environment & Infrastructure Solutions UK Limited
February 2019
Doc Ref. 40039CL003i3
Property Value Remarks
Water solubility
11.3 mg/l used by RIVM (2011) - citing an EPI
experimental database match.
Insoluble in water. (PIM, IPCS, 1997, Section
3.3.3)
In double-distilled water, 4.83 mg/L
In water, 11.3 mg/L at 27 °C
11.3 mg/l at 27°C used in EUSES
HSDB data set citing Tabak HH et al; Dev Ind Microbiol
22: 497-519 (1981)
HSDB data set citing Yalkowsky, S.H., He, Yan.,
Handbook of Aqueous Solubility Data: An Extensive
Compilation of Aqueous Solubility Data for Organic
Compounds Extracted from the AQUASOL dATAbASE.
CRC Press LLC, Boca Raton, FL. 2003., p. 1158
log Kow 3.67 (same value used by RIVM in the 2011
risk assessment)
The same value appears in the HSDB data set citing
Hansch, C., Leo, A., D. Hoekman. Exploring QSAR -
Hydrophobic, Electronic, and Steric Constants.
Washington, DC: American Chemical Society., 1995., p.
168
Henry’s law
constant 7.94X10⁻¹² atm-cu m/mol at 25 °C (est)
HSDB data set citing US EPA; Estimation Program
Interface (EPI) Suite. Ver. 4.1. Jan, 2010. Available from,
as of Feb 9, 2011:
http://www.epa.gov/oppt/exposure/pubs/episuitedl.htm
Koc
A value of 4768 was used by RIVM (source
not stated).
A QSAR estimated value of 510 is available
from SRC EPIWIIN.
The origin of this value is unclear however due to the
precedent regulatory use, this value was used in EUSES.
BCF
An estimated BCF of 110 was calculated in
fish for ethinylestradiol(SRC); EUSES derives a
value of 263 from the log Kow.
Biodegradability
Ethinylestradiol has been classified as not
readily biodegradable using a sewage
treatment plant study based in Stockholm,
Sweden.
Biodegradation rates of 1.62 and 148/day of
500 ng/L ethinylestrogen were reported
using batch tests using mixed liquor from an
activated sludge wastewater treatment plant
operating at a 3-day solids retention time
and a membrane bioreactor.
HSDB data set citing Carlsson C et al; Sci Total Environ
364: 67-87 (2006)
HSDB data set citing Gaulke LS et al; Environ Sci Technol
43: 7111-7116 (2009)
Half-life in air
Ethinylestradiol absorbs light at wavelengths
281 nm, and therefore may be susceptible to
direct photolysis by sunlight.
AOP prediction is 125.04E-12 cm3/mol.s.
HSDB data set

D101 © Wood Environment & Infrastructure Solutions UK Limited
February 2019
Doc Ref. 40039CL003i3
Property Value Remarks
Threshold
hazard values if
available
Value Remarks
PNECaquatic
(freshwater) No PNEC is available. No EQS is set.
PNECsediment
(freshwater)
PNECsoil
PNECoral
predator No PNEC is available No biota EQS is set.
DNEL general
population oral
Other relevant
data
The pharmaceutical dosage (in combined
medicines) is between 20 μg to 2 mg/d for
different indications (IPCS 1997 and
Laurenson et al, 2014)); if a bodyweight of 60
kg is assumed for the patient this is
equivalent to between 0.33 μg/kg bw/d to 33
μg/kg bw/d.
Endocrine disruptor
Occurrence data set
Table 3.61 presents a summary of the reported concentrations of 17α-ethinylestradiol in composts and
digestates. This is based on the survey of the available literature collected in Task 2 of the project and
reported in the main project report.
Table 3.61 Reported occurrence of 17α-ethinylestradiol in composts and digestates
Concentrations in
composts/digestates Value - units of mg/kg dry wt. Remarks
Composts - data
availability
Only two entries are available (which are ranges,
but the scope is uncertain).
Compost - minimum
concentration 0.0332
This is the lower of the two minimum values from
the two range results.
Compost - mid-range
or average
concentration
0.08 Average of the reported min and max range values
Compost - maximum
concentration 0.119
Digestates - data
availability
Only one entry is available (which is a range, but the
scope is uncertain).
Digestate - minimum
concentration 0.00824
The bottom of the range is actually <LOD, which is
8.24 µg/kg. This is taken as the minimum value.
Digestate - mid-range
or average
concentration
0.1449 In view of the small amount of data, the mid-range
value is set as 0.3x the top limit of the range.
Digestate - maximum
concentration 0.483

D102 © Wood Environment & Infrastructure Solutions UK Limited
February 2019
Doc Ref. 40039CL003i3
These concentrations in compost and in digestate equate to the following release amounts at the
regional and continental scale.
Table 3.62 Estimated regional and continental release amounts
Parameter Value
Mass of substance in EU-28 in compost (kg/year) 706
Mass of substance in EU-28 in digestate (kg/year) 5112
Total regional emission to surface water (kg/day) 0.045
Total regional emission to soil (kg/day) 1.5
Total continental emission to surface water (kg/day) 0.40
Total continental emission to agricultural soil (kg/day) 14
These values have been applied in estimating the exposure concentrations for this substance arising
from use of composts and digestates. Exposures have been estimated for two concentration scenarios:
A more conservative assessment is derived using the maximum reported concentrations
in estimating the local releases from the two scenarios, with a mid-range concentration
used in estimating the regional background.
A less conservative assessment is derived separately using the mid-range reported
concentrations in estimating the local releases from the two scenarios, with a minimum
concentration used in estimating the regional background.
A full literature search for the latest background data has not been attempted and no pre-existing
regulatory compilation of measured exposure data is known. PECs derived in the RIVM assessment and
in a US published assessment are summarised in Table 3.63 below.
Table 3.63 Reported concentrations of 17α-ethinylestradiol in the environment (RIVM, 2011)
PECregional Value Remarks
Surface water
4.65E-07 mg/l
1E-07 mg/l
Local PEC calculated by RIVM assessment using the
EMA method
99%ile PEC calculated by GREAT-ER (USA) (Laurenson
et al, 2014)
Generic exposure scenario outcomes
The assessment has estimated local and background exposures of 17α-ethinylestradiol resulting from
the use scenarios defined in Section 1, using the chemical property data and concentration in
composts and digestates in the previous sections as inputs. The predicted environmental exposure
concentrations are as summarised in Table 3.64 below.
Table 3.64 Predicted exposures for 17α-ethinylestradiol arising from use of composts and digestates
Scenario I Units
PECagricultural soil 1.36E-03 [mg/kg dry wt.]
PECgrassland soil 4.57E-04 [mg/kg dry wt.]

D103 © Wood Environment & Infrastructure Solutions UK Limited
February 2019
Doc Ref. 40039CL003i3
PEC in groundwater 1.20E-05 [mg/l]
PECfreshwater 1.47E-06 [mg/l]
PECfreshwater-sediment 7.05E-04 [mg/kg dry wt.]
Humans via the environment: local
total daily intake 4.69E-06 [mg.kg-1.d-1]
Humans via the environment: daily
dose via drinking water 3.44E-07 [mg.kg-1.d-1]
Humans via the environment:
dominant exposure source and
fraction
Root Crops 62.9%
Secondary poisoning – freshwater
fish-eating birds and mammals 2.76E-04 [mg/kg wet wt.]
Secondary poisoning – worm-eating
birds and mammals 3.88E-04 [mg.kg-1]
Scenario II Units
PECagricultural soil 3.93E-02 [mg/kg dry wt.]
Humans via the environment: local
total daily intake 1.27E-04 [mg.kg-1.d-1]
Humans via the environment:
dominant exposure source and
fraction
Root Crops 79.3%
Secondary poisoning – worm-eating
birds and mammals 1.23E-02 [mg.kg-1]
Regional background Units
Regional PEC in surface water (total) 6.34E-07 [mg/l]
Regional PEC in air (total) 2.17E-15 [mg.m-3]
Regional PEC in agricultural soil
(total) 8.10E-05 [mg/kg wet wt.]
Regional PEC in pore water of
agricultural soils 9.61E-07 [mg/l]
Regional PEC in natural soil (total) 3.21E-10 [mg/kg wet wt.]
Regional PEC in industrial soil (total) 3.21E-10 [mg/kg wet wt.]
Regional PEC in sediment (total) 1.16E-04 [mg/kg wet wt.]

D104 © Wood Environment & Infrastructure Solutions UK Limited
February 2019
Doc Ref. 40039CL003i3
Table 3.65 presents the predicted steady state mass balance in the region and continent. Please note
that the steady state predicted by the model are the amounts and distribution at the regional and
continental scale arising from the C/D use application pathway only. Adding in the release of the same
substances via other pathways (air and waste water) could lead to a different steady state balance.
Table 3.65 Predicted background exposures for 17α-ethinylestradiol at steady state arising from use
of composts and digestates
Steady state mass Units
Total steady-state mass (region +
continent) 7.39E+00 [t]
Steady-state mass in regional
freshwater (kg) 2.28E+00 [kg]
Steady-state mass in regional
seawater (kg) 2.50E-01 [kg]
Steady-state mass in regional air (kg) 8.76E-08 [kg]
Steady-state mass in regional
agricultural soil (kg) 6.61E+02 [kg]
Steady-state mass in regional natural
soil (kg) 2.95E-04 [kg]
Steady-state mass in regional
industrial soil (kg) 1.09E-04 [kg]
Steady-state mass in regional
freshwater sediment (kg) 4.80E+00 [kg]
Steady-state mass in regional
seawater sediment (kg) 1.37E-01 [kg]
Steady-state mass in continental
freshwater (kg) 4.58E+01 [kg]
Steady-state mass in continental
seawater (kg) 6.12E+02 [kg]
Steady-state mass in continental air
(kg) 9.51E-07 [kg]
Steady-state mass in continental
agricultural soil (kg) 5.95E+03 [kg]
Steady-state mass in continental
natural soil (kg) 1.62E-03 [kg]
Steady-state mass in continental
industrial soil (kg) 5.99E-04 [kg]
Steady-state mass in continental
freshwater sediment (kg) 9.63E+01 [kg]
Steady-state mass in continental
seawater sediment (kg) 1.68E+01 [kg]
Steady state mass fraction Units
Total steady-state mass fraction
(region + continent) 6.40E+00 [%]

D105 © Wood Environment & Infrastructure Solutions UK Limited
February 2019
Doc Ref. 40039CL003i3
Steady state mass fraction Units
Steady-state mass fraction in
regional freshwater (%) 1.98E-03 [%]
Steady-state mass fraction in
regional seawater (%) 2.16E-04 [%]
Steady-state mass fraction in
regional air (%) 7.59E-11 [%]
Steady-state mass fraction in
regional agricultural soil (%) 5.73E-01 [%]
Steady-state mass fraction in
regional natural soil (%) 2.56E-07 [%]
Steady-state mass fraction in
regional industrial soil (%) 9.47E-08 [%]
Steady-state mass fraction in
regional freshwater sediment (%) 4.16E-03 [%]
Steady-state mass fraction in
regional seawater sediment (%) 1.19E-04 [%]
Steady-state mass in continental
freshwater (kg) 3.97E-02 [%]
Steady-state mass in continental
seawater (kg) 5.31E-01 [%]
Steady-state mass in continental air
(kg) 8.24E-10 [%]
Steady-state mass in continental
agricultural soil (kg) 5.15E+00 [%]
Steady-state mass in continental
natural soil (kg) 1.40E-06 [%]
Steady-state mass in continental
industrial soil (kg) 5.19E-07 [%]
Steady-state mass in continental
freshwater sediment (kg) 8.35E-02 [%]
Steady-state mass in continental
seawater sediment (kg) 1.45E-02 [%]
Sensitivity to specific variables
The main sources of uncertainty in the assessment of this substance are:
BCF in fish (value 110 l/kg ± 1 log unit)
Koc (range QSAR value 510 to RIVM 4768 (source uncertain)
Kow (value 3.67 ± 1 log unit)
Water solubility (value 11.3 mg/l ± 1 log unit)
Vapour pressure (value 2.6E-07 Pa ± 1 log unit)

D106 © Wood Environment & Infrastructure Solutions UK Limited
February 2019
Doc Ref. 40039CL003i3
The impact of varying each property within the specified range or within a suitable uncertainty range
was explored independently. Refer to Figure 3.1-Figure 3.5, which illustrate the impact on relevant
predicted exposure concentrations.
Figure 3.1 Sensitivity of selected outputs in the assessment of 17α-ethinylestradiol to the Koc input
value: fresh water sediment
Figure 3.2 Sensitivity of selected outputs in the assessment of 17α-ethinylestradiol to the Koc input
value: diet of worm-eating birds and mammals

D107 © Wood Environment & Infrastructure Solutions UK Limited
February 2019
Doc Ref. 40039CL003i3
Figure 3.3 Sensitivity of selected outputs in the assessment of 17α-ethinylestradiol to the log Kow
input value: diet of worm-eating birds and mammals
Figure 3.4 Sensitivity of selected outputs in the assessment of 17α-ethinylestradiol to the Koc input
value: total daily intake of humans

D108 © Wood Environment & Infrastructure Solutions UK Limited
February 2019
Doc Ref. 40039CL003i3
Figure 3.5 Sensitivity of selected outputs in the assessment of 17α-ethinylestradiol to the BCF input
value: diet of fish-eating birds and mammals
It can be concluded that:
At the Koc value used in the baseline assessment, the PNECsediment arising from the
application to land scenario has been estimated conservatively.
The secondary poisoning exposure of worm-eating birds and mammals and local total
daily intake, arising from use in the container growing scenario, could have been
significantly higher than estimated in the baseline assessment, if the lower value of Koc is
accurate, and/or within a reasonable uncertainty range around the literature log Kow
value.
The secondary poisoning exposure of fish-eating birds and mammals (local scenario I)
could be up to 5x higher within a reasonable uncertainty range around the BCF value,
which is estimated in the absence of data.
In respect of local Scenario II, the sensitivity of the outcomes to possible losses from the system by
leaching and drainage of excess water has been explored using a fugacity method. For this substance
the proportion of substance in the system distributed to the interstitial water at equilibrium under
‘high water content’ conditions, and hence sensitive to leaching, is ≤1% of the substance present in the
system. Hence, the sensitivity of the exposure scenario to such variations in water management is
considered to be low.
Summary of findings
Table 3.66 below presents the summary of key findings from the risk assessment of 17α-
ethinylestradiol that has been made in this project. The findings are discussed further below the table.

D109 © Wood Environment & Infrastructure Solutions UK Limited
February 2019
Doc Ref. 40039CL003i3
Table 3.66 Summary of key findings for exposure of 17α-ethinylestradiol via use of compost and
digestates
Key findings of the risk assessment of 17α-ethinylestradiol in contaminated composts and digestates
Overall range of compost and digestate concentrations <LOD – 0.483 mg/kg dry wt.
Major raw material sources WWTP sewage sludges
Safe limit concentration in compost and digestate Not applicable (risk characterisation ratio not definable).
Main concern(s) arising Endocrine disruptor with unclear safe limit thresholds.
Modelling suggests a possibility of transfer over long
distances.
Effects considered in the main concern hazard(s) No quantitative hazard threshold available.
Uncertainties and their implications Very limited data set of concentrations in composts /
digestates means release amounts could be under- or over-
estimated in this model., Some uncertainties in chemical
property data values which could be significant for predicted
exposures. Threshold values for the environment (EQS) are
not established.
Sensitivity of exposures to variations in water management in
the local container growing scenario is low.
Other remarks None
In view that the substance is an endocrine disruptor with unclear safe limit thresholds, risk
characterisation has not been quantified in this assessment.
Both the BCF and Koc values used in the exposure assessment are associated with some uncertainty.
The sensitivity to these as uncertainty sources has been checked and the local predator exposure
(secondary poisoning) could be higher than estimated here.
The highest contributions to human exposure via the environment arising from the application of C/D
is mainly associated with dietary consumption of root vegetables. The upper limit of possible exposure
from use of C/D in the baseline assessment is only approximately a factor of less than three times
lower than the lower limit of the pharmaceutical dose range in combined medicines; the sensitivity
assessment indicates that exposures could be higher within the uncertainty range of the BCF and Koc
values.
At steady state, only around 6% of the total mass remains within the region + continent43, suggesting
there may be relatively high mobility and potential for transfer over long distances following release
via the handling and application of C/D44. Global scale modelling within EUSES suggests that at the
steady state, the majority of the substance would be found in global tropic waters, (53%), moderate
waters (24%) and arctic waters (16%). In view of the pharmaceutical use, it is noted that the absolute
exposure of aquatic environments arising from the use of C/D containing 17α-ethinylestradiol is likely
to be small compared to the exposure of receiving waters from municipal wastewater treatment plants.
The total mass in the region + continent at steady state is low (approximately 7 t total) even when the
exposure model assumes relatively conservative concentrations in the compost/digestate. This steady-
43 This refers to the regional and continental spatial scales in the EUSES model. Refer to Section 1.7 and the Annex for further
information. 44 The possibility or not for transfer over long distance is largely an inherent property of the substances themselves, but it is
interesting if this is expressed even when the pathway into the environment is so dominated by incorporation into soil.

D110 © Wood Environment & Infrastructure Solutions UK Limited
February 2019
Doc Ref. 40039CL003i3
state mass amounts to 1.3 times the mass released annually via application of composts and
digestates45.
3.11 Hexabromocyclododecane (HBCDD)
Background information and remarks
HBCDD has been used as a flame retardant. HBCDD exists in several isomeric forms having CAS
numbers 3194-55-6, 24637-99-4, 134237-52-8, 134237-50-6, 134237-51-7.
HBCDD has been subject to a comprehensive EU risk assessment (EC, 2008c) and the substance
property data has been taken mainly from that risk assessment. HBCDD occurs in several different
isomeric forms. The assessment has been made for the representative isomer with CAS 25637-99-4.
As HBCDD is a PBT and POP, quantitative risk characterisation ratios have not been derived.
Chemical properties and hazards data set
SVHC (PBT) requiring Authorisation (Annex XIV) under REACH; POP
Harmonised classification and labelling applies in the EU under CLP (Repr. 2 - H361; lact. – H362), all
CLP notifiers also self-classify for the environment. PNECs and DNELs are available from existing
published assessments.
The key property information from EC (2008c) needed for the modelling is summarised in Table 3.67.
Where information from other sources is included this is indicated in the Table.
Table 3.67 Property information for HBCDD (from EC (2008c) unless otherwise indicated)
Property Value Comment
Molecular weight 641.7 g/mol
Melting point 172-184°C
Boiling point >190°C Decomposes.
Vapour pressure 6.3×10⁻⁵ Pa at 21°C
Water solubility 66 µg/l at 20°C
log Kow 5.62
Henry’s law constant 0.75 Pa m3/mol at 20-21°C
Koc 4.57×10⁴ l/kg log Koc = 4.66
BCF 18,100 l/kg (fish)
6 kg/kg (earthworms)
Note: ECHA guidance part R16
recommends a value of 1 l/kgwwt as
45 Please note this is not to be interpreted as how much time elapses to reach steady state; the steady state predicted by the
model are the amounts and distribution at the regional and continental scale arising from the compost and digestate use
application pathway only. Adding in the release of the same substances via other pathways (air and waste water) could lead to a
different steady state picture.

D111 © Wood Environment & Infrastructure Solutions UK Limited
February 2019
Doc Ref. 40039CL003i3
Property Value Comment
RHOearthworm. Therefore the
assessment uses a value of 6 l/kg wet
wt. in EUSES.
Biodegradability Not readily biodegradable EC (2008c) gives the degradation half-
life in soil as 119 days and the
degradation half-life in aerobic and
anaerobic sediment as 2.6-124 days
and 19-190 days respectively (all data
refer to 12°C).
Half-life in air 51 hours
PNECs As a PBT and POP, the reliability of any
threshold no-effect value is highly
uncertain. Risk characterisation has not
been attempted here. However, it is
noted that PNECs have previously been
defined (EC, 2008c)
PNECwater = 0.31 µg/l
PNECsediment = 0.86 mg/kg dry wt.t
PNECsoil = 5.9 mg/kg dry wt
PNECoral = 5 mg/kg food
The REACH registration dossier gives
higher values for sediment, soil and
secondary poisoning: PNECsediment = 10
mg/kg dry wt.t
PNECsoil = 12.8 mg/kg dry wt.t.
PNECoral = 222 mg/kg food
an annual average EQS of 0.0016 µg/l
and MAC EQS of 0.5 µg/l are applicable
for inland surface waters (Directive
2008/105/EC as amended (2013/39/EU)
an EQS for biota of 167 µg/kg wet
weight is applicable (Directive
2008/105/EC as amended (2013/39/EU)
DNEL As a PBT and POP, the reliability of any
threshold no-effect value is highly
uncertain. Risk characterisation has not
been attempted here.
No DNEL derived in EC (2008c). Value
taken from the REACH registration
dossier. DNELoral for the general
population = 0.102 mg/kg bw/day
Other relevant data n/a
The European Commission identifies HBCDD as a SVHC substance under the REACH Regulation on the
basis of it being PBT (Article 57d of REACH). In addition, HBCDD has also been identified as a POP
under the Stockholm Convention (United Nations Environment Program (UNEP), 2010).
Occurrence data set
Table 3.68 presents a summary of the reported concentrations of HBCDD in composts and digestates.
This is based on the survey of the available literature collected in Task 2 of the project and reported in
the main project report. The data availability is limited and the associated uncertainty is explored in the
Sensitivity to specific variables section.
Table 3.68 Reported occurrence of HBCDD in composts and digestates
Concentrations in
composts/digestates
Value - units of mg/kg dry
wt. Remarks
Composts - data
availability
Only one result (a reported range) is available for HBCDD in
composts.
Compost - minimum
concentration 0.00014

D112 © Wood Environment & Infrastructure Solutions UK Limited
February 2019
Doc Ref. 40039CL003i3
Compost - mid-range or
average concentration 3 Mid-range value is the average of the range.
Compost - maximum
concentration 6.1
Digestates - data
availability
Only two results (reported ranges) are available for HBCDD in
composts.
Digestate - minimum
concentration 0.00001
Digestate - mid-range
or average
concentration
0.53 Mid-range value is the average of the two ranges.
Digestate - maximum
concentration 2.1
These concentrations in compost and in digestate equate to the following release amounts at the
regional and continental scale.
Table 3.69 Estimated regional and continental release amounts
Parameter Value
Mass of substance in EU-28 in compost (kg/year) 26,460
Mass of substance in EU-28 in digestate (kg/year) 18,698
Total regional emission to surface water (kg/day) 0.35
Total regional emission to soil (kg/day) 12
Total continental emission to surface water (kg/day) 3.1
Total continental emission to agricultural soil (kg/day) 108
Consultation and literature evidence demonstrates that HBCDD is present in composts and digestates
at concentrations of between <0.01 – 6100 µg/kg dry wt.. Reported levels in digestates are <0.01 to
2100 µg/kg dry wt. but only a few values are available. There is no evidence as to whether the
composts containing HBCDD are primarily for use as a soil amendment or as a growing medium.
These values have been applied in estimating the exposure concentrations for this substance arising
from use of composts and digestates. Exposures have been estimated for two concentration scenarios:
A more conservative assessment is derived using the maximum reported concentrations
in estimating the local releases from the two scenarios, with a mid-range concentration
used in estimating the regional background.
A less conservative assessment is derived separately using the mid-range reported
concentrations in estimating the local releases from the two scenarios, with a minimum
concentration used in estimating the regional background.
Table 3.70 below summarises the background exposure levels estimated as part of the ESR risk
assessment (EC, 2008c).
In light of its status as a POP, there is an international commitment to restrict its use; under REACH an
authorisation applies which is due to expire; hence significant decline in use is to be expected going
forward and the predicted environmental concentrations from use of C/D should be considered in this

D113 © Wood Environment & Infrastructure Solutions UK Limited
February 2019
Doc Ref. 40039CL003i3
context. These restrictions should eliminate new inputs, but there is significant “stock” remaining in
products with potential for environmental release.
The EC ESR risk assessment (2008c) gives the following concentrations to represent the regional
background (PECregional). It should be noted that these regional concentrations are likely to reflect the
past use of HBCDD, rather than the current use, which should be lower46.
Table 3.70 Reported background concentrations of HBCDD in the environment
PECregional Value Remarks
Air 0.025 ng/m3
Surface water 0.028 µg/l
Sediment 85 µg/kg dry wt.t ESR RAR (EC, 2008c) reported that available measured data are
comparable
Agricultural soil 0.23 mg/kg dry wt.t ESR RAR (EC, 2008c) reported only local-scale measured data
available
Soil pore water/ground
water
Natural soil 0.00066 mg/kg dry wt.t
Urban/industrial soil 0.00066 mg/kg dry wt.t
Other relevant data
Generic exposure scenario outcomes
The assessment has estimated local and background exposures of HBCDD resulting from the use
scenarios defined in Section 1, using the chemical property data and concentration in composts and
digestates in the previous sections as inputs. The predicted environmental exposure concentrations are
as summarised in Table 3.71 below.
Table 3.71 Predicted exposures for HBCDD arising from use of composts and digestates
Scenario I Units
PECagricultural soil 1.06E-02 [mg/kg dry wt.]
PECgrassland soil 2.82E-03 [mg/kg dry wt.]
PEC in groundwater 7.77E-06 [mg/l]
PECfreshwater 1.14E-05 [mg/l]
PECfreshwater-sediment 5.20E-02 [mg/kg dry wt.]
Humans via the environment: local total daily intake 4.72E-04 [mg.kg-1.d-1]
46HBCDD has since been identified as a substance of very concern (SVHC) under REACH and as a result it now requires
authorisation before it is used. This means that the use pattern of HBCDD may have changed markedly since the EC (2008c) risk
assessment was carried out.

D114 © Wood Environment & Infrastructure Solutions UK Limited
February 2019
Doc Ref. 40039CL003i3
Humans via the environment: daily dose via drinking water 2.22E-07 [mg.kg-1.d-1]
Humans via the environment: dominant exposure source and fraction Fish 71.7%
Secondary poisoning – freshwater fish-eating birds and mammals 1.16E+00 [mg/kg wet wt.]
Secondary poisoning – worm-eating birds and mammals 3.54E-04 [mg.kg-1]
Scenario II Units
PECagricultural soil 2.01E+00 [mg/kg dry wt.]
Humans via the environment: local total daily intake 3.77E-02 [mg.kg-1.d-1]
Humans via the environment: dominant exposure source and fraction Root Crops 99.8%
Secondary poisoning – worm-eating birds and mammals 9.62E-02 [mg.kg-1]
Regional background Units
Regional PEC in surface water (total) 1.51E-06 [mg/l]
Regional PEC in air (total) 2.19E-09 [mg.m-3]
Regional PEC in agricultural soil
(total) 2.50E-04 [mg/kg wet wt.]
Regional PEC in pore water of
agricultural soils 3.11E-07 [mg/l]
Regional PEC in natural soil (total) 4.79E-07 [mg/kg wet wt.]
Regional PEC in industrial soil (total) 4.79E-07 [mg/kg wet wt.]
Regional PEC in sediment (total) 1.12E-03 [mg/kg wet wt.]
Table 3.72 presents the predicted steady state mass balance in the region and continent. Please note
that the steady state predicted by the model are the amounts and distribution at the regional and
continental scale arising from the C/D use application pathway only. Adding in the release of the same
substances via other pathways (air and waste water) could lead to a different steady state balance.
Table 3.72 Predicted background exposures for HBCDD at steady state arising from use of composts
and digestates
Steady state mass Units
Total steady-state mass (region +
continent) 2.15E+01 [t]
Steady-state mass in regional
freshwater (kg) 5.43E+00 [kg]
Steady-state mass in regional
seawater (kg) 5.79E-01 [kg]
Steady-state mass in regional air (kg) 8.83E-02 [kg]

D115 © Wood Environment & Infrastructure Solutions UK Limited
February 2019
Doc Ref. 40039CL003i3
Steady state mass Units
Steady-state mass in regional
agricultural soil (kg) 2.04E+03 [kg]
Steady-state mass in regional natural
soil (kg) 4.40E-01 [kg]
Steady-state mass in regional
industrial soil (kg) 1.63E-01 [kg]
Steady-state mass in regional
freshwater sediment (kg) 4.65E+01 [kg]
Steady-state mass in regional
seawater sediment (kg) 7.28E-01 [kg]
Steady-state mass in continental
freshwater (kg) 6.46E+01 [kg]
Steady-state mass in continental
seawater (kg) 3.14E+02 [kg]
Steady-state mass in continental air
(kg) 2.63E+00 [kg]
Steady-state mass in continental
agricultural soil (kg) 1.84E+04 [kg]
Steady-state mass in continental
natural soil (kg) 6.62E+00 [kg]
Steady-state mass in continental
industrial soil (kg) 2.45E+00 [kg]
Steady-state mass in continental
freshwater sediment (kg) 5.54E+02 [kg]
Steady-state mass in continental
seawater sediment (kg) 1.97E+01 [kg]
Steady state mass fraction Units
Total steady-state mass fraction
(region + continent) 6.73E+01 [%]
Steady-state mass fraction in regional
freshwater (%) 1.70E-02 [%]
Steady-state mass fraction in regional
seawater (%) 1.82E-03 [%]
Steady-state mass fraction in regional
air (%) 2.77E-04 [%]
Steady-state mass fraction in regional
agricultural soil (%) 6.41E+00 [%]
Steady-state mass fraction in regional
natural soil (%) 1.38E-03 [%]
Steady-state mass fraction in regional
industrial soil (%) 5.11E-04 [%]
Steady-state mass fraction in regional
freshwater sediment (%) 1.46E-01 [%]
Steady-state mass fraction in regional
seawater sediment (%) 2.28E-03 [%]
Steady-state mass in continental
freshwater (kg) 2.02E-01 [%]
Steady-state mass in continental
seawater (kg) 9.85E-01 [%]
Steady-state mass in continental air
(kg) 8.24E-03 [%]

D116 © Wood Environment & Infrastructure Solutions UK Limited
February 2019
Doc Ref. 40039CL003i3
Steady-state mass in continental
agricultural soil (kg) 5.77E+01 [%]
Steady-state mass in continental
natural soil (kg) 2.07E-02 [%]
Steady-state mass in continental
industrial soil (kg) 7.68E-03 [%]
Steady-state mass in continental
freshwater sediment (kg) 1.74E+00 [%]
Steady-state mass in continental
seawater sediment (kg) 6.19E-02 [%]
Sensitivity to specific variables
The main source of uncertainty in the assessment of this substance is:
wide range in the reported concentration levels of the substance in C/D.
The impact of varying the releases within the specified range was explored. Refer to Table 3.73 below,
which illustrates the impact on relevant predicted exposure concentrations. The inputs used in the
‘more conservative’ and ‘less conservative’ assessments are explained in the Occurrence data set
section.
Table 3.73 Sensitivity of selected outputs in the assessment of HBCDD to the concentrations
reported in composts and digestates
More conservative
(realistic worst case)
Less conservative (general
case) Units
PECagricultural soil – local
scenario I 1.06E-02 5.19E-03 [mg/kg dry wt.]
PECagricultural soil – local
scenario II 2.01E+00 9.90E-01 [mg/kg dry wt.]
Humans via the
environment: local total
daily intake – local scenario
I
4.72E-04 2.12E-04 [mg.kg-1.d-1]
Humans via the
environment: local total
daily intake – local scenario
II
3.77E-02 1.85E-02 [mg.kg-1.d-1]
Total steady-state mass
(region + continent) 2.15E+01 7.56E-04 [t]
Total steady-state mass
fraction (region +
continent)
6.73E+01 6.72E+01 [%]
Regional PEC in surface
water (total) 1.51E-06 5.32E-11 [mg/l]
Secondary poisoning –
freshwater fish-eating birds
and mammals – local
scenario I
1.16E+00 4.45E-01 [mg/kg wet wt.]
Secondary poisoning –
worm-eating birds and
mammals – local scenario I
3.54E-04 1.67E-04 [mg.kg-1]
Secondary poisoning –
worm-eating birds and
mammals – local scenario II
9.62E-02 4.74E-02 [mg.kg-1]
It can be concluded that:

D117 © Wood Environment & Infrastructure Solutions UK Limited
February 2019
Doc Ref. 40039CL003i3
At the local scale, the variability in HBCDD in composts and digestates is not particularly
significant as the predicted exposure concentrations of HBCDD in important
compartments are within a factor of 2-3. This is mainly a consequence of how close the
mid range concentrations in compost/digestate are compared to the maximum values,
due to the small number of data points.
At the regional scale, the difference between the two scenarios is much more significant
for HBCDD.
In respect of local Scenario II, the sensitivity of the outcomes to possible losses from the system by
leaching and drainage of excess water has been explored using a fugacity method. For this substance
the proportion of substance in the system distributed to the interstitial water at equilibrium under
‘high water content’ conditions, and hence sensitive to leaching, is ≤1% of the substance present in the
system. Hence, the sensitivity of the exposure scenario to such variations in water management is
considered to be low.
Summary of findings
Table 3.74 below presents the summary of key findings from the risk assessment of HBCDD that has
been made in this project. The findings are discussed further below the table.
Table 3.74 Summary of key findings for exposure of HBCDD via use of compost and digestates
Key findings of the risk assessment of HBCDD in contaminated composts and digestates
Overall range of compost and digestate concentrations Very few reported values <1E-05 – 6.1 mg/kg dry wt.
Major raw material sources The type of input material is not mentioned for the higher
concentration compost/digestates. Digestate produced from
renewable raw materials had lower concentration of HBCDD.
Safe limit concentration in compost and digestate Not applicable (risk characterisation ratio not definable).
Main concern(s) arising Source of exposure of POP/PBT
Fresh water PEC exceeds the annual average EQS for inland
surface water at both the local (scenario I) and regional scales
(the MAC EQS is not exceeded); predator exposure via diet
(local scenario I) exceeds the EQS for biota (Directive
2008/105/EC as amended (2013/39/EU)).
Effects considered in the main concern hazard(s) POP; SVHC (PBT); basis of EQS is not stated in the Directive
but a background document suggests both the biota and
freshwater EQS relate to effects in birds47.
Uncertainties and their implications Very limited data set of concentrations in composts /
digestates means release amounts could be under- or over-
estimated in this model.
Sensitivity of exposures to variations in water management in
the local container growing scenario is low.
Other remarks
As a POP and PBT SVHC under REACH, it is in itself a potentially important finding that HBCDD has
been detected in freshly-produced composts and digestates in recent years. The raw material waste
streams could be investigated further. It is noted though that very few of the literature has identified
47 EQS dossier available online at

D118 © Wood Environment & Infrastructure Solutions UK Limited
February 2019
Doc Ref. 40039CL003i3
HBCDD. The same factors mean that the very small data set size for occurrence is not necessarily a
cause of concern in respect of uncertainty in the risk assessment.
The estimated regional scale exposures arising from the application of C/D are well below the
anthropogenic background concentrations modelled in the ESR risk assessment (EC 2008c, which were
reported to compare well with measured concentrations).
The highest contribution(s) to human exposure via the environment arising from the application of
C/D is mainly associated with dietary consumption of root vegetables.
At steady state, ca. 67% of the total mass remains within the region + continent48, suggesting that
there is limited redistribution following release via the handling and application of C/D. Much of the
remainder is modelled to distribute to global tropic (13.5%) and global moderate (12%) waters. The
total mass in the region + continent at steady state is approximately 20 t. When a comparable scenario
is assessed using a lower level release based on the range of occurrence data, the total mass at steady
state is much lower at <1 kg. This steady-state mass amounts to 0.48 times the mass released annually
via application of composts and digestates49, suggesting that long-term gradual accumulation is not
anticipated from exposure via this source.
3.12 2,3,7,8-Tetrachlorodibenzodioxin (TCDD) (representative of
Dioxins, Furans and Dioxin-like PCBs chemical family)
Dioxins and related compounds are persistent organochlorine compounds generated during
incineration and as a by-product of certain industrial processes. This group covers numerous poly-
chlorinated chemical structures; theoretically there are 75 polychlorinated dibenzo-p-dioxin (PCDD)
and 135 polychlorinated dibenzofuran (PCDF) congeners, and 12 ‘dioxin-like polychlorinated
biphenyls’ (dl-PCBs). One representative PCDD and one PCDF have been selected for detailed
assessment of this chemical family.
Toxicity in this group is assessed based on Toxic Equivalency Factors (TEFs) and Toxic Equivalent (TEQ)
expressing the weighted concentration equivalent to the most toxic dioxin 2,3,7,8-tetrachlorodibenzo-
p-dioxin (TCDD).
Background information and remarks
2,3,7,8-TCDD (CAS 1746-01-6, EC 217-122-7) is assessed as a representative substance of the Dioxins,
Furans and Dioxin-like PCBs chemical family. This is the most toxic of the dioxins and is relatively data-
rich providing a strong basis for the risk assessment.
Chemical properties and hazards data set
As a POP, the reliability of any threshold no-effect value is highly uncertain. Risk characterisation has
not been attempted here. Table 3.75 summarises the property data, which is derived from WHO IPCS
(1989b) EHC monograph 88 unless otherwise stated in the table.
48 This refers to the regional and continental spatial scales in the EUSES model. Refer to Section 1.7 and the Annex for further
information. 49 Please note this is not to be interpreted as how much time elapses to reach steady state; the steady state predicted by the
model are the amounts and distribution at the regional and continental scale arising from the compost and digestate use
application pathway only. Adding in the release of the same substances via other pathways (air and waste water) could lead to a
different steady state picture.

D119 © Wood Environment & Infrastructure Solutions UK Limited
February 2019
Doc Ref. 40039CL003i3
Table 3.75 Property information for 2,3,7,8-TCDD
Property Value Remarks
Molecular weight 321.9
Melting point 305-306
Boiling point
Vapour pressure
low (no values)
MPBPVP experimental database value: 1.5E-9 mmHg at 25C
= 2E-07 Pa
subcooled liquid VP 0.000118 Pa at 25C (no ref) - this was
the value used in EUSES.
Water solubility 2E-7 g/l;
12.5-19.2 ng/litre
A value of 15 ng/l was used in EUSES
based on this.
log Kow 6.64
Henry’s law
constant
HENRYWIN bond method 3.53E-6 atm.m3/mol; 5E-005
atm-m3/mole (Henry experimental database), which is
equivalent to 5.07 Pa.m3/mol
5.07 Pa.m3/mol used in EUSES
Koc
highly adsorbed to sediments and biota. Matsumura et al.
(1983) suggested that more than 90% of the 2,3,7,8-
tetraCDD in an aquatic medium could be present in the
adsorbed state.
KOCWIN - Experimental Log Koc: 6.5 (database)
BCF
Catfish; whole body: 28d BCF=4875
No earthworm data available.
Snail BCFs in range ca. 3000-5500
Biodegradability
not at all biodegradable. Slow abiotic degradation,
probably photodegradation, but very long half lives >10y in
all compartments
Abiotic reactivity: slow in soil (half-
life of TCDD of about 10-12 years,
for soil)
Half-life in air
Photochemical degradation possible - TCDD adsorbed on
silica gel undergoes 'rapid' photo-chemical degradation
AOPWIN prediction for 1746-01-6: reaction rate constant
0.753E-12 cm3/molecule-sec (equivalent to half life 21.3d)
PNECs are not definable, however it is noted that an EQS of 0.0065 µg/kg TEQ is applicable for biota
(Directive 2008/105/EC as amended (2013/39/EU)) as the sum of PCDD + PCDF + PCB-DL.
Occurrence data set
Table 3.76 presents a summary of the reported concentrations of PCDD/PCDF in composts and
digestates. This is based on the survey of the available literature collected in Task 2 of the project and
reported in the main project report.

D120 © Wood Environment & Infrastructure Solutions UK Limited
February 2019
Doc Ref. 40039CL003i3
Table 3.76 Reported occurrence of PCDD/PCDF in composts and digestates
Concentrations in
composts/digestates Value - units of mg/kg dry wt. Remarks
Composts - data
availability
42 individual result rows pertaining to total
PCDD/F, several are replicates in terms of location
and/or year. Many results are presented as I-TEQ.
Very wide variation in values, from pg/kg to µg/kg.
Three of the (sets of) values are reporting on a
range of data, as ranges/median.
Compost - minimum
concentration 7.00E-09 Lowest value of all is 7 pg/kg
Compost - mid-range
or average
concentration
0.0013 Average calculated from all reported figures is
1.3E-03 mg/kg. the median is 1.8E-05 mg/kg.
Compost - maximum
concentration 0.012
The highest value of all is 12 µg/kg (2014 in a
sewage sludge compost, this is the maximum
reported value across a range from different
countries). Result is in terms of I-TEQ for 17
PCDD/PCDF.
Digestates - data
availability
14 individual result rows pertaining to total
PCDD/F, several are replicates in terms of location
and/or year. Many results are presented as I-TEQ.
All in the ng/kg to µg/kg range. Eight of the (sets
of) values are reporting on a range of data, as
ranges/median or mean.
Digestate - minimum
concentration 7.00E-08
Lowest value of all is 0.07-1.1 ng I-TEQ/kg TM
(Bavaria, 2015)
Digestate - mid-range
or average
concentration
1.10E-03 Average calculated from all reported figures is
1.1E-03 mg/kg. the median is 3.1E-06 mg/kg
Digestate - maximum
concentration 0.0145
The highest value of all is 14.5 µg/kg (2014 in a
biowaste/green waste manure energy crop
digestate; this is the maximum reported value
across a range from different countries). Result is
in terms of I-TEQ for 17 PCDD/PCDF.
These concentrations in compost and in digestate equate to the following release amounts at the
regional and continental scale.
Table 3.77 Estimated regional and continental release amounts
Parameter Value
Mass of substance in EU-28 in compost (kg/year) 11
Mass of substance in EU-28 in digestate (kg/year) 39
Total regional emission to surface water (kg/day) 0.00039
Total regional emission to soil (kg/day) 0.013
Total continental emission to surface water (kg/day) 0.0035
Total continental emission to agricultural soil (kg/day) 0.12

D121 © Wood Environment & Infrastructure Solutions UK Limited
February 2019
Doc Ref. 40039CL003i3
These values have been applied in estimating the exposure concentrations for this substance arising
from use of composts and digestates. Exposures have been estimated for two concentration scenarios:
A more conservative assessment is derived using the maximum reported concentrations
in estimating the local releases from the two scenarios, with a mid-range concentration
used in estimating the regional background.
A less conservative assessment is derived separately using the mid-range reported
concentrations in estimating the local releases from the two scenarios, with a minimum
concentration used in estimating the regional background.
A full literature search for the latest background data has not been attempted but European exposure
data compiled by WHO are summarised in Table 3.78 below. In light of its status as a POP, there is an
international commitment to restrict its use, and hence significant decline in use is to be expected
going forward and the context of predicted environmental concentrations should be considered in this
context.
Table 3.78 Reported background concentrations of PCDD/PCDF in various foodstuffs (Western
Europe) (WHO, 2002)
Food category Value (weighted mean / derived median;
units of pg/g whole food)
Dairy 0.06/0.04
Eggs 0.07/0.03
Fish 0.37/0.11
Meat 0.09/0.01
Vegetable products 0.003/0.002
Generic exposure scenario outcomes
The assessment has estimated local and background exposures of 2,3,7,8-TCDD resulting from the use
scenarios defined in Section 1, using the chemical property data and concentration in composts and
digestates in the previous sections as inputs. The predicted environmental exposure concentrations are
as summarised in Table 3.79 below.
Table 3.79 Predicted exposures for 2,3,7,8-TCDD arising from use of composts and digestates
Scenario I Units
PECagricultural soil 2.40E-04 [mg/kg dry wt.]
PECgrassland soil 9.57E-05 [mg/kg dry wt.]
PEC in groundwater 3.75E-09 [mg/l]
PECfreshwater 4.83E-09 [mg/l]
PECfreshwater-sediment 1.55E-03 [mg/kg dry wt.]
Humans via the environment: local total daily intake 7.75E-07 [mg.kg-1.d-1]

D122 © Wood Environment & Infrastructure Solutions UK Limited
February 2019
Doc Ref. 40039CL003i3
Humans via the environment: daily dose via drinking
water 1.07E-10 [mg.kg-1.d-1]
Humans via the environment: dominant exposure
source and fraction Root Crops 77.2%
Secondary poisoning – freshwater fish-eating birds and
mammals 2.58E-05 [mg/kg wet wt.]
Secondary poisoning – worm-eating birds and
mammals 1.90E-04 [mg.kg-1]
Scenario II Units
PECagricultural soil 3.96E-03 [mg/kg dry wt.]
Humans via the environment: local total daily intake 9.98E-06 [mg.kg-1.d-1]
Humans via the environment: dominant exposure
source and fraction Root Crops 98.8%
Secondary poisoning – worm-eating birds and
mammals 1.72E-03 [mg.kg-1]
Table 3.80 presents the predicted steady state mass balance in the region and continent. Please note
that the steady state predicted by the model are the amounts and distribution at the regional and
continental scale arising from the C/D use application pathway only. Adding in the release of the same
substances via other pathways (air and waste water) could lead to a different steady state balance.
Table 3.80 Predicted background exposures for 2,3,7,8-TCDD at steady state arising from use of
composts and digestates
Steady state mass Units
Total steady-state mass (region + continent) 1.59E+01 [t]
Steady-state mass in regional freshwater (kg) 9.52E-03 [kg]
Steady-state mass in regional seawater (kg) 8.80E-04 [kg]
Steady-state mass in regional air (kg) 1.31E-02 [kg]
Steady-state mass in regional agricultural soil (kg) 1.58E+03 [kg]
Steady-state mass in regional natural soil (kg) 1.32E-01 [kg]
Steady-state mass in regional industrial soil (kg) 4.90E-02 [kg]
Steady-state mass in regional freshwater sediment (kg) 2.62E+00 [kg]
Steady-state mass in regional seawater sediment (kg) 1.62E-01 [kg]
Steady-state mass in continental freshwater (kg) 1.01E-01 [kg]
Steady-state mass in continental seawater (kg) 5.73E-01 [kg]
Steady-state mass in continental air (kg) 9.11E-01 [kg]

D123 © Wood Environment & Infrastructure Solutions UK Limited
February 2019
Doc Ref. 40039CL003i3
Steady-state mass in continental agricultural soil (kg) 1.43E+04 [kg]
Steady-state mass in continental natural soil (kg) 4.66E+00 [kg]
Steady-state mass in continental industrial soil (kg) 1.73E+00 [kg]
Steady-state mass in continental freshwater sediment
(kg) 2.78E+01 [kg]
Steady-state mass in continental seawater sediment
(kg) 5.27E+00 [kg]
Steady state mass fraction Units
Total steady-state mass fraction (region + continent) 9.91E+01 [%]
Steady-state mass fraction in regional freshwater (%) 5.95E-05 [%]
Steady-state mass fraction in regional seawater (%) 5.50E-06 [%]
Steady-state mass fraction in regional air (%) 8.16E-05 [%]
Steady-state mass fraction in regional agricultural soil
(%) 9.87E+00 [%]
Steady-state mass fraction in regional natural soil (%) 8.26E-04 [%]
Steady-state mass fraction in regional industrial soil (%) 3.06E-04 [%]
Steady-state mass fraction in regional freshwater
sediment (%) 1.64E-02 [%]
Steady-state mass fraction in regional seawater
sediment (%) 1.01E-03 [%]
Steady-state mass in continental freshwater (kg) 6.31E-04 [%]
Steady-state mass in continental seawater (kg) 3.58E-03 [%]
Steady-state mass in continental air (kg) 5.69E-03 [%]
Steady-state mass in continental agricultural soil (kg) 8.90E+01 [%]
Steady-state mass in continental natural soil (kg) 2.91E-02 [%]
Steady-state mass in continental industrial soil (kg) 1.08E-02 [%]
Steady-state mass in continental freshwater sediment
(kg) 1.74E-01 [%]
Steady-state mass in continental seawater sediment
(kg) 3.29E-02 [%]
Sensitivity to specific variables
The main source of uncertainty in the assessment of this substance is:
wide range in the reported concentration levels of the substance in C/D

D124 © Wood Environment & Infrastructure Solutions UK Limited
February 2019
Doc Ref. 40039CL003i3
The impact of varying the releases within the specified range was explored. Refer to Table 3.81 below,
which illustrates the impact on relevant predicted exposure concentrations. The inputs used in the
‘more conservative’ and ‘less conservative’ assessments are explained in the Occurrence data set
section.
Table 3.81 Sensitivity of selected outputs in the assessment of 2,3,7,8-TCDD to the concentrations
reported in composts and digestates
More conservative
(realistic worst case)
Less conservative (general
case) Units
PECagricultural soil – local
scenario I 2.40E-04 2.15E-05 [mg/kg dry wt.]
PECagricultural soil – local
scenario II 3.96E-03 4.29E-04 [mg/kg dry wt.]
Humans via the
environment: local total
daily intake – local scenario
I
7.75E-07 5.87E-08 [mg.kg-1.d-1]
Humans via the
environment: local total
daily intake – local scenario
II
9.98E-06 1.07E-06 [mg.kg-1.d-1]
Total steady-state mass
(region + continent) 1.59E+01 8.00E-04 [t]
Total steady-state mass
fraction (region +
continent)
9.91E+01 9.91E+01 [%]
Regional PEC in surface
water (total) 2.65E-09 1.33E-13 [mg/l]
Secondary poisoning –
freshwater fish-eating birds
and mammals – local
scenario I
2.58E-05 1.91E-06 [mg/kg wet wt.]
Secondary poisoning –
worm-eating birds and
mammals – local scenario I
1.90E-04 8.89E-06 [mg.kg-1]
Secondary poisoning –
worm-eating birds and
mammals – local scenario II
1.72E-03 1.77E-04 [mg.kg-1]
It can be concluded that:
At the local scale, the predicted exposure concentrations of 2,3,7,8-TCDD in important
compartments differ by a factor of around x10-20.
At the regional scale, the difference between the two scenarios is much more significant
for 2,3,7,8-TCDD at around 4 orders of magnitude.
In respect of local Scenario II, the sensitivity of the outcomes to possible losses from the system by
leaching and drainage of excess water has been explored using a fugacity method. For this substance
the proportion of substance in the system distributed to the interstitial water at equilibrium under
‘high water content’ conditions, and hence sensitive to leaching, is ≤1% of the substance present in the
system. Hence, the sensitivity of the exposure scenario to such variations in water management is
considered to be low.

D125 © Wood Environment & Infrastructure Solutions UK Limited
February 2019
Doc Ref. 40039CL003i3
Summary of findings
Table 3.82 below presents the summary of key findings from the risk assessment of 2,3,7,8-TCDD that
has been made in this project. The findings are discussed further below the table.
Table 3.82 Summary of key findings for exposure of 2,3,7,8-TCDD via use of compost and digestates
Key findings of the risk assessment of 2,3,7,8-TCDD in contaminated composts and digestates
Overall range of compost and digestate concentrations 7E-09 – 0.0145 mg/kg dry wt. (total PCDD/PCDF)
Major raw material sources Highest values are reported for sewage sludge composts and
biowaste/green waste manure energy crop digestate
Safe limit concentration in compost and digestate Not applicable (risk characterisation ratio not definable).
Main concern(s) arising Source of exposure of POP/PBT; significant cumulative loads
at steady state; absolute concentrations exceeding previously
published measured concentrations in foods; absolute
concentrations in compost/digestate exceeding existing local
limit values / guide values (but not exceeding EC Regulation
1195/2006); predator exposure via diet (local scenarios I and
II) exceed the EQS for biota (Directive 2008/105/EC as
amended (2013/39/EU)).
Effects considered in the main concern hazard(s) POP; basis of EQS is not stated in the Directive and is unclear
Uncertainties and their implications Very variable data set of concentrations in composts /
digestates means release amounts could be under- or over-
estimated in this model.
Sensitivity of exposures to variations in water management in
the local container growing scenario is low.
Other remarks
As POPs, it is noteworthy that PCDD/PCDF and PCBs have been detected in freshly-produced
composts and digestates at several different locations in recent years. Their presence may result from atmospheric deposition of emissions from combustion or municipal solid waste incineration rather than originating from the raw material waste streams. This could be investigated further if needed.
The highest reported concentrations in composts and digestates already appear to exceed the national
limit value for several member states, although still within the 15 μg/kg limit referenced from Council
Regulation (EC) No 1195/2006 of 18 July 2006 amending Annex IV to Regulation (EC) No 850/2004
(POPs Regulation). These high occurrence concentrations arise from composts and digestates from a
range of raw materials and processing types.
The highest contribution(s) to human exposure via the environment arising from the application of C/D
is mainly associated with (dietary consumption of root vegetables). The estimated exposures arising
from the application of C/D are high compared with reported mean/median levels of PCDD/PCDF in
foodstuffs including vegetables, in Western Europe as summarised by WHO (2002). This is the case
even when lower concentrations were assumed in the exposure model (for example, the ‘low
concentration’ exposure assessment for 2,3,7,8-TCDD results in concentrations of 1E-05 mg/kg and 2E-
04 mg/kg in root tissue of plants arising from application to land (local scenario I) and container
growing (local scenario II) respectively. However the WHO summary reports a weighted mean of
0.003 pg PCDD/PCDF/g whole food (equivalent to 3E-9 mg/kg) for vegetable products.

D126 © Wood Environment & Infrastructure Solutions UK Limited
February 2019
Doc Ref. 40039CL003i3
At steady state, >99% of the total mass remains within the region + continent50, suggesting that there
is relatively low potential for transfer over long distances following release via the handling and
application of C/D. The total mass in the region + continent at steady state is 16t which is significant
but not particularly high. This steady-state mass amounts to 320 times the mass released annually via
application of composts and digestates51. When a comparable scenario is assessed using a lower level
release, the steady state mass is very low (below 1 kg).
3.13 2,3,4,7,8-Pentachlorodibenzofuran (PCDF) (representative of
Dioxins, Furans and Dioxin-like PCBs chemical family)
Background information and remarks
2,3,4,7,8-Pentachlorodibenzofuran (PCDF) (CAS 57117-31-4, no EC number) is an example of a furan
structure in this chemical family.
Chemical properties and hazards data set
As a POP, the reliability of any threshold no-effect value is highly uncertain. Risk characterisation has
not been attempted here.
Despite consulting several sources, no single robust pre-existing regulatory assessment data set
covering the core physical chemistry required by EUSES was identified. The data are drawn from
literature sources as reported by common databases. Koc and BCF are estimated values. The sensitivity
of the assessment to variation around the key input physicochemical properties has been investigated.
Table 3.83 Property information for 2,3,4,7,8-PCDF
Property Value Remarks
Molecular weight 340.42
Melting point 196 EPI Suite Experimental Database
Boiling point
Vapour pressure 3.51E-07 Pa at 25C Rordorf BF (1989), cited by EPI Suite experimental
database
Water solubility 0.000235 at 23C Friesen KJ et al (1990), cited by EPI Suite
experimental database
log Kow 6.92
Sijm DTHM et al; Chemosphere 19: 263-6 (1989)
cited in EPI experimental database and Pubchem
chemical profile
50 This refers to the regional and continental spatial scales in the EUSES model. Refer to Section 1.7 and the Annex for further
information. 51 Please note this is not to be interpreted as how much time elapses to reach steady state; the steady state predicted by the
model are the amounts and distribution at the regional and continental scale arising from the compost and digestate use
application pathway only. Adding in the release of the same substances via other pathways (air and waste water) could lead to a
different steady state picture.

D127 © Wood Environment & Infrastructure Solutions UK Limited
February 2019
Doc Ref. 40039CL003i3
Property Value Remarks
Henry’s law constant 1.16 Pa.m3/mol (est) No measured data found. This is the Bond method
value estimated by EPI Suite
Koc Koc Estimate from MC) (SRC QSAR):
Estimated Koc: 2.33e+005 L/kg
EUSES derives Koc 5.08E+05 l/kg from Kow
(predominantly hydrophobics).
BCF
Biodegradability no biodegradation half-life defined
Half-life in air OH reaction rate constant: 0.1147E-12
cm3.molecule-1.s-1 (est) AOPWIN reaction rate
PNECs are not definable, however it is noted that an EQS of 0.0065 µg/kg TEQ is applicable for biota
(Directive 2008/105/EC as amended (2013/39/EU)) as the sum of PCDD + PCDF + PCB-DL.
Occurrence data set
A summary of the reported concentrations of PCDD/PCDF in composts and digestates is presented in
Table 3.76 in the previous section, and is not repeated here.
These values have been applied in estimating the exposure concentrations for this substance arising
from use of composts and digestates. Exposures have been estimated for two concentration scenarios:
A more conservative assessment is derived using the maximum reported concentrations
in estimating the local releases from the two scenarios, with a mid-range concentration
used in estimating the regional background.
A less conservative assessment is derived separately using the mid-range reported
concentrations in estimating the local releases from the two scenarios, with a minimum
concentration used in estimating the regional background.
A full literature search for the latest background data has not been attempted but European exposure
data compiled by WHO are summarised in Table 3.78 in the previous section and are not repeated
here. In light of its status as a POP, there is an international commitment to restrict its use, and hence
significant decline in use is to be expected going forward and the context of predicted environmental
concentrations should be considered in this context.
Generic exposure scenario outcomes
The assessment has estimated local and background exposures of 2,3,4,7,8-PCDF resulting from the
use scenarios defined in Section 1, using the chemical property data and concentration in composts
and digestates in the previous sections as inputs. The predicted environmental exposure
concentrations are as summarised in Table 3.84 below.
Table 3.84 Predicted exposures for 2,3,4,7,8-PCDF arising from use of composts and digestates
Scenario I Units
PECagricultural soil 3.14E-04 [mg/kg dry wt.]

D128 © Wood Environment & Infrastructure Solutions UK Limited
February 2019
Doc Ref. 40039CL003i3
PECgrassland soil 1.69E-04 [mg/kg dry wt.]
PEC in groundwater 3.09E-08 [mg/l]
PECfreshwater 2.21E-08 [mg/l]
PECfreshwater-sediment 1.12E-03 [mg/kg dry wt.]
Humans via the environment: local
total daily intake 1.08E-05 [mg.kg-1.d-1]
Humans via the environment: daily
dose via drinking water 8.83E-10 [mg.kg-1.d-1]
Humans via the environment:
dominant exposure source and
fraction
Root Crops 84%
Secondary poisoning – freshwater
fish-eating birds and mammals 6.89E-03 [mg/kg wet wt.]
Secondary poisoning – worm-eating
birds and mammals 4.05E-03 [mg.kg-1]
Scenario II Units
PECagricultural soil 4.03E-03 [mg/kg dry wt.]
Humans via the environment: local
total daily intake 1.17E-04 [mg.kg-1.d-1]
Humans via the environment:
dominant exposure source and
fraction
Root Crops 99.5%
Secondary poisoning – worm-eating
birds and mammals 2.06E-02 [mg.kg-1]
fferent steady state balance.
Table 3.85 presents the predicted steady state mass balance in the region and continent. Please note
that the steady state predicted by the model are the amounts and distribution at the regional and
continental scale arising from the C/D use application pathway only. Adding in the release of the same
substances via other pathways (air and waste water) could lead to a different steady state balance.
Table 3.85 Predicted background exposures for 2,3,4,7,8-PCDF at steady state arising from use of
composts and digestates
Steady state mass Units
Total steady-state mass (region +
continent) 4.88E+01 [t]
Steady-state mass in regional
freshwater (kg) 5.04E-02 [kg]
Steady-state mass in regional seawater
(kg) 5.70E-03 [kg]
Steady-state mass in regional air (kg) 6.19E-03 [kg]
Steady-state mass in regional
agricultural soil (kg) 4.27E+03 [kg]
Steady-state mass in regional natural
soil (kg) 5.97E+01 [kg]

D129 © Wood Environment & Infrastructure Solutions UK Limited
February 2019
Doc Ref. 40039CL003i3
Steady-state mass in regional
industrial soil (kg) 2.21E+01 [kg]
Steady-state mass in regional
freshwater sediment (kg) 7.07E+00 [kg]
Steady-state mass in regional seawater
sediment (kg) 3.32E-01 [kg]
Steady-state mass in continental
freshwater (kg) 7.07E-01 [kg]
Steady-state mass in continental
seawater (kg) 8.15E+01 [kg]
Steady-state mass in continental air
(kg) 2.21E-01 [kg]
Steady-state mass in continental
agricultural soil (kg) 4.25E+04 [kg]
Steady-state mass in continental
natural soil (kg) 1.08E+03 [kg]
Steady-state mass in continental
industrial soil (kg) 3.99E+02 [kg]
Steady-state mass in continental
freshwater sediment (kg) 9.91E+01 [kg]
Steady-state mass in continental
seawater sediment (kg) 2.38E+02 [kg]
Steady state mass fraction Units
Total steady-state mass fraction
(region + continent) 5.87E+01 [%]
Steady-state mass fraction in regional
freshwater (%) 6.06E-05 [%]
Steady-state mass fraction in regional
seawater (%) 6.85E-06 [%]
Steady-state mass fraction in regional
air (%) 7.45E-06 [%]
Steady-state mass fraction in regional
agricultural soil (%) 5.14E+00 [%]
Steady-state mass fraction in regional
natural soil (%) 7.19E-02 [%]
Steady-state mass fraction in regional
industrial soil (%) 2.66E-02 [%]
Steady-state mass fraction in regional
freshwater sediment (%) 8.50E-03 [%]
Steady-state mass fraction in regional
seawater sediment (%) 4.00E-04 [%]
Steady-state mass in continental
freshwater (kg) 8.50E-04 [%]
Steady-state mass in continental
seawater (kg) 9.80E-02 [%]
Steady-state mass in continental air
(kg) 2.66E-04 [%]
Steady-state mass in continental
agricultural soil (kg) 5.12E+01 [%]
Steady-state mass in continental
natural soil (kg) 1.30E+00 [%]

D130 © Wood Environment & Infrastructure Solutions UK Limited
February 2019
Doc Ref. 40039CL003i3
Steady-state mass in continental
industrial soil (kg) 4.80E-01 [%]
Steady-state mass in continental
freshwater sediment (kg) 1.19E-01 [%]
Steady-state mass in continental
seawater sediment (kg) 2.86E-01 [%]
Sensitivity to specific variables
The main sources of uncertainty in the assessment of this substance are:
Log Kow (value 6.92 ± 1 log unit)
Water solubility (value 2.35E-04 mg/l ± 1 log unit)
Vapour pressure (value 3.51E-07 ± 1 log unit)
Wide range in the reported concentration levels of the substance in C/D
The impact of varying each property within a suitable uncertainty range around the selected (baseline)
value was explored independently. Refer to Figure 3.6 to Figure 3.10 and Table 3.86 below, which
illustrate the impact on relevant predicted exposure concentrations.
In respect of the concentration in the compost/digestate, the impact of varying the releases within the
specified range was explored. In respect of the variable concentrations/releases, the inputs used in the
‘more conservative’ and ‘less conservative’ assessments are explained in the Occurrence data set
section.
Figure 3.6 Sensitivity of selected outputs in the assessment of 2,3,4,7,8-PCDF to the vapour pressure
input value: diet of fish-eating birds and mammals

D131 © Wood Environment & Infrastructure Solutions UK Limited
February 2019
Doc Ref. 40039CL003i3
Figure 3.7 Sensitivity of selected outputs in the assessment of 2,3,4,7,8-PCDF to the vapour pressure
input value: diet of worm-eating birds and mammals
Figure 3.8 Sensitivity of selected outputs in the assessment of 2,3,4,7,8-PCDF to the log Kow input
value: fresh-water sediment

D132 © Wood Environment & Infrastructure Solutions UK Limited
February 2019
Doc Ref. 40039CL003i3
Figure 3.9 Sensitivity of selected outputs in the assessment of 2,3,4,7,8-PCDF to the log Kow input
value: diet of fish-eating birds and mammals
Figure 3.10 Sensitivity of selected outputs in the assessment of 2,3,4,7,8-PCDF to the log Kow input
value: diet of worm-eating birds and mammals
Table 3.86 Sensitivity of selected outputs in the assessment of 2,3,4,7,8-PCDF to the concentrations
reported in composts and digestates
More conservative
(realistic worst case)
Less conservative (general
case) Units
PECagricultural soil – local
scenario I 3.14E-04 2.15E-05 [mg/kg dry wt.]
PECagricultural soil – local
scenario II 4.03E-03 4.29E-04 [mg/kg dry wt.]

D133 © Wood Environment & Infrastructure Solutions UK Limited
February 2019
Doc Ref. 40039CL003i3
More conservative
(realistic worst case)
Less conservative (general
case) Units
Humans via the
environment: local total
daily intake – local scenario
I
1.08E-05 7.22E-07 [mg.kg-1.d-1]
Humans via the
environment: local total
daily intake – local scenario
II
1.17E-04 1.24E-05 [mg.kg-1.d-1]
Total steady-state mass
(region + continent) 4.88E+01 2.46E-03 [t]
Total steady-state mass
fraction (region +
continent)
5.87E+01 5.87E+01 [%]
Regional PEC in surface
water (total) 1.40E-08 7.05E-13 [mg/l]
Secondary poisoning –
freshwater fish-eating birds
and mammals – local
scenario I
6.89E-03 2.98E-04 [mg/kg wet wt.]
Secondary poisoning –
worm-eating birds and
mammals – local scenario I
4.05E-03 9.61E-05 [mg.kg-1]
Secondary poisoning –
worm-eating birds and
mammals – local scenario II
2.06E-02 1.91E-03 [mg.kg-1]
It can be concluded that:
At the water solubility value used in the baseline assessment, all PECs have been
estimated conservatively. Within the uncertainty range, some PECs could be higher, but
some could be lower.
The secondary poisoning exposure of worm-eating birds and mammals, and of fish-
eating birds and mammals could have been significantly higher (up to 2x) than estimated
in the baseline assessment, at lower Kow values and VP value within a reasonable
uncertainty range around the literature values.
The local total daily intake via both exposure scenarios could have been significantly
higher (up to 2x) than estimated in the baseline assessment, at lower Kow values within a
reasonable uncertainty range around the literature log Kow value.
The secondary poisoning exposure of fish-eating birds and mammals (local scenario I),
and sediment PECs, could be up to 2x higher at lower Kow values within a reasonable
uncertainty range.
At the local scale, the predicted exposure concentrations of 2,3,4,7,8-PCDF in important
compartments differ by a factor of around x10-20.
At the regional scale, the difference between the two scenarios is much more significant
for 2,3,4,7,8-PCDF at more than 4 orders of magnitude.
In respect of local Scenario II, the sensitivity of the outcomes to possible losses from the system by
leaching and drainage of excess water has been explored using a fugacity method. For this substance
the proportion of substance in the system distributed to the interstitial water at equilibrium under
‘high water content’ conditions, and hence sensitive to leaching, is ≤1% of the substance present in the

D134 © Wood Environment & Infrastructure Solutions UK Limited
February 2019
Doc Ref. 40039CL003i3
system. Hence, the sensitivity of the exposure scenario to such variations in water management is
considered to be low.
Summary of findings
Table 3.87 below presents the summary of key findings from the risk assessment of 2,3,4,7,8-PCDF that
has been made in this project. The findings are discussed further below the table.
Table 3.87 Summary of key findings for exposure of 2,3,4,7,8-PCDF via use of compost and
digestates
Key findings of the risk assessment of 2,3,4,7,8-PCDF in contaminated composts and digestates
Overall range of compost and digestate concentrations 7E-09 – 0.0145 mg/kg dry wt. (total PCDD/PCDF)
Major raw material sources Highest values are reported for sewage sludge composts and
biowaste/green waste manure energy crop digestate
Safe limit concentration in compost and digestate Not applicable (risk characterisation ratio not definable).
Main concern(s) arising Source of exposure of POP/PBT; significant cumulative loads
at steady state; absolute concentrations exceeding previously
published measured concentrations in foods; absolute
concentrations in compost/digestate exceeding existing local
limit values / guide values (but not exceeding EC Regulation
1195/2006); predator exposure via diet (local scenarios I and
II) exceed the EQS for biota (Directive 2008/105/EC as
amended (2013/39/EU))
Effects considered in the main concern hazard(s) POP; basis of EQS is not stated in the Directive and is unclear.
Uncertainties and their implications Very variable data set of concentrations in composts /
digestates means release amounts could be under- or over-
estimated in this model.
Variability in some important physicochemical input property
data could be significant for PECs.
Sensitivity of exposures to variations in water management in
the local container growing scenario is low.
Other remarks
The findings and conclusions for 2,3,4,7,8-PCDF are to some extent in line with those set out for
2,3,7,8-TCDD in the previous section. However unlike for 2,3,7,8-TCDD, the models indicate that at
steady state, ca. 59% of the total mass of 2,3,4,7,8-PCDF remains within the region + continent52,
suggesting that there is some potential for transfer over long distances following release via the
handling and application of C/D53. The total mass in the region + continent at steady state is 49 t.
When a comparable scenario is assessed using a lower level concentration in C/D within the reported
range, the steady state mass is much lower at ca. 3 kg. This steady-state mass amounts to 970 times
the mass released annually via application of composts and digestates54.
52 This refers to the regional and continental spatial scales in the EUSES model. Refer to Section 1.7 and the Annex for further
information. 53 The possibility or not for transfer over long distance is largely an inherent property of the substances themselves, but it is
interesting if this is expressed even when the pathway into the environment is so dominated by incorporation into soil. 54 Please note this is not to be interpreted as how much time elapses to reach steady state; the steady state predicted by the
model are the amounts and distribution at the regional and continental scale arising from the compost and digestate use

D135 © Wood Environment & Infrastructure Solutions UK Limited
February 2019
Doc Ref. 40039CL003i3
The differences may be attributable to the apparent higher water solubility and lower Koc for 2,3,4,7,8-
PCDF compared to 2,3,7,8-TCDD. The sensitivity of the assessment to possible uncertainty around the
physicochemical input data confirm that the aquatic compartment and predator food chains especially
may be affected by the uncertainty.
3.14 2,4,4'-Trichlorobiphenyl (PCB-28) (representative of PCBs
chemical family)
Background information and remarks
2,4,4'-Trichlorobiphenyl (EC 230-293-2, CAS 7012-37-5) is a trichlorinated PCB congener. The group of
polychlorinated biphenyls (PCBs) is one of the original twelve POPs covered by the Stockholm
Convention. A sub-category of PCBs (tetra- and higher chlorinated structures) are referred to as
‘dioxin-like’ PCBs. Although PCB-28 does not meet this definition for a ‘dioxin-like PCB’, it is relevant
that the PCBs used were as mixtures rather than pure substances. The detection of any such substance
in C/D is therefore indicative for the wider group of PCB including ‘dioxin-like’ PCBs. Exposure of PCB-
28 has been modelled as a representative marker substance for the group, and resulting exposures
have been compared to applicable thresholds for dioxin-like PCBs.
Chemical properties and hazards data set
As a POP, the reliability of any threshold no-effect value is highly uncertain. Risk characterisation has
not been attempted here. Table 3.88 summarises the property data, which is literature data referenced
from WHO (1993) IPCS EHC monograph unless otherwise stated in the table.
Table 3.88 Property information for PCB-28
Property Value Remarks
Molecular weight 257.54 g/mol
Melting point 57-58C
Boiling point 206-207
Vapour pressure 0.026 Pa at 25C
Water solubility 0.27 mg/l at 25C
0.067-0.312
log Kow
4.38-5.81.
Hansch & Leo: 5.62
The value from Hansch and Leo was used in EUSES.
Henry’s law constant
Koc 3.53 - 5.80 log values
BCF 4.32-5.62 fish. Log values
application pathway only. Adding in the release of the same substances via other pathways (air and waste water) could lead to a
different steady state picture.

D136 © Wood Environment & Infrastructure Solutions UK Limited
February 2019
Doc Ref. 40039CL003i3
Property Value Remarks
Biodegradability
limited, slow biodegradability is
possible for some congeners,
reliable data not readily available.
No half-life entered in EUSES.
Half-life in air AOP rate constant: 1.1856E-12
cm3/molecule-sec
Variable data available on fraction sorbed to airborne
particulates. 0.00058 Junge-Pankow Mackay average.
0.000999 Koa method. The sorbed fraction may be resistant
to atmospheric oxidation.
PNECs are not definable, however it is noted that an EQS of 0.0065 µg/kg TEQ is applicable for biota
(Directive 2008/105/EC as amended (2013/39/EU)) as the sum of PCDD + PCDF + PCB-DL.
Occurrence data set
Table 3.89 presents a summary of the reported concentrations of PCB-28 in composts and digestates.
This is based on the survey of the available literature collected in Task 2 of the project and reported in
the main project report.
Table 3.89 Reported occurrence of PCB-28 in composts and digestates
Concentrations in
composts/digestates
Value - units of mg/kg dry
wt. Remarks
Composts - data
availability
23 data points, of which several are ranges or represent an
external data set. Quite a lot of variability with values in the
ng/kg, μg/kg and up to mg/kg order. No consistency between
specific PCB, PCB vs DL-PCB, or total across all PCB or
dioxin/furan/dioxin-like-PCB
Compost - minimum
concentration 0.004
Lowest reported value for PCB7 is for green waste compost in
BE (Flanders) cited in Saveyn and Eder
Compost - mid-range
or average
concentration
0.03
The median value of 27.3 µg/kg dry wt. from Saveyn and Eder
seems to be reasonably representative of this very variable
dataset.
Compost - maximum
concentration 0.2
100 µg/kg d.m. 90-percentile levels (PCBs specifically). A limit
value of 200 µg/kg d.m. is mentioned by Saveyn and Eder.
Several entries report values approx 100 µg/kg d.m. A report of
4.4. - 10 mg PCBs/kg in compost made from low grade waste
wood may be an outlier55
Digestates - data
availability 0
18 data points, of which several are ranges or represent an
external data set. Quite a lot of variability with values in the
fractions of ng/kg, μg/kg and up to several mg/kg order. No
consistency between specific PCB, PCB vs DL-PCB, or total
across all PCB or dioxin/furan/dioxin-like-PCB
Digestate - minimum
concentration 0.001
Lowest reported value for PCB7 is for bio-waste and green
waste manure energy crops digestate (this value is the lower
limit of the range for several EEA countries) from Saveyn and
Eder, 2014.
55 Very high PCB levels indicate that ill-defined or contaminated input materials have a detrimental effect on compost quality
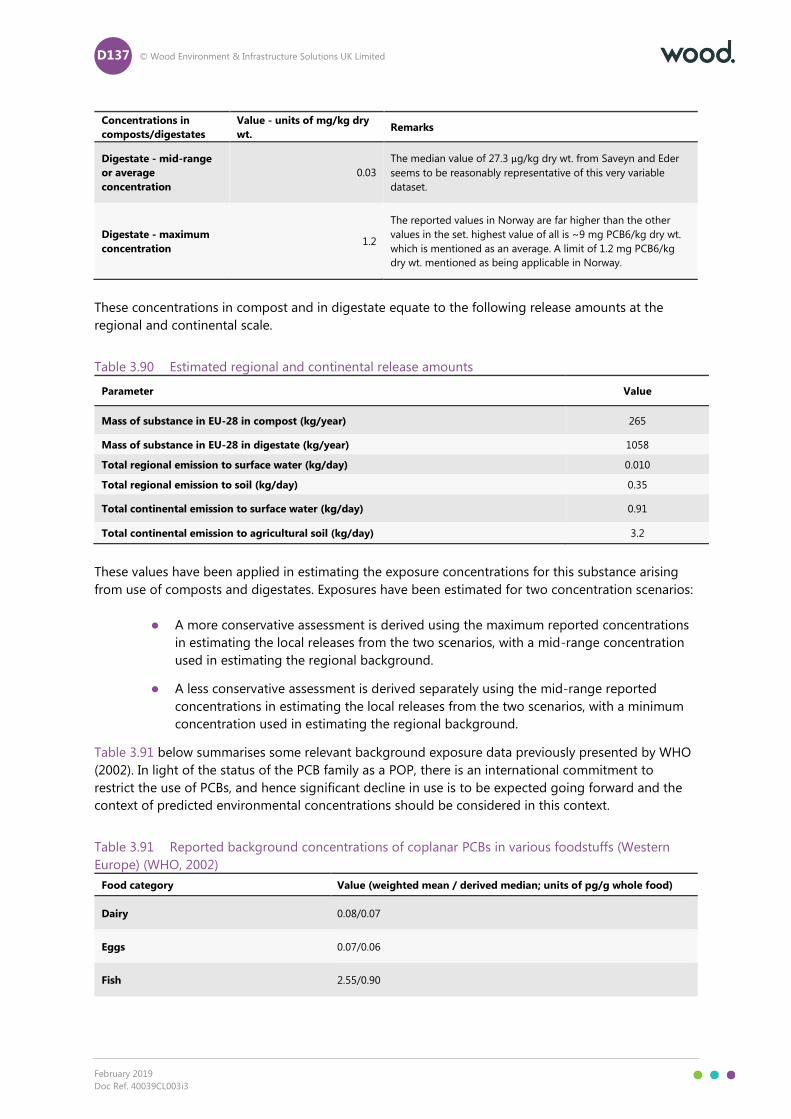
D137 © Wood Environment & Infrastructure Solutions UK Limited
February 2019
Doc Ref. 40039CL003i3
Concentrations in
composts/digestates
Value - units of mg/kg dry
wt. Remarks
Digestate - mid-range
or average
concentration
0.03
The median value of 27.3 µg/kg dry wt. from Saveyn and Eder
seems to be reasonably representative of this very variable
dataset.
Digestate - maximum
concentration 1.2
The reported values in Norway are far higher than the other
values in the set. highest value of all is ~9 mg PCB6/kg dry wt.
which is mentioned as an average. A limit of 1.2 mg PCB6/kg
dry wt. mentioned as being applicable in Norway.
These concentrations in compost and in digestate equate to the following release amounts at the
regional and continental scale.
Table 3.90 Estimated regional and continental release amounts
Parameter Value
Mass of substance in EU-28 in compost (kg/year) 265
Mass of substance in EU-28 in digestate (kg/year) 1058
Total regional emission to surface water (kg/day) 0.010
Total regional emission to soil (kg/day) 0.35
Total continental emission to surface water (kg/day) 0.91
Total continental emission to agricultural soil (kg/day) 3.2
These values have been applied in estimating the exposure concentrations for this substance arising
from use of composts and digestates. Exposures have been estimated for two concentration scenarios:
A more conservative assessment is derived using the maximum reported concentrations
in estimating the local releases from the two scenarios, with a mid-range concentration
used in estimating the regional background.
A less conservative assessment is derived separately using the mid-range reported
concentrations in estimating the local releases from the two scenarios, with a minimum
concentration used in estimating the regional background.
Table 3.91 below summarises some relevant background exposure data previously presented by WHO
(2002). In light of the status of the PCB family as a POP, there is an international commitment to
restrict the use of PCBs, and hence significant decline in use is to be expected going forward and the
context of predicted environmental concentrations should be considered in this context.
Table 3.91 Reported background concentrations of coplanar PCBs in various foodstuffs (Western
Europe) (WHO, 2002)
Food category Value (weighted mean / derived median; units of pg/g whole food)
Dairy 0.08/0.07
Eggs 0.07/0.06
Fish 2.55/0.90

D138 © Wood Environment & Infrastructure Solutions UK Limited
February 2019
Doc Ref. 40039CL003i3
Meat 0.41/0.08
Vegetable products 0.04/LOD
Generic exposure scenario outcomes
The assessment has estimated local and background exposures of PCB-28 resulting from the use
scenarios defined in Section 1, using the chemical property data and concentration in composts and
digestates in the previous sections as inputs. The predicted environmental exposure concentrations are
as summarised in Table 3.92 below.
Table 3.92 Predicted exposures for PCB-28 arising from use of composts and digestates
Scenario I Units
PECagricultural soil 1.96E-02 [mg/kg dry wt.]
PECgrassland soil 7.72E-03 [mg/kg dry wt.]
PEC in groundwater 2.12E-05 [mg/l]
PECfreshwater 2.10E-06 [mg/l]
PECfreshwater-sediment 9.73E-03 [mg/kg dry wt.]
Humans via the environment: local total daily
intake 6.87E-04 [mg.kg-1.d-1]
Humans via the environment: daily dose via
drinking water 6.07E-07 [mg.kg-1.d-1]
Humans via the environment: dominant exposure
source and fraction Root Crops 52.9%
Secondary poisoning – freshwater fish-eating birds
and mammals 1.05E+00 [mg/kg wet wt.]
Secondary poisoning – worm-eating birds and
mammals 5.79E-02 [mg.kg-1]
Scenario II Units
PECagricultural soil 6.60E-02 [mg/kg dry wt.]
Humans via the environment: local total daily
intake 1.24E-03 [mg.kg-1.d-1]
Humans via the environment: dominant exposure
source and fraction Root Crops 98.2%
Secondary poisoning – worm-eating birds and
mammals 1.73E-01 [mg.kg-1]
Table 3.93 presents the predicted steady state mass balance in the region and continent. Please note
that the steady state predicted by the model are the amounts and distribution at the regional and
continental scale arising from the C/D use application pathway only. Adding in the release of the same
substances via other pathways (air and waste water) could lead to a different steady state balance.

D139 © Wood Environment & Infrastructure Solutions UK Limited
February 2019
Doc Ref. 40039CL003i3
Table 3.93 Predicted background exposures for PCB-28 at steady state arising from use of composts
and digestates
Steady state mass Units
Total steady-state mass (region +
continent) 2.72E+02 [t]
Steady-state mass in regional freshwater
(kg) 5.91E-01 [kg]
Steady-state mass in regional seawater
(kg) 5.77E-02 [kg]
Steady-state mass in regional air (kg) 2.83E-01 [kg]
Steady-state mass in regional agricultural
soil (kg) 2.70E+04 [kg]
Steady-state mass in regional natural soil
(kg) 3.62E+00 [kg]
Steady-state mass in regional industrial
soil (kg) 1.34E+00 [kg]
Steady-state mass in regional freshwater
sediment (kg) 1.16E+01 [kg]
Steady-state mass in regional seawater
sediment (kg) 3.45E-01 [kg]
Steady-state mass in continental
freshwater (kg) 6.27E+00 [kg]
Steady-state mass in continental seawater
(kg) 1.74E+02 [kg]
Steady-state mass in continental air (kg) 1.71E+01 [kg]
Steady-state mass in continental
agricultural soil (kg) 2.44E+05 [kg]
Steady-state mass in continental natural
soil (kg) 1.10E+02 [kg]
Steady-state mass in continental industrial
soil (kg) 4.08E+01 [kg]
Steady-state mass in continental
freshwater sediment (kg) 1.23E+02 [kg]
Steady-state mass in continental seawater
sediment (kg) 5.19E+01 [kg]
Steady state mass fraction Units
Total steady-state mass fraction (region +
continent) 9.71E+01 [%]
Steady-state mass fraction in regional
freshwater (%) 2.11E-04 [%]
Steady-state mass fraction in regional
seawater (%) 2.07E-05 [%]
Steady-state mass fraction in regional air
(%) 1.01E-04 [%]
Steady-state mass fraction in regional
agricultural soil (%) 9.67E+00 [%]
Steady-state mass fraction in regional
natural soil (%) 1.30E-03 [%]
Steady-state mass fraction in regional
industrial soil (%) 4.80E-04 [%]

D140 © Wood Environment & Infrastructure Solutions UK Limited
February 2019
Doc Ref. 40039CL003i3
Steady-state mass fraction in regional
freshwater sediment (%) 4.14E-03 [%]
Steady-state mass fraction in regional
seawater sediment (%) 1.23E-04 [%]
Steady-state mass in continental
freshwater (kg) 2.24E-03 [%]
Steady-state mass in continental seawater
(kg) 6.23E-02 [%]
Steady-state mass in continental air (kg) 6.12E-03 [%]
Steady-state mass in continental
agricultural soil (kg) 8.72E+01 [%]
Steady-state mass in continental natural
soil (kg) 3.95E-02 [%]
Steady-state mass in continental industrial
soil (kg) 1.46E-02 [%]
Steady-state mass in continental
freshwater sediment (kg) 4.40E-02 [%]
Steady-state mass in continental seawater
sediment (kg) 1.86E-02 [%]
Sensitivity to specific variables
The main sources of uncertainty in the assessment of this substance are:
BCF in fish (literature data range 2E+04 to 4E+05 l/kg)
Koc (literature data range 3.4E+03 to 6.3E+05 l/kg)
log Kow (literature data range 4.4 to 5.9)
The impact of varying each property within the specified range around a selected baseline value from
within the range was explored independently. Refer to Figure 3.11 to Figure 3.15, which illustrate the
impact on relevant predicted exposure concentrations.
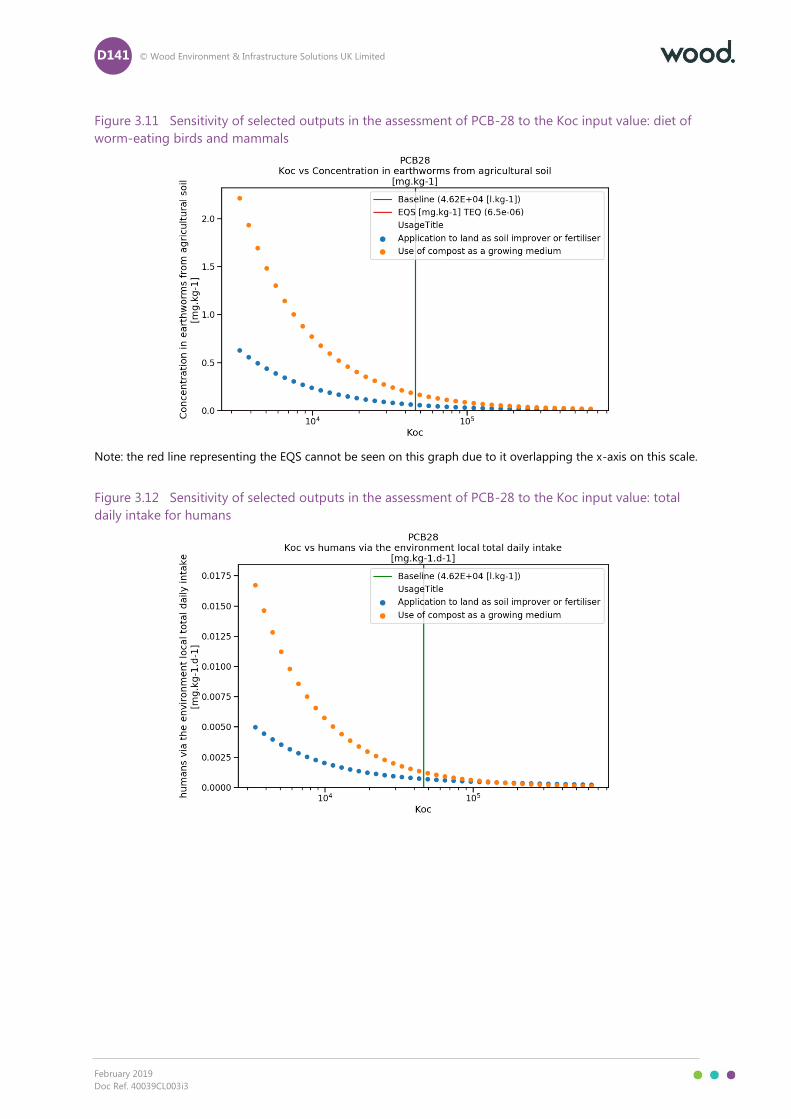
D141 © Wood Environment & Infrastructure Solutions UK Limited
February 2019
Doc Ref. 40039CL003i3
Figure 3.11 Sensitivity of selected outputs in the assessment of PCB-28 to the Koc input value: diet of
worm-eating birds and mammals
Note: the red line representing the EQS cannot be seen on this graph due to it overlapping the x-axis on this scale.
Figure 3.12 Sensitivity of selected outputs in the assessment of PCB-28 to the Koc input value: total
daily intake for humans

D142 © Wood Environment & Infrastructure Solutions UK Limited
February 2019
Doc Ref. 40039CL003i3
Figure 3.13 Sensitivity of selected outputs in the assessment of PCB-28 to the BCF input value: diet of
fish-eating birds and mammals
Note: the red line representing the EQS cannot be seen on this graph due to it overlapping the x-axis on this scale.
Figure 3.14 Sensitivity of selected outputs in the assessment of PCB-28 to the log Kow input value:
total daily intake for humans

D143 © Wood Environment & Infrastructure Solutions UK Limited
February 2019
Doc Ref. 40039CL003i3
Figure 3.15 Sensitivity of selected outputs in the assessment of PCB-28 to the Koc input value: fresh-
water sediment
It can be concluded that:
The variation in Koc input value is of particular significance for human dietary intake
levels, sediment biota, and also predator exposure via diet (earthworms). In respect of
predator exposure the modelled concentrations in prey exceed the EQS for biota at all
values of Koc so the uncertainty does not affect the assessment conclusions.
Within the literature data range of log Kow, there is an impact on the local total daily
intake for humans; a relatively conservative value has been used but in the realistic worst
case exposures could be up to 2x higher than modelled here.
In respect of local Scenario II, the sensitivity of the outcomes to possible losses from the system by
leaching and drainage of excess water has been explored using a fugacity method. For this substance
the proportion of substance in the system distributed to the interstitial water at equilibrium under
‘high water content’ conditions, and hence sensitive to leaching, is ≤1% of the substance present in the
system. Hence, the sensitivity of the exposure scenario to such variations in water management is
considered to be low.
Summary of findings
Table 3.94 below presents the summary of key findings from the risk assessment of PCB-28 that has
been made in this project. The findings are discussed further below the table.
Table 3.94 Summary of key findings for exposure of PCB28 via use of compost and digestates
Key findings of the risk assessment of PCB28 in contaminated composts and digestates
Overall range of compost and digestate concentrations 0.001 – 1.2 mg/kg dry wt. (higher values up to 9-10 mg
PCB6/kg dry wt. appear to be exceptional)
Major raw material sources Concentrations above ca. 0.1 µg PCBs/kg dry wt. are reported
for digestates derived from biowaste-food and garden waste,
biowaste and green waste compost, sewage sludge compost,

D144 © Wood Environment & Infrastructure Solutions UK Limited
February 2019
Doc Ref. 40039CL003i3
Key findings of the risk assessment of PCB28 in contaminated composts and digestates
C/Ds from source separation and compost made from low-
grade waste wood.
Safe limit concentration in compost and digestate Not applicable (risk characterisation ratio not definable).
Main concern(s) arising Source of exposure of POP; significant cumulative loads at
steady state; absolute concentrations exceeding previously
published measured concentrations in foods; absolute
concentrations in compost/digestate exceeding existing local
limit values / guide values (but not exceeding EC Regulation
1195/2006); predator exposure via diet (local scenarios I and
II) exceed the EQS for biota (Directive 2008/105/EC as
amended (2013/39/EU))
Effects considered in the main concern hazard(s) POP; basis of EQS is not stated in the Directive and is unclear.
Uncertainties and their implications Range of concentrations in composts / digestates means
release amounts could be under- or over-estimated in this
model.
Sensitivity of exposures to variations in water management in
the local container growing scenario is low.
Other remarks
As POPs, it noteworthy that PCBs have been detected in freshly-produced composts and digestates at
several different locations in recent years. Their presence may result from atmospheric deposition of
emissions from combustion or municipal solid waste incineration rather than originating from the raw
material waste streams. This could be investigated further if needed.
The highest reported concentrations especially in digestates in Norway (reported by Govasmark et al.,
2011) appear to significantly exceed the national limit value for PCBs in that region (Forskrift om
organisk gjødsel; Mattilsynet, 2005; 1.2 mg/kg DM). These high occurrence concentrations seem to
mainly relate to digestates prepared from biowastes food and garden wastes.
The highest contribution(s) to human exposure via the environment arising from the application of
C/D is mainly associated with (dietary consumption of root vegetables). The estimated exposures
arising from the application of C/D are high compared with reported mean/median levels of PCBs in
foodstuffs including vegetables, in Western Europe as summarised by WHO (2002). This is the case
even when lower concentrations were assumed in the exposure model (for example, the ‘low
concentration’ exposure assessment for PCB-28 results in concentrations of 2E-03 mg/kg and 0.03
mg/kg in root tissue of plants arising from application to land (local scenario I) and container growing
(local scenario II) respectively. However, the WHO summary reports a weighted mean of 0.04 pg
PCBs/g whole food (equivalent to 4E-08 mg/kg) for vegetable products.
At steady state, 97% of the total mass remains within the region + continent56, suggesting that there is
relatively low potential transfer over long distances following release via the handling and application
of C/D. The total mass in the region + continent at steady state is very high at 270 t. Even when a
comparable scenario is assessed using a lower level release, ca. 15 t is modelled to remain within the
56 This refers to the regional and continental spatial scales in the EUSES model. Refer to Section 1.7 and the Annex for further
information.
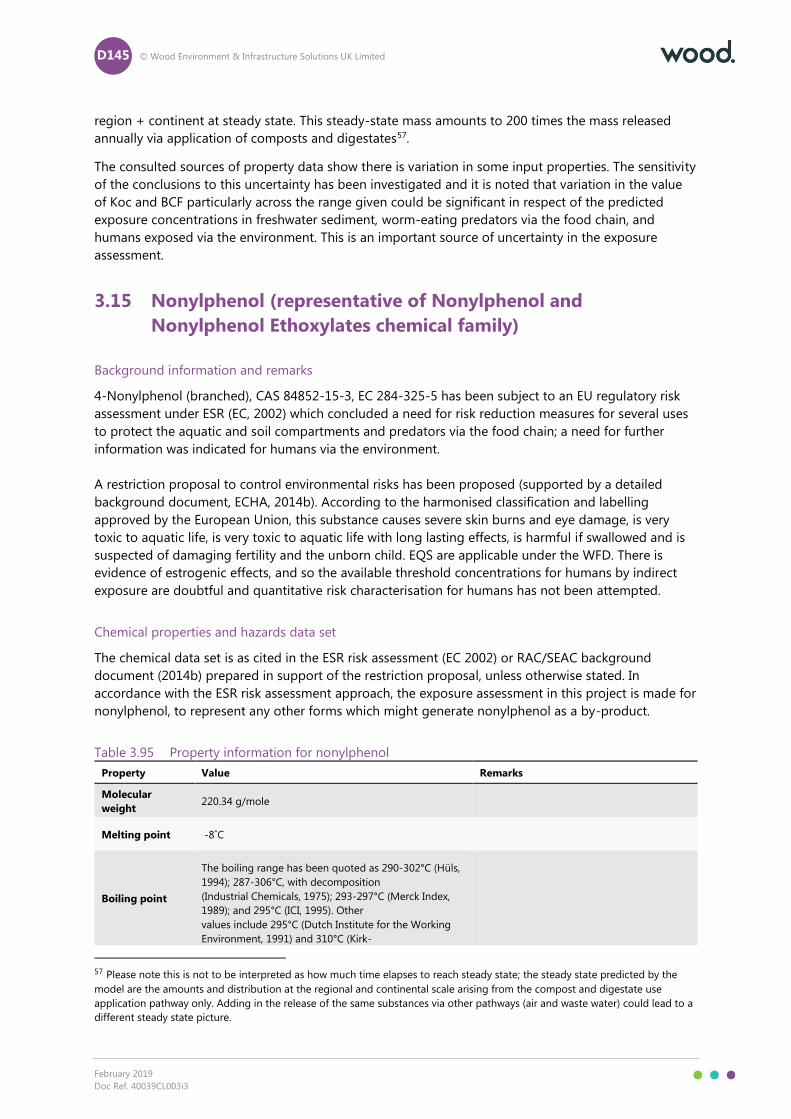
D145 © Wood Environment & Infrastructure Solutions UK Limited
February 2019
Doc Ref. 40039CL003i3
region + continent at steady state. This steady-state mass amounts to 200 times the mass released
annually via application of composts and digestates57.
The consulted sources of property data show there is variation in some input properties. The sensitivity
of the conclusions to this uncertainty has been investigated and it is noted that variation in the value
of Koc and BCF particularly across the range given could be significant in respect of the predicted
exposure concentrations in freshwater sediment, worm-eating predators via the food chain, and
humans exposed via the environment. This is an important source of uncertainty in the exposure
assessment.
3.15 Nonylphenol (representative of Nonylphenol and
Nonylphenol Ethoxylates chemical family)
Background information and remarks
4-Nonylphenol (branched), CAS 84852-15-3, EC 284-325-5 has been subject to an EU regulatory risk
assessment under ESR (EC, 2002) which concluded a need for risk reduction measures for several uses
to protect the aquatic and soil compartments and predators via the food chain; a need for further
information was indicated for humans via the environment.
A restriction proposal to control environmental risks has been proposed (supported by a detailed
background document, ECHA, 2014b). According to the harmonised classification and labelling
approved by the European Union, this substance causes severe skin burns and eye damage, is very
toxic to aquatic life, is very toxic to aquatic life with long lasting effects, is harmful if swallowed and is
suspected of damaging fertility and the unborn child. EQS are applicable under the WFD. There is
evidence of estrogenic effects, and so the available threshold concentrations for humans by indirect
exposure are doubtful and quantitative risk characterisation for humans has not been attempted.
Chemical properties and hazards data set
The chemical data set is as cited in the ESR risk assessment (EC 2002) or RAC/SEAC background
document (2014b) prepared in support of the restriction proposal, unless otherwise stated. In
accordance with the ESR risk assessment approach, the exposure assessment in this project is made for
nonylphenol, to represent any other forms which might generate nonylphenol as a by-product.
Table 3.95 Property information for nonylphenol
Property Value Remarks
Molecular
weight 220.34 g/mole
Melting point -8˚C
Boiling point
The boiling range has been quoted as 290-302°C (Hüls,
1994); 287-306°C, with decomposition
(Industrial Chemicals, 1975); 293-297°C (Merck Index,
1989); and 295°C (ICI, 1995). Other
values include 295°C (Dutch Institute for the Working
Environment, 1991) and 310°C (Kirk-
57 Please note this is not to be interpreted as how much time elapses to reach steady state; the steady state predicted by the
model are the amounts and distribution at the regional and continental scale arising from the compost and digestate use
application pathway only. Adding in the release of the same substances via other pathways (air and waste water) could lead to a
different steady state picture.

D146 © Wood Environment & Infrastructure Solutions UK Limited
February 2019
Doc Ref. 40039CL003i3
Othmer, 1993).
The actual boiling/decomposition range will depend on
the purity and origin of the material and
the values quoted here can be considered
representative of the commercially available material
Vapour pressure Approximately 0.3 Pa at 25°C
Water solubility
Although no data have been found to show the
solubility variation of a particular brand of
nonylphenol with pH, the solubility is likely to be
influenced by this factor. At environmental
pHs, it is thought that nonylphenol would be present
mainly in the undissociated form (pKa of
10; see Section 1.3.13). A water solubility of 6 mg/l at
20ºC will be used for environmental
modelling purposes.
log Kow Two values are used in the 2014 assessment: 4.48 and
5.4.
The higher value is more conservative and is
used in the baseline assessment as a
conservative approach.
Henry’s law
constant 11.02 Pa.m3.mol-1.
Koc
Koc values derived from both alternative values of log
Kow were examined in the RAC/SEAC background
document. This assessment also considers the sensitivity
of the outcomes to this variation.
BCF
It is clear from the available data that nonylphenol
bioconcentrates to a significant extent in aquatic
species, with BCFs (on a fresh weight basis) of up to
1,300 in fish. However, this value may overestimate the
BCF; more reliable values with a mean of 741 have been
measured, which are of a similar order of magnitude.
Bioconcentration factors of around 2,000-3,000 have
been measured in mussels. The BCF calculated from the
log Kow of 4.48, using the TGD equation, is 1,280, which
agrees well with the measured values.
The calculated value of 1,280 will be used in the risk
assessment.
Biodegradability
A large set of half-lives are summarised (see ECHA,
2014b for further details).
Nonylphenol is not persistent in freshwater or estuarine
sediment, since t1/2 <120 d. In EUSES, a half-life of 99d
at 25°C has been entered.
Nonylphenol is not persistent in soil, since t1/2 <120 d.
In EUSES, a half-life of 40 d at 25°C has been entered.
Based upon the available biodegradation
data, nonylphenol is inherently
biodegradable, and so the rate constant for
biodegradation in a WWTP is taken as 0.1 h-1
for modelling of the removal during
wastewater treatment at plants producing or
processing nonylphenol itself.
Half-lives for biodegradation in soil of 300
days and surface water of 150 days have
been estimated. (ESR RAR EC 2002, Page 75)
Half-life in air
Nonylphenol released to the atmosphere is likely to be
degraded by reaction with hydroxyl radicals, with a half-
life of around 0.3 days.

D147 © Wood Environment & Infrastructure Solutions UK Limited
February 2019
Doc Ref. 40039CL003i3
Threshold hazard
values if available Value Remarks
PNECaquatic
(freshwater)
PNECwater of 0.39 μg/l - page 163 (RAC/SEAC
background document).
A very similar value of 0.3 μg/l is defined for the
annual average EQS in inland surface waters; MAC
EQS of 2.0 μg/l (Directive 2008/105/EC as
amended (2013/39/EU))
PNECsediment
(freshwater) 4.62 mg NP/kg dry wt.
RAC/SEAC background document (ECHA,
2014b)
PNECsoil 1.2 mg NP/kg dry wt..
RAC/SEAC background document (based on
enchytraeid reproductive effects). This updates
the PNECsoil of 0.3 mg/kg wet wt used in the
original ESR RAR stating it the data is now
considered unreliable.
PNECoral predator PNECoral is 10 mg/kg food
RAC/SEAC background document p69 (based
on mammalian reproductive effects) concurs
with ESR RAR EC 2002, Page 134
DNEL general
population oral
not discussed in the 2013 restriction proposal
which focuses on environment only.
Other relevant data
Occurrence data set
Table 3.96 presents a summary of the reported concentrations of nonylphenol and its ethoxylates in
composts and digestates. This is based on the survey of the available literature collected in Task 2 of
the project and reported in the main project report.
Table 3.96 Reported occurrence of nonylphenol in composts and digestates
Concentrations in
composts/digestates
Value - units of mg/kg dry
wt. Remarks
Composts - data
availability
6 data points of which 1 is a range (Bavaria), two others are
highest and second-highest from same data set (across several
member states), and 3 are different samples from the same study
(Finland)
Compost - minimum
concentration 0.1 Actually reported as a limit value, <100 µg/kg TM (Bavaria, 2015)
Compost - mid-range
or average
concentration
10.4
The average across all reported measured values is approx 12
mg/kg (approx 7 if the high value of 47 is excluded). This is close
to the value of 10.4 cited by Saveyn and Eder so this value is
used.
Compost - maximum
concentration 47
Highest single reported value is 47 mg/kg dry wt. (FI); a second
value of 26 mg/kg is available for a different sample from the
same location and a value of 10.4 mg/kg is reported as the
maximum for green composts from several different member
states. In view of the small data set the highest reported value is
used as the max.

D148 © Wood Environment & Infrastructure Solutions UK Limited
February 2019
Doc Ref. 40039CL003i3
Concentrations in
composts/digestates
Value - units of mg/kg dry
wt. Remarks
Digestates - data
availability
5 data points of which two are ranges from the same data set
(Bavaria), and 3 are different samples from the same study
(Finland)
Digestate - minimum
concentration 0.1 Actually reported as a limit value, <100 µg/kg TM (Bavaria, 2015)
Digestate - mid-range
or average
concentration
2
Excluding the high value below, the range is aprox <0.1 - 2.0
mg/kg. The average across all values including the high of 50
mg/kg is 8.0. Selecting a value of 2.0 mg/kg is close to the upper
end of the range for both locations with measurements,
excluding the highest single value.
Digestate - maximum
concentration 50
Highest reported value is 50 mg/kg dry wt. (FI) whereas the
highest mentioned limit 'guide' value is 25 mg/kg dry wt. (AGW).
In view of the small data set the highest reported value is used as
the max.
These concentrations in compost and in digestate equate to the following release amounts at the
regional and continental scale.
Table 3.97 Estimated regional and continental release amounts
Parameter Value
Mass of substance in EU-28 in compost (kg/year) 91,728
Mass of substance in EU-28 in digestate (kg/year) 70,560
Total regional emission to surface water (kg/day) 1.2
Total regional emission to soil (kg/day) 43
Total continental emission to surface water (kg/day) 11
Total continental emission to agricultural soil (kg/day) 389
These values have been applied in estimating the exposure concentrations for this substance arising
from use of composts and digestates. Exposures have been estimated for two concentration scenarios:
A more conservative assessment is derived using the maximum reported concentrations
in estimating the local releases from the two scenarios, with a mid-range concentration
used in estimating the regional background.
A less conservative assessment is derived separately using the mid-range reported
concentrations in estimating the local releases from the two scenarios, with a minimum
concentration used in estimating the regional background.
Table 3.98 below summarises background exposure data compiled as part of the ESR risk assessment
(EC 2002).
Table 3.98 Reported background concentrations of nonylphenol in the environment
PECregional Value Remarks
Air

D149 © Wood Environment & Infrastructure Solutions UK Limited
February 2019
Doc Ref. 40039CL003i3
Surface water 0.60 μg/l PECs based on direct emissions and NPE
breakdowns
Sediment 103 μg/kg table 3.18 ESR RAR EC 2002, page 136
Agricultural soil
Soil pore
water/ground water
Natural soil
Urban/industrial soil
Other relevant data see also table 3.18 ESR RAR EC 2002, page
136
Generic exposure scenario outcomes
The assessment has estimated local and background exposures of nonylphenol resulting from the use
scenarios defined in Section 1, using the chemical property data and concentration in composts and
digestates in the previous sections as inputs. The predicted environmental exposure concentrations are
as summarised in Table 3.99 below.
Table 3.99 Predicted exposures for nonylphenol arising from use of composts and digestates
Scenario I Units
PECagricultural soil 8.38E-02 [mg/kg dry wt.]
PECgrassland soil 2.11E-02 [mg/kg dry wt.]
PEC in groundwater 9.16E-05 [mg/l]
PECfreshwater 8.63E-05 [mg/l]
PECfreshwater-sediment 2.58E-01 [mg/kg dry wt.]
Humans via the environment: local
total daily intake 1.15E-03 [mg.kg-1.d-1]
Humans via the environment: daily
dose via drinking water 2.62E-06 [mg.kg-1.d-1]
Humans via the environment:
dominant exposure source and
fraction
Root crops 84%
Secondary poisoning – freshwater
fish-eating birds and mammals 5.69E-02 [mg/kg wet wt.]
Secondary poisoning – worm-eating
birds and mammals 1.29E-01 [mg.kg-1]
Scenario II Units

D150 © Wood Environment & Infrastructure Solutions UK Limited
February 2019
Doc Ref. 40039CL003i3
PECagricultural soil 1.55E+01 [mg/kg dry wt.]
Humans via the environment: local
total daily intake 2.75E-01 [mg.kg-1.d-1]
Humans via the environment:
dominant exposure source and
fraction
Root Crops 100%
Secondary poisoning – worm-eating
birds and mammals 3.59E+01 [mg.kg-1]
Regional background Units
Regional PEC in surface water (total) 2.66E-06 [mg/l]
Regional PEC in air (total) 1.87E-08 [mg.m-3]
Regional PEC in agricultural soil
(total) 8.25E-04 [mg/kg wet wt.]
Regional PEC in pore water of
agricultural soils 1.57E-06 [mg/l]
Regional PEC in natural soil (total) 7.96E-07 [mg/kg wet wt.]
Regional PEC in industrial soil (total) 7.96E-07 [mg/kg wet wt.]
Regional PEC in sediment (total) 2.95E-03 [mg/kg wet wt.]
Table 3.100 presents the predicted steady state mass balance in the region and continent. Please note
that the steady state predicted by the model are the amounts and distribution at the regional and
continental scale arising from the C/D use application pathway only. Adding in the release of the same
substances via other pathways (air and waste water) could lead to a different steady state balance.
Table 3.100 Predicted background exposures for nonylphenol at steady state arising from use of
composts and digestates
Steady state mass Units
Total steady-state mass (region +
continent) 6.93E+01 [t]
Steady-state mass in regional
freshwater (kg) 9.56 [kg]
Steady-state mass in regional
seawater (kg) 0.97 [kg]
Steady-state mass in regional air
(kg) 0.756 [kg]
Steady-state mass in regional
agricultural soil (kg) 6.73E+03 [kg]
Steady-state mass in regional
natural soil (kg) 0.731 [kg]

D151 © Wood Environment & Infrastructure Solutions UK Limited
February 2019
Doc Ref. 40039CL003i3
Steady-state mass in regional
industrial soil (kg) 0.271 [kg]
Steady-state mass in regional
freshwater sediment (kg) 122 [kg]
Steady-state mass in regional
seawater sediment (kg) 3.19 [kg]
Steady-state mass in continental
freshwater (kg) 98.3 [kg]
Steady-state mass in continental
seawater (kg) 381 [kg]
Steady-state mass in continental air
(kg) 10.9 [kg]
Steady-state mass in continental
agricultural soil (kg) 6.06E+04 [kg]
Steady-state mass in continental
natural soil (kg) 5.33 [kg]
Steady-state mass in continental
industrial soil (kg) 1.98 [kg]
Steady-state mass in continental
freshwater sediment (kg) 1.25E+03 [kg]
Steady-state mass in continental
seawater sediment (kg) 62.5 [kg]
Steady state mass fraction Units
Total steady-state mass fraction
(region + continent) 9.44E+01 [%]
Steady-state mass fraction in
regional freshwater (%) 0.013 [%]
Steady-state mass fraction in
regional seawater (%) 1.32E-03 [%]
Steady-state mass fraction in
regional air (%) 1.03E-03 [%]
Steady-state mass fraction in
regional agricultural soil (%) 9.18 [%]
Steady-state mass fraction in
regional natural soil (%) 9.97E-04 [%]
Steady-state mass fraction in
regional industrial soil (%) 3.69E-04 [%]
Steady-state mass fraction in
regional freshwater sediment (%) 0.166 [%]
Steady-state mass fraction in
regional seawater sediment (%) 4.34E-03 [%]

D152 © Wood Environment & Infrastructure Solutions UK Limited
February 2019
Doc Ref. 40039CL003i3
Steady-state mass in continental
freshwater (kg) 0.134 [%]
Steady-state mass in continental
seawater (kg) 0.519 [%]
Steady-state mass in continental air
(kg) 0.0149 [%]
Steady-state mass in continental
agricultural soil (kg) 82.6 [%]
Steady-state mass in continental
natural soil (kg) 7.27E-03 [%]
Steady-state mass in continental
industrial soil (kg) 2.69E-03 [%]
Steady-state mass in continental
freshwater sediment (kg) 1.71 [%]
Steady-state mass in continental
seawater sediment (kg) 0.0853 [%]
Table 3.101 Quantitative risk characterisation conclusions for nonylphenol in composts and digestates
Scenario I
RCR for local soil 6.99E-02
RCR for local freshwater 2.21E-01
RCR for local freshwater-sediment 5.57E-02
RCR for Humans via the environment: local total daily
intake
RCR for fish-eating birds and mammals (fresh water) 5.69E-03
RCR for worm-eating birds and mammals 1.29E-02
Scenario II
RCR for local soil 1.29E+01
RCR for Humans via the environment: local total daily
intake
RCR for worm-eating birds and mammals 3.59E+00
Regional
RCR for regional soil 7.79E-04
RCR for regional freshwater 6.51E-03
RCR for regional freshwater-sediment 2.93E-03
It can be seen that local exposure concentrations for terrestrial organisms and secondary poisoning (in
worm-eating birds and mammals) arising from the container growing scenario (local scenario II)
exceed the PNECs for these organisms. It is noted however that the container growing scenario is likely

D153 © Wood Environment & Infrastructure Solutions UK Limited
February 2019
Doc Ref. 40039CL003i3
to be limited to exposure during a single growing season and in a container which may not be in
contact with soil. It could be that the food chain envisaged by the model would not be fully
established on this time scale. Regional RCRs and RCRs for the aquatic compartment including
sediments do not indicate unacceptable risks, although it is noted that the local PEC in fresh water
arising from local scenario I (application on land) is approaching 1.
For scenario II, the levels in soil, earthworms and crops are directly proportional to the level in
compost. In order to give an adequate MOS for terrestrial organisms and secondary poisoning (or a
RCR <1) the maximum level of nonylphenol present in compost would need to be around
3.5 mg/kg dry weight.
Sensitivity to specific variables
The main sources of uncertainty in the assessment of this substance are:
Kow (reliable values within range 4.4 to 5.5)
Wide range in the reported concentration levels of the substance in C/D
The impact of varying these parameters within the specified range around the baseline value was
explored. Refer to Figure 3.16 to Figure 3.17, and to Table 3.102 below, which illustrate the impact on
relevant predicted exposure concentrations. The inputs used in the ‘more conservative’ and ‘less
conservative’ assessments are explained in the Occurrence data set section.
Figure 3.16 Sensitivity of selected outputs in the assessment of nonylphenol to the log Kow input
value: freshwater sediment

D154 © Wood Environment & Infrastructure Solutions UK Limited
February 2019
Doc Ref. 40039CL003i3
Figure 3.17 Sensitivity of selected outputs in the assessment of nonylphenol to the log Kow input
value: diet of worm-eating birds and mammals
Table 3.102 Sensitivity of selected outputs in the assessment of nonylphenol to the concentrations
reported in composts and digestates
More conservative
(realistic worst case)
Less conservative (3.5
mg/kg dry wt.t case) Units
PECagricultural soil – local
scenario I 8.38E-02 5.87E-03 [mg/kg dry wt.]
PECagricultural soil – local
scenario II 1.55E+01 1.16E+00 [mg/kg dry wt.]
Humans via the
environment: local total
daily intake – local scenario
I
1.15E-03 8.58E-05 [mg.kg-1.d-1]
Humans via the
environment: local total
daily intake – local scenario
II
2.75E-01 2.05E-02 [mg.kg-1.d-1]
Total steady-state mass
(region + continent) 6.93E+01 6.59E+01 [t]
Total steady-state mass
fraction (region +
continent)
9.44E+01 9.44E+01 [%]
Regional PEC in surface
water (total) 2.66E-06 2.53E-06 [mg/l]
Secondary poisoning –
freshwater fish-eating birds
and mammals – local
scenario I
5.69E-02 6.84E-03 [mg/kg wet wt.]
Secondary poisoning –
worm-eating birds and
mammals – local scenario I
1.29E-01 1.09E-02 [mg.kg-1]
Secondary poisoning –
worm-eating birds and
mammals – local scenario II
3.59E+01 2.68E+00 [mg.kg-1]

D155 © Wood Environment & Infrastructure Solutions UK Limited
February 2019
Doc Ref. 40039CL003i3
It can be concluded that:
If the lower log Kow value is correct then sediment PEC (local scenario I), secondary
poisoning of worm-eating birds and mammals (local scenario II), and total local daily
intake for humans could be lower than modelled. The baseline assessment is reasonably
conservative.
At the local scale, limiting the concentration of nonylphenol in composts and digestates
to a maximum of 3.5 mg/kg dry wt.t could be expected to reduce the predicted exposure
concentrations of nonylphenol in important compartments by a factor of more than 10
compared to the realistic worst case, sufficient to manage risks.
At the regional scale at steady state, the difference between the two scenarios is not very
significant for nonylphenol.
In respect of local Scenario II, the sensitivity of the outcomes to possible losses from the system by
leaching and drainage of excess water has been explored using a fugacity method. For this substance
the proportion of substance in the system distributed to the interstitial water at equilibrium under
‘high water content’ conditions, and hence sensitive to leaching, is ≤1% of the substance present in the
system. Hence, the sensitivity of the exposure scenario to such variations in water management is
considered to be low.
Summary of findings
Table 3.103 below presents the summary of key findings from the risk assessment of nonylphenol that
has been made in this project. The findings are discussed further below the table.
Table 3.103 Summary of key findings for exposure of nonylphenol via use of compost and digestates
Key findings of the risk assessment of nonylphenol in contaminated composts and digestates
Overall range of compost and digestate concentrations <0.1 - 50 mg/kg dry wt.
Major raw material sources Concentrations of ca. 10 mg/kg and above reported for
green waste compost and municipal sewage sludge-derived
products
Safe limit concentration in compost and digestate 3.5 mg/kg dry wt for compost for container growing
Main concern(s) arising Soil organisms and worm-eating predators exposed via the
food chain, both for compost for container growing.
Significant cumulative loads at steady state. Source of
exposure of humans via diet to endocrine disrupting
substance.
Effects considered in the main concern hazard(s) Soil PNEC based on enchytraeid reproductive effects.
Predator PNECoral based on mammalian reproductive
effects.
Uncertainties and their implications Two alternative log Kows are available and some protection
targets are affected by the variation within the indicated
range.
Sensitivity of exposures to variations in water management
in the local container growing scenario is low.
Other remarks It is noted that the container growing scenario is likely to be
limited to exposure during a single growing season and in a

D156 © Wood Environment & Infrastructure Solutions UK Limited
February 2019
Doc Ref. 40039CL003i3
Key findings of the risk assessment of nonylphenol in contaminated composts and digestates
container which may not be in contact with soil. It could be
that the food chain envisaged by the model would not be
fully established on this time scale.
The highest reported concentrations in C/D already appear to exceed the national limit value for
digestates (AGW du 14/06/2001 favorisant la valorisation de certains déchets (BE), guide value of 25
mg/kg dry wt. applicable in Belgium; Slambekendtgørelsen value 10 mg/kg dry wt. applicable in
Denmark). The high occurrence concentrations were found in digestates prepared from municipal
sewage sludge (Finland, Kapanen et al., 2013) although several other similar digestates and composted
sludges reported lower values (even from the same literature source).
To the extent that risk characterisation has been possible, unacceptable risks are indicated for the
container growing scenario (local scenario II), specifically in respect of the local soil and secondary
poisoning (in worm-eating birds and mammals) protection targets (RCRs of ca. 13 and 3.6
respectively). While risk characterisation for humans exposed via the environment has not been
quantified, it is noted that the predicted local total daily intake associated with either mode of use
(application on land or container growing), modelled to be in the range ca. 2E-03 – 0.3 mg/kg bw/d, is
comparable with the daily human intake for local exposures associated with the various industrial use
scenarios modelled in the ESR RAR (EC, 2002). Exposure of humans via the environment is significantly
dominated by consumption of root crops.
The estimated regional exposures arising from the application of C/D are very low compared with
natural background concentrations in fresh water and sediments based on data cited in the ESR RAR
(EC, 2002). The annual average EQS for inland surface waters (Directive 2008/105/EC as amended
(2013/39/EU)) is not predicted to be exceeded.
It is notable that, at steady state, approximately 94% of the total mass remains within the region +
continent58, with the majority remaining within agricultural soil. This suggests there is relatively low
transfer over long distances following release via the handling and application of C/D.
The total mass in the region + continent at steady state is 69 t, when relatively conservative
assumptions are made in regard to the concentration of nonylphenol in the compost/digestate. This
steady-state mass amounts to 0.4 times the mass released annually via application of composts and
digestates59, suggesting that long-term gradual accumulation is not anticipated from exposure via this
source.
The value of log Kow has been identified in the RAC/SEAC assessment (ECHA, 2014b) as a key
uncertainty, with possible impacts on various other parameters derived from it (particularly
bioconcentration factor for earthworms and organic carbon adsorption coefficient Koc). In terms of the
present assessment, it is noted that the two different values available for log Kow would indicate a
relatively small difference in the predicted exposure concentrations in sediment (scenario I), although
the PNEC is still not exceeded; and in the local total daily intake for humans via the environment. This
58 This refers to the regional and continental spatial scales in the EUSES model. Refer to Section 1.7 and the Annex for further
information. 59 Please note this is not to be interpreted as how much time elapses to reach steady state; the steady state predicted by the
model are the amounts and distribution at the regional and continental scale arising from the compost and digestate use
application pathway only. Adding in the release of the same substances via other pathways (air and waste water) could lead to a
different steady state picture.

D157 © Wood Environment & Infrastructure Solutions UK Limited
February 2019
Doc Ref. 40039CL003i3
is therefore not considered to be an important source of uncertainty in the exposure assessment for
these protection targets.
3.16 Benzo[a]pyrene (representative of PAH16 chemical family)
PAH are generated as by-products of combustion or pyrolysis of organic matter and hence almost
always occur as mixtures. The PAH selected for substance-specific assessment are substances of higher
molecular mass. There are precedents for assessing subgroups of PAH in regulatory contexts, and for
use of certain PAH substances and small groups of PAHs as reference markers for the wider chemical
family, to simplify analytical monitoring.
Background information and remarks
Benzo[a]pyrene (CAS 50-32-8, EU 200-028-5) is also known as benzo[def]chrysene. According to the
harmonised classification and labelling under CLP, this substance may cause genetic defects, may
cause cancer, may damage fertility and may damage the unborn child, is very toxic to aquatic life, is
very toxic to aquatic life with long lasting effects and may cause an allergic skin reaction.
It is an SVHC included in the candidate list for authorisation based on CMR, PBT and vPvB properties.
Some uses are restricted under annex XVII of REACH.
PAHs are frequently addressed as a group and benzo[a]pyrene is frequently used as a marker
compound. Being among the most toxic of the PAH, it has particular significance as a reference
compound. for example, EQS (annual average, biota levels) are only defined for benzo[a]pyrene as a
marker for the group of priority PAH.
Chemical properties and hazards data set
As a CMR and SVHC, the reliability of any threshold no-effect value is highly uncertain. Risk
characterisation has not been attempted here.
Table 3.104 below summarises the relevant property data. The data are mainly taken from the ESR RAR
for coal tar pitch high-temperature (EC 2008d); where information from other sources is included this
is indicated in the Table.
Table 3.104 Property information for benzo[a]pyrene
Property Value Remarks
Molecular weight 252.32
Melting point 175C
178.1
ESR RAR for CTPHT (2008d) - table 1.3
EHC 202 (1998)
Boiling point 496
Vapour pressure 7.3E-7 Pa EHC 202 (WHO, 1998) citing Murray JJ et al
1974)
Water solubility
1.54 µg/l (column method; temperature not
stated)
3.8 µg/l at 25c
ESR RAR for CTPHT (2008d)
EHC 202 (WHO, 1998)

D158 © Wood Environment & Infrastructure Solutions UK Limited
February 2019
Doc Ref. 40039CL003i3
Property Value Remarks
log Kow
6.13 (slow stirring method, temperature not
stated)
6.5
ESR RAR for CTPHT (2008d)
EHC 202 (WHO, 1998)
Henry’s law
constant
0.034 Pa.m3/mol (gas stripping method) (20 °C)
EHC states H = 3.4E-05 kPa at 20C (unusual units
for H - should it be kPa/m3/mol?)
EPI exp-db match: 0.0463Pam3/mol at 25C, Ten
Hulscher, TEM et al 1992, which seems to
correspond well
ESR RAR for CTPHT (2008d)
EHC 202 (WHO, 1998)
Koc
log Koc 5.92 (Karickhoff, 1979) applied in ESR RAR
of CTPHT (2008)
logKoc values:
6.66 (LSC), Eadie et al. (1990)
6.26 (Average on sediments) Kayal & Connell
(1990)
8.3 (Specified particulate) Broman et al. (1990)
4.0 (Predicted to be dissolved) Broman et al.
(1990)
Karickhoff value selected for use in EUSES, other
values taken from EHC202 (WHO, 1998) table 25
BCF
values available for numerous types of organisms.
SVHC support document gives key BCFs for fish as
377 (13°C) and 608 (23°C) which is assumed to be
definitive.
BCFs of benzo[a]pyrene in fish: ca. 3 - 4900
depending on species, duration, concentration,
and method for calculating BCF, but may not all
be reliable data.
ESR RAR for CTPHT (2008d)
EHC 202 (WHO, 1998)
Biodegradability
Mean half-lives: 1700h in water, 17000h in soil
and 55000h in sediment (temperatures not
stated; assumed to be 25C)
In a study with sandy loams, forest soil, and
roadside soil partially loaded with sewage sludge
from a municipal treatment plant, the following
half-lives (in days) were found: 120-258 for benzo
[a]pyrene (Wild & Jones, 1993).
3.5 × 10⁻⁵ h-1 19 800 h (Estimated rate constant
in soil and water) (Ryan & Cohen (1986)
ESR RAR for CTPHT (2008d)
EHC 202 (WHO, 1998)
708d used for soil in the EUSES run.
Many values also presented in table 29
encompassing a wide range.
Half-life in air
AOP predicts rate constant 50E-12
cm3/molecule.sec, equivalent to just a few hours.
However the EHC monograph cites Mackay
(definitive author on environmental fate and
fugacity) who proposes mean 170h and range
100-300 h in air for benzo[a]pyrene. This may be
based on transport and distribution phenomena
rather than degradation. it is cited under
Transformation however.
Threshold hazard
values if available Value Remarks
PNECaquatic
(freshwater)
Annual average EQS 1.7E-04 µg/l and MAC EQS
0.27 µg/l (for inland surface water) (Directive
2008/105/EC as amended (2013/39/EU))
0.022 µg/l (PNEC in ESR RAR for CTPHT)
AA for inland surface water and other surface
water in EQS directive 2008 was 0.05 µg/l. MAC
for inland surface water and other surface water
in EQS directive 2008 (L348/84) was 0.1 µg/l.

D159 © Wood Environment & Infrastructure Solutions UK Limited
February 2019
Doc Ref. 40039CL003i3
Property Value Remarks
UV exposure has been shown to enhance long-
term toxicity.
PNECsediment
(freshwater) 1.83 mg/kg dry wt. (EQPM - from ESR RAR CTPHT)
PNECsoil 0.053 mg/kg dry wt. (measured) (ESR RAR CTPHT)
PNECoral predator 5 µg/kg applicable (Directive 2008/105/EC as
amended (2013/39/EU))
A lower EQS for biota (fish) was proposed (COM
2011)
DNEL general
population oral BMDL10 = 0.07 mg/kg b.w. per day
EFSA scientific opinion (2008b) (derived from 2-
year carcinogenicity study on coal tar mixtures
by Culp et al. (1998)) (this value is derived using
the multi-stage model).
Other relevant
data
Benzo[a]pyrene is CMR and SVHC with
harmonised C&L for very toxic for the
environment. According to the harmonised
classification and labelling approved by the
European Union, this substance may cause
genetic defects, may cause cancer, may damage
fertility and may damage the unborn child, is
very toxic to aquatic life, is very toxic to aquatic
life with long lasting effects and may cause an
allergic skin reaction.
Occurrence data set
Table 3.105 presents a summary of the reported concentrations of benzo[a]pyrene and other PAH in
composts and digestates. This is based on the survey of the available literature collected in Task 2 of
the project and reported in the main project report.
No substance-specific data for benzo[a]pyrene were reported in digestates although a small number
of measured values in composts are available. This represents an uncertainty in the exposure
assessment; in the absence of data it has been assumed that measurements in composts (particularly
composts derived from sewage sludge) would be reasonably representative of digestates.
Table 3.105 Reported occurrence of benzo[a]pyrene in composts and digestates
Concentrations in
composts/digestates Value - units of mg/kg dry wt. Remarks
Composts - data
availability
Very few data specifically for the named structure:
4 values available for benzo[a]pyrene specifically:
two separate values sampled at two sites. all state
compost although two are from sewage sludge.
The data set of generic PAH (PAH11 / PAH16 /
PAH general / 4-ring PAH) is much larger with
values available for a wide range of member
states and several different sampling years. Many
reported values are already ranges / averages.
Compost - minimum
concentration 0.04
Lowest value for B[a]P specifically is actually <0.04
mg/kg. The value is taken as such.

D160 © Wood Environment & Infrastructure Solutions UK Limited
February 2019
Doc Ref. 40039CL003i3
Compost - mid-range
or average
concentration
0.172
Average of all available figures for B(a)P as such is
0.172 mg/kg dry wt.. Average across all reported
values for PAH [4-ring] is about 2.9 mg/kg dry wt..
Compost - maximum
concentration 1.5
NF U44-051 and NF U44-095 (Benzo[a]pyrene
specific) proposes 1.5 mg/kg dm limit. For the
PAH family, a relevant high percentile value of
approx 6 mg/kg dry wt. is reasonable (consistent
with FPR limit).
Digestates - data
availability Using the same values as above.
Digestate - minimum
concentration 0.04
Digestate - mid-range
or average
concentration
0.172
Based on average for Benzo[a]pyrene (in
composts). Note: Average across all reported
values for PAH [4-ring] is about 1.9 mg/kg dry wt..
Digestate - maximum
concentration 1.5
These concentrations in compost and in digestate equate to the following release amounts at the
regional and continental scale.
Table 3.106 Estimated regional and continental release amounts
Parameter Value
Mass of substance in EU-28 in compost (kg/year) 13,230
Mass of substance in EU-28 in digestate (kg/year) 52,920
Total regional emission to surface water (kg/day) 0.51
Total regional emission to soil (kg/day) 18
Total continental emission to surface water (kg/day) 4.6
Total continental emission to agricultural soil (kg/day) 159
These values have been applied in estimating the exposure concentrations for this substance arising
from use of composts and digestates. Exposures have been estimated for two concentration scenarios:
A more conservative assessment is derived using the maximum reported concentrations
in estimating the local releases from the two scenarios, with a mid-range concentration
used in estimating the regional background.
A less conservative assessment is derived separately using the mid-range reported
concentrations in estimating the local releases from the two scenarios, with a minimum
concentration used in estimating the regional background.
Background exposure data previously presented by WHO (2002) are summarised below and in Table
3.107 - Table 3.108.
Table 3.107 Reported background concentrations of benzo[a]pyrene in the environment
PECregional Value Remarks

D161 © Wood Environment & Infrastructure Solutions UK Limited
February 2019
Doc Ref. 40039CL003i3
Agricultural soil
In soil of background and rural areas:
15 µg/kg dry weight (Norway) (depth, 0-10 cm)
6-12 µg/kg dry weight (Norway)
13/22 µg/kg dry weight (Wales, United Kingdom)
(depth, 5 cm)
ND-4.0 µg/kg dry weight Green Mountain (depth,
0-5 cm), USA
EHC 202 (WHO 1998)
The EHC monograph (WHO IPCS, 1998) summarised levels of various PAH in vegetables (table 53 of
that document). Concentrations in tomatoes and fruits and cereals are reported separately in the EHC
monograph (WHO IPCS, 1998). Table 3.108 overleaf summarises the values and ranges considered
most relevant to the present assessment.
The monograph (WHO IPCS, 1998) also reports some specific facts relating to vegetable
concentrations relative to concentrations in the soil in which the vegetables were grown, of direct
relevance to the present assessment, as follows:
The benzo[a]pyrene levels in potatoes in eastern Germany were 0.2-400 µg/kg. The highest
concentrations were detected in the peel of potatoes grown in soil containing 400 µg/kg benzo
[a]pyrene, …….
High concentrations of PAH were detected in lettuce grown close to a highway; the levels of
individual PAH decreased with distance from the road. Washing the vegetables reduced their
content of high-molecular-mass PAH but not of phenanthrene (Larsson & Sahlberg, 1982). In
another study, the profiles of PAH in lettuce were similar to those in ambient air, indicating that
deposition of airborne particles was the main source of contamination (Wickström et al., 1986).
PAH concentrations were determined in fenugreek, spinach beet, spinach, amaranthus, cabbage,
onion, lettuce, radish, tomato, and wheat grown on soil that had been treated with sewage sludge.
The levels of individual PAH in lettuce leaves (Table 53) were one to two orders of magnitude lower
than those in the sewage sludge and the soil on which the lettuce was grown (Lenin, 1994).
The PAH levels in carrots and beans grown near a German coking plant were below 0.5 µg/kg wet
weight. The levels of fluoranthene were 1.6- 1.7 µg/kg and those of pyrene 1.0-1.1 µg/kg. Vegetables
with large, rough leaf surfaces, such as spinach and lettuce, had PAH levels that were 10 times
higher, perhaps due to deposition from ambient air (Crössmann & Wüstemann, 1992).
Table 3.108 Reported background concentrations of a range of PAH in vegetables
Concentrations in
root crops (µg/kg) 1
Concentrations in leaf
crops (µg/kg) 2
Concentrations in
fruits (µg/kg) 3
Concentrations
in cereal
products
(µg/kg) 4
Benzo[a]pyrene ND – 6.2 0.2-0.5 0.3/0.4
Notes:
1 - Potatoes, Netherlands (see table 53 of the EHC monograph (WHO IPCS, 1998) for further details)
2 – Kale, lettuce, cabbage from a range of studies in different countries (see table 53 of the EHC monograph (WHO IPCS, 1998)
for further details)
3 – Tomatoes and/or fresh fruit (see table 54 of the EHC monograph (WHO IPCS, 1998) for further details))
4 - Oats, Finland (see table 55 of the EHC monograph (WHO IPCS, 1998) for further details; numerous data for a range of cereal-
derived products from EU and north America are also reported in Table 55)

D162 © Wood Environment & Infrastructure Solutions UK Limited
February 2019
Doc Ref. 40039CL003i3
Generic exposure scenario outcomes
The assessment has estimated local and background exposures of benzo[a]pyrene resulting from the
use scenarios defined in Section 1, using the chemical property data and concentration in composts
and digestates in the previous sections as inputs. The predicted environmental exposure
concentrations are as summarised in Table 3.109 below.
Table 3.109 Predicted exposures for benzo[a]pyrene arising from use of composts and digestates
Scenario I Units
PECagricultural soil 1.50E-02 [mg/kg dry wt.]
PECgrassland soil 5.86E-03 [mg/kg dry wt.]
PEC in groundwater 8.81E-07 [mg/l]
PECfreshwater 1.89E-06 [mg/l]
PECfreshwater-sediment 1.58E-01 [mg/kg dry wt.]
Humans via the environment: local
total daily intake 4.78E-05 [mg.kg-1.d-1]
Humans via the environment: daily
dose via drinking water 2.52E-08 [mg.kg-1.d-1]
Humans via the environment:
dominant exposure source and
fraction
Root Crops 96.2%
Secondary poisoning – freshwater
fish-eating birds and mammals 4.94E-04 [mg/kg wet wt.]
Secondary poisoning – worm-eating
birds and mammals 1.05E-02 [mg.kg-1]
Scenario II Units
PECagricultural soil 4.95E-01 [mg/kg dry wt.]
Humans via the environment: local
total daily intake 1.55E-03 [mg.kg-1.d-1]
Humans via the environment:
dominant exposure source and
fraction
Root Crops 99.9%
Secondary poisoning – worm-eating
birds and mammals 2.42E-01 [mg.kg-1]
Regional background Units
Regional PEC in surface water (total) 1.64E-06 [mg/l]
Regional PEC in air (total) 4.11E-10 [mg.m-3]
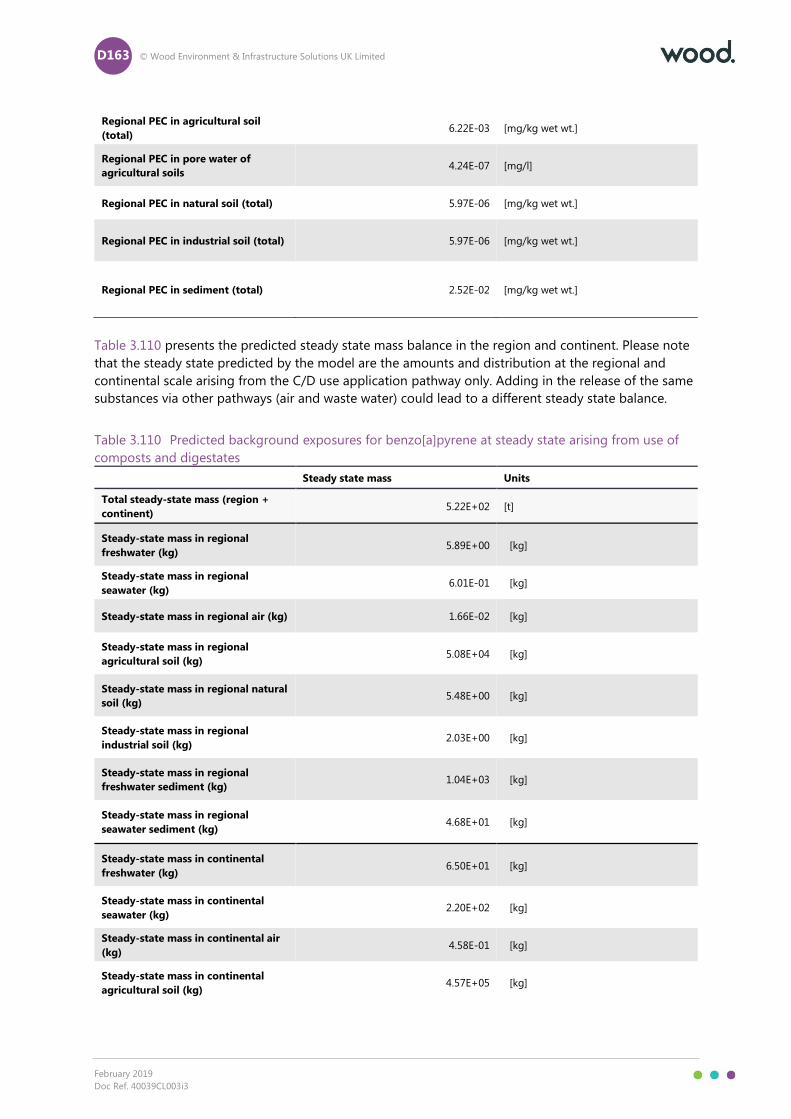
D163 © Wood Environment & Infrastructure Solutions UK Limited
February 2019
Doc Ref. 40039CL003i3
Regional PEC in agricultural soil
(total) 6.22E-03 [mg/kg wet wt.]
Regional PEC in pore water of
agricultural soils 4.24E-07 [mg/l]
Regional PEC in natural soil (total) 5.97E-06 [mg/kg wet wt.]
Regional PEC in industrial soil (total) 5.97E-06 [mg/kg wet wt.]
Regional PEC in sediment (total) 2.52E-02 [mg/kg wet wt.]
Table 3.110 presents the predicted steady state mass balance in the region and continent. Please note
that the steady state predicted by the model are the amounts and distribution at the regional and
continental scale arising from the C/D use application pathway only. Adding in the release of the same
substances via other pathways (air and waste water) could lead to a different steady state balance.
Table 3.110 Predicted background exposures for benzo[a]pyrene at steady state arising from use of
composts and digestates
Steady state mass Units
Total steady-state mass (region +
continent) 5.22E+02 [t]
Steady-state mass in regional
freshwater (kg) 5.89E+00 [kg]
Steady-state mass in regional
seawater (kg) 6.01E-01 [kg]
Steady-state mass in regional air (kg) 1.66E-02 [kg]
Steady-state mass in regional
agricultural soil (kg) 5.08E+04 [kg]
Steady-state mass in regional natural
soil (kg) 5.48E+00 [kg]
Steady-state mass in regional
industrial soil (kg) 2.03E+00 [kg]
Steady-state mass in regional
freshwater sediment (kg) 1.04E+03 [kg]
Steady-state mass in regional
seawater sediment (kg) 4.68E+01 [kg]
Steady-state mass in continental
freshwater (kg) 6.50E+01 [kg]
Steady-state mass in continental
seawater (kg) 2.20E+02 [kg]
Steady-state mass in continental air
(kg) 4.58E-01 [kg]
Steady-state mass in continental
agricultural soil (kg) 4.57E+05 [kg]

D164 © Wood Environment & Infrastructure Solutions UK Limited
February 2019
Doc Ref. 40039CL003i3
Steady-state mass in continental
natural soil (kg) 7.64E+01 [kg]
Steady-state mass in continental
industrial soil (kg) 2.83E+01 [kg]
Steady-state mass in continental
freshwater sediment (kg) 1.15E+04 [kg]
Steady-state mass in continental
seawater sediment (kg) 8.59E+02 [kg]
Steady state mass fraction Units
Total steady-state mass fraction
(region + continent) 9.84E+01 [%]
Steady-state mass fraction in
regional freshwater (%) 1.11E-03 [%]
Steady-state mass fraction in
regional seawater (%) 1.13E-04 [%]
Steady-state mass fraction in
regional air (%) 3.13E-06 [%]
Steady-state mass fraction in
regional agricultural soil (%) 9.57E+00 [%]
Steady-state mass fraction in
regional natural soil (%) 1.03E-03 [%]
Steady-state mass fraction in
regional industrial soil (%) 3.83E-04 [%]
Steady-state mass fraction in
regional freshwater sediment (%) 1.97E-01 [%]
Steady-state mass fraction in
regional seawater sediment (%) 8.83E-03 [%]
Steady-state mass in continental
freshwater (kg) 1.22E-02 [%]
Steady-state mass in continental
seawater (kg) 4.15E-02 [%]
Steady-state mass in continental air
(kg) 8.63E-05 [%]
Steady-state mass in continental
agricultural soil (kg) 8.62E+01 [%]
Steady-state mass in continental
natural soil (kg) 1.44E-02 [%]
Steady-state mass in continental
industrial soil (kg) 5.33E-03 [%]
Steady-state mass in continental
freshwater sediment (kg) 2.17E+00 [%]

D165 © Wood Environment & Infrastructure Solutions UK Limited
February 2019
Doc Ref. 40039CL003i3
Steady-state mass in continental
seawater sediment (kg) 1.62E-01 [%]
Sensitivity to specific variables
The main source of uncertainty in the assessment of this substance is the value of Koc. Several values
covering an extremely wide range have been reported (log Koc 6.66 (LSC), Eadie et al. (1990); 6.26
(Average on sediments), Kayal & Connell (1990); 8.3 (Specified particulate), Broman et al. (1990), 4.0
(Predicted to be dissolved), Broman et al. (1990). The assessment in this project follows the approach
used in the ESR RAR for coal tar pitch high temperature (log Koc 5.92, Karickhoff, 1979) but it is of
interest to see how the variation across this range affects PECs resulting from these release scenarios:
log Koc (range 4 to 8 as log values).
The impact of varying this property within the specified range around the baseline value was explored.
Refer to Figure 3.18 to Figure 3.21, which illustrate the impact on relevant predicted exposure
concentrations.
Figure 3.18 Sensitivity of selected outputs in the assessment of benzo[a]pyrene to the Koc input
value: diet of worm-eating birds and mammals
Note: the red line representing the EQS cannot be seen on this graph due to it overlapping the x-axis on this scale.

D166 © Wood Environment & Infrastructure Solutions UK Limited
February 2019
Doc Ref. 40039CL003i3
Figure 3.19 Sensitivity of selected outputs in the assessment of benzo[a]pyrene to the Koc input
value: diet of fish-eating birds and mammals
Figure 3.20 Sensitivity of selected outputs in the assessment of benzo[a]pyrene to the Koc input
value: freshwater sediment
Note: the red line representing the PNEC cannot be seen on this graph due to it exceeding the maximum value of
the y-axis on this scale.

D167 © Wood Environment & Infrastructure Solutions UK Limited
February 2019
Doc Ref. 40039CL003i3
Figure 3.21 Sensitivity of selected outputs in the assessment of benzo[a]pyrene to the Koc input
value: human daily intake
It can be concluded that:
Secondary poisoning exposure of fish-eating birds and mammals (local scenario I) could
vary significantly with the value of Koc within the literature range and could be up to 4x
higher than in the baseline assessment made here. However, exposure of worm-eating
birds and mammals resulting from application of composts and digestates in either local
scenario is in any case much higher and exceeds the existing EQS for biota.
The local total daily intake via both exposure scenarios could have been significantly
higher (up to 10x) than estimated in the baseline assessment, at lower Koc values within
the literature range.
The PEC in sediment from the application on land scenario could be significantly higher
(up to 2x) than estimated in the baseline assessment, at higher Koc values within the
literature range. Even the highest concentrations are however still well below the
historical PNEC for sediment organisms (as applied in the ESR RAR for CTPHT, though a
quantified PNEC may no longer be appropriate given the hazards of the substance).
In respect of local Scenario II, the sensitivity of the outcomes to possible losses from the system by
leaching and drainage of excess water has been explored using a fugacity method. For this substance
the proportion of substance in the system distributed to the interstitial water at equilibrium under
‘high water content’ conditions, and hence sensitive to leaching, is ≤1% of the substance present in the
system. Hence, the sensitivity of the exposure scenario to such variations in water management is
considered to be low.
Summary of findings
Table 3.111 below presents the summary of key findings from the risk assessment of benzo[a]pyrene
that has been made in this project. The findings are discussed further below the table.

D168 © Wood Environment & Infrastructure Solutions UK Limited
February 2019
Doc Ref. 40039CL003i3
Table 3.111 Summary of key findings for exposure of benzo[a]pyrene via use of compost and
digestates
Key findings of the risk assessment of benzo[a]pyrene in contaminated composts and digestates
Overall range of compost and digestate concentrations <0.04 – 0.52 mg benzo[a]pyrene/kg dry wt., <0.3 – 20.8 mg
PAH/kg
Major raw material sources PAHs reported above ca. 3 mg/kg in sewage sludge
(composted and non-composted), bio-waste and green
waste compost, C/D from source separation, digestate
derived from manure/slurry, and digestate derived from
renewable raw materials.
Safe limit concentration in compost and digestate Not applicable (risk characterisation ratio not definable).
Main concern(s) arising High cumulative loads at steady state; PEC in surface water
(at regional scale and local scenario I) exceeds the annual
average EQS for benzo[a]pyrene as a marker for total PAH
(EU, 2013); predator exposure via diet (local scenarios I and
II) exceed the EQS for biota benzo[a]pyrene as a marker for
total PAH (Directive 2008/105/EC as amended (2013/39/EU)).
Effects considered in the main concern hazard(s) Basis of the EQS is not stated in the Directive but is
understood to relate to human health via consumption of
fishery products. Human BMDL10 based on carcinogenicity.
Uncertainties and their implications Small occurrence data set for benzo[a]pyrene specifically
means that the exposure levels may be under- or over-
estimated by the present assessment; exposures of humans
via diet, predators via the food chain, sediment organisms
could be sensitive to variability in Koc value.
Sensitivity of exposures to variations in water management in
the local container growing scenario is low.
Other remarks Local human exposure via diet does not exceed the BMDL10.
While risk characterisation has not been quantified, it is noted that the predicted exposures in fresh
water arising from the application of composts/digestates on soil (local scenario I) exceed the safe limit
(annual average inland surface water EQS for benzo[a]pyrene as a marker for total PAH set under
Directive 2008/105/EC (EU, 2008) as amended by Directive 2013/39/EU (EU, 2013)) (the MAC EQS
applicable for benzo[a]pyrene specifically is not exceeded).
It is noted that predator exposure via diet (earthworms) (local scenarios I and II) exceed the EQS for
biota benzo[a]pyrene as a marker for total PAH (Directive 2008/105/EC as amended (2013/39/EU))
although this biota EQS normally relates to crustaceans and molluscs.
It is noted that the human exposures to PAH arising from the application of composts/digestates on
soil do not exceed the BMDL10 value either in terms of benzo[a]pyrene alone, total for PAH2 or total
for PAH4.
The estimated regional concentrations in vegetables arising from the application of C/D are
comparable with the background concentrations reported by WHO in the EHC monograph. Local
predicted concentrations of all assessed PAH in root crops are notably higher than the background
levels presented in Table 3.108 but predicted regional concentrations are close to the reported
measured concentrations. Predicted local concentrations of the assessed PAH in leaf crops are
generally similar or lower than the reported levels.

D169 © Wood Environment & Infrastructure Solutions UK Limited
February 2019
Doc Ref. 40039CL003i3
The highest contributions to human exposure of PAH via the environment arising from the application
of C/D is mainly associated with dietary consumption of fish (associated with local scenario I,
application on land) and dietary consumption of root vegetables (local scenario II, container growing).
At steady state, between 96-99% of the total mass of each assessed PAH remains within the region +
continent60, suggesting that there is relatively low transfer over long distances following release via the
handling and application of C/D.
The total mass in the region + continent at steady state varies between ca 14 t (indeno[1,2,3-
cd]pyrene) and ca 170 t (benzo[b]fluoranthene). The reported concentrations in composts and
digestates does not cover a large range meaning that when a comparable scenario is assessed using
lower concentrations in the C/D within the reported range, the steady state masses are not
significantly lower. For all five of the assessed PAHs, the steady-state mass amounts to approximately 8
times the mass released annually via application of composts and digestates61.
The variability in input properties has been considered. It is noted that variation in the Koc value of
benzo[a]pyrene could suggest that the exposures of humans via diet, predators via the food chain,
sediment organisms could be sensitive to the uncertainty in this value.
3.17 Chrysene (representative of PAH16 chemical family)
Background information and remarks
Chrysene (CAS 218-01-9, 1719-03-5, EC 205-923-4) together with benzo[a]pyrene, are sometimes
known as ‘PAH2’.
According to the harmonised classification and labelling under CLP, this substance may cause cancer,
is very toxic to aquatic life, is very toxic to aquatic life with long lasting effects and is suspected of
causing genetic defects.
It is an SVHC included in the candidate list for authorisation based on carcinogenic, PBT and vPvB
properties. Some uses are restricted under annex XVII of REACH.
Chemical properties and hazards data set
As a SVHC, the reliability of any threshold no-effect value is highly uncertain. Risk characterisation has
not been attempted here.
Table 3.112 Property information for chrysene (from MSC SVHC support document unless otherwise
stated)
Property Value Remarks
Molecular weight 228.29
60 This refers to the regional and continental spatial scales in the EUSES model. Refer to Section 1.7 and the Annex for further
information. 61 Please note this is not to be interpreted as how much time elapses to reach steady state; the steady state predicted by the
model are the amounts and distribution at the regional and continental scale arising from the compost and digestate use
application pathway only. Adding in the release of the same substances via other pathways (air and waste water) could lead to a
different steady state picture.

D170 © Wood Environment & Infrastructure Solutions UK Limited
February 2019
Doc Ref. 40039CL003i3
Melting point 255.5
Boiling point 448
Vapour pressure in range 8.4 x 10⁻⁷ Pa at 25°C (effusion method) 1.7 x10⁻⁴Pa at
20°C (supercooled liquid PL)
Water solubility in range 1.0 μg L-1 - 3.3 μg L-1
log Kow 5.73 at 25C
Henry’s law
constant
Value generated in EUSES from
water solubility and vapour
pressure.
Koc log Koc 5.60 (Karickhoff, 1979) applied in ESR RAR of CTPHT (EC,
2008d)
Estimated in EUSES from log
Kow. SVHC support document
confirms correlation with log
Kow.
BCF
Bioaccumulation potential of chrysene likely differs between
species due to the organism’s ability to metabolise PAHs
(biotransformation). It is likely that chrysene is metabolised in fish
using enzymes belonging to the Cytochrome P450 enzymes (Cyt
P450) resulting in low BCF values. Molluscs might also have the
ability to metabolise PAHs to some extent. However, BAF data give
a clear concern for bioaccumulation in molluscs. Among
crustaceans an experimental BCF value above 5000 (Newsted &
Giesy, 1987) has been reported for Daphnia magna and a high BAF
value has been obtained for a crab species from a field sample
(Takeuchi et al., 2009 cited in Verbruggen and van Herwijnen,
2011a). No evidence for transformation processes of PAHs in algae
and oligochaeta exist. Thus, chyrsene has a high bioaccumulation
potential at lower trophic levels, which could contribute to a
constant high exposure of chyrsene to predators for which the
effects are unpredictable due to the absence of sufficient data.
Trophic magnification factors (TMFs) <1 have been observed but
these cannot refute the evidence of high bioaccumulation potential
in lower trophic levels as TMFs reflect the average magnification
along the food web trophic levels. Furthermore, a high BAF value
has been reported for a benthic fish species feeding largely on
invertebrates, amounting to 21,700 L/kgww (Takeuchi et al.,
2009 cited in Verbruggen and van Herwijnen, 2011)
Biodegradability
Mean half-lives: 1700h in water, 17000h in soil and 55000h in
sediment (temperatures not stated; assumed to be 25°C) (half-lives
as used in the CTPHT ESR risk assessment of chrysene, and also in
the present assessment).
The predicted half-lives range between 42 and 125 days for water
degradation and half-lives higher than 1250 days for sediment.
Wild and Jones (1993) reported a dissipation half-live for CHR of
106 to 313 days in a laboratory soil microcosm study. For assessing
the persistence of CHR, half-lives obtained under realistic
conditions, such as field conditions, are given higher weight. Under
field conditions Wild et al. (1991) demonstrated a half-life of more
than 8.1 years in soil for CHR. (summary from the SVHC MSC
support document for chrysene)

D171 © Wood Environment & Infrastructure Solutions UK Limited
February 2019
Doc Ref. 40039CL003i3
Half-life in air half-lives in the range 1.3 to 100h in air with particles (WHO IPCS
EHC 202) 100h used in the assessment
Threshold hazard
values if available Value Remarks
PNECaquatic
(freshwater)
0.07 μg/l (ESR RAR CTPHT)
Reliable data available but as
this substance meets vPvB
criteria for PNECs are not
suitable. Also the substance is
PBT (T met by carcinogenicity
rather than ecotoxicity).
PNECsediment
(freshwater) 2.79 mg/kgdw (by equilibrium partitioning) (ESR RAR CTPHT)
PNECsoil 0.55 mg/kgdw (EQPM - ESR RAR CTPHT)
PNECoral predator
DNEL general
population oral
BMDL10 = 0.17 mg/kg bw/d for PAH2
BMDL10 = 0.34 mg/kg bw/d for PAH4
Carcinogenic 1B: DNEL not
definable
Other relevant
data
Occurrence data set
Table 3.113 presents a summary of the reported concentrations of chrysene and other PAH in
composts and digestates. This is based on the survey of the available literature collected in Task 2 of
the project and reported in the main project report.
No substance-specific data for chrysene were reported in digestates although a small number of
measured values in composts are available. This represents an uncertainty in the exposure assessment;
in the absence of data it has been assumed that measurements in composts (particularly composts
derived from sewage sludge) would be reasonably representative of digestates.
Table 3.113 Reported occurrence of chrysene in composts and digestates
Concentrations in
composts/digestates
Value - units of mg/kg dry
wt. Remarks
Composts - data
availability
Only 2 compost data are available for Chrysene itself, for the
same member state coming from the same study, <0.04-0.61
mg/kg d.m, 2017 Poland.
Compost - minimum
concentration 0.04
The lower limit value is taken as such for the purpose of a
minimum exposure background assessment, but is actually
reported as a less-than limit value.
Compost - mid-range or
average concentration 0.325 Mean of the range.
Compost - maximum
concentration 0.61

D172 © Wood Environment & Infrastructure Solutions UK Limited
February 2019
Doc Ref. 40039CL003i3
Concentrations in
composts/digestates
Value - units of mg/kg dry
wt. Remarks
Digestates - data
availability
Using the same values as above, in the absence of specific data
for digestate. The compost values are sewage sludge compost
so in principle should also be representative of digestate.
Digestate - minimum
concentration 0.04
Digestate - mid-range
or average
concentration
0.325
Digestate - maximum
concentration 0.61
These concentrations in compost and in digestate equate to the following release amounts at the
regional and continental scale.
Table 3.114 Estimated regional and continental release amounts
Parameter Value
Mass of substance in EU-28 in compost (kg/year) 2867
Mass of substance in EU-28 in digestate (kg/year) 11,466
Total regional emission to surface water (kg/day) 0.11
Total regional emission to soil (kg/day) 3.8
Total continental emission to surface water (kg/day) 0.99
Total continental emission to agricultural soil (kg/day) 35
These values have been applied in estimating the exposure concentrations for this substance arising
from use of composts and digestates. Exposures have been estimated for two concentration scenarios:
A more conservative assessment is derived using the maximum reported concentrations
in estimating the local releases from the two scenarios, with a mid-range concentration
used in estimating the regional background.
A less conservative assessment is derived separately using the mid-range reported
concentrations in estimating the local releases from the two scenarios, with a minimum
concentration used in estimating the regional background.
Table 3.115 below summarises background exposure data previously presented by WHO (2002).
Table 3.115 Reported background concentrations of chrysene in vegetables
Concentrations in root
crops (µg/kg) 1
Concentrations in leaf
crops (µg/kg) 2
Concentrations in fruits
(µg/kg) 3
Chrysene 0.8 2.4-62 0.5
Notes:
1 - Potatoes, Netherlands (de Vos et al., 1990)
2 – Kale, lettuce, cabbage from a range of studies in different countries (Kale, Netherlands (Vaessen et al., 1984); Lettuce, Finland
(Wickstrom et al., 1986) Lettuce, Germany, from an industrial area (Ministry of Environment, 1994); Lettuce, Sweden,
concentration in µg/kg fresh weight (Larsson & Sahlberg, 1982); Lettuce and cabbage, United Kingdom, concentration in µg/kg
fresh weight (McGill et al., 1982); Lettuce, India (Lenin, 1994))
3 – Tomatoes, Netherlands (Vaessen et al., 1984) (table 53) and/or fresh fruit, Netherlands (de Vos et al., 1990) (table 54)

D173 © Wood Environment & Infrastructure Solutions UK Limited
February 2019
Doc Ref. 40039CL003i3
Generic exposure scenario outcomes
The assessment has estimated local and background exposures of chrysene resulting from the use
scenarios defined in Section 1, using the chemical property data and concentration in composts and
digestates in the previous sections as inputs. The predicted environmental exposure concentrations are
as summarised in Table 3.116 below.
Table 3.116 Predicted exposures for chrysene arising from use of composts and digestates
Scenario I Units
PECagricultural soil 6.10E-03 [mg/kg dry wt.]
PECgrassland soil 2.38E-03 [mg/kg dry wt.]
PEC in groundwater 7.47E-07 [mg/l]
PECfreshwater 9.55E-07 [mg/l]
PECfreshwater-sediment 3.80E-02 [mg/kg dry wt.]
Humans via the environment: local
total daily intake 3.96E-05 [mg.kg-1.d-1]
Humans via the environment: daily
dose via drinking water 2.13E-08 [mg.kg-1.d-1]
Humans via the environment:
dominant exposure source and
fraction
Fish 58.6%
Secondary poisoning – freshwater
fish-eating birds and mammals 9.19E-02 [mg/kg wet wt.]
Secondary poisoning – worm-eating
birds and mammals 3.05E-03 [mg.kg-1]
Scenario II Units
PECagricultural soil 2.01E-01 [mg/kg dry wt.]
Humans via the environment: local
total daily intake 5.58E-04 [mg.kg-1.d-1]
Humans via the environment:
dominant exposure source and
fraction
Root Crops 98.7%
Secondary poisoning – worm-eating
birds and mammals 8.28E-02 [mg.kg-1]
Regional background Units
Regional PEC in surface water (total) 4.61E-07 [mg/l]
Regional PEC in air (total) 2.98E-10 [mg.m-3]

D174 © Wood Environment & Infrastructure Solutions UK Limited
February 2019
Doc Ref. 40039CL003i3
Regional PEC in agricultural soil (total) 1.34E-03 [mg/kg wet wt.]
Regional PEC in pore water of agricultural
soils 1.91E-07 [mg/l]
Regional PEC in natural soil (total) 2.92E-06 [mg/kg wet wt.]
Regional PEC in industrial soil (total) 2.92E-06 [mg/kg wet wt.]
Regional PEC in sediment (total) 4.74E-03 [mg/kg wet wt.]
Table 3.117 presents the predicted steady state mass balance in the region and continent. Please note
that the steady state predicted by the model are the amounts and distribution at the regional and
continental scale arising from the C/D use application pathway only. Adding in the release of the same
substances via other pathways (air and waste water) could lead to a different steady state balance.
Table 3.117 Predicted background exposures for chrysene at steady state arising from use of
composts and digestates
Steady state mass Units
Total steady-state mass (region +
continent) 1.13E+02 [t]
Steady-state mass in regional
freshwater (kg) 1.66E+00 [kg]
Steady-state mass in regional
seawater (kg) 1.74E-01 [kg]
Steady-state mass in regional air (kg) 1.20E-02 [kg]
Steady-state mass in regional
agricultural soil (kg) 1.10E+04 [kg]
Steady-state mass in regional natural
soil (kg) 2.68E+00 [kg]
Steady-state mass in regional
industrial soil (kg) 9.94E-01 [kg]
Steady-state mass in regional
freshwater sediment (kg) 1.96E+02 [kg]
Steady-state mass in regional
seawater sediment (kg) 7.57E+00 [kg]
Steady-state mass in continental
freshwater (kg) 1.94E+01 [kg]
Steady-state mass in continental
seawater (kg) 8.97E+01 [kg]
Steady-state mass in continental air
(kg) 3.35E-01 [kg]
Steady-state mass in continental
agricultural soil (kg) 9.87E+04 [kg]
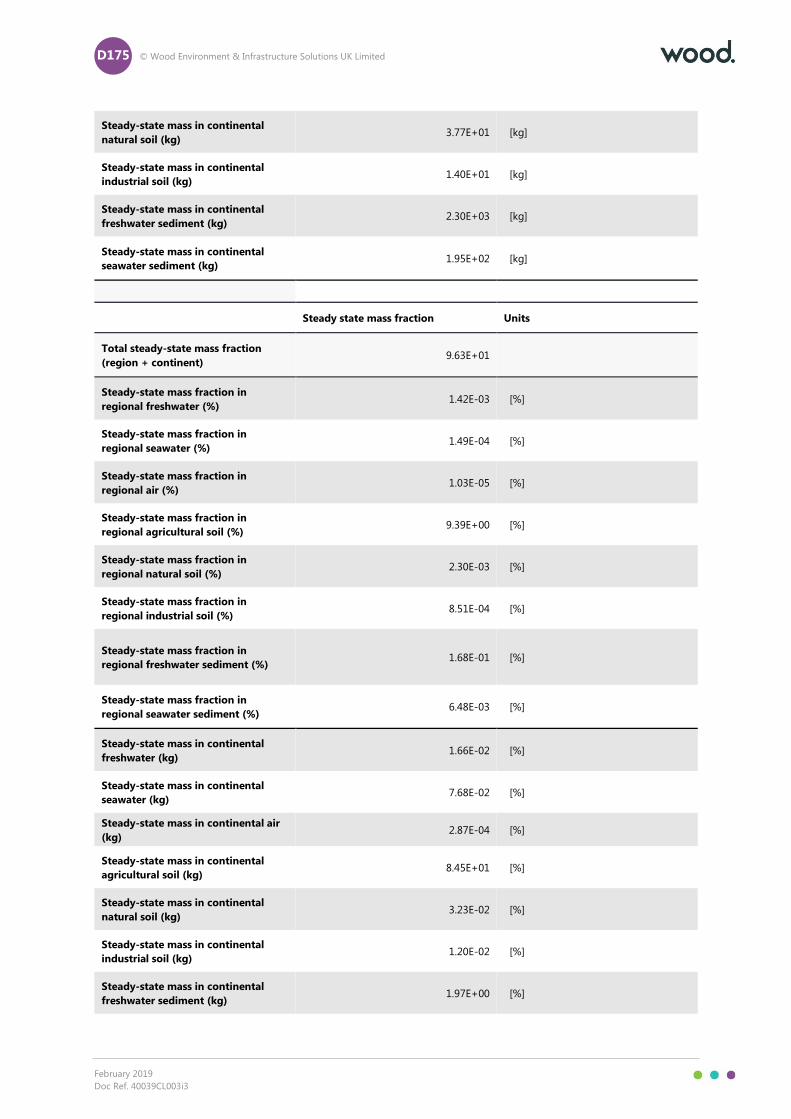
D175 © Wood Environment & Infrastructure Solutions UK Limited
February 2019
Doc Ref. 40039CL003i3
Steady-state mass in continental
natural soil (kg) 3.77E+01 [kg]
Steady-state mass in continental
industrial soil (kg) 1.40E+01 [kg]
Steady-state mass in continental
freshwater sediment (kg) 2.30E+03 [kg]
Steady-state mass in continental
seawater sediment (kg) 1.95E+02 [kg]
Steady state mass fraction Units
Total steady-state mass fraction
(region + continent) 9.63E+01
Steady-state mass fraction in
regional freshwater (%) 1.42E-03 [%]
Steady-state mass fraction in
regional seawater (%) 1.49E-04 [%]
Steady-state mass fraction in
regional air (%) 1.03E-05 [%]
Steady-state mass fraction in
regional agricultural soil (%) 9.39E+00 [%]
Steady-state mass fraction in
regional natural soil (%) 2.30E-03 [%]
Steady-state mass fraction in
regional industrial soil (%) 8.51E-04 [%]
Steady-state mass fraction in
regional freshwater sediment (%) 1.68E-01 [%]
Steady-state mass fraction in
regional seawater sediment (%) 6.48E-03 [%]
Steady-state mass in continental
freshwater (kg) 1.66E-02 [%]
Steady-state mass in continental
seawater (kg) 7.68E-02 [%]
Steady-state mass in continental air
(kg) 2.87E-04 [%]
Steady-state mass in continental
agricultural soil (kg) 8.45E+01 [%]
Steady-state mass in continental
natural soil (kg) 3.23E-02 [%]
Steady-state mass in continental
industrial soil (kg) 1.20E-02 [%]
Steady-state mass in continental
freshwater sediment (kg) 1.97E+00 [%]

D176 © Wood Environment & Infrastructure Solutions UK Limited
February 2019
Doc Ref. 40039CL003i3
Steady-state mass in continental
seawater sediment (kg) 1.67E-01 [%]
Sensitivity to specific variables
In respect of local Scenario II, the sensitivity of the outcomes to possible losses from the system by
leaching and drainage of excess water has been explored using a fugacity method. For this substance
the proportion of substance in the system distributed to the interstitial water at equilibrium under
‘high water content’ conditions, and hence sensitive to leaching, is ≤1% of the substance present in the
system. Hence, the sensitivity of the exposure scenario to such variations in water management is
considered to be low.
Summary of findings
Table 3.118 below presents the summary of key findings from the risk assessment of chrysene that has
been made in this project.
Table 3.118 Summary of key findings for exposure of chrysene via use of compost and digestates
Key findings of the risk assessment of chrysene in contaminated composts and digestates
Overall range of compost and digestate concentrations <0.04 – 0.61 mg chrysene/kg dry wt., <0.3 – 20.8 mg PAH/kg
Major raw material sources PAHs reported above ca. 3 mg/kg in sewage sludge
(composted and non-composted), bio-waste and green
waste compost, compost and digestate from source
separation, digestate derived from manure/slurry, and
digestate derived from renewable raw materials.
Safe limit concentration in compost and digestate Not applicable (risk characterisation ratio not definable).
Main concern(s) arising High cumulative loads at steady state.
Effects considered in the main concern hazard(s) Basis of the EQS is not stated in the Directive but is
understood to relate to human health via consumption of
fishery products. Human BMDL10 based on carcinogenicity.
Uncertainties and their implications Small occurrence data set for chrysene specifically means
that the exposure levels may be under- or over-estimated by
the present assessment; exposures of humans via diet,
predators via the food chain.
Sensitivity of exposures to variations in water management in
the local container growing scenario is low.
Other remarks Local human exposure via diet does not exceed the BMDL10.
The assessment findings for all assessed PAH are discussed in the equivalent section in Section 3.16.
3.18 Benz[a]anthracene (representative of PAH16 chemical family)
Background information and remarks
Benz[a]anthracene (CAS 56-55-3, 1718-53-2, EC 200-280-6), together with benzo[a]pyrene, chrysene
and benzo[b]fluoranthene, are sometimes known as ‘PAH4’.

D177 © Wood Environment & Infrastructure Solutions UK Limited
February 2019
Doc Ref. 40039CL003i3
According to the harmonised classification and labelling under CLP, this substance may cause cancer,
is very toxic to aquatic life and is very toxic to aquatic life with long lasting effects.
It is an SVHC included in the candidate list for authorisation based on carcinogenic, PBT and vPvB
properties. Some uses are restricted under annex XVII of REACH.
Chemical properties and hazards data set
As an SVHC, the reliability of any threshold no-effect value is highly uncertain. Risk characterisation has
not been attempted here. Table 3.119 summarises the chemical property data, as cited by ECHA, 2017c
unless otherwise stated in the table.
Table 3.119 Property information for benz[a]anthracene
Property Value Remarks
Molecular weight 228.29
Melting point 160.5
Boiling point 438
Vapour pressure 6.67 x 10⁻⁷ Pa at 20°C (effusion method) to 1.47
x10-5 Pa at 25°C (effusion method). 6.67E-07 value used in EUSES.
Water solubility 0.00837 mg/l at 25C to 0.0168 mg/l at 25C. 0.00837 mg/l used in EUSES.
log Kow 5.91
Henry’s law
constant
Value generated in EUSES from water solubility and
vapour pressure.
Koc log Koc 5.70 (Karickhoff, 1979) applied in ESR
RAR of CTPHT (2008d)
Estimated in EUSES from log Kow. SVHC support
document confirms correlation with log Kow.
BCF 265 (fish); 5000 (crustaceans); 12000 (BAF, fish)
Bioaccumulation potential of BaA differs between
the species due to the organism’s ability to
metabolise PAHs (biotransformation). BaA can be
transformed in fish using enzymes belonging to the
Cytochrome P450 enzymes (Cyt P450) and other
mechanism. A reliable BCF of 265 for fish is derived
from a laboratory study
(De Maagd etal., 1998). Nevertheless, Verbruggen
and van Herwijnen (2011) pointed out that
laboratory BCF values might underestimate BAF in
field.
Molluscs might also have the ability to metabolise
PAHs to some extent. However, BAF data give a
clear concern for bioaccumulation in molluscs.
Among crustaceans an experimental BCF value
above 5000 (Newsted & Giesy, 1987) has been
reported for Daphnia magna and a high BAF value
has been obtained for a crab species from a field
sample (Takeuchi et al., 2009 cited in Verbruggen
and van Herwijnen, 2011).

D178 © Wood Environment & Infrastructure Solutions UK Limited
February 2019
Doc Ref. 40039CL003i3
Property Value Remarks
No evidence for transformation processes of PAHs
in algae and oligochaeta exist. Thus, BaA has a high
bioaccumulation potential at lower trophic levels,
which could contribute to a constant high exposure
of BaA to predators for which the effects are
unpredictable due to the absence of sufficient data.
TMFs <1 have been observed but these cannot
refute the evidence of high bioaccumulation
potential in lower trophic levels as TMFs reflect the
average magnification along the food web
trophic levels. Furthermore, a high BAF value has
been reported for a benthic fish species feeding
largely on invertebrates, amounting to 12,000
L/kgww (Takeuchi et al., 2009 cited in Verbruggen
and van Herwijnen, 2011).
Biodegradability
Mean half-lives: 1700h in water, 17000h in soil
and 55000h in sediment (temperatures not
stated; assumed to be 25C)
The half-lives predicted by Mackay et al. (1992)
indicate that BaA persists in sediment with half-
lives higher than 250 days. For water
degradation, Mackay et al. (1992) predicted
long elimination half-lives between 42 and 125
days. However, considering the chemical
structure of BaA that consists of four aromatic
rings, standard tests for biodegradation in
water may reveal that BaA is biodegradable
under aerobic conditions (EC, 2008).
Biodegradation studies in laboratory soil
microcosms show dissipation half-lives up to
313 days (Wild and Jones, 1993).
Biodegradation studies on soil done by Wild et
al. (1991) revealed a half-life of BaA of more
than 8.1 years under field conditions. Hence,
BaA biodegrades very slowly in sediments and
soils. This conclusion was also drawn in the
Support Document for identification of CTPHT
as SVHC (ECHA, 2009).
Half-life in air
While half-lives for direct photolysis of PAHs
are in the range of hours (Vu Duc & Huynh,
1991, cited in The Netherlands, 2008), it was
demonstrated by EC (2001)
(cited in The Netherlands (2008)), that particle
surface-adsorbed BaA does have representative
lifetimes between 15min and 3.3days under
natural conditions.
Photolysis of PAHs at the atmosphere was assessed
in the EU risk assessment report (EC, 2008d) as
following:
Photolysis in the troposphere results in the
formation of reactive hydroxyl and nitrate (NO3)
radicals and ozone (O3), which reacts as
oxidizing agent with organic compounds, like
PAHs. These radical and ozone reactions comprise
mainly degradation of gas-phase PAHs (Calvert et
al., 2002). Particle-associated PAHs are expected to
degrade in air predominantly via direct photolysis
by light with a wavelength < 290 nm (Kamens et al.,
1988), although reaction with ozone will also occur
(Peters and Seifert, 1980; Grosjean et al., 1983; Pitts
et al., 1986;Coutant et al., 1988). As stated earlier,
BaA is mainly particle associated. The degradation
rate of PAHs, and therefore of BaA, depends on the
type of particle to which they are bound (Behymer
& Hites, 1988, cited
in The Netherlands, 2008). While half-lives for direct
photolysis of PAHs are in the range of hours (Vu
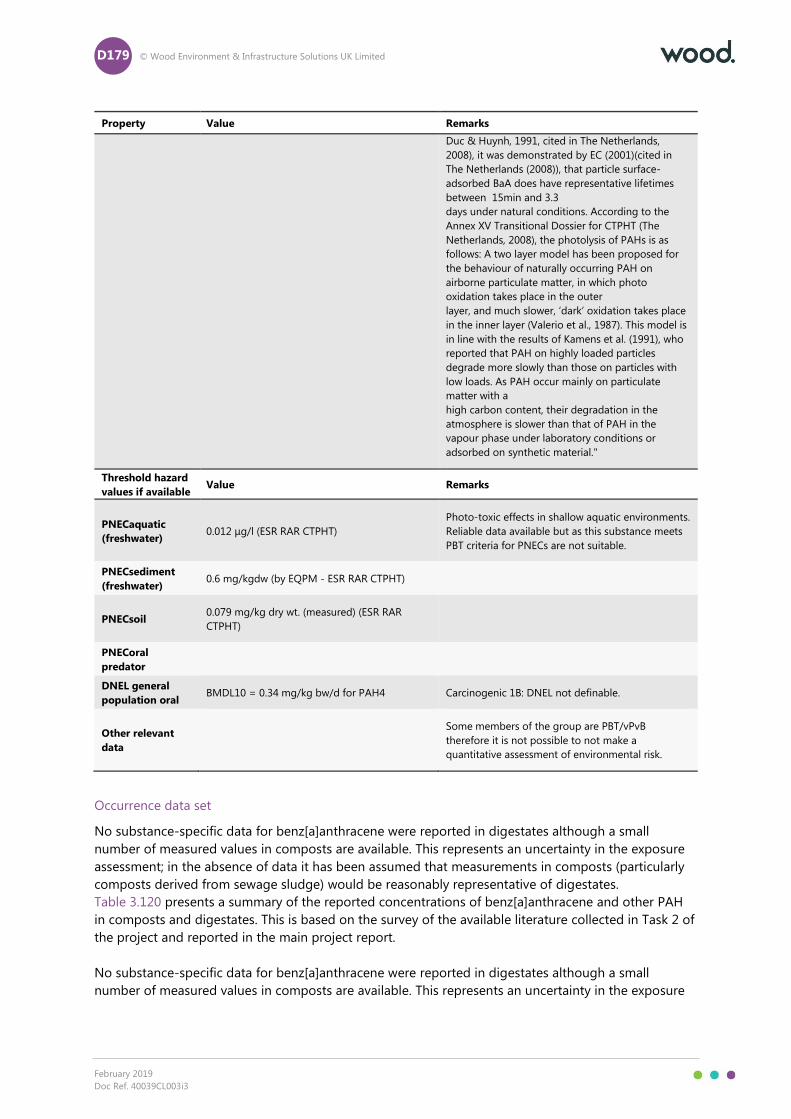
D179 © Wood Environment & Infrastructure Solutions UK Limited
February 2019
Doc Ref. 40039CL003i3
Property Value Remarks
Duc & Huynh, 1991, cited in The Netherlands,
2008), it was demonstrated by EC (2001)(cited in
The Netherlands (2008)), that particle surface-
adsorbed BaA does have representative lifetimes
between 15min and 3.3
days under natural conditions. According to the
Annex XV Transitional Dossier for CTPHT (The
Netherlands, 2008), the photolysis of PAHs is as
follows: A two layer model has been proposed for
the behaviour of naturally occurring PAH on
airborne particulate matter, in which photo
oxidation takes place in the outer
layer, and much slower, ‘dark’ oxidation takes place
in the inner layer (Valerio et al., 1987). This model is
in line with the results of Kamens et al. (1991), who
reported that PAH on highly loaded particles
degrade more slowly than those on particles with
low loads. As PAH occur mainly on particulate
matter with a
high carbon content, their degradation in the
atmosphere is slower than that of PAH in the
vapour phase under laboratory conditions or
adsorbed on synthetic material."
Threshold hazard
values if available Value Remarks
PNECaquatic
(freshwater) 0.012 μg/l (ESR RAR CTPHT)
Photo-toxic effects in shallow aquatic environments.
Reliable data available but as this substance meets
PBT criteria for PNECs are not suitable.
PNECsediment
(freshwater) 0.6 mg/kgdw (by EQPM - ESR RAR CTPHT)
PNECsoil 0.079 mg/kg dry wt. (measured) (ESR RAR
CTPHT)
PNECoral
predator
DNEL general
population oral BMDL10 = 0.34 mg/kg bw/d for PAH4 Carcinogenic 1B: DNEL not definable.
Other relevant
data
Some members of the group are PBT/vPvB
therefore it is not possible to not make a
quantitative assessment of environmental risk.
Occurrence data set
No substance-specific data for benz[a]anthracene were reported in digestates although a small
number of measured values in composts are available. This represents an uncertainty in the exposure
assessment; in the absence of data it has been assumed that measurements in composts (particularly
composts derived from sewage sludge) would be reasonably representative of digestates.
Table 3.120 presents a summary of the reported concentrations of benz[a]anthracene and other PAH
in composts and digestates. This is based on the survey of the available literature collected in Task 2 of
the project and reported in the main project report.
No substance-specific data for benz[a]anthracene were reported in digestates although a small
number of measured values in composts are available. This represents an uncertainty in the exposure

D180 © Wood Environment & Infrastructure Solutions UK Limited
February 2019
Doc Ref. 40039CL003i3
assessment; in the absence of data it has been assumed that measurements in composts (particularly
composts derived from sewage sludge) would be reasonably representative of digestates.
Table 3.120 Reported occurrence of benz[a]anthracene in composts and digestates
Concentrations in
composts/digestates
Value - units of mg/kg dry
wt. Remarks
Composts - data
availability
Very few data specifically for the named structure: 2 values
available for benz[a]anthracene specifically: two separate
composts sampled at the same site; both state compost
although made from sewage sludge.
The data set of generic PAH (PAH11 / PAH16 / PAH general / 4-
ring PAH) is much larger with values available for a wide range
of member states and several different sampling years. Many
reported values are already ranges / averages. Concentrations
reported are relatively consistent (overall range <0.04 - 20.8
mg/kg dry wt. in composts).
Compost - minimum
concentration 0.04
Compost - mid-range or
average concentration 0.168
Average of all available figures for B(a)A as such is 0.17 mg/kg
dry wt.. Average across all reported values for PAH [4-ring] is
about 2.9 mg/kg dry wt..
Compost - maximum
concentration 0.33
0.33 mg/kg (2017 Poland; sewage sludge compost prepared by
vermicomposting). For the PAH family, a relevant high
percentile value of approx., 6 mg/kg dry wt. is reasonable
(consistent with FPR limit).
Digestates - data
availability Using the same values as above unless where noted.
Digestate - minimum
concentration 0.04
Digestate - mid-range
or average
concentration
0.168 No digestate data for B[a]A as such. Average across all reported
values for PAH [4-ring] is about 1.9 mg/kg dry wt..
Digestate - maximum
concentration 0.33
These concentrations in compost and in digestate equate to the following release amounts at the
regional and continental scale.
Table 3.121 Estimated regional and continental release amounts
Parameter Value
Mass of substance in EU-28 in compost (kg/year) 1482
Mass of substance in EU-28 in digestate (kg/year) 5927
Total regional emission to surface water (kg/day) 0.057
Total regional emission to soil (kg/day) 2.0
Total continental emission to surface water (kg/day) 0.51
Total continental emission to agricultural soil (kg/day) 18
These values have been applied in estimating the exposure concentrations for this substance arising
from use of composts and digestates. Exposures have been estimated for two concentration scenarios:
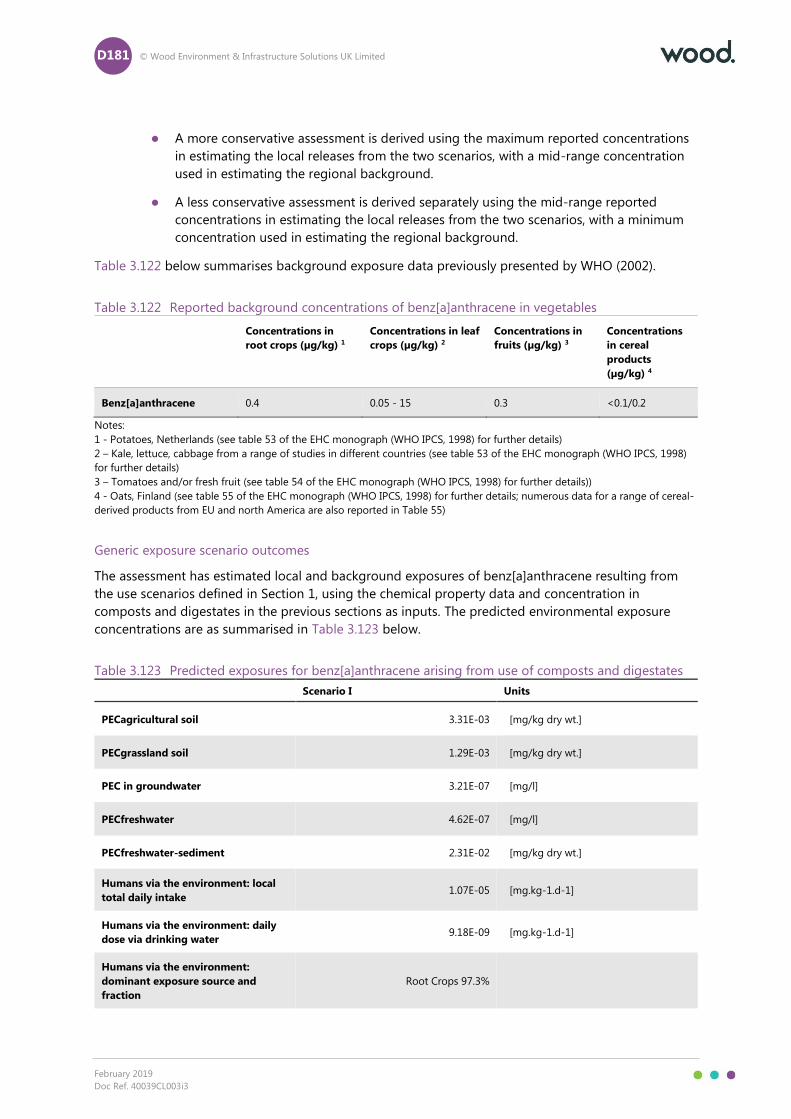
D181 © Wood Environment & Infrastructure Solutions UK Limited
February 2019
Doc Ref. 40039CL003i3
A more conservative assessment is derived using the maximum reported concentrations
in estimating the local releases from the two scenarios, with a mid-range concentration
used in estimating the regional background.
A less conservative assessment is derived separately using the mid-range reported
concentrations in estimating the local releases from the two scenarios, with a minimum
concentration used in estimating the regional background.
Table 3.122 below summarises background exposure data previously presented by WHO (2002).
Table 3.122 Reported background concentrations of benz[a]anthracene in vegetables
Concentrations in
root crops (µg/kg) 1
Concentrations in leaf
crops (µg/kg) 2
Concentrations in
fruits (µg/kg) 3
Concentrations
in cereal
products
(µg/kg) 4
Benz[a]anthracene 0.4 0.05 - 15 0.3 <0.1/0.2
Notes:
1 - Potatoes, Netherlands (see table 53 of the EHC monograph (WHO IPCS, 1998) for further details)
2 – Kale, lettuce, cabbage from a range of studies in different countries (see table 53 of the EHC monograph (WHO IPCS, 1998)
for further details)
3 – Tomatoes and/or fresh fruit (see table 54 of the EHC monograph (WHO IPCS, 1998) for further details))
4 - Oats, Finland (see table 55 of the EHC monograph (WHO IPCS, 1998) for further details; numerous data for a range of cereal-
derived products from EU and north America are also reported in Table 55)
Generic exposure scenario outcomes
The assessment has estimated local and background exposures of benz[a]anthracene resulting from
the use scenarios defined in Section 1, using the chemical property data and concentration in
composts and digestates in the previous sections as inputs. The predicted environmental exposure
concentrations are as summarised in Table 3.123 below.
Table 3.123 Predicted exposures for benz[a]anthracene arising from use of composts and digestates
Scenario I Units
PECagricultural soil 3.31E-03 [mg/kg dry wt.]
PECgrassland soil 1.29E-03 [mg/kg dry wt.]
PEC in groundwater 3.21E-07 [mg/l]
PECfreshwater 4.62E-07 [mg/l]
PECfreshwater-sediment 2.31E-02 [mg/kg dry wt.]
Humans via the environment: local
total daily intake 1.07E-05 [mg.kg-1.d-1]
Humans via the environment: daily
dose via drinking water 9.18E-09 [mg.kg-1.d-1]
Humans via the environment:
dominant exposure source and
fraction
Root Crops 97.3%

D182 © Wood Environment & Infrastructure Solutions UK Limited
February 2019
Doc Ref. 40039CL003i3
Secondary poisoning – freshwater
fish-eating birds and mammals 3.54E-03 [mg/kg wet wt.]
Secondary poisoning – worm-eating
birds and mammals 1.93E-03 [mg.kg-1]
Scenario II Units
PECagricultural soil 1.09E-01 [mg/kg dry wt.]
Humans via the environment: local
total daily intake 3.51E-04 [mg.kg-1.d-1]
Humans via the environment:
dominant exposure source and
fraction
Root Crops 99.9%
Secondary poisoning – worm-eating
birds and mammals 5.29E-02 [mg.kg-1]
Regional background Units
Regional PEC in surface water (total) 2.31E-07 [mg/l]
Regional PEC in air (total) 1.50E-11 [mg.m-3]
Regional PEC in agricultural soil
(total) 6.97E-04 [mg/kg wet wt.]
Regional PEC in pore water of
agricultural soils 7.88E-08 [mg/l]
Regional PEC in natural soil (total) 2.37E-07 [mg/kg wet wt.]
Regional PEC in industrial soil (total) 2.37E-07 [mg/kg wet wt.]
Regional PEC in sediment (total) 2.78E-03 [mg/kg wet wt.]
Table 3.124 presents the predicted steady state mass balance in the region and continent. Please note
that the steady state predicted by the model are the amounts and distribution at the regional and
continental scale arising from the C/D use application pathway only. Adding in the release of the same
substances via other pathways (air and waste water) could lead to a different steady state balance.
Table 3.124 Predicted background exposures for benz[a]anthracene at steady state arising from use of
composts and digestates
Steady state mass Units
Total steady-state mass (region +
continent) 5.85E+01 [t]
Steady-state mass in regional
freshwater (kg) 8.32E-01 [kg]
Steady-state mass in regional
seawater (kg) 8.70E-02 [kg]
Steady-state mass in regional air (kg) 6.08E-04 [kg]
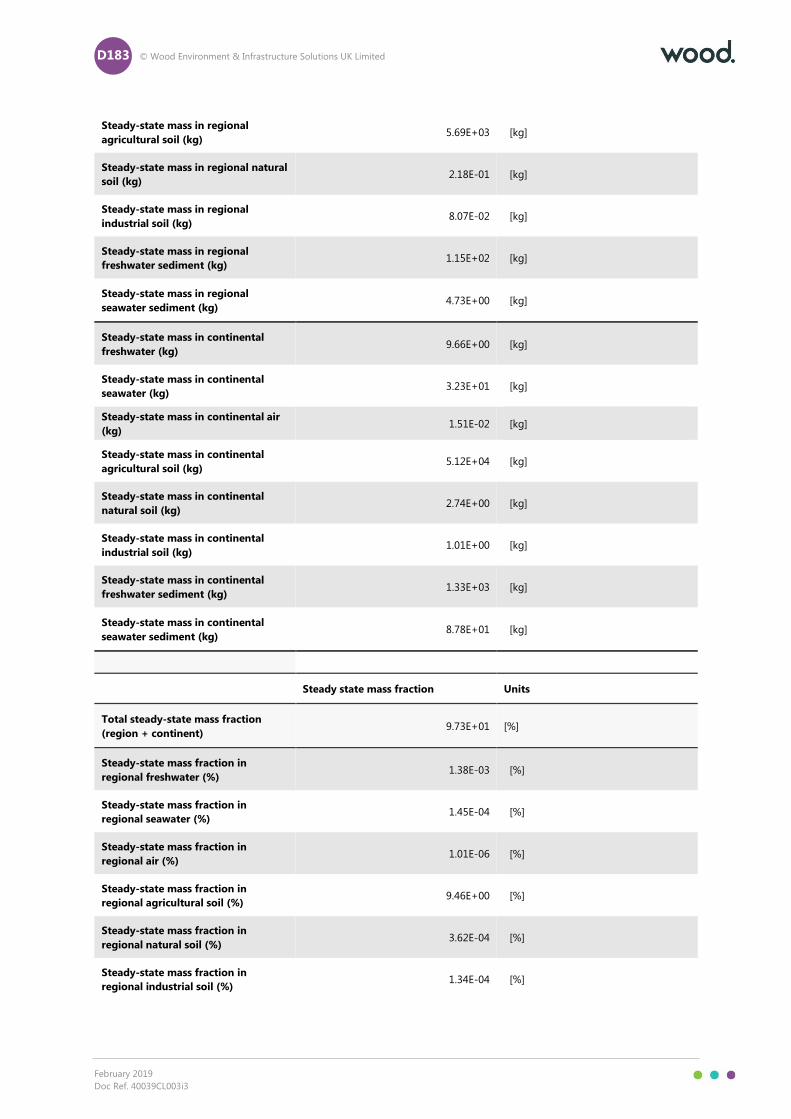
D183 © Wood Environment & Infrastructure Solutions UK Limited
February 2019
Doc Ref. 40039CL003i3
Steady-state mass in regional
agricultural soil (kg) 5.69E+03 [kg]
Steady-state mass in regional natural
soil (kg) 2.18E-01 [kg]
Steady-state mass in regional
industrial soil (kg) 8.07E-02 [kg]
Steady-state mass in regional
freshwater sediment (kg) 1.15E+02 [kg]
Steady-state mass in regional
seawater sediment (kg) 4.73E+00 [kg]
Steady-state mass in continental
freshwater (kg) 9.66E+00 [kg]
Steady-state mass in continental
seawater (kg) 3.23E+01 [kg]
Steady-state mass in continental air
(kg) 1.51E-02 [kg]
Steady-state mass in continental
agricultural soil (kg) 5.12E+04 [kg]
Steady-state mass in continental
natural soil (kg) 2.74E+00 [kg]
Steady-state mass in continental
industrial soil (kg) 1.01E+00 [kg]
Steady-state mass in continental
freshwater sediment (kg) 1.33E+03 [kg]
Steady-state mass in continental
seawater sediment (kg) 8.78E+01 [kg]
Steady state mass fraction Units
Total steady-state mass fraction
(region + continent) 9.73E+01 [%]
Steady-state mass fraction in
regional freshwater (%) 1.38E-03 [%]
Steady-state mass fraction in
regional seawater (%) 1.45E-04 [%]
Steady-state mass fraction in
regional air (%) 1.01E-06 [%]
Steady-state mass fraction in
regional agricultural soil (%) 9.46E+00 [%]
Steady-state mass fraction in
regional natural soil (%) 3.62E-04 [%]
Steady-state mass fraction in
regional industrial soil (%) 1.34E-04 [%]

D184 © Wood Environment & Infrastructure Solutions UK Limited
February 2019
Doc Ref. 40039CL003i3
Steady-state mass fraction in
regional freshwater sediment (%) 1.91E-01 [%]
Steady-state mass fraction in
regional seawater sediment (%) 7.87E-03 [%]
Steady-state mass in continental
freshwater (kg) 1.61E-02 [%]
Steady-state mass in continental
seawater (kg) 5.37E-02 [%]
Steady-state mass in continental air
(kg) 2.51E-05 [%]
Steady-state mass in continental
agricultural soil (kg) 8.52E+01 [%]
Steady-state mass in continental
natural soil (kg) 4.55E-03 [%]
Steady-state mass in continental
industrial soil (kg) 1.69E-03 [%]
Steady-state mass in continental
freshwater sediment (kg) 2.22E+00 [%]
Steady-state mass in continental
seawater sediment (kg) 1.46E-01 [%]
Sensitivity to specific variables
In respect of local Scenario II, the sensitivity of the outcomes to possible losses from the system by
leaching and drainage of excess water has been explored using a fugacity method. For this substance
the proportion of substance in the system distributed to the interstitial water at equilibrium under
‘high water content’ conditions, and hence sensitive to leaching, is ≤1% of the substance present in the
system. Hence, the sensitivity of the exposure scenario to such variations in water management is
considered to be low.
Summary of findings
Table 3.125 below presents the summary of key findings from the risk assessment of
benz[a]anthracene that has been made in this project.
Table 3.125 Summary of key findings for exposure of benz[a]anthracene via use of compost and
digestates
Key findings of the risk assessment of benz[a]anthracene in contaminated composts and digestates
Overall range of compost and digestate concentrations <0.04 – 0.33 mg benz[a]anthracene/kg dry wt., <0.3 – 20.8 mg
PAH/kg
Major raw material sources PAHs reported above ca. 3 mg/kg in sewage sludge (composted
and non-composted), bio-waste and green waste compost,
compost and digestate from source separation, digestate derived
from manure/slurry, and digestate derived from renewable raw
materials.
Safe limit concentration in compost and digestate Not applicable (risk characterisation ratio not definable).
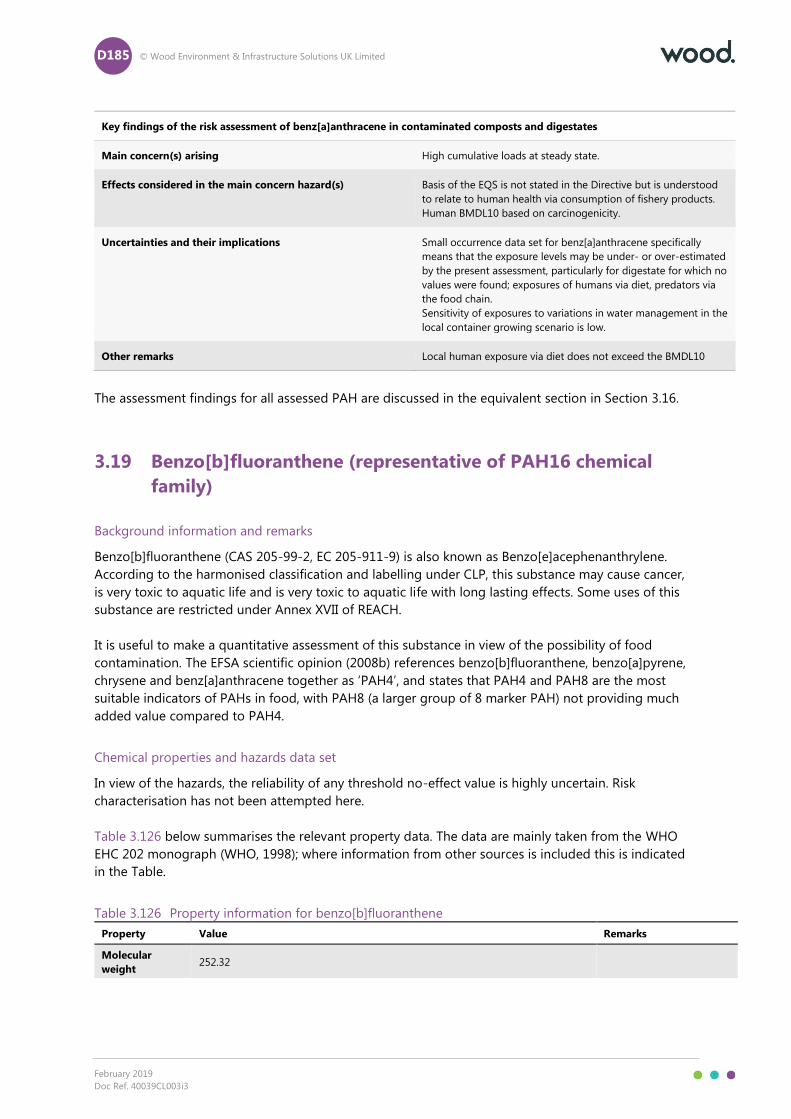
D185 © Wood Environment & Infrastructure Solutions UK Limited
February 2019
Doc Ref. 40039CL003i3
Key findings of the risk assessment of benz[a]anthracene in contaminated composts and digestates
Main concern(s) arising High cumulative loads at steady state.
Effects considered in the main concern hazard(s) Basis of the EQS is not stated in the Directive but is understood
to relate to human health via consumption of fishery products.
Human BMDL10 based on carcinogenicity.
Uncertainties and their implications Small occurrence data set for benz[a]anthracene specifically
means that the exposure levels may be under- or over-estimated
by the present assessment, particularly for digestate for which no
values were found; exposures of humans via diet, predators via
the food chain.
Sensitivity of exposures to variations in water management in the
local container growing scenario is low.
Other remarks Local human exposure via diet does not exceed the BMDL10
The assessment findings for all assessed PAH are discussed in the equivalent section in Section 3.16.
3.19 Benzo[b]fluoranthene (representative of PAH16 chemical
family)
Background information and remarks
Benzo[b]fluoranthene (CAS 205-99-2, EC 205-911-9) is also known as Benzo[e]acephenanthrylene.
According to the harmonised classification and labelling under CLP, this substance may cause cancer,
is very toxic to aquatic life and is very toxic to aquatic life with long lasting effects. Some uses of this
substance are restricted under Annex XVII of REACH.
It is useful to make a quantitative assessment of this substance in view of the possibility of food
contamination. The EFSA scientific opinion (2008b) references benzo[b]fluoranthene, benzo[a]pyrene,
chrysene and benz[a]anthracene together as ‘PAH4’, and states that PAH4 and PAH8 are the most
suitable indicators of PAHs in food, with PAH8 (a larger group of 8 marker PAH) not providing much
added value compared to PAH4.
Chemical properties and hazards data set
In view of the hazards, the reliability of any threshold no-effect value is highly uncertain. Risk
characterisation has not been attempted here.
Table 3.126 below summarises the relevant property data. The data are mainly taken from the WHO
EHC 202 monograph (WHO, 1998); where information from other sources is included this is indicated
in the Table.
Table 3.126 Property information for benzo[b]fluoranthene
Property Value Remarks
Molecular
weight 252.32

D186 © Wood Environment & Infrastructure Solutions UK Limited
February 2019
Doc Ref. 40039CL003i3
Melting point 168
SRC EPI experimental
literature database
(unreferenced)
Boiling point
Vapour pressure 6.67E-05Pa at 25C (Coover MP and Sims R, 1987) SRC EPI experimental
literature database
Water solubility 0.0015 mg/l (Yalkowsky and Dannenfelser 1992)
log Kow 5.78 (Wang et al 1986) SRC EPI experimental
literature database
Henry’s law
constant 0.0666 Pa.m3/mol - 25C (Ten Hulscher, TEM et al, 1992)
Koc
BCF
Biodegradability
In a study with sandy loams, forest soil, and roadside soil partially loaded with
sewage sludge from a municipal treatment plant, the following half-lives (in days)
were found: 113-282 for benzo[b]fluoranthene (Wild & Jones, 1993).
Half-life in air
18.5540 E-12 cm3/molecule-sec (AOP estimate) - note: Fraction sorbed to airborne
particulates (phi): 0.0902 (Junge-Pankow, Mackay avg) 0.306 (Koa method)
Note: the sorbed fraction may be resistant to atmospheric oxidation
Threshold
hazard values if
available
Value Remarks
PNECaquatic
(freshwater) MAC EQS of 0.017 µg/l applies (Directive 2008/105/EC as amended (2013/39/EU))
PNECsediment
(freshwater)
PNECsoil
PNECoral
predator
DNEL general
population oral BMDL10 = 0.34 mg/kg bw/d
EFSA scientific opinion
(2008b) (derived from 2-
year carcinogenicity study
on coal tar mixtures by
Culp et al. (1998)) (this
value is derived using the
multi-stage model).
Other relevant
data
Some members of the
group are PBT/vPvB
therefore it is not possible
to make a quantitative
assessment of
environmental risk

D187 © Wood Environment & Infrastructure Solutions UK Limited
February 2019
Doc Ref. 40039CL003i3
Occurrence data set
Table 3.127 presents a summary of the reported concentrations of benzo[b]fluoranthene in composts
and digestates. This is based on the survey of the available literature collected in Task 2 of the project
and reported in the main project report.
No substance-specific data for benzo[b]fluoranthene were reported in digestates although a small
number of measured values in composts are available. This represents an uncertainty in the exposure
assessment; in the absence of data it has been assumed that measurements in composts (particularly
composts derived from sewage sludge) would be reasonably representative of digestates.
Table 3.127 Reported occurrence of benzo[b]fluoranthene in composts and digestates
Concentrations in
composts/digestates Value - units of mg/kg dry wt. Remarks
Composts - data
availability
Only compost data are available for B[b]F itself, in a
relatively narrow range. The values for
Benzo[b]fluoranthene as such are <0.48-0.80 mg/kg
d.m. 2017 Poland / 0.12 mg/kg 2012 France / 0.22
mg/kg 2012 France / 0.35-2.14 mg/kg d.m. 2017
Poland.
Compost - minimum
concentration 0.12
Compost - mid-range
or average
concentration
0.48 (median)
Compost - maximum
concentration 2.14
Note, Saveyn and Eder report NF U44-051 and NF
U44-095 2.5 mg/kg d.m.(France).
Digestates - data
availability
In the absence of specific data on digestates, the
values reported in composts are applied in the
exposure assessment.
Digestate - minimum
concentration 0.12
Digestate - mid-range
or average
concentration
0.48
Digestate - maximum
concentration 2.14
These concentrations in compost and in digestate equate to the following release amounts at the
regional and continental scale.
Table 3.128 Estimated regional and continental release amounts
Parameter Value
Mass of substance in EU-28 in compost (kg/year) 4234
Mass of substance in EU-28 in digestate (kg/year) 16,934
Total regional emission to surface water (kg/day) 0.16
Total regional emission to soil (kg/day) 5.6
Total continental emission to surface water (kg/day) 1.5
Total continental emission to agricultural soil (kg/day) 51

D188 © Wood Environment & Infrastructure Solutions UK Limited
February 2019
Doc Ref. 40039CL003i3
These values have been applied in estimating the exposure concentrations for this substance arising
from use of composts and digestates. Exposures have been estimated for two concentration scenarios:
A more conservative assessment is derived using the maximum reported concentrations
in estimating the local releases from the two scenarios, with a mid-range concentration
used in estimating the regional background.
A less conservative assessment is derived separately using the mid-range reported
concentrations in estimating the local releases from the two scenarios, with a minimum
concentration used in estimating the regional background.
Table 3.129 and Table 3.130 below summarise background exposure data previously presented by
EFSA (2008b) and by WHO (2002).
Table 3.129 Reported background concentrations of benzo[b]fluoranthene in the environment
PECregional Value Remarks
Agricultural soil
Polycyclic aromatic hydrocarbon
concentrations (µg/kg dry weight) in soil of
background and rural areas -
Benzo[b]fluoranthene: 14/25 - Wales, United
Kingdom (depth, 5 cm) (Jones et al., 1987).
Other relevant data
Polycyclic aromatic hydrocarbon
concentrations (µg/kg fresh weight) in meat
and meat products - Benzo[b]fluoranthene:
0.04 - 92.3 in a range of product types (EHC
monograph).
Polycyclic aromatic hydrocarbon
concentrations (µg/kg) found in fish and
marine foods - Benzo[b+k]fluoranthenes: NC -
24.3
Polycyclic aromatic hydrocarbon
concentrations (µg/kg) in vegetables -
Benzo[b]fluoranthene:
EFSA report states that based on the currently
available data relating to occurrence and toxicity,
the CONTAM Panel concluded that PAH4 (which
includes benzo[b]fluoranthene) and PAH8 are the
most suitable indicators of PAHs in food, with
PAH8 not providing much added value compared
to PAH4.
Table 3.130 Reported background concentrations of benzo[b]fluoranthene in vegetables
Concentrations in leaf crops (µg/kg) *
Benzo[a]fluoranthene 0.08-2.6
Notes:
* – Kale, lettuce, cabbage from a range of studies in different countries (see table 53 of the EHC monograph (WHO IPCS, 1998)
for further details)
Generic exposure scenario outcomes
The assessment has estimated local and background exposures of benzo[b]fluoranthene resulting from
the use scenarios defined in Section 1, using the chemical property data and concentration in
composts and digestates in the previous sections as inputs. The predicted environmental exposure
concentrations are as summarised in Table 3.131 below.

D189 © Wood Environment & Infrastructure Solutions UK Limited
February 2019
Doc Ref. 40039CL003i3
Table 3.131 Predicted exposures for benzo[b]fluoranthene arising from use of composts and
digestates
Scenario I Units
PECagricultural soil 2.14E-02 [mg/kg dry wt.]
PECgrassland soil 8.36E-03 [mg/kg dry wt.]
PEC in groundwater 1.26E-06 [mg/l]
PECfreshwater 1.90E-06 [mg/l]
PECfreshwater-sediment 1.58E-01 [mg/kg dry wt.]
Humans via the environment: local
total daily intake 1.78E-04 [mg.kg-1.d-1]
Humans via the environment: daily
dose via drinking water 3.59E-08 [mg.kg-1.d-1]
Humans via the environment:
dominant exposure source and
fraction
Fish 63.4%
Secondary poisoning – freshwater
fish-eating birds and mammals 3.84E-01 [mg/kg wet wt.]
Secondary poisoning – worm-eating
birds and mammals 1.09E-02 [mg.kg-1]
Scenario II Units
PECagricultural soil 7.06E-01 [mg/kg dry wt.]
Humans via the environment: local
total daily intake 2.18E-03 [mg.kg-1.d-1]
Humans via the environment:
dominant exposure source and
fraction
Root Crops 99.3%
Secondary poisoning – worm-eating
birds and mammals 3.34E-01 [mg.kg-1]
Regional background Units
Regional PEC in surface water (total) 5.24E-07 [mg/l]
Regional PEC in air (total) 4.93E-10 [mg.m-3]
Regional PEC in agricultural soil
(total) 1.98E-03 [mg/kg wet wt.]
Regional PEC in pore water of
agricultural soils 1.35E-07 [mg/l]
Regional PEC in natural soil (total) 5.52E-06 [mg/kg wet wt.]

D190 © Wood Environment & Infrastructure Solutions UK Limited
February 2019
Doc Ref. 40039CL003i3
Regional PEC in industrial soil (total) 5.52E-06 [mg/kg wet wt.]
Regional PEC in sediment (total) 8.01E-03 [mg/kg wet wt.]
ifferent steady state balance.
Table 3.132 presents the predicted steady state mass balance in the region and continent. Please note
that the steady state predicted by the model are the amounts and distribution at the regional and
continental scale arising from the C/D use application pathway only. Adding in the release of the same
substances via other pathways (air and waste water) could lead to a different steady state balance.
Table 3.132 Predicted background exposures for benzo[b]fluoranthene at steady state arising from
use of composts and digestates
Steady state mass Units
Total steady-state mass (region +
continent) 1.66E+02 [t]
Steady-state mass in regional
freshwater (kg) 1.89E+00 [kg]
Steady-state mass in regional seawater
(kg) 1.92E-01 [kg]
Steady-state mass in regional air (kg) 1.99E-02 [kg]
Steady-state mass in regional
agricultural soil (kg) 1.62E+04 [kg]
Steady-state mass in regional natural
soil (kg) 5.07E+00 [kg]
Steady-state mass in regional industrial
soil (kg) 1.88E+00 [kg]
Steady-state mass in regional
freshwater sediment (kg) 3.32E+02 [kg]
Steady-state mass in regional seawater
sediment (kg) 1.50E+01 [kg]
Steady-state mass in continental
freshwater (kg) 2.08E+01 [kg]
Steady-state mass in continental
seawater (kg) 8.64E+01 [kg]
Steady-state mass in continental air
(kg) 3.82E-01 [kg]
Steady-state mass in continental
agricultural soil (kg) 1.45E+05 [kg]
Steady-state mass in continental
natural soil (kg) 4.90E+01 [kg]
Steady-state mass in continental
industrial soil (kg) 1.82E+01 [kg]

D191 © Wood Environment & Infrastructure Solutions UK Limited
February 2019
Doc Ref. 40039CL003i3
Steady-state mass in continental
freshwater sediment (kg) 3.66E+03 [kg]
Steady-state mass in continental
seawater sediment (kg) 3.36E+02 [kg]
Steady state mass fraction Units
Total steady-state mass fraction
(region + continent) 9.80E+01 [%]
Steady-state mass fraction in regional
freshwater (%) 1.11E-03 [%]
Steady-state mass fraction in regional
seawater (%) 1.13E-04 [%]
Steady-state mass fraction in regional
air (%) 1.18E-05 [%]
Steady-state mass fraction in regional
agricultural soil (%) 9.53E+00 [%]
Steady-state mass fraction in regional
natural soil (%) 2.99E-03 [%]
Steady-state mass fraction in regional
industrial soil (%) 1.11E-03 [%]
Steady-state mass fraction in regional
freshwater sediment (%) 1.96E-01 [%]
Steady-state mass fraction in regional
seawater sediment (%) 8.83E-03 [%]
Steady-state mass in continental
freshwater (kg) 1.23E-02 [%]
Steady-state mass in continental
seawater (kg) 5.09E-02 [%]
Steady-state mass in continental air
(kg) 2.25E-04 [%]
Steady-state mass in continental
agricultural soil (kg) 8.58E+01 [%]
Steady-state mass in continental
natural soil (kg) 2.89E-02 [%]
Steady-state mass in continental
industrial soil (kg) 1.07E-02 [%]
Steady-state mass in continental
freshwater sediment (kg) 2.16E+00 [%]
Steady-state mass in continental
seawater sediment (kg) 1.98E-01 [%]

D192 © Wood Environment & Infrastructure Solutions UK Limited
February 2019
Doc Ref. 40039CL003i3
Sensitivity to specific variables
In respect of local Scenario II, the sensitivity of the outcomes to possible losses from the system by
leaching and drainage of excess water has been explored using a fugacity method. For this substance
the proportion of substance in the system distributed to the interstitial water at equilibrium under
‘high water content’ conditions, and hence sensitive to leaching, is ≤1% of the substance present in the
system. Hence, the sensitivity of the exposure scenario to such variations in water management is
considered to be low.
Summary of findings
Table 3.133 below presents the summary of key findings from the risk assessment of
benzo[b]fluoranthene that has been made in this project.
Table 3.133 Summary of key findings for exposure of benzo[b]fluoranthene via use of compost and
digestates
Key findings of the risk assessment of benzo[b]fluoranthene in contaminated composts and digestates
Overall range of compost and digestate concentrations 0.12-2.14 mg benzo[b]fluoranthene/kg dry wt., <0.3 – 20.8
mg PAH/kg.
Major raw material sources PAHs reported above ca. 3 mg/kg in sewage sludge
(composted and non-composted), bio-waste and green
waste compost, compost and digestate from source
separation, digestate derived from manure/slurry, and
digestate derived from renewable raw materials.
Safe limit concentration in compost and digestate Not applicable (risk characterisation ratio not definable).
Main concern(s) arising High cumulative loads at steady state.
Effects considered in the main concern hazard(s) Basis of the EQS is not stated in the Directive but is
understood to relate to human health via consumption of
fishery products. Human BMDL10 based on carcinogenicity.
Uncertainties and their implications Small occurrence data set for benzo[b]fluoranthene
specifically means that the exposure levels may be under- or
over-estimated by the present assessment, especially for
digestate where no values were found; exposures of humans
via diet, predators via the food chain.
Sensitivity of exposures to variations in water management in
the local container growing scenario is low.
Other remarks Local human exposure via diet does not exceed the BMDL10.
The assessment findings for all assessed PAH are discussed in the equivalent section in Section 3.16.
3.20 Indeno[1,2,3-cd]pyrene (representative of PAH16 chemical
family)
Background information and remarks
Indeno[1,2,3-cd]pyrene (CAS 193-39-5, EC 205-893-2) is among the eight carcinogenic and genotoxic
PAHs (with benzo[a]pyrene, benz[a]anthracene, benzo[b]fluoranthene, benzo[k]fluoranthene,
benzo[ghi]perylene, chrysene, dibenz[a,h]anthracene) that were measured in the coal tar mixtures in

D193 © Wood Environment & Infrastructure Solutions UK Limited
February 2019
Doc Ref. 40039CL003i3
carcinogenicity studies (Culp et al., 1998) referenced by the EFSA CONTAM panel (PAH8). It is of higher
molecular weight than the PAH with slightly different chemical properties which is associated with
slightly different distribution properties and so offers an alternative perspective in terms of exposures
and distribution via this exposure pathway.
Chemical properties and hazards data set
Table 3.134 summarises the available chemical property data. The data are mainly taken from the ESR
RAR for coal tar pitch high-temperature (EC 2008d); where information from other sources is included
this is indicated in the Table.
Table 3.134 Property information for indeno[1,2,3-cd]pyrene
Property Value Remarks
Molecular weight 276.3 From CTPHT PBT assessment (ECB 2008)
Melting point 163.6 As above
Boiling point 536 As above
Vapour pressure 1.7 x 10⁻⁸ Pa at 25C
(estimated by EPIWIN) ESR RAR for CTPHT (EC, 2008d)
Water solubility
For indeno[1,2,3-
cd]pyrene no data were
available, a default value
of 0.1 μg/L was used
As above
log Kow 6.58 (estimated by ClogP) As above
Henry’s law
constant
0.046 Pa.m3/mol
(calculated by EUSES from
input data values)
ESR RAR for CTPHT (EC, 2008d)
Koc log Koc = 6.37 Karickhoff et al. (1979) (cited by ESR RAR for CTPHT)
BCF
Biodegradability
Mean half-lives: 1700h in
water, 17000h in soil and
55000h in sediment
(temperatures not stated;
assumed to be 25C)
ESR RAR for CTPHT uses mean half-lives by Mackay et al. (1992).
Half-life in air
Threshold hazard
values if available Value Remarks

D194 © Wood Environment & Infrastructure Solutions UK Limited
February 2019
Doc Ref. 40039CL003i3
PNECaquatic
(freshwater)
0.0027 μg/l (ESR RAR for
CTPHT)
PAHs can be toxic via different mode of actions, such as non-polar
narcosis and phototoxicity. The last is caused by the ability of PAHs to
absorb ultraviolet A (UVA) radiation (320–400 nm), ultraviolet B (UVB)
radiation (290–320 nm), and in some instances, visible light (400–700
nm). This toxicity may occur through two mechanisms:
photosensitization, and photomodification. Photosensitization generally
leads to the production of singlet oxygen, a reactive oxygen species that
is highly damaging to biological material. Photomodification of PAHs,
usually via oxidation, results in the formation of new compounds and
can occur under environmentally relevant levels of actinic radiation
(Lampi et al., 2005). The phototoxic effects can be observed after a short
period of exposure, which explains why for PAHs like anthracene,
fluoranthene and pyrene, where photoxicity is most evident, the acute
toxicity values are even lower than the chronic toxicity values. (ESR RAR
for CTPHT).
PNECsediment
(freshwater)
0.63 mg/kgdw (EQPM -
from ESR RAR CTPHT)
PNECsoil 0.13 mg/kgdw (EQPM -
from ESR RAR CTPHT)
PNECoral predator
DNEL general
population oral
Other relevant
data
Some members of the group are PBT/vPvB therefore it is not possible to
make a quantitative assessment of environmental risk.
Occurrence data set
Table 3.135 presents a summary of the reported concentrations of indeno[1,2,3-cd]pyrene and other
PAH in composts and digestates. This is based on the survey of the available literature collected in
Task 2 of the project and reported in the main project report.
No substance-specific data for indeno[1,2,3-cd]pyrene were reported in digestates although a small
number of measured values in composts are available. This represents an uncertainty in the exposure
assessment; in the absence of data it has been assumed that measurements in composts (particularly
composts derived from sewage sludge) would be reasonably representative of digestates.
Table 3.135 Reported occurrence of indeno[1,2,3-cd]pyrene in composts and digestates
Concentrations in
composts/digestates Value - units of mg/kg dry wt. Remarks
Composts - data
availability
Only 2 compost data are available for Indeno[1,2,3-
cd]pyrene itself / 6-ring PAH, for the same member
state coming from the same study. <0.04-2.32
mg/kg d.m. 2017 Poland.
Compost - minimum
concentration 0.04
The lower limit value is taken as such for the
purpose of a minimum exposure background
assessment, but is actually reported as a less-than
limit value.

D195 © Wood Environment & Infrastructure Solutions UK Limited
February 2019
Doc Ref. 40039CL003i3
Concentrations in
composts/digestates Value - units of mg/kg dry wt. Remarks
Compost - mid-range
or average
concentration
1.18 Mean of the range.
Compost - maximum
concentration 2.32
Digestates - data
availability
Using the same values as above, in the absence of
specific data for digestate. The compost values are
sewage sludge compost so in principle should also
be representative of digestate.
Digestate - minimum
concentration 0.04
Digestate - mid-range
or average
concentration
1.18
Digestate - maximum
concentration 2.32
These concentrations in compost and in digestate equate to the following release amounts at the
regional and continental scale.
Table 3.136 Estimated regional and continental release amounts
Parameter Value
Mass of substance in EU-28 in compost (kg/year) 10,408
Mass of substance in EU-28 in digestate (kg/year) 41,630
Total regional emission to surface water (kg/day) 0.40
Total regional emission to soil (kg/day) 14
Total continental emission to surface water (kg/day) 3.6
Total continental emission to agricultural soil (kg/day) 125
These values have been applied in estimating the exposure concentrations for this substance arising
from use of composts and digestates. Exposures have been estimated for two concentration scenarios:
A more conservative assessment is derived using the maximum reported concentrations
in estimating the local releases from the two scenarios, with a mid-range concentration
used in estimating the regional background.
A less conservative assessment is derived separately using the mid-range reported
concentrations in estimating the local releases from the two scenarios, with a minimum
concentration used in estimating the regional background.
Table 3.137 below summarises background exposure data previously presented by EFSA (2008b) and
WHO (2002).
Table 3.137 Reported background concentrations of indeno[1,2,3-cd]pyrene in the environment
PECregional Value Remarks
Air

D196 © Wood Environment & Infrastructure Solutions UK Limited
February 2019
Doc Ref. 40039CL003i3
Surface water
Sediment
Agricultural soil
Polycyclic aromatic hydrocarbon
concentrations (µg/kg dry weight) in soil of
background and rural areas - indeno[1,2,3-
cd]pyrene: 0.5-4.0 - Green Mountain, USA
(depth, 0-5 cm) (Sullivan & Mix, 1985).
EHC 202 (WHO 1998).
Soil pore
water/ground water
Natural soil
Urban/industrial soil
Other relevant data
EFSA report states Based on the currently available
data relating to occurrence and toxicity, the
CONTAM Panel concluded that PAH4 and PAH8
(which includes indeno[1,2,3-cd]pyrene) are the
most suitable indicators of PAHs in food, with
PAH8 not providing much added value compared
to PAH4.
Generic exposure scenario outcomes
The assessment has estimated local and background exposures of indeno[1,2,3-cd]pyrene resulting
from the use scenarios defined in Section 1, using the chemical property data and concentration in
composts and digestates in the previous sections as inputs. The predicted environmental exposure
concentrations are as summarised in
Table 3.138 below.
Table 3.138 Predicted exposures for indeno[1,2,3-cd]pyrene arising from use of composts and
digestates
Scenario I Units
PECagricultural soil 2.32E-02 [mg/kg dry wt.]
PECgrassland soil 9.06E-03 [mg/kg dry wt.]
PEC in groundwater 4.83E-07 [mg/l]
PECfreshwater 1.12E-06 [mg/l]
PECfreshwater-sediment 2.62E-01 [mg/kg dry wt.]
Humans via the environment: local
total daily intake 1.52E-04 [mg.kg-1.d-1]
Humans via the environment: daily
dose via drinking water 1.38E-08 [mg.kg-1.d-1]
Humans via the environment:
dominant exposure source and
fraction
Fish 54.1%

D197 © Wood Environment & Infrastructure Solutions UK Limited
February 2019
Doc Ref. 40039CL003i3
Secondary poisoning – freshwater
fish-eating birds and mammals 2.99E-01 [mg/kg wet wt.]
Secondary poisoning – worm-eating
birds and mammals 1.36E-02 [mg.kg-1]
Scenario II Units
PECagricultural soil 7.66E-01 [mg/kg dry wt.]
Humans via the environment: local
total daily intake 2.30E-03 [mg.kg-1.d-1]
Humans via the environment:
dominant exposure source and
fraction
Root Crops 99.3%
Secondary poisoning – worm-eating
birds and mammals 3.72E-01 [mg.kg-1]
Regional background Units
Regional PEC in surface water (total) 1.01E-06 [mg/l]
Regional PEC in air (total) 4.31E-11 [mg.m-3]
Regional PEC in agricultural soil
(total) 4.90E-03 [mg/kg wet wt.]
Regional PEC in pore water of
agricultural soils 1.18E-07 [mg/l]
Regional PEC in natural soil (total) 6.83E-07 [mg/kg wet wt.]
Regional PEC in industrial soil (total) 6.83E-07 [mg/kg wet wt.]
Regional PEC in sediment (total) 2.16E-02 [mg/kg wet wt.]
Table 3.139 presents the predicted steady state mass balance in the region and continent. Please note
that the steady state predicted by the model are the amounts and distribution at the regional and
continental scale arising from the C/D use application pathway only. Adding in the release of the same
substances via other pathways (air and waste water) could lead to a different steady state balance.
Table 3.139 Predicted background exposures for indeno[1,2,3-cd]pyrene at steady state arising from
use of composts and digestates
Steady state mass Units
Total steady-state mass (region +
continent) 4.11E+02 [t]
Steady-state mass in regional
freshwater (kg) 3.62E+00 [kg]
Steady-state mass in regional seawater
(kg) 3.51E-01 [kg]

D198 © Wood Environment & Infrastructure Solutions UK Limited
February 2019
Doc Ref. 40039CL003i3
Steady-state mass in regional air (kg) 1.74E-03 [kg]
Steady-state mass in regional
agricultural soil (kg) 4.00E+04 [kg]
Steady-state mass in regional natural
soil (kg) 6.27E-01 [kg]
Steady-state mass in regional industrial
soil (kg) 2.32E-01 [kg]
Steady-state mass in regional
freshwater sediment (kg) 8.93E+02 [kg]
Steady-state mass in regional seawater
sediment (kg) 4.93E+01 [kg]
Steady-state mass in continental
freshwater (kg) 3.84E+01 [kg]
Steady-state mass in continental
seawater (kg) 9.53E+01 [kg]
Steady-state mass in continental air
(kg) 4.43E-02 [kg]
Steady-state mass in continental
agricultural soil (kg) 3.60E+05 [kg]
Steady-state mass in continental
natural soil (kg) 8.06E+00 [kg]
Steady-state mass in continental
industrial soil (kg) 2.99E+00 [kg]
Steady-state mass in continental
freshwater sediment (kg) 9.46E+03 [kg]
Steady-state mass in continental
seawater sediment (kg) 6.69E+02 [kg]
Steady state mass fraction Units
Total steady-state mass fraction
(region + continent) 9.92E+01 [%]
Steady-state mass fraction in regional
freshwater (%) 8.75E-04 [%]
Steady-state mass fraction in regional
seawater (%) 8.46E-05 [%]
Steady-state mass fraction in regional
air (%) 4.20E-07 [%]
Steady-state mass fraction in regional
agricultural soil (%) 9.65E+00 [%]
Steady-state mass fraction in regional
natural soil (%) 1.51E-04 [%]

D199 © Wood Environment & Infrastructure Solutions UK Limited
February 2019
Doc Ref. 40039CL003i3
Steady-state mass fraction in regional
industrial soil (%) 5.60E-05 [%]
Steady-state mass fraction in regional
freshwater sediment (%) 2.15E-01 [%]
Steady-state mass fraction in regional
seawater sediment (%) 1.19E-02 [%]
Steady-state mass in continental
freshwater (kg) 9.27E-03 [%]
Steady-state mass in continental
seawater (kg) 2.30E-02 [%]
Steady-state mass in continental air
(kg) 1.07E-05 [%]
Steady-state mass in continental
agricultural soil (kg) 8.68E+01 [%]
Steady-state mass in continental
natural soil (kg) 1.95E-03 [%]
Steady-state mass in continental
industrial soil (kg) 7.21E-04 [%]
Steady-state mass in continental
freshwater sediment (kg) 2.28E+00 [%]
Steady-state mass in continental
seawater sediment (kg) 1.62E-01 [%]
Sensitivity to specific variables
In respect of local Scenario II, the sensitivity of the outcomes to possible losses from the system by
leaching and drainage of excess water has been explored using a fugacity method. For this substance
the proportion of substance in the system distributed to the interstitial water at equilibrium under
‘high water content’ conditions, and hence sensitive to leaching, is ≤1% of the substance present in the
system. Hence, the sensitivity of the exposure scenario to such variations in water management is
considered to be low.
Summary of findings
Table 3.140 below presents the summary of key findings from the risk assessment of indeno[1,2,3-
cd]pyrene that has been made in this project.
Table 3.140 Summary of key findings for exposure of indeno[1,2,3-cd]pyrene via use of compost and
digestates
Key findings of the risk assessment of indeno[1,2,3-cd]pyrene in contaminated composts and digestates
Overall range of compost and digestate concentrations <0.04-2.32 mg indeno[1,2,3-cd]pyrene /kg dry wt. , <0.3 –
20.8 mg PAH/kg.
Major raw material sources PAHs reported above ca. 3 mg/kg in sewage sludge
(composted and non-composted), bio-waste and green
waste compost, compost and digestate from source

D200 © Wood Environment & Infrastructure Solutions UK Limited
February 2019
Doc Ref. 40039CL003i3
Key findings of the risk assessment of indeno[1,2,3-cd]pyrene in contaminated composts and digestates
separation, digestate derived from manure/slurry, and
digestate derived from renewable raw materials.
Safe limit concentration in compost and digestate Not applicable (risk characterisation ratio not definable).
Main concern(s) arising High cumulative loads at steady state.
Effects considered in the main concern hazard(s) Basis of the EQS is not stated in the Directive but is
understood to relate to human health via consumption of
fishery products. Human BMDL10 based on carcinogenicity.
Uncertainties and their implications Small occurrence data set for indeno[1,2,3-cd]pyrene
specifically means that the exposure levels may be under- or
over-estimated by the present assessment, particularly for
digestate for which no values were found; exposures of
humans via diet, predators via the food chain.
Sensitivity of exposures to variations in water management in
the local container growing scenario is low.
Other remarks Local human exposure via diet does not exceed the BMDL10.
The assessment findings for all assessed PAH are discussed in the equivalent section in Section 3.16.
3.21 Perfluoroctanoic acid (PFOA) (representative of PFAs chemical
family)
Background information and remarks
PFOA (Perfluorooctanoic acid, CAS No. 335-67-1, EC 206-397-9) has been used industrially, for
example as a surface modifier compound / surfactant in a range of applications, though it has not
been registered in REACH.
Perfluorooctanoic acid62 (PFOA), its salts and PFOA-related compounds have been proposed as
persistent organic pollutants (POPs) for inclusion in Annex A, B and/or C to the Stockholm Convention
(UNEP, 2015) and there is also a REACH restriction.
It is an SVHC (Toxic for reproduction (Article 57c) PBT (Article 57d)), CMR, PBT.
Harmonised classification and labelling applies in the EU under CLP (Acute Tox. 4 - H302; Eye Dam. 1 -
H318; Acute Tox. 4 - H332; Carc. 2 - H351; Lact. - H362; STOT RE 1 - H372 (liver); Repr. 1B - H360D);
some CLP notifiers also self-classify for the environment.
Chemical properties and hazards data set
The relevant property data summarised in Table 3.155 below (taken from UNEP, 2016). Where
information from other sources is included this is indicated in the Table.
62 Also known as pentadecafluorooctanoic acid.

D201 © Wood Environment & Infrastructure Solutions UK Limited
February 2019
Doc Ref. 40039CL003i3
Table 3.141 Property information for PFOA (from UNEP (2016) unless otherwise indicated)
Property Value Comment
Molecular weight 414.07 g/mol
Melting point 44-56.5°C
Boiling point 188°C
Vapour pressure 4.2 Pa at 25°C
Water solubility 9,500 mg/l at 25°C This value is high but it is noted that
this substance is surface active which
affects it properties in water.
log Kow not measurable According to UNEP (2016) the log Kow
is not measurable.
ECHA (2013b) gives a calculated log
Kow of 2.69 at pH 7 and 25°C but
indicates that there is a large
uncertainty over the log Kow.
Henry’s law constant 0.18 Pa m3/mol (at 25°C) No data in UNEP (2016). Value
estimated from the water solubility and
vapour pressure.
Koc 115 l/kg From Danish EPA (2015). Value given as
log Koc = 2.06.
This value is relatively low but as a
surfactant, adsorption to surfaces could
be relatively high.
BCF 1.8-8.0 l/kg in aquatic organisms
no data for earthworms
Values taken from ECHA (2013b).
Biodegradability Extremely persistent in all
environmental compartments
Half-life in air 130 day
PNECs As a PBT and proposed POP, the
reliability of any threshold no-effect
value is highly uncertain. Risk
characterisation has not been
attempted here.
No PNECs derived in UNEP (2016) or
ECHA (2013b or 2014c). Ecotoxicity
data for ammonium
perfluorooctanoate taken from OECD
(2008).
DNEL As a PBT and POP, the reliability of any
threshold no-effect value is highly
uncertain. Risk characterisation has not
been attempted here.
The existence of the following
proposed safe levels is however noted
TDI = 1.5 µg/kg bw/day (EFSA, 2008)
TDI = 0.1 µg/kg bw/day (Danish EPA,
2015)
No DNEL derived in UNEP (2016) or
ECHA (2013b). ECHA (2017) only
defines DNEL for general population in
terms of the internal dose which is not
directly comparable. The tolerable daily
intake (TDI) has been determined to be
1.5 µg/kg bw/day (EFSA, 2008). A lower
TDI of 0.1 µg/kg bw/day has been
determined by Danish EPA (2015).
Other relevant data Trophic magnification factors (TMFs):
TMF 0.3-0.58 aquatic piscivorous food
webs
TMF 1.1-13 in air-breathing mammals
Values taken from ECHA (2013b).

D202 © Wood Environment & Infrastructure Solutions UK Limited
February 2019
Doc Ref. 40039CL003i3
Note: a) PFO is the conjugate base of PFOA. The dissociation constant given in UNEP (2016) is 1.5-2.8 with another value
given as <1.6. Under most environmental conditions UNEP (2016) indicates that the substance will be present as the PFO anion.
PFOA has been identified as an SVHC substance under the REACH Regulation on the basis of it being
toxic for reproduction (Article 57c of REACH) and its PBT properties (Article 57d of REACH).
Occurrence data set
Table 3.142 presents a summary of the reported concentrations of PFOA (PFT (PFOA+PFOS), or PFOA
specifically) in composts and digestates. This is based on the survey of the available literature collected
in Task 2 of the project and reported in the main project report.
Table 3.142 Reported occurrence of PFOA in composts and digestates
Concentrations in
composts/digestates
Value - units of mg/kg dry
wt. Remarks
Composts - data
availability
Both the highest and lowest reported values are for
perfluorinated surfactants (not differentiating specific
substances). The majority of values are cited by Saveyn and Eder
and refer to composts and digestates prepared by different
treatment methods.
Compost - minimum
concentration 0.0018
Many values are less-than limit values. The value used is the
lower range of one of the few reported quantitative values
available.
Compost - mid-range
or average
concentration
0.025
Many values are less-than limit values. The value used is the
upper range of one of the few reported quantitative values
available.
Compost - maximum
concentration 0.165
≤ 165 µg/kg d.m. (note - actually a less-than limit value) is the
highest mentioned limit value and is for a sewage sludge
compost. There are regulatory limit or guide values of 0.1 mg/kg
in all cases for: Austria, Germany, Denmark (Österreichische
Düngemittelverordnung, Deutsche Düngemittelverordnung,
Slambekendtgørelsen)
Digestates - data
availability
Very few digestate specific concentrations are reported. Almost
all of the reported concentration values are less-than limit
values. The larger data set for composts has been taken into
account.
Digestate - minimum
concentration 0.0018
Many values are less-than limit values. The value used is the
lower range of one of the few reported quantitative values
available.
Digestate - mid-range
or average
concentration
0.025
Many values are less-than limit values. The value used is the
upper range of one of the few reported quantitative values
available.
Digestate - maximum
concentration 0.045
≤ 45 µg/kg d.m. (note - actually a less-than limit value) is the
highest mentioned limit value and is for a bio-waste & green
waste manure energy crops digestate.
These concentrations in compost and in digestate equate to the following release amounts at the
regional and continental scale.

D203 © Wood Environment & Infrastructure Solutions UK Limited
February 2019
Doc Ref. 40039CL003i3
Table 3.143 Estimated regional and continental release amounts
Parameter Value
Mass of substance in EU-28 in compost (kg/year) 221
Mass of substance in EU-28 in digestate (kg/year) 882
Total regional emission to surface water (kg/day) 0.0085
Total regional emission to soil (kg/day) 0.29
Total continental emission to surface water (kg/day) 0.076
Total continental emission to agricultural soil (kg/day) 2.6
Perfluorinated chemicals including PFOS and PFOA have been detected in composts and digestates;
many of the values (including both the highest and lowest reported levels) refer to the sum of
pefluorinated surfactants and are not substance-specific. The majority of the quoted concentrations
found are presented as less-than limit concentrations (i.e. <x mg/kg) which may reflect the limit of
detection of the analytical method used. For the purpose of the present assessment these values have
been interpreted as equal to the limit concentration stated, but it is recognised that the true content of
PFOA could be below this.
The highest non-limit concentration is 24.6 µg/kg dry wt. (it is not specified whether this value is for
compost(s) or digestate(s) so it is assumed to apply for both); the highest concentration is ≤165 µg/kg
dry wt. in green waste compost, and this is the value used in the assessment for scenarios I and II. It is
noted that the concentration of ≤165 µg/kg dry wt. could actually exceed the regulatory limit values of
0.1 mg/kg d.m. for perfluorinated compounds, defined by Österreichische Düngemittelverordnung and
Slambekendtgørelsen. The highest concentration in digestate is ≤45 µg/kg dry wt. in bio-waste &
green waste manure energy crops digestate and this value is used in calculating the contribution to
regional exposure arising from use of digestate. There is no evidence as to whether the composts
containing PFOA are primarily for use as a soil amendment or as a growing medium.
These values have been applied in estimating the exposure concentrations for this substance arising
from use of composts and digestates. Exposures have been estimated for two concentration scenarios:
A more conservative assessment is derived using the maximum reported concentrations
in estimating the local releases from the two scenarios, with a mid-range concentration
used in estimating the regional background.
A less conservative assessment is derived separately using the mid-range reported
concentrations in estimating the local releases from the two scenarios, with a minimum
concentration used in estimating the regional background.
Table 3.144 below summarises background exposure data previously presented by ECHA (2014c). The
current regional background level of PFOA is not well established although ECHA (2014c) summarises
some literature findings. In light of its status as a proposed POP, there is an international commitment
to restrict its use, and hence significant decline in use is to be expected going forward and the context
of predicted environmental concentrations should be considered in this context.
Table 3.144 Reported background concentrations of PFOA in the environment
PECregional Value Remarks
Air

D204 © Wood Environment & Infrastructure Solutions UK Limited
February 2019
Doc Ref. 40039CL003i3
Surface water Very variable
Table A.B.4-6 in ECHA (2014c) documents results of 9 studies
covering a range of European fresh waters with values in the range
<0.0005 ng/l to 33,900 ng/l. The majority are below ≤100 ng/l but
there are several above this value (occasional high concentrations are
not representative of background).
Sediment
Agricultural soil /
Natural soil /
Urban/industrial soil
Up to 50 ng/g dwt
Soil pore water/ground
water
Very variable; mainly up to 84
ng/l
Other relevant data
Generic exposure scenario outcomes
The assessment has estimated local and background exposures of PFOA resulting from the use
scenarios defined in Section 1, using the chemical property data and concentration in composts and
digestates in the previous sections as inputs. The predicted environmental exposure concentrations are
as summarised in Table 3.145 below.
Table 3.145 Predicted exposures for PFOA arising from use of composts and digestates
Scenario I Units
PECagricultural soil 7.36E-04 [mg/kg dry wt.]
PECgrassland soil 1.50E-04 [mg/kg dry wt.]
PEC in groundwater 2.76E-04 [mg/l]
PECfreshwater 1.73E-06 [mg/l]
PECfreshwater-sediment 2.61E-05 [mg/kg dry wt.]
Humans via the environment: local
total daily intake 1.83E-05 [mg.kg-1.d-1]
Humans via the environment: daily
dose via drinking water 7.89E-06 [mg.kg-1.d-1]
Humans via the environment:
dominant exposure source and
fraction
Root Crops 51.2%
Secondary poisoning – freshwater
fish-eating birds and mammals 1.27E-05 [mg/kg wet wt.]
Secondary poisoning – worm-eating
birds and mammals 9.09E-04 [mg.kg-1]
Scenario II Units
PECagricultural soil 5.45E-02 [mg/kg dry wt.]

D205 © Wood Environment & Infrastructure Solutions UK Limited
February 2019
Doc Ref. 40039CL003i3
Humans via the environment: local
total daily intake 8.39E-04 [mg.kg-1.d-1]
Humans via the environment:
dominant exposure source and
fraction
Root Crops 90.4%
Secondary poisoning – worm-eating
birds and mammals 7.14E-02 [mg.kg-1]
Table 3.146 presents the predicted steady state mass balance in the region and continent. Please note
that the steady state predicted by the model are the amounts and distribution at the regional and
continental scale arising from the C/D use application pathway only. Adding in the release of the same
substances via other pathways (air and waste water) could lead to a different steady state balance.
Table 3.146 Predicted background exposures for PFOA at steady state arising from use of composts
and digestates
Steady state mass Units
Total steady-state mass (region +
continent) 4.82E+00 [t]
Steady-state mass in regional
freshwater (kg) 5.19E+00 [kg]
Steady-state mass in regional seawater
(kg) 5.71E-01 [kg]
Steady-state mass in regional air (kg) 9.93E-02 [kg]
Steady-state mass in regional
agricultural soil (kg) 1.57E+02 [kg]
Steady-state mass in regional natural
soil (kg) 2.22E-01 [kg]
Steady-state mass in regional industrial
soil (kg) 8.22E-02 [kg]
Steady-state mass in regional
freshwater sediment (kg) 2.02E-01 [kg]
Steady-state mass in regional seawater
sediment (kg) 6.43E-03 [kg]
Steady-state mass in continental
freshwater (kg) 1.18E+02 [kg]
Steady-state mass in continental
seawater (kg) 3.07E+03 [kg]
Steady-state mass in continental air
(kg) 5.14E+00 [kg]
Steady-state mass in continental
agricultural soil (kg) 1.45E+03 [kg]
Steady-state mass in continental
natural soil (kg) 5.80E+00 [kg]
Steady-state mass in continental
industrial soil (kg) 2.15E+00 [kg]
Steady-state mass in continental
freshwater sediment (kg) 4.59E+00 [kg]
Steady-state mass in continental
seawater sediment (kg) 1.73E+00 [kg]

D206 © Wood Environment & Infrastructure Solutions UK Limited
February 2019
Doc Ref. 40039CL003i3
Steady state mass fraction Units
Total steady-state mass fraction
(region + continent) 8.78E-01 [%]
Steady-state mass fraction in regional
freshwater (%) 9.46E-04 [%]
Steady-state mass fraction in regional
seawater (%) 1.04E-04 [%]
Steady-state mass fraction in regional
air (%) 1.81E-05 [%]
Steady-state mass fraction in regional
agricultural soil (%) 2.87E-02 [%]
Steady-state mass fraction in regional
natural soil (%) 4.04E-05 [%]
Steady-state mass fraction in regional
industrial soil (%) 1.50E-05 [%]
Steady-state mass fraction in regional
freshwater sediment (%) 3.68E-05 [%]
Steady-state mass fraction in regional
seawater sediment (%) 1.17E-06 [%]
Steady-state mass in continental
freshwater (kg) 2.15E-02 [%]
Steady-state mass in continental
seawater (kg) 5.59E-01 [%]
Steady-state mass in continental air
(kg) 9.38E-04 [%]
Steady-state mass in continental
agricultural soil (kg) 2.64E-01 [%]
Steady-state mass in continental
natural soil (kg) 1.06E-03 [%]
Steady-state mass in continental
industrial soil (kg) 3.92E-04 [%]
Steady-state mass in continental
freshwater sediment (kg) 8.37E-04 [%]
Steady-state mass in continental
seawater sediment (kg) 3.15E-04 [%]
Sensitivity to specific variables
In respect of local Scenario II, the sensitivity of the outcomes to possible losses from the system by
leaching and drainage of excess water has been explored using a fugacity method. For this substance
the proportion of substance in the system distributed to the interstitial water at equilibrium under
‘high water content’ conditions, and hence sensitive to leaching, is 18% of the substance present in the
system. Hence, the sensitivity of the exposure scenario to such variations in water management is
considered to be potentially significant.

D207 © Wood Environment & Infrastructure Solutions UK Limited
February 2019
Doc Ref. 40039CL003i3
Summary of findings
Table 3.147 below presents the summary of key findings from the risk assessment of PFOA that has
been made in this project. The findings are discussed further below the table.
Table 3.147 Summary of key findings for exposure of PFOA via use of compost and digestates
Key findings of the risk assessment of PFOA in contaminated composts and digestates
Overall range of compost and digestate concentrations <2E-03 - ≤0.165 mg/kg dry wt.
Major raw material sources PFOA/PFOS measured above ca 0.01 mg/kg in compost and
digestate from source separation, bio-waste & green waste
compost, green waste compost, sewage sludge compost,
"mechanical biological treatment compost", bio-waste &
green waste manure energy crops digestate, "mechanical
biological treatment digestate".
Safe limit concentration in compost and digestate Not applicable (risk characterisation ratio not definable).
Main concern(s) arising Source of exposure of a POP; Humans exposed via the
environment (especially via diet and drinking water); possible
transfer over long distances.
Effects considered in the main concern hazard(s) Proposed POP; human TDI based on mammalian liver
toxicity.
Uncertainties and their implications Small occurrence data sets for PFOA specifically, and almost
all stated values are less-than limit values.
Sensitivity of exposures to variations in water management in
the local container growing scenario is potentially significant.
In circumstances where a) the system is watered in excess of
the water holding capacity of the growing medium and b)
where the container design means that excess water will
drain away and not remain in contact with the
container/growing medium, then a significant proportion of
the substance could be lost from the system in the drained
water.
Other remarks
As a proposed POP, it is in itself a potentially important finding that PFOA or other PFAs have been
detected in freshly-produced composts and digestates at several different locations in recent years.
The raw material waste streams could be investigated further. However, the reported concentrations in
composts and digestates do not exceed the national limit values according to the data collected in this
project.
While risk characterisation has not been quantified, it is noted that the predicted exposures of humans
in the form of local total daily intake associated with local exposure when used for container growing
could exceed the safe limit (TDI) based on the value derived by Danish EPA (2015).
The estimated regional-scale predicted environmental concentrations in surface water, ground water
and agricultural soil arising from the application of C/D are within the range of the literature
concentrations presented in this section compared with natural background concentrations based on
ECHA (2014c).
The highest contributions to human exposure via the environment arising from the application of C/D
is mainly associated with dietary consumption of root vegetables; exposure via drinking water is also
high for local scenario I (application on land).

D208 © Wood Environment & Infrastructure Solutions UK Limited
February 2019
Doc Ref. 40039CL003i3
At steady state, <1% of the total mass remains within the region + continent63, suggesting that there is
high potential for transfer over long distances following release via the handling and application of
C/D64. The majority of the substance is modelled to be present in global tropic waters (56%) at steady
state followed by moderate waters (26%) and arctic waters (17%). The total mass in the region +
continent at steady state is <10 t in the baseline scenario. This steady-state mass amounts to 4.4 times
the mass released annually via application of composts and digestates65.
3.22 Perfluoroctanesulfonic acid (PFOS) (representative of PFAs
chemical family)
Background information and remarks
PFOS and its salts are among the more recently adopted ‘new’ POPs. PFOS is both intentionally
produced and also is an unintended degradation product of related anthropogenic chemicals. Various
applications have been relevant in the international chemicals industry.
Chemical properties and hazards data set
The relevant property data summarised in Table 3.148 below (taken from the UNEP POP risk profile
(2011) and Environment Agency EUSES risk assessment (2004)). Where information from other sources
is included this is indicated in the Table.
Table 3.148 Property information for PFOS (from the UNEP POP risk profile (2011) unless otherwise
indicated)
Property Value Comment
Molecular weight 538
all data is from the UNEP POP risk
profile unless otherwise stated
Melting point >400°C
Boiling point not measurable
Vapour pressure 3.31E-04 Pa (temperature not stated,
assumed to be ambient)
Water solubility 519 mg/L (20 ± 0,5ºC); 680 mg/L (24 -
25ºC). 519 mg/l value used in EUSES
log Kow
Cannot be determined
A surrogate value of 4.88 is used in
EUSES to support the humans via
environment assessment (EA, 2004 risk
assessment)
63 This refers to the regional and continental spatial scales in the EUSES model. Refer to Section 1.7 and the Annex for further
information. 64 The possibility or not for transfer over long distance is largely an inherent property of the substances themselves, but it is
interesting if this is expressed even when the pathway into the environment is so dominated by incorporation into soil. 65 Please note this is not to be interpreted as how much time elapses to reach steady state; the steady state predicted by the
model are the amounts and distribution at the regional and continental scale arising from the compost and digestate use
application pathway only. Adding in the release of the same substances via other pathways (air and waste water) could lead to a
different steady state picture.

D209 © Wood Environment & Infrastructure Solutions UK Limited
February 2019
Doc Ref. 40039CL003i3
Property Value Comment
Henry’s law constant
3.09 x 10⁻⁹ atm m3/mol pure water
Equivalent to 3.1E-04 Pa.m3/mol,
EUSES derives a very similar value;
reported value from risk profile entered
in EUSES.
Koc Measured Kd values in l/kg from OECD
106 study (mean from adsorption and
desorption phases): 12.8-35.1 in
different soil types, mean 27 l/kg; 8.7 in
river sediment; 1028 in WWTP sludge.
These Kds have been used in EUSES.
From EA environmental risk assessment
(2004)
BCF BCF values around 3000 from fish
studies (whole-fish kinetic
bioconcentration factor (BCFK)) 2796 in
L. macrochirus (OECD 305, 3M, 2002);
BCF in liver and plasma 2900 and 3100
respectively (estimated, Martin et al,
2003).
BMF values are variable and are high
especially in top predators; range 22 -
~4000 for several predator species
types mainly referring to marine food
chain and levels in specific tissues (refer
to the report for further details). A
trophic magnification factor (TMF) of
5.9 was calculated for PFOS based on a
pelagic food web including: one
invertebrate species, Mysis; two forage
fish species, rainbow smelt and alewife;
and a top predator fish species, lake
trout. A diet-weighted bioaccumulation
factor of approximately 3 was
determined for the trout (Martin et al.,
(2004b).
Note: EA 2004 used BMF1, BMF2 = 2.
BCF earthworm: 60.5 l/kg wet wt.
(derived in EA 2004 risk assessment).
The diet weighted bioaccumulation factor
has been entered in EUSES as the BMF for
fish, and a nominal value of 100 has been
entered for predators
Biodegradability t1/2 >41 years (hydrolysis); >3.7 years
(photodegradation in water); no
aerobic or anaerobic biodegradability.
Half-life in air 114d (estimated)
PNECs An annual average EQS of 6.5E-04 µg/l
and MAC EQS of 36 µg/l are
established for inland surface waters;
an EQS of 9.1 mg/kg for biota is
applicable (Directive 2008/105/EC as
amended (2013/39/EU)).
DNEL As a PBT and POP, the reliability of any
threshold no-effect value is highly
uncertain. Risk characterisation has not
been attempted here.
The existence of the following
proposed safe levels is however noted
The tolerable daily intake (TDI) has
been determined to be 150 ng/kg
bw/day (EFSA, 2008). A lower TDI of
0.03 µg/kg bw/day has been
determined by Danish EPA (2015).

D210 © Wood Environment & Infrastructure Solutions UK Limited
February 2019
Doc Ref. 40039CL003i3
Property Value Comment
TDI = 0.15 µg/kg bw/day (EFSA, 2008)
TDI = 0.03 µg/kg bw/day (Danish EPA,
2015).
Other relevant data
Occurrence data set
Table 3.156 presents a summary of the reported concentrations of PFOS (PFT (PFOA+PFOS), or PFOS
specifically) in composts and digestates. This is based on the survey of the available literature collected
in Task 2 of the project and reported in the main project report.
Table 3.149 Reported occurrence of PFOS in composts and digestates
Concentrations in
composts/digestates
Value - units of mg/kg dry
wt. Remarks
Composts - data
availability
Both the highest and lowest reported values are for
perfluorinated surfactants (not differentiating specific
substances). The majority of values are cited by Saveyn and Eder
and refer to composts and digestates prepared by different
treatment methods.
Compost - minimum
concentration 0.0018
Many values are less-than limit values. The value used is the
lower range of one of the few reported quantitative values
available.
Compost - mid-range
or average
concentration
0.025
Many values are less-than limit values. The value used is the
upper range of one of the few reported quantitative values
available.
Compost - maximum
concentration 0.165
≤ 165 µg/kg d.m. (note - actually a less-than limit value) is the
highest mentioned limit value and is for a sewage sludge
compost. There are regulatory limit or guide values of 0.1 mg/kg
in all cases for: Austria, Germany, Denmark (Österreichische
Düngemittelverordnung, Deutsche Düngemittelverordnung,
Slambekendtgørelsen).
Digestates - data
availability
Very few digestate specific concentrations are reported. Almost
all of the reported concentration values are less-than limit
values. The larger data set for composts has been taken into
account.
Digestate - minimum
concentration 0.0018
Many values are less-than limit values. The value used is the
lower range of one of the few reported quantitative values
available.
Digestate - mid-range
or average
concentration
0.025
Many values are less-than limit values. The value used is the
upper range of one of the few reported quantitative values
available.
Digestate - maximum
concentration 0.045
≤ 45 µg/kg d.m. (note - actually a less-than limit value) is the
highest mentioned limit value and is for a bio-waste & green
waste manure energy crops digestate.

D211 © Wood Environment & Infrastructure Solutions UK Limited
February 2019
Doc Ref. 40039CL003i3
These concentrations in compost and in digestate equate to the following release amounts at the
regional and continental scale.
Table 3.150 Estimated regional and continental release amounts
Parameter Value
Mass of substance in EU-28 in compost (kg/year) 221
Mass of substance in EU-28 in digestate (kg/year) 882
Total regional emission to surface water (kg/day) 0.0085
Total regional emission to soil (kg/day) 0.29
Total continental emission to surface water (kg/day) 0.076
Total continental emission to agricultural soil (kg/day) 2.6
Perfluorinated chemicals including PFOS and PFOA have been detected in composts and digestates;
many of the values (including both the highest and lowest reported levels) refer to the sum of
pefluorinated surfactants and are not substance-specific. The majority of the quoted concentrations
found are presented as less-than limit concentrations (i.e. <x mg/kg) which may reflect the limit of
detection of the analytical method used. For the purpose of the present assessment these values have
been interpreted as equal to the limit concentration stated, but it is recognised that the true content of
PFOS could be below this.
The highest non-limit concentration is 24.6 µg/kg dry wt. (it is not specified whether this value is for
compost(s) or digestate(s) so it is assumed to apply for both); the highest concentration for composts
is ≤165 µg/kg dry wt. (in green waste compost), and this is the value used in the assessment for
scenarios I and II; the highest concentration in digestate is also a limit value but potentially lower, at
≤45 µg/kg dry wt.. It is noted that the concentration of ≤165 µg/kg dry wt. could actually exceed the
regulatory limit values of 0.1 mg/kg d.m. for perfluorinated compounds, defined by Österreichische
Düngemittelverordnung and Slambekendtgørelsen. The highest concentration in digestate of ≤45
µg/kg dry wt. is for bio-waste & green waste manure energy crops digestate and this value is used in
calculating the contribution to regional exposure arising from use of digestate. There is no evidence as
to whether the composts containing PFOA are primarily for use as a soil amendment or as a growing
medium.
These values have been applied in estimating the exposure concentrations for this substance arising
from use of composts and digestates. Exposures have been estimated for two concentration scenarios:
A more conservative assessment is derived using the maximum reported concentrations
in estimating the local releases from the two scenarios, with a mid-range concentration
used in estimating the regional background.
A less conservative assessment is derived separately using the mid-range reported
concentrations in estimating the local releases from the two scenarios, with a minimum
concentration used in estimating the regional background.
Table 3.151 below summarises background exposure data previously presented by the Environment
Agency (2004). In light of its status as a POP, there is an international commitment to restrict its use,
and hence significant continuing decline in use is to be expected going forward and the context of
predicted environmental concentrations should be considered in this context.

D212 © Wood Environment & Infrastructure Solutions UK Limited
February 2019
Doc Ref. 40039CL003i3
Table 3.151 Reported background concentrations of PFOS in the environment
PECregional Value Remarks
Air
Surface water ND - 0.138 ppb (urban, USA) quoted in EA (2004)
Sediment
Agricultural soil /
Natural soil /
Urban/industrial soil
Soil pore water/ground
water 4 – 110 μg/l quoted in EA (2004)
Other relevant data
Generic exposure scenario outcomes
The assessment has estimated local and background exposures of PFOS resulting from the use
scenarios defined in Section 1, using the chemical property data and concentration in composts and
digestates in the previous sections as inputs. The predicted environmental exposure concentrations are
as summarised in Table 3.152 below.
Table 3.152 Predicted exposures for PFOS arising from use of composts and digestates
Scenario I Units
PECagricultural soil 2.49E-03
[mg/kg dry wt.]
PECgrassland soil 9.02E-04
[mg/kg dry wt.]
PEC in groundwater 9.15E-05
[mg/l]
PECfreshwater 2.71E-06
[mg/l]
PECfreshwater-sediment 3.34E-05
[mg/kg dry wt.]
Humans via the environment: local
total daily intake
3.28E-04 [mg.kg-1.d-1]
Humans via the environment: daily
dose via drinking water
2.62E-06 [mg.kg-1.d-1]
Humans via the environment:
dominant exposure source and
fraction
Root Crops 94.7%
Secondary poisoning – freshwater
fish-eating birds and mammals
2.31E-02
[mg/kg wet wt.]
Secondary poisoning – worm-eating
birds and mammals
2.96E-03 [mg.kg-1]
Scenario II Units
PECagricultural soil 5.45E-02 [mg/kg dry wt.]

D213 © Wood Environment & Infrastructure Solutions UK Limited
February 2019
Doc Ref. 40039CL003i3
Humans via the environment: local
total daily intake
6.85E-03 [mg.kg-1.d-1]
Humans via the environment:
dominant exposure source and
fraction
Root Crops 99.4%
Secondary poisoning – worm-eating
birds and mammals 5.73E-02 [mg.kg-1]
Table 3.153 presents the predicted steady state mass balance in the region and continent. Please note
that the steady state predicted by the model are the amounts and distribution at the regional and
continental scale arising from the C/D use application pathway only. Adding in the release of the same
substances via other pathways (air and waste water) could lead to a different steady state balance.
Table 3.153 Predicted background exposures for PFOS at steady state arising from use of composts
and digestates
Steady state mass Units
Total steady-state mass (region +
continent) 2.81E+01 [t]
Steady-state mass in regional
freshwater (kg) 8.75E+00 [kg]
Steady-state mass in regional seawater
(kg) 9.55E-01 [kg]
Steady-state mass in regional air (kg) 5.81E-05 [kg]
Steady-state mass in regional
agricultural soil (kg) 2.47E+03 [kg]
Steady-state mass in regional natural
soil (kg) 9.69E-01 [kg]
Steady-state mass in regional industrial
soil (kg) 3.59E-01 [kg]
Steady-state mass in regional
freshwater sediment (kg) 4.39E-01 [kg]
Steady-state mass in regional seawater
sediment (kg) 1.46E-02 [kg]
Steady-state mass in continental
freshwater (kg) 2.39E+02 [kg]
Steady-state mass in continental
seawater (kg) 3.28E+03 [kg]
Steady-state mass in continental air
(kg) 5.81E-04 [kg]
Steady-state mass in continental
agricultural soil (kg) 2.21E+04 [kg]
Steady-state mass in continental
natural soil (kg) 4.89E+00 [kg]
Steady-state mass in continental
industrial soil (kg) 1.81E+00 [kg]
Steady-state mass in continental
freshwater sediment (kg) 1.20E+01 [kg]
Steady-state mass in continental
seawater sediment (kg) 2.50E+00 [kg]

D214 © Wood Environment & Infrastructure Solutions UK Limited
February 2019
Doc Ref. 40039CL003i3
Steady state mass fraction Units
Total steady-state mass fraction
(region + continent) 4.59E+00 [%]
Steady-state mass fraction in regional
freshwater (%) 1.43E-03 [%]
Steady-state mass fraction in regional
seawater (%) 1.56E-04 [%]
Steady-state mass fraction in regional
air (%) 9.49E-09 [%]
Steady-state mass fraction in regional
agricultural soil (%) 4.03E-01 [%]
Steady-state mass fraction in regional
natural soil (%) 1.58E-04 [%]
Steady-state mass fraction in regional
industrial soil (%) 5.86E-05 [%]
Steady-state mass fraction in regional
freshwater sediment (%) 7.17E-05 [%]
Steady-state mass fraction in regional
seawater sediment (%) 2.38E-06 [%]
Steady-state mass in continental
freshwater (kg) 3.89E-02 [%]
Steady-state mass in continental
seawater (kg) 5.35E-01 [%]
Steady-state mass in continental air
(kg) 9.48E-08 [%]
Steady-state mass in continental
agricultural soil (kg) 3.61E+00 [%]
Steady-state mass in continental
natural soil (kg) 7.99E-04 [%]
Steady-state mass in continental
industrial soil (kg) 2.96E-04 [%]
Steady-state mass in continental
freshwater sediment (kg) 1.96E-03 [%]
Steady-state mass in continental
seawater sediment (kg) 4.09E-04 [%]
Sensitivity to specific variables
In respect of local Scenario II, the sensitivity of the outcomes to possible losses from the system by
leaching and drainage of excess water has been explored using a fugacity method. For this substance
the proportion of substance in the system distributed to the interstitial water at equilibrium under
‘high water content’ conditions, and hence sensitive to leaching, is ≤1% of the substance present in the
system. Hence, the sensitivity of the exposure scenario to such variations in water management is
considered to be low.
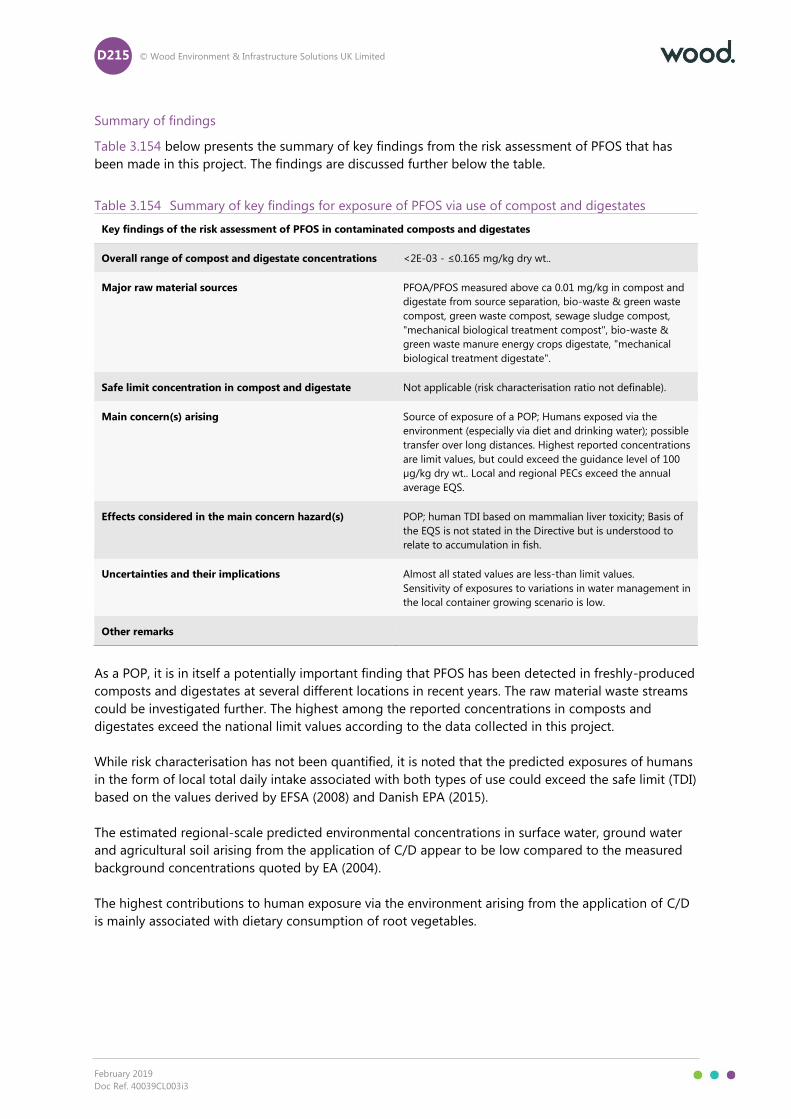
D215 © Wood Environment & Infrastructure Solutions UK Limited
February 2019
Doc Ref. 40039CL003i3
Summary of findings
Table 3.154 below presents the summary of key findings from the risk assessment of PFOS that has
been made in this project. The findings are discussed further below the table.
Table 3.154 Summary of key findings for exposure of PFOS via use of compost and digestates
Key findings of the risk assessment of PFOS in contaminated composts and digestates
Overall range of compost and digestate concentrations <2E-03 - ≤0.165 mg/kg dry wt..
Major raw material sources PFOA/PFOS measured above ca 0.01 mg/kg in compost and
digestate from source separation, bio-waste & green waste
compost, green waste compost, sewage sludge compost,
"mechanical biological treatment compost", bio-waste &
green waste manure energy crops digestate, "mechanical
biological treatment digestate".
Safe limit concentration in compost and digestate Not applicable (risk characterisation ratio not definable).
Main concern(s) arising Source of exposure of a POP; Humans exposed via the
environment (especially via diet and drinking water); possible
transfer over long distances. Highest reported concentrations
are limit values, but could exceed the guidance level of 100
µg/kg dry wt.. Local and regional PECs exceed the annual
average EQS.
Effects considered in the main concern hazard(s) POP; human TDI based on mammalian liver toxicity; Basis of
the EQS is not stated in the Directive but is understood to
relate to accumulation in fish.
Uncertainties and their implications Almost all stated values are less-than limit values.
Sensitivity of exposures to variations in water management in
the local container growing scenario is low.
Other remarks
As a POP, it is in itself a potentially important finding that PFOS has been detected in freshly-produced
composts and digestates at several different locations in recent years. The raw material waste streams
could be investigated further. The highest among the reported concentrations in composts and
digestates exceed the national limit values according to the data collected in this project.
While risk characterisation has not been quantified, it is noted that the predicted exposures of humans
in the form of local total daily intake associated with both types of use could exceed the safe limit (TDI)
based on the values derived by EFSA (2008) and Danish EPA (2015).
The estimated regional-scale predicted environmental concentrations in surface water, ground water
and agricultural soil arising from the application of C/D appear to be low compared to the measured
background concentrations quoted by EA (2004).
The highest contributions to human exposure via the environment arising from the application of C/D
is mainly associated with dietary consumption of root vegetables.

D216 © Wood Environment & Infrastructure Solutions UK Limited
February 2019
Doc Ref. 40039CL003i3
At steady state, 5% of the total mass remains within the region + continent66, suggesting that there is
high potential for transfer over long distances following release via the handling and application of
C/D67. The majority of the substance is modelled to be present in global tropic waters (54%) at steady
state followed by moderate waters (25%) and arctic waters (16%). The total mass in the region +
continent at steady state is 28 t in the baseline scenario. This steady-state mass amounts to 25 times
the mass released annually via application of composts and digestates68.
3.23 PFHxA (representative of PFAs chemical family)
Background information and remarks
Undecafluorohexanoic acid / ammonium undecafluorohexanoate have at the time of writing very
recently been proposed for listing as SVHC on the basis of equivalent concern for the environment and
human health based on numerous justifying factors.
Chemical properties and hazards data set
The relevant property data summarised in Table 3.155 below (taken from ECHA, 2018). Where
information from other sources is included this is indicated in the Table.
Table 3.155 Property information for PFHxA (from ECHA, 2018 unless otherwise indicated)
Property Value Comment
Molecular weight 314.05 g/mol
Melting point 12-14 °C Huang, Bing Nan, 1987
Boiling point 157 °C Savu PM (Kirk Othmer)
Vapour pressure 263.93 Pa Estimated value (EPIWIN)
Water solubility 15.7 g/l (ambient
temperature)
Zhao et al, 2014
log Kow 4.06 Estimated value (COSMOtherm)
Henry’s law constant 5.279 Pa * m³/mol Derived from VP and WS
Koc log Koc = 3.0 Vierke, 2014
BCF A comparative analysis of a
homologues series of C7-
C14 PFCAs and lipophilic
organohalogens in an Arctic Marine
Food Web by Kelly et al. ((Kelly et
66 This refers to the regional and continental spatial scales in the EUSES model. Refer to Section 1.7 and the Annex for further
information. 67 The possibility or not for transfer over long distance is largely an inherent property of the substances themselves, but it is
interesting if this is expressed even when the pathway into the environment is so dominated by incorporation into soil. 68 Please note this is not to be interpreted as how much time elapses to reach steady state; the steady state predicted by the
model are the amounts and distribution at the regional and continental scale arising from the compost and digestate use
application pathway only. Adding in the release of the same substances via other pathways (air and waste water) could lead to a
different steady state picture.

D217 © Wood Environment & Infrastructure Solutions UK Limited
February 2019
Doc Ref. 40039CL003i3
Property Value Comment
al., 2009) shows an efficient respiratory
elimination in water-respiring
organisms due to high
water throughput and high water
solubility of PFCAs but very slow
elimination and
biomagnification in air-breathing
animals of PFCAs.
Biodegradability Extremely persistent in all
environmental compartments.
Half-life in air Photolytic degradation half life of 20.57
days.
PNECs As a proposed SVHC and proposed
POP, the reliability of any threshold no-
effect value is highly uncertain. Risk
characterisation has not been
attempted here.
DNEL As a proposed SVHC and POP, the
reliability of any threshold no-effect
value is highly uncertain. Risk
characterisation has not been
attempted here.
Other relevant data
Note: a) PFHx is the conjugate base of PFHxA. The dissociation constant given in UNEP (2016) is 1.5-2.8 with another value
given as <1.6. Under most environmental conditions UNEP (2016) indicates that the substance will be present as the PFHx anion.
PFHxA has been proposed as a SVHC substance under the REACH Regulation on the basis of a large
number of equivalent concern factors.
Occurrence data set
Concentrations of PFHxA as such were not found in the data gathering phase of the project, however A
summary of the reported concentrations of PFOS, PFOA, PFNA, or PFT (PFOA+PFOS), in composts and
digestates is presented in Table 3.156. This is based on the survey of the available literature collected
in Task 2 of the project and reported in the main project report.
Table 3.156 Reported occurrence of PFHxA in composts and digestates
Concentrations in
composts/digestates
Value - units of mg/kg dry
wt. Remarks
Composts - data
availability
Both the highest and lowest reported values are for
perfluorinated surfactants (not differentiating specific
substances). The majority of values are cited by Saveyn and Eder
and refer to composts and digestates prepared by different
treatment methods.
Compost - minimum
concentration 0.0018
Many values are less-than limit values. The value used is the
lower range of one of the few reported quantitative values
available.

D218 © Wood Environment & Infrastructure Solutions UK Limited
February 2019
Doc Ref. 40039CL003i3
Compost - mid-range
or average
concentration
0.025
Many values are less-than limit values. The value used is the
upper range of one of the few reported quantitative values
available.
Compost - maximum
concentration 0.165
≤ 165 µg/kg d.m. (note - actually a less-than limit value) is the
highest mentioned limit value and is for a sewage sludge
compost. There are regulatory limit or guide values of 0.1 mg/kg
in all cases for: Austria, Germany, Denmark (Österreichische
Düngemittelverordnung, Deutsche Düngemittelverordnung,
Slambekendtgørelsen).
Digestates - data
availability
Very few digestate specific concentrations are reported. Almost
all of the reported concentration values are less-than limit
values. The larger data set for composts has been taken into
account.
Digestate - minimum
concentration 0.0018
Many values are less-than limit values. The value used is the
lower range of one of the few reported quantitative values
available.
Digestate - mid-range
or average
concentration
0.025
Many values are less-than limit values. The value used is the
upper range of one of the few reported quantitative values
available.
Digestate - maximum
concentration 0.045
≤ 45 µg/kg d.m. (note - actually a less-than limit value) is the
highest mentioned limit value and is for a bio-waste & green
waste manure energy crops digestate.
These concentrations in compost and in digestate equate to the following release amounts at the
regional and continental scale.
Table 3.157 Estimated regional and continental release amounts
Parameter Value
Mass of substance in EU-28 in compost (kg/year) 221
Mass of substance in EU-28 in digestate (kg/year) 882
Total regional emission to surface water (kg/day) 0.0085
Total regional emission to soil (kg/day) 0.29
Total continental emission to surface water (kg/day) 0.076
Total continental emission to agricultural soil (kg/day) 2.6
Table 3.158 Reported background concentrations of PFHxA in the environment (as cited in ECHA,
2018)
PECregional Value Remarks
Air
Surface water <0.63 – 31.4 ng/l in European
freshwaters

D219 © Wood Environment & Infrastructure Solutions UK Limited
February 2019
Doc Ref. 40039CL003i3
Sediment <50 – 1600 pg/kg in European
sediments
Agricultural soil /
Natural soil /
Urban/industrial soil
0.00043 - 2761 µg/kg dry wt.t in
European soils
Soil pore water/ground
water
Other relevant data
Generic exposure scenario outcomes
The assessment has estimated local and background exposures of PFHxA resulting from the use
scenarios defined in Section 1 , using the chemical property data and concentration in composts and
digestates in the previous sections as inputs. The predicted environmental exposure concentrations are
as summarised in Table 3.159 below.
Table 3.159 Predicted exposures for PFHxA arising from use of composts and digestates
Scenario I Units
PECagricultural soil 2.13E-03 [mg/kg dry wt.]
PECgrassland soil 6.61E-04 [mg/kg dry wt.]
PEC in groundwater 1.04E-04 [mg/l]
PECfreshwater 6.64E-07 [mg/l]
PECfreshwater-sediment 6.88E-05 [mg/kg dry wt.]
Humans via the environment: local
total daily intake 6.24E-05 [mg.kg-1.d-1]
Humans via the environment: daily
dose via drinking water 2.98E-06 [mg.kg-1.d-1]
Humans via the environment:
dominant exposure source and
fraction
Root crops 95.1%
Secondary poisoning – freshwater
fish-eating birds and mammals 4.16E-06 [mg/kg wet wt.]
Secondary poisoning – worm-eating
birds and mammals 7.11E-03 [mg.kg-1]
Scenario II Units
PECagricultural soil 0.0545 [mg/kg dry wt.]
Humans via the environment: local
total daily intake 1.54E-03 [mg.kg-1.d-1]
Humans via the environment:
dominant exposure source and
fraction
Root crops 99.9%
Secondary poisoning – worm-eating
birds and mammals 0.171 [mg.kg-1]

D220 © Wood Environment & Infrastructure Solutions UK Limited
February 2019
Doc Ref. 40039CL003i3
Table 3.160 presents the predicted steady state mass balance in the region and continent. Please note
that the steady state predicted by the model are the amounts and distribution at the regional and
continental scale arising from the C/D use application pathway only. Adding in the release of the same
substances via other pathways (air and waste water) could lead to a different steady state balance.
Table 3.160 Predicted background exposures for PFHxA at steady state arising from use of composts
and digestates
Steady state mass Units
Total steady-state mass (region +
continent) 1.25E+01 [t]
Steady-state mass in regional
freshwater (kg) 1.35 [kg]
Steady-state mass in regional seawater
(kg) 0.138 [kg]
Steady-state mass in regional air (kg) 0.182 [kg]
Steady-state mass in regional
agricultural soil (kg) 1.21E+03 [kg]
Steady-state mass in regional natural
soil (kg) 0.114 [kg]
Steady-state mass in regional industrial
soil (kg) 0.042 [kg]
Steady-state mass in regional
freshwater sediment (kg) 0.496 [kg]
Steady-state mass in regional seawater
sediment (kg) 0.0128 [kg]
Steady-state mass in continental
freshwater (kg) 15.4 [kg]
Steady-state mass in continental
seawater (kg) 396 [kg]
Steady-state mass in continental air
(kg) 10.9 [kg]
Steady-state mass in continental
agricultural soil (kg) 1.09E+04 [kg]
Steady-state mass in continental
natural soil (kg) 3.43 [kg]
Steady-state mass in continental
industrial soil (kg) 1.27 [kg]
Steady-state mass in continental
freshwater sediment (kg) 5.64 [kg]
Steady-state mass in continental
seawater sediment (kg) 1.84 [kg]
Steady state mass fraction Units
Total steady-state mass fraction
(region + continent) 31.7 [%]
Steady-state mass fraction in regional
freshwater (%) 3.43E-03 [%]

D221 © Wood Environment & Infrastructure Solutions UK Limited
February 2019
Doc Ref. 40039CL003i3
Steady-state mass fraction in regional
seawater (%) 3.49E-04 [%]
Steady-state mass fraction in regional
air (%) 4.60E-04 [%]
Steady-state mass fraction in regional
agricultural soil (%) 3.05 [%]
Steady-state mass fraction in regional
natural soil (%) 2.87E-04 [%]
Steady-state mass fraction in regional
industrial soil (%) 1.06E-04 [%]
Steady-state mass fraction in regional
freshwater sediment (%) 1.25E-03 [%]
Steady-state mass fraction in regional
seawater sediment (%) 3.24E-05 [%]
Steady-state mass in continental
freshwater (kg) 0.039 [%]
Steady-state mass in continental
seawater (kg) 1 [%]
Steady-state mass in continental air
(kg) 0.0275 [%]
Steady-state mass in continental
agricultural soil (kg) 27.5 [%]
Steady-state mass in continental
natural soil (kg) 8.67E-03 [%]
Steady-state mass in continental
industrial soil (kg) 3.21E-03 [%]
Steady-state mass in continental
freshwater sediment (kg) 0.0143 [%]
Steady-state mass in continental
seawater sediment (kg) 4.66E-03 [%]
Sensitivity to specific variables
In respect of local Scenario II, the sensitivity of the outcomes to possible losses from the system by
leaching and drainage of excess water has been explored using a fugacity method. For this substance
the proportion of substance in the system distributed to the interstitial water at equilibrium under
‘high water content’ conditions, and hence sensitive to leaching, is 2.7% of the substance present in
the system. Hence, the sensitivity of the exposure scenario to such variations in water management is
considered to be low.
Summary of findings
Table 3.161 below presents the summary of key findings from the risk assessment of PFHxA that has
been made in this project. The findings are discussed further below the table.
Table 3.161 Summary of key findings for exposure of PFHxA via use of compost and digestates
Key findings of the risk assessment of PFHxA in contaminated composts and digestates
Overall range of compost and digestate concentrations <2E-03 - ≤0.165 mg/kg dry wt..

D222 © Wood Environment & Infrastructure Solutions UK Limited
February 2019
Doc Ref. 40039CL003i3
Key findings of the risk assessment of PFHxA in contaminated composts and digestates
Major raw material sources PFOA/PFOS measured above ca 0.01 mg/kg in compost and
digestate from source separation, bio-waste & green waste
compost, green waste compost, sewage sludge compost,
"mechanical biological treatment compost", bio-waste &
green waste manure energy crops digestate, "mechanical
biological treatment digestate".
Safe limit concentration in compost and digestate Not applicable (risk characterisation ratio not definable).
Main concern(s) arising Source of exposure of a proposed SVHC; Humans exposed
via the environment (especially via diet and drinking water);
possible transfer over long distances.
Effects considered in the main concern hazard(s) Proposed SVHC under the REACH Regulation on the basis of
a large number of equivalent concern factors.
Uncertainties and their implications No data available for PFHxA specifically, and almost all stated
values are less-than limit values.
Sensitivity of exposures to variations in water management in
the local container growing scenario is low. In circumstances
where a) the system is watered in excess of the water holding
capacity of the growing medium and b) where the container
design means that excess water will drain away and not
remain in contact with the container/growing medium, then
a small proportion of the substance could be lost from the
system in the drained water.
Other remarks
The estimated regional-scale predicted environmental concentrations in surface water, ground water
and agricultural soil arising from the application of C/D are close to the range of the literature
concentrations presented in the Occurrence data set section based on ECHA (2018).
The highest contributions to human exposure via the environment arising from the application of C/D
is mainly associated with dietary consumption of root vegetables.
At steady state, 31.7% of the total mass remains within the region + continent69, suggesting that there
is some potential for transfer over long distances following release via the handling and application of
C/D. A significant proportion of the substance is modelled to be present in global tropic waters (29%)
at steady state. The total mass in the region + continent at steady state is 12.5 t in the baseline
scenario. This steady-state mass amounts to 11 times the mass released annually via application of
composts and digestates70.
69 This refers to the regional and continental spatial scales in the EUSES model. Refer to Section 1.7 and the Annex for further
information. 70 Please note this is not to be interpreted as how much time elapses to reach steady state; the steady state predicted by the
model are the amounts and distribution at the regional and continental scale arising from the compost and digestate use
application pathway only. Adding in the release of the same substances via other pathways (air and waste water) could lead to a
different steady state picture.

D223 © Wood Environment & Infrastructure Solutions UK Limited
February 2019
Doc Ref. 40039CL003i3
3.24 Microplastics
Background information and remarks
Microplastics are of concern and a specific restriction may be proposed in future. The European
Commission (2017) has made an assessment of environmental exposure and risks arising from
microplastics and the approach taken in the present assessment is intended to be fully consistent with
that work. In addition to issues of microplastic toxicity, the presence of physical impurities including
plastics and other particulates and small objects can cause issues in respect of clogging or damage of
spreading equipment; quality of produce is affected by assimilation of particles.
Fugacity modelling, food chain uptake and risk characterisation are not amenable to conventional
assessment. A key uncertainty is around accumulation and food chain exposure. The values derived by
EUSES may be misleading. The previous Commission study uses a qualitative assessment approach,
and a similar approach is used here.
Chemical properties and hazards data set
A limited exposure assessment has been made using EUSES based on generic characteristics and using
particle count in place of concentration. Generic chemical property characteristics are applied to define
the physicochemical and environmental fate descriptors used by the models. Table 3.162 summarises
the values used which are based on the previous assessment (EC, 2017). In line with the preceding
assessment, different polymer types do not require separate assessment; the particle size range is
acceptable to assess as a group. Furthermore, no attempt has been made to model exposure of
hazardous contaminants present within (or absorbed to) plastic microparticles.
Table 3.162 Property information for microplastics
Property Value Remarks
Molecular weight 10000 g/mol
These properties essentially assume that the microplastics will
behave as non-soluble, non-volatile and non-degradable
substances that will associate with the solid phase within the
waste water treatment plant.
Melting point 150°C
Boiling point >500°C
Vapour pressure 1E-10 Pa at 25°C
Water solubility 1E-10 mg/l at 25°C
log Kow 15
Henry’s law constant 1E-10 Pa.m3/mol at 25C
Koc >1E+8
BCF
BCF 0.036 l/fish and up to 1 g/l
fish in standard OECD 305 tests.
This would suggest a result of 36
l/kg wet wt. (although not
explicitly derived in commission
report); human exposure would

D224 © Wood Environment & Infrastructure Solutions UK Limited
February 2019
Doc Ref. 40039CL003i3
Property Value Remarks
be predominantly via
consumption of shellfish
Biodegradability Not biodegradable
In the EC (2017) assessment approach, a removal fraction of
0.025 d-1 for surface water and 2.74×10⁻⁴ d-1 for sediment
were assumed (based on the residence times of these
compartments)
Half-life in air Not defined
Occurrence data set
Table 3.163 presents a summary of the reported concentrations of microplastics in composts and
digestates. This is based on the survey of the available literature collected in Task 2 of the project and
reported in the main project report.
Table 3.163 Reported occurrence of microplastic particles (MPP) in composts and digestates
Concentrations in
composts/digestates
Value - units of particles/kg
dry wt. Remarks
Composts - data
availability
30 separate records of which 18 are based on particle count
rather than w/w and are for different specific polymer types
in compost from the same site and 10 others are ranges
rather than individual values. The values in terms of total
MPP/kg dry wt. are relatively consistent.
Compost - minimum
concentration 20
Compost - mid-range or
average concentration 38 An average of the values available
Compost - maximum
concentration 70
Digestates - data
availability
23 separate records of which 20 are based on particle count
rather than w/w and are for different specific polymer types
in compost from the same site and the other 3 are ranges
rather than individual values.
Digestate - minimum
concentration 14
Digestate - mid-range
or average
concentration
94 An average of the values available
Digestate - maximum
concentration 146
These concentrations in compost and in digestate equate to the following release amounts at the
regional and continental scale.
Table 3.164 Estimated regional and continental release amounts
Parameter Value
Mass of substance in EU-28 in compost (particles/year) 335,160

D225 © Wood Environment & Infrastructure Solutions UK Limited
February 2019
Doc Ref. 40039CL003i3
Mass of substance in EU-28 in digestate (particles/year) 3,316,320
Total regional emission to surface water (particles/day) 28
Total regional emission to soil (particles/day) 762
Total continental emission to surface water (particles/day) 252
Total continental emission to agricultural soil (particles/day) 8752
These values have been applied in estimating the exposure concentrations for microplastics arising
from use of composts and digestates. Exposures have been estimated for two concentration scenarios:
A more conservative assessment is derived using the maximum reported concentrations
in estimating the local releases from the two scenarios, with a mid-range concentration
used in estimating the regional background.
A less conservative assessment is derived separately using the mid-range reported
concentrations in estimating the local releases from the two scenarios, with a minimum
concentration used in estimating the regional background.
Table 3.165 below summarises background exposure data previously presented by the European
Commission (2017).
Table 3.165 Reported background concentrations of microplastics in the environment
PECregional Value Remarks
Air
Surface water 0.774-1.3 particles/l (modelled
regional PECs)
Only marine water results were found in the literature search,
which has not been repeated.
Sediment
0.6 to 50.1 microplastics per
gram of dry river sediment
(measured)
Particle size range 55 - 115 μm; Scheldt river (Belgium; citing
Van Cauwenberghe, 2015.).
Agricultural soil 15000-20000 particles/kg dry
wt. (modelled regional PECs)
Soil pore
water/ground water
Natural soil 9500-10300 particles/kg dry wt.
(modelled regional PECs)
At the time no soil values were found in the literature search,
which has not been repeated.
Urban/industrial soil
Other relevant data General remark: Numerous concentration data reported in
EC(2017) (pages 57-59) but almost all are marine.
Generic exposure scenario outcomes
The assessment has estimated local and background exposures of microplastic particles resulting from
the use scenarios defined in Section 1, using the chemical property data and concentration in

D226 © Wood Environment & Infrastructure Solutions UK Limited
February 2019
Doc Ref. 40039CL003i3
composts and digestates in the previous sections as inputs. The predicted environmental exposure
concentrations are as summarised in Table 3.166 below.
Table 3.166 Predicted exposures for microplastics arising from use of composts and digestates
Scenario I Units
PECagricultural soil 3.00E+00 [particles/kg dry wt.]
PECgrassland soil 1.54E+00 [particles/kg dry wt.]
PEC in groundwater 8.43E-11 [particles/l]
PECfreshwater 4.74E-10 [particles/l]
PECfreshwater-sediment 8.44E+01 [particles/kg dry wt.]
Scenario II Units
PECagricultural soil 2.37E+01 [particles/kg dry wt.]
Summary of findings
Table 3.167 below presents the summary of key findings from the risk assessment of microplastics that
has been made in this project. The findings are discussed further below the table.
In considering these findings readers should note that EUSES is not designed to model distribution of
particulates which severely restricts the use in this project. Findings are indicative only.
Table 3.167 Summary of key findings for exposure of microplastics via use of compost and digestates
Key findings of the risk assessment of microplastics in contaminated composts and digestates
Overall range of compost and digestate concentrations 14 – 146 particles/kg dry wt.
Major raw material sources All reported data relate to composts and digestates prepared from
household biowaste combined with green clippings and some energy
crops.
Safe limit concentration in compost and digestate Not applicable (risk characterisation ratio not definable).
Main concern(s) arising A potentially important source of microplastic exposure of the
environment via wastewater treatment plant sludge (with possible
consequent human exposure to microplastics via the environment)
Effects considered in the main concern hazard(s) No quantitative assessment of hazard was applied in this assessment.
Uncertainties and their implications Quantitative exposure of humans and predators via the food chain
cannot be reliably modelled using the present methods. Steady state
exposures are not reliable and not presented. Wastewater treatment
digestate could potentially contain higher concentrations of particles;
data were not found in this project.
Sensitivity of exposures to variations in water management in the local
container growing scenario can not be modelled.

D227 © Wood Environment & Infrastructure Solutions UK Limited
February 2019
Doc Ref. 40039CL003i3
Key findings of the risk assessment of microplastics in contaminated composts and digestates
Other remarks Other sources of microplastics release appear to be much higher than
exposure via composts and digestates, although use of digestate
obtained from sewage sludge could be an important source of
microplastics for the soil.
The exposures of soil and sediment arising from the application of C/D estimated in the present model
are very low compared with the PECs modelled in the recent risk assessment of exposures arising from
a range of industrial and consumer uses (EC, 2017). However the assessment does not cover the
possible release of microfibres released by washing of textiles. While exposure of man via the
environment arising from the use of compost and digestate is not important compared to other
sources, the occurrence data used in this assessment is largely based on household biowaste-derived
products rather than WWTP digestates. ECHA71 (2018) reports that sewage sludge could be an
important source of emissions of microplastics to the soil.
Exposure of humans via root and leaf crops in the diet is possible, however (similarly to the EC 2017
exposure assessment), the washing of vegetables and peeling of root vegetables would be expected to
limit levels of human consumption.
Cattle could ingest contaminated soil adhering to the grass, and therefore the exposure of cattle is
related to the concentration in soil, however (in line with EC, 2017) the assessment assumes that this
remains within gut contents and passes through the cattle without entering into meat or milk. This
indicates that human exposure via these foodstuffs is negligible.
The occurrence data found in this project suggest use of composts and digestates contributes an
overall total release of 3650 billion microplastic particles per year in the region plus continent, however
it is not feasible using EUSES to model the multimedia fate, distribution and flux of particles following
release.
71 ECHA press release, Intentionally added microplastics likely to accumulate in terrestrial and freshwater
environments, ECHA/PR/18/15, 22 November 2018.

D228 © Wood Environment & Infrastructure Solutions UK Limited
February 2019
Doc Ref. 40039CL003i3
Bibliography
3M (2005): Technical Review and Reassessment of the UK, Environmental Risk Evaluation Report for
Perfluorooctanesulphonate (PFOS). Exponent, Doc. no. PH02824.001 0201 0105 TG25, January 2005
Danish EPA (2015). Perfluoroalkylated substances: PFOA, PFOS and PFOSA Evaluation of health
hazards and proposal of a health based quality criterion for drinking water, soil and ground water
Environmental project No. 1665, 2015. Danish Ministry of the Environment, Environmental
Protection Agency. ISBN 978-87-93283-01-5
DüMV (2012). Verordnung über das Inverkehrbringen von Düngemitteln, Bodenhilfsstoffen,
Kultursubstraten und Pflanzenhilfsmitteln (Düngemettelverordnung – DüMV). Vom 5. December
2012. BGBI. I (2012) 58, S. 2482-2544.
DüMV (2015) Erste Verordnung zur Änderung der Düngemittelverordning. Vom 27. May 2015. BGBI.
I (2015) 21, S. 886-892.
El-Sayed G. Khater (2015) Some Physical and Chemical Properties of Compost. Int J Waste Resources
5:172. doi:10.4172/2252-5211.1000172.
European Communities 2002: European Union Risk Assessment Report, 4-Nonylphenol (branched)
and nonylphenol CAS Nos: 84852-15-3 and 25154-52-3 EINECS Nos: 284-325-5 and 246-672-0,
European Commission Joint Research Centre EUR 20387 EN
EC (2007). European Union Risk Assessment Report. Cadmium metal. Part I – Environment and Part II
– Human Health. 3rd Priority List, Volume 72. EUR 22919, European Commission, 2007.
European Communities (2008a). European Union Risk Assessment Report. Nickel and nickel
compounds. European Commission, 2008.
European Communities (2008b). European Union risk assessment report: Bis(2-ethylhexyl)phthalate
(DEHP). 2nd Priority List, Volume 80, European Commission, Joint Research Centre, EUR 23384 EN.
European Communities (2008c). European Union risk assessment report: Hexabromocyclododecane.
Final Approved Version, European Commission, Joint Research Centre, May 2008.
European Communities (2008d). European Union Risk Assessment Report, Coal-Tar Pitch, High
Temperature, R323_0805_ENV_FINAL_ECB.DOC, May 2008.
EC (2010a). European Union Risk Assessment Report. Zinc metal. EUR 24587 EN, European
Commission, 2010.
EC (2010b). European Union risk assessment report: 4,4’-ispropylidenediphenol (bisphenol-A).
European Commission, Joint Research Centre, February 2010.
European Communities (2010c). European Union Risk Assessment Report, CAS: 80-05-7 EINECS No:
201-245-8 Environment Addendum of April 2008 (to be read in conjunction with published EU RAR
of BPA, 2003) 4,4'-Isopropylidenediphenol (Bisphenol-A), European Commission Joint Research
Centre, Institute for Health and Consumer Protection, EUR 24588 EN – 2010, JRC 59980, ISBN 978-
92-79-17541-1, ISSN 1831-9424, DOI 10.2788/40195
EC (2012). Proposal for a Directive of the European Parliament and of the Council amending
Directives 2000/60/EC and 2008/105/EC as regards priority substances in the field of water policy.
COM(2011) 876 final, 31.1.2012.

D229 © Wood Environment & Infrastructure Solutions UK Limited
February 2019
Doc Ref. 40039CL003i3
EC (2014). Saveyn, H. and Eder, P. (JRC), End-of-waste criteria for biodegradable waste subjected to
biological treatment (compost & digestate): Technical proposals. Available at:
http://ipts.jrc.ec.europa.eu/publications/pub.cfm?id=6869.
EC (2017). Intentionally added microplastics in products, Doc Ref. 39168 Final Report 17271i3, Amec
Foster Wheeler Environment & Infrastructure UK Limited on behalf of European Commission (DG
Environment), 20 October 2017
ECHA (2012). Conclusion of substance evaluation for transitional dossiers. Summary conclusion of
evaluation of a substance according to transitional measures described in Article 135(2) 136(1) and
48 of the REACH Regulation. Nickel, nickel sulphate, nickel carbonate, nickel dichloride and nickel
dinitrate. European Chemicals Agency, December 2012.
ECHA (2013a). Member State Committee support document for identification of cadmium as a
substance of very high concern. Adopted on 12 June 2013. European Chemicals Agency.
ECHA (2013b). Member State Committee support document for identification of
pentadecafluorooctanoic acid (PFOA) as a substance of very high concern because of its CMR and
PBT properties. European Chemicals Agency, Adopted on 14 June 2013.
ECHA (2014a). Substance name: Bis(2-ethylhexyl) phthalate (DEHP) EC number: 204-211-0 CAS
number: 117-81-7, Member State Committee Support Document for identification of bis(2-
ethylhexyl) phthalate (DEHP) as a Substance Of Very High Concern because of its endocrine
disrupting properties which cause probable serious effects to the environment which give rise to an
equivalent level of concern to those of CMR and PBT/VPVB substances, adopted on 11 December
2014
ECHA (2014b). Committee for Risk Assessment (RAC), Committee for Socio-economic Analysis
(SEAC), Background document to the Opinion on the Annex XV dossier proposing restrictions on
Nonylphenol Ethoxylate, ECHA/RAC/ RES-O-0000005317-74-01/F, ECHA/SEAC/[Opinion No (same
as opinion number)], EC Number n/a CAS Number n/a, Revision n. 4, 14/05/2014
ECHA (2014c). Annex XV Restriction report Proposal for a Restriction. Substance name:
Perfluorooctanoic acid (PFOA), PFOA salts and PFOA-related substances. Version number 1, Date: 17
October 2014.
ECHA (2016). Guidance on information requirements and chemical safety assessment. Chapter R.16:
Environmental exposure assessment. European Chemicals Agency, Version 3.0, February 2016.
ECHA and Danish EPA (2016). Annex XV Restriction Report Proposal for a Restriction Substance
Names: Four Phthalates (DEHP, BBP, DBP, DIBP, version number 1, 1 April 2016.
ECHA (2017a). Annex XV Restriction Report. Proposal for a Restriction: Lead. European Chemicals
Agency, 7th April 2017.
ECHA (2017b). Committee for Risk Assessment (RAC) Committee for Socio-economic Analysis
(SEAC) Background document to the Opinion on the Annex XV dossier proposing restrictions on
FOUR PHTHALATES (DEHP, BBP, DBP, DIBP) (RAC opinion document). 16 March 2017.
ECHA (2017c). Member State Committee Support Document for Identification Of Benz[a]anthracene
as a Substance of Very High Concern because of its carcinogenic (Article 57A), PBT (article 57D) and
vPvB (article 57E) properties, European Chemicals Agency, Adopted on 30 November 2017
ECHA (2018). Annex XV report, proposal for identification of a Substance Of Very High Concern on
the basis of the criteria set out in REACH Article 57. Substance Name: Undecafluorohexanoic acid /
Ammonium Undecafluorohexanoate, Submitted by: Germany, Date: August 2018.

D230 © Wood Environment & Infrastructure Solutions UK Limited
February 2019
Doc Ref. 40039CL003i3
ECHA and Danish EPA (2016). Annex XV Restriction Report Proposal for a Restriction Substance
Names: Four Phthalates (DEHP, BBP, DBP, DIBP, version number 1, 1 April 2016.
ECI (2008). Voluntary European Union Risk Assessment Report. Copper and copper compounds.
European Copper Institute, 2008.
ECN (2015). Calculation of contaminant accumulation in soil due to long term compost application.
VHE/ahu Study. European Compost Network ECN e.V., Germany, March 2015.
European Chemicals Bureau (ECB) (2008). TC NES subgroup on identification of PBT and VPVB
substances results of the evaluation of the PBT/VPVB properties of: Substance name: Coal tar pitch,
high temperature, ECB – summary fact sheet PBT working group – PBT List No. 54, 29.03.2008.
European Food Safety Authority, EFSA (2008a). Mercury as undesirable substance in animal feed.
Scientific opinion of the Panel on Contaminants in the Food Chain. Question No EFSA-Q-2005-288.
European Food Safety Authority, EFSA Journal, 2008, 654, 1-76.
European Food Safety Authority, EFSA (2008b). Polycyclic Aromatic Hydrocarbons in Food (Question
N° EFSA-Q-2007-136), Scientific Opinion of the Panel on Contaminants in the Food Chain, The EFSA
Journal (2008) 724, 1-114, Adopted on 9 June 2008.
European Food Safety Authority, EFSA (2009). Scientific Opinion of the Panel on Contaminants in the
Food Chain in a request from the European Commission on cadmium food. European Food Safety
Authority, EFSA Journal, 2009, 980, 1-139.
European Food Safety Authority, EFSA (2012a). Cadmium dietary exposure in the European
Population. European Food Safety Authority, EFSA Journal, 2012, 10(1): 2551.
European Food Safety Authority, EFSA (2012b). Scientific Opinion on the risk for public health
related to the presence of mercury and methylmercury in food. EFSA Panel on Contaminants in the
Food Chain (CONTAM). European Food Safety Authority, EFSA Journal, 2012, 10 (12): 2985.
European Food Safety Authority, EFSA (2015). Scientific Opinion on the risks to public health related
to the presence of bisphenol A (BPA) in foodstuffs: Executive summary. EFSA Panel on Food Contact
Materials, Enzymes, Flavourings and Processing Aids (CEF). European Food Safety Authority, EFSA
Journal, 2015; 13 (1): 3978.
EU (2008). Directive 2008/105/EC of the European Parliament and of the Council of 16th December
2008 on environmental quality standards in the field of water policy, amending and subsequently
repealing Council Directives 82/176/EEC, 83/513/EEC, 84/156/EEC, 84/491/EEC, 86/280/EEC and
amending Directive 2000/60/EC of the European Parliament and of the Council. Official Journal of
the European Union, L 348/84, 24.12.2008.
EU, (2011). Scientific Committee on Health and Environmental Risks, SCHER, opinion on "chemicals
and the water framework directive: draft environmental quality standards" Ethinylestradiol (EE2),
ISSN 1831-4775 ISBN 978-92-79-30643-3, doi:10.2772/3 7258 ND-AR-09-018-EN-N, SCHER
adopted this opinion at its 12th plenary on 30 March 2011
EU (2013). Directive 2013/39/EU of the European Parliament and of the Council of 12 August 2013
amending Directives 2000/60/EC and 2008/105/EC as regards priority substances in the field of
water policy. Official Journal of the European Union, L 226/56, 24.08.2013.
EU (2018). Interinstitutional File: 2016/0084(COD) Proposal for a REGULATION OF THE EUROPEAN
PARLIAMENT AND OF THE COUNCIL laying down rules on the making available on the market of CE
marked fertilising products and amending Regulations (EC) No 1069/2009 and (EC) No 1107/2009.

D231 © Wood Environment & Infrastructure Solutions UK Limited
February 2019
Doc Ref. 40039CL003i3
[Viewed 21 January 2019] Available at: http://data.consilium.europa.eu/doc/document/ST-15103-
2018-INIT/en/pdf
EU Öko-V (2008). Verordnung (EG) Nr. 889/2008 der Kommission vom 5 September 2008 mit
Durchfürhrungsvorschriften zur Verordnung (EG) Nr. 834/2007 des Rates über die
ökologische/biologische Produktion und die Kennzeichnung von ökologischen/biologischen
Erzeugnissen hinsichtlich der ökologischen/biologischen Produktion, Kennzeichnung und Kontrolle.
ABI. 51 (2008) L250, S. 1-84.
FBK (2015). Fachvereinigung Bayerischler Komposthersteller E.V. (FBK): Güte- und
Prüfbestimmungen für Kompost. Fassung September 2015. Wolfratshausen, 2015, 11 S. und 5
Anlagen, 22 S.
Hazardous Substances Data Bank (HSDB) (2011). Data set for substance 17α-ethinylestradiol. HSDB
database of the National Library of Medicine's TOXNET system, (http://toxnet.nlm.nih.gov) Created
19990930 by GCF, HAZARDOUS SUBSTANCES DATABANK NUMBER: 3587, LAST REVISION DATE:
2012/02/14, Reviewed by SRP on 5/12/2011
IPCS (1997). Poisons Information Monograph (PIM) for 17α-ethinylestradiol. John Fergus Kerr MBBS,
Toxicology Treatment Program, University of Pittsburgh Medical Center, 1997: ETHINYLESTRADIOL,
International Programme on Chemical Safety, Poisons Information Monograph 221, Pharmaceutical.
Laurenson et al (2014). James P. Laurenson, Raanan A. Bloom, Stephen Page, Nakissa Sadrieh 2014:
Ethinyl Estradiol and Other Human Pharmaceutical Estrogens in the Aquatic Environment: A Review
of Recent Risk Assessment Data, The AAPS Journal, Vol. 16, No. 2, March 2014.
LDAI (2008). Voluntary European Union Risk Assessment Report. Lead and lead compounds. Lead
Development Association International, 2008.
Mackay (1991). Multimedia environmental models: The fugacity approach. Donald Mackay. Lewis
Publishers, Michigan, USA. 1991.
RAC (2015). Committee for Risk Assessment (RAC) Opinion on an Annex XV dossier proposing
restrictions on bisphenol A ECHA/RAC/RES-O-0000001412-86-56/F Adopted 5 June 2015.
RIVM (2011). Assessment of potential risks of 11 pharmaceuticals for the environment Using
environmental information from public databases, National Institute for Public Health and the
Environment, Ministry of Health, Welfare and Sport, RIVM Letter Report 601711003/2011 N.G.F.M.
van der Aa et al.
SCHER (2008). Scientific Opinion on the Voluntary Risk Assessment Report on copper and its
compounds. Human Health Part. Scientific Committee on Health and Environmental Risks (SCHER),
Opinion adopted on 15th July 2008.
SCHER (2009a). Scientific Opinion on the Voluntary Risk Assessment Report on lead and its
compounds. Environmental Part. Scientific Committee on Health and Environmental Risks (SCHER),
Opinion adopted on 13th January 2009.
SCHER (2009b). Scientific Opinion on the Voluntary Risk Assessment Report on lead and its
compounds. Human Health Part. Scientific Committee on Health and Environmental Risks (SCHER),
Opinion adopted on 12th February 2009.

D232 © Wood Environment & Infrastructure Solutions UK Limited
February 2019
Doc Ref. 40039CL003i3
SCHER (2009c). Scientific Opinion on the Voluntary Risk Assessment Report on copper and its
compounds. Environment Part. Scientific Committee on Health and Environmental Risks (SCHER),
Opinion adopted on 12th February 2009.
SRC (2012). Epi Suite output estimation data set for CAS 1746-01-6 (2,3,7,8-TCDD).
SRC (2012). Epi Suite output estimation data set for CAS 50-32-8 (Benzo[a]pyrene).
SRC (2012). Epi Suite output estimation data set for CAS 57117-31-4 (2,3,4,7,8-PCDF).
TCNES (2008a). Opinion of the TC NES on the Environmental Part of Industry Voluntary Risk
Assessments on lead and lead compounds. European Commission Joint Research Centre,
20/06/2008.
TCNES (2008b). Opinion of the TC NES on the Industry Voluntary Risk Assessments (Human Health)
on lead and lead compounds. European Commission Joint Research Centre, 15/05/2008.
TCNES (2008c). Opinion of the TC NES on the Environmental Part of Industry Voluntary Risk
Assessments on copper and copper compounds. European Commission Joint Research Centre,
16/06/2008.
TCNES (2008d). Opinion of the TC NES on the Human Health Part of Industry Voluntary Risk
Assessments on copper and copper compounds. European Commission Joint Research Centre,
08/02/2008.
UNEP (2010). Report on the Persistent Organic Pollutants Review Committee on the work of its sixth
meeting. Addendum. Risk profile on hexabromocyclododecane. United Nations Environment
Programme, UNEP/POPS/POPRC.6/13/Add.2, 3rd December 2010.
UNEP (2013). Global Mercury Assessment 2013. Sources, Emissions, Releases, and Environmental
Transport. United Nations Environment Programme, UNEP Chemicals Branch, Geneva, Switzerland,
2013.
UNEP (2015). Proposal to list pentadecafluorooctanoic acid (CAS No: 335-67-1, PFOA,
perfluorooctanoic acid), its salts and PFOA-related compounds in Annexes A, B and/or C to the
Stockholm Convention on Persistent Organic Pollutants. United Nations Environment Programme,
UNEP/POPS/POPRC.11/5, 9th June 2015.
UNEP (2016). Report of the Persistent Organic Pollutants Review Committee on the work of its
twelth meeting. Addendum. Risk Profile on pentadecafluorooctanoic acid (CAS No: 335-67-1, PFOA,
perfluorooctanoic acid), its salts and PFOA-related compounds. United Nations Environment
Programme, UNEP/POPS/POPRC.12/11/Add.2, 13th October 2016.
WHO (1976). Environmental Health Criteria 1. Mercury. International Programme on Chemical
Safety, World Health Organization, 1976.
WHO (1989a). Environmental Health Criteria 86. Mercury – Environmental Aspects. International
Programme on Chemical Safety, World Health Organization, 1989.
WHO (1989b). Environmental Health Criteria 88. Polychlorinated dibenso- para-dioxins and
dibenzofurans. International Programme on Chemical Safety, World Health Organization, 1989.
WHO (1990). Environmental Health Criteria 101. Methylmercury. International Programme on
Chemical Safety, World Health Organization, 1990.
WHO (1991). Environmental Health Criteria 118. Inorganic mercury. International Programme on
Chemical Safety, World Health Organization, 1991.
D233 © Wood Environment & Infrastructure Solutions UK Limited
February 2019
Doc Ref. 40039CL003i3
WHO (1993). Environmental Health Criteria 140. Polychlorinated biphenyls and terphenyls (second
edition). International Programme on Chemical Safety, World Health Organization, 1993.
WHO (1998). Environmental Health Criteria 202. Selected Non-Heterocyclic, Polycyclic Aromatic
Hydrocarbons, International Programme on Chemical Safety, World Health Organization, Geneva,
1998, ISBN 92 4 157202 7, (NLM Classification: QD 341.H9), ISSN 0250-863X
WHO (2002). Joint FAO/WHO Expert Committee on Food Additives (2001: Rome, Italy) Evaluation of
certain food additives and contaminants: fifty-seventh report of the Joint FAO/WHO Expert
Committee on Food Additives. (WHO technical report series; 909) ISBN 92 4 120909 7 (NLM
classification: WA 712) ISSN 0512-3054
WRAP (2011a). Guidance Document - Digestates: Realising the fertiliser benefits for crops and
grassland. Project code: OAV036-210, WRAP (Waste & Resources Action Programme), Date:
September 2011.
WRAP (2011b). Final Report - Biofertiliser management: best practice for agronomic benefit & odour
control. Project code: OAV036-210 WRAP Cymru, Date: September 2011
WRAP (2016). Digestate and compost use in agriculture – Good Practice Guidance. February 2016
WRAP (2017). Digestate quality and safety for agriculture – summary report. Research date:
September 2010 to April 2011; Date: January 2017

D234 © Wood Environment & Infrastructure Solutions UK Limited
February 2019
Doc Ref. 40039CL003i3
4. Annex: Supporting information on
approach to scenario modelling in EUSES
4.1 EUSES parameters relating to biosolid spreading
Predicted environmental concentrations in soil rely on numerous inputs. The key inputs used for the
modelling and risk assessment are outlined in the ECHA risk assessment framework defined in ECHA
guidance (2016).
The normal parameters or operation of the following have been applied as defined in ECHA (2016)
with no adaptation.
Characteristics of the receiving compartments (soils, receiving water) including organic
matter content.
Assumptions concerning soil rain water infiltration, soil erosion rates, or temperature.
Models which calculate leaching and accumulation in drinking water, bioaccumulation in
soil-dwelling organisms or their food chains, animal grazing and feedstuffs, human
foodstuffs and air.
The predicted environmental concentration (PEC) is calculated based on one (1)
application of the compost / digestate matrix annually and this is not easily accessible to
modify within EUSES, although other tools can be applied if modification is necessary
(e.g. the ECPA LET model72).
Characteristics of the applied product – organic carbon (OC) content. This parameter is
available for adaptation by the user; however testing demonstrates this does not
significantly affect the PECsoil.
Application rate (kg/ha) of the applied product.
Mixing depth of the target matrix is accessible to modify for grassland; although not for
agricultural soil. The mixing depth of agricultural soil is set by default to 20 cm in EUSES.
Table 4.1 presents a comparison of the main parameters for soil within EUSES, including data for C/Ds
where available.
Not all of these parameters are significant variables in the calculation of PECs. They are discussed here
because they offer useful context and validation of consistency with the default EUSES scenarios and
methods. Please refer to the further discussion in Sections 4.2 and 4.3.
72 Local Environmental Tool: http://www.ecpa.eu/pre-market-resources-for-industry/reach-registration-evaluation-authorisation-
and-restriction-chemicals. This model is broadly in line with the ECHA (2016) approach but allows more than one application per
year to be considered. The model does not, however, consider exposure of humans via the food chain.

D235 © Wood Environment & Infrastructure Solutions UK Limited
February 2019
Doc Ref. 40039CL003i3
Table 4.1 Main modelling parameters used in the EUSES model, and the available data for compost and digestate
Parameter EUSES baseline scenario (STP
sludge applied to agricultural
soil)
EUSES baseline scenario (STP
sludge applied to grassland
soil)
Whole digestate Liquid digestate (liquor) Compost
General context of use Fertiliser (commercial
agriculture)
Fertiliser (commercial grazing) Fertiliser (agriculture and
grazing)
Liquid fertiliser Fertiliser (agriculture and
grazing); horticulture and
hobby gardening; component
of growing media
Product composition
- Dry matter content The dry matter content of a
crude digestate may vary
between ca. 2% to more than
20% depending on the source
(DEFRA, 2010)
Five digestate types had a dry
matter content of 1.9 – 4.56%
in the separated liquor (WRAP,
2011b)
The dry matter content is
reported as 60% of fresh
weight (WRAP, 2016)
- Organic carbon
content
0.30 kg/kg (primary settled
sludge)
0.37 kg/kg (activated sludge
and effluent sludge)
0.30 kg/kg (primary settled
sludge)
0.37 kg/kg (activated sludge
and effluent sludge)
The organic matter content of
the dry matter in the fibre was
81.7% OM (WRAP, 2011b),
equivalent to approximately
0.48 kg/kg73
The organic matter content of
the dry matter of the liquor
was 69.6% OM (WRAP, 2011b),
equivalent to approximately
0.41 kg/kg.
38.2% OC as dry matter,
equivalent to 0.38 kg/kg
- Water content ca. 70 – 96% (DEFRA, 2010,
WRAP 2016)
ca. 25 – 98% (DEFRA, 2010) Ca. 40% (WRAP, 2016)
- Bulk Density 1500 kg/dry weight/m3
(suspended and settled sludge
in primary settler)
1300 kg dry weight/m3
(suspended and settled sludge
in solids/liquid separator)
1500 kg/dry weight/m3
(suspended and settled sludge
in primary settler)
1300 kg dry weight/m3
(suspended and settled sludge
in solids/liquid separator)
73 A conversion factor of approximately 59% organic carbon present in organic matter is taken from ECHA Guidance part R16 (2016).

D236 © Wood Environment & Infrastructure Solutions UK Limited
February 2019
Doc Ref. 40039CL003i3
Parameter EUSES baseline scenario (STP
sludge applied to agricultural
soil)
EUSES baseline scenario (STP
sludge applied to grassland
soil)
Whole digestate Liquid digestate (liquor) Compost
Application and mixing
- Rate (single
application)
- note: 1 hectare (ha) =
10,000 m2
0.5 kg/m2 dry weight 0.1 kg/m2 dry weight 5 kg/m2 wet weight
34 m3/ha for a food waste-
derived digestate;
57 m3/ha for a manure-derived
digestate74 (WRAP, 2011a)
30 m3/ha (DEFRA 2010)
- Quantity per year
- note: 1 hectare (ha) =
10,000 m2
5000 kg/ha/year dry weight 1000 kg/ha/year dry weight Variable dependent on crop-
available nitrogen content of
product (and other mineral
nutrients)
Variable dependent on crop-
available nitrogen content of
product (and other mineral
nutrients)
Variable dependent on crop-
available nitrogen content of
product (and other mineral
nutrients)
3000 (pasture); 15000 (arable)
kg/ha/year dry weight
(maximum indicated by
existing restrictions (Saveyn
and Eder (2014)
- Application method Spreading as either wet or
dried sludge
Spreading as either wet or
dried sludge
Whole slurry or separated dry
fibre; applied via a range of
spreader equipment; there can
be issues of odour nuisance
hence broadcast spreading is
not recommended (WRAP
2011b).
Injection, trailing hose or
trailing shoe (WRAP, 2016)
Limited evidence for irrigator
spray application (only
possible very-low-solid
separated liquor products)
(WRAP 2011a)
- Product homogeneity At the local scale, assumed to
be an even application at the
concentration calculated.
At the local scale, assumed to
be an even application at the
concentration calculated
- Mixing depth 0.2 m 0.1 m 0.1 m assumed in WRAP (2017)
assessment of risk from
74 it is noted that cattle manure slurries have considerably lower nitrogen (and particularly readily available nitrogen) than other forms of digestate, and so could require higher application rates to achieve the
equivalent delivery of this key fertilising element.

D237 © Wood Environment & Infrastructure Solutions UK Limited
February 2019
Doc Ref. 40039CL003i3
Parameter EUSES baseline scenario (STP
sludge applied to agricultural
soil)
EUSES baseline scenario (STP
sludge applied to grassland
soil)
Whole digestate Liquid digestate (liquor) Compost
microbiological infectious
agents
- Frequency 1/y 1/y

D238 © Wood Environment & Infrastructure Solutions UK Limited
February 2019
Doc Ref. 40039CL003i3
4.2 Establishing the sensitivity context: Application rates
In whatever form it is applied to the soil, the application rate in terms of the loading rate of the toxic
substance is a key variable in the exposure calculations. The application rate of the substance is
derived from the amount of compost or digestate containing the substance that is applied to soil and
the concentration of the substance within the compost or digestate.
The EUSES model calculates the concentration in both agricultural soil and grassland at the local level.
The calculations assume that there is one application of sludge per year for ten consecutive years, and
the concentration calculated is estimated as an average over 30 or 180 days (agricultural soil) or 180
days (grassland) following the last application. The calculation takes into account removal processes
(such as biodegradation and volatilisation) and also leaching into groundwater. The 30-day average in
agricultural soil is used for the assessment of exposure of soil-dwelling organisms and humans via the
environment for root crops and leaf crops, whereas the 180-day average in agricultural soil is used to
assess the indirect exposure of humans via the environment through consumption of meat and milk75.
The assessment of secondary poisoning of predators via earthworms in the food chain is assessed
based on the 180-day average concentration in agricultural soil76.
For substances that are lost from soil only slowly, the 30-day and 180-day average values are generally
very similar.
It is important to note that the EUSES model also includes atmospheric inputs of pollutants into soil.
For the current project such inputs have been ignored as the focus is on the concentration resulting
from application of digestate or sludge. Thus, the atmospheric releases of the substance have been set
to zero.
Figure 4.1 overleaf illustrates the results of an illustrative model for soil, for a hypothetical substance
with the following properties. A similar linear relationship would apply for any substance, when only
the concentration in sludge is being varied.
Molecular weight 250 g/mole
Vapour pressure 10 Pa at 25°C
Water solubility 100 mg/l at 25°C
Log Kow 4
Biodegradability Not biodegradable
These show that the concentrations predicted in soil are linear and proportional to the concentration
in sludge. A similar trend is also evident in the predicted groundwater concentration. As these
concentrations are used within EUSES as the starting point of calculation for other protection targets,
such as secondary poisoning and exposure of humans via the environment, it would be expected that
the predicted concentrations for these would also increase linearly as the concentration in sludge
increases.
75 The calculation is based on cattle grazing on the grassland. 76 The secondary poisoning calculation in EUSES assumes that 50% of the exposure comes from local sources and 50% of the
exposure comes from regional sources in order to take into account that predators feeding on earthworms may feed over a
relatively wide area.

D239 © Wood Environment & Infrastructure Solutions UK Limited
February 2019
Doc Ref. 40039CL003i3
Figure 4.1 Trends in the predicted concentration in soil and groundwater with increasing
concentration in sludge
Note: the two lines for agricultural soil predicted concentrations are almost directly overlaid.
4.3 Establishing the sensitivity context: chemical properties
Following on from the analysis carried out in Section 4.2, a more detailed investigation of different
input parameters (including assumed sludge concentration and sludge application rate) on the
concentrations predicted by EUSES has been undertaken using a set of hypothetical substances with
different chemical properties. This type of modelling is useful for identifying the sensitivity of the
methodology to the various assumptions made and how this may vary from substance to substance
within the ranges of chemical properties investigated.
Effect of properties of the assessed chemical
The following figures illustrate how variation in specific chemical properties can influence the exposure
of target organisms or populations of interest in this project. These simply reflect how the EUSES
algorithms work, and are presented for illustration only.

D240 © Wood Environment & Infrastructure Solutions UK Limited
February 2019
Doc Ref. 40039CL003i3
Figure 4.2 Effect of varying log Kow on human local total daily intake
Note: the markers representing the different combinations of physicochemical properties cannot be seen on this
graph due to being directly overlaid.
Figure 4.3 Effect of varying log Kow on fraction of human local total daily intake derived from
drinking water
Note: the markers representing the different combinations of physicochemical properties cannot be seen on this
graph due to being directly overlaid.

D241 © Wood Environment & Infrastructure Solutions UK Limited
February 2019
Doc Ref. 40039CL003i3
Figure 4.4 Effect of varying water solubility on concentration in drinking water
Figure 4.5 Effect of varying log Kow on fraction of human local total daily intake derived from
consumption of root crops
Note: the markers representing the different combinations of physicochemical properties cannot be seen on this
graph due to being directly overlaid.

D242 © Wood Environment & Infrastructure Solutions UK Limited
February 2019
Doc Ref. 40039CL003i3
Figure 4.6 Effect of varying water solubility on predicted concentration in agricultural soil
Figure 4.7 Effect of varying log Kow on predicted concentration in agricultural soil
Figure 4.8 Effect of varying vapour pressure on predicted concentration in agricultural soil

D243 © Wood Environment & Infrastructure Solutions UK Limited
February 2019
Doc Ref. 40039CL003i3
Effect of assumed sludge properties on the predicted concentration in soil
As part of the assessment, the effect of varying different characteristics of sludge (as a proxy for
compost or digestate) in the EUSES model is illustrated and discussed in this section.
The effect of organic carbon fraction in sewage sludge on the predicted concentration in agricultural
soil was investigated for four hypothetical chemicals with different physicochemical and degradability
properties. In each run the concentration of the substance in dry sludge was kept constant but the
organic content fraction of the sewage sludge was varied within the range 0.27 to 0.47 (based on the
EUSES default of 0.37 ± 0.1). The results of this analysis are summarised in Figure 4.9.
Figure 4.9 Effect of assumed organic carbon content of sludge on the predicted concentration in
agricultural soil (averaged over 30 days) for a series of hypothetical chemicals
The results show that the predicted concentration in agricultural soil is not dependent upon the
assumed organic carbon content of the sewage sludge over the range of chemical properties studied.
The reason for this is that, within the EUSES model (and the ECHA (2016) risk assessment approach)
the organic carbon content of the sewage sludge is only used to estimate the partitioning
behaviour/removal of a substance in the sewage treatment plant. This is not needed for the current
project as the assessment is based on the known concentration in the digestate or compost which is
directly applied to soil. This means that in the assessments made in this project, any differences in
organic carbon contents between different digestates does not require further investigation or
adjustments and can effectively be ignored.
It is possible that application to soil of different digestates with high organic carbon contents may
increase the organic carbon content of the soil. However, the approach outlined in ECHA (2016)
assumes a standard organic carbon content of 2% for agricultural soil (including those to which
sewage sludge is applied) and this standard organic carbon content in the risk assessment
methodology is used in this project.
The modelling results also show that the concentration in soil is dependent upon the chemical
properties. This is because, once applied to the soil, the substance partitions between the various
phases of the soil (water, solids and air) based on its physicochemical properties and undergoes
removal processes such as biodegradation; these are different for different substances.

D244 © Wood Environment & Infrastructure Solutions UK Limited
February 2019
Doc Ref. 40039CL003i3
The effect of the assumed sludge application rate on the predicted concentration in agricultural soil
was investigated for the same four hypothetical chemicals. In this case the concentration of the
substance in sludge was kept constant but the sludge application rate was varied within the range
2,500 to 7,500 kg/ha/year (based on the EUSES default of 5,000 kg/ha/year ± 50%). The results of the
modelling are illustrated in Figure 4.10. These simulations showed that, across the range of chemical
properties investigated, the concentration in agricultural soil increased linearly in proportion to the
increasing sludge application rate. This shows the potential importance of application rates of compost
and digestate products in the exposure assessment. It should be noted that the assessments presented
in Sections 3.2 to 3.24 used default application rates in the absence of specific evidence.
Figure 4.10 Effect of assumed sludge application rate on the predicted concentration in
agricultural soil (averaged over 30 days) for a series of hypothetical chemicals
The effect of different sludge concentrations on the predicted concentration in agricultural soil,
grassland, drinking water (derived from ground water) and the estimated total daily human intake was
explored. The purpose of this was to investigate how the human exposure may vary with different
chemical properties.
All of the most important concentrations derived in the risk assessment in this project (concentrations
in soil, drinking water/groundwater and total human intake) increase linearly with increasing
concentration in the sludge for a range of illustrative substance properties, when exposure is via
sludge application at the local scale only. The human intake figures for these simulations were
dominated by intake through drinking water and through root crops. The proportion of the total
intake coming from each of these two sources varied with the substance properties and was
predominantly through drinking water for the substances with the lower log Kow values considered
(log Kow -1 and 1) and, as the log Kow increased the proportion from drinking water decreased and
the proportion from root crops increased such that the human intake was predominantly through root
crops for the higher log Kow values considered (log Kow 5 and 8). The variation in sludge
concentration had no effect on the proportion of human intake arising from the different routes (root
crops and drinking water).
The proportion of local total daily intake from other dietary sources varied to a lesser extent. These
EUSES simulations do not consider the possibility of entry into surface water from run-off or overspray
(see Annex Section 4.4). These may subsequently lead to exposure of fish and this may also become

D245 © Wood Environment & Infrastructure Solutions UK Limited
February 2019
Doc Ref. 40039CL003i3
important for the total human intake for some substances that have a high potential for
bioaccumulation.
It is also important to note that these EUSES simulations only consider direct addition of the substance
to soil through sludge (as a proxy for digestate and compost) at the local scale, and do not take into
account a) the background concentration of the substance that might be present in the soil and b)
inputs of the substance into soil other than through sludge (see Annex Section 4.4). Background
concentrations could be important in terms of absolute concentrations i.e. to interpret available
monitoring data for specific substances, and also to understand the predicted concentrations arising
from this exposure method in the wider context of exposure of the European environment to the same
substances.
Overall, the results of this modelling indicate that the following are the most important parameters for
the estimation of the PECs for the risk assessment:
Substance properties (log Kow, vapour pressure, water solubility, biodegradability).
Concentration in compost/digestate.
Compost/digestate application rate.

D246 © Wood Environment & Infrastructure Solutions UK Limited
February 2019
Doc Ref. 40039CL003i3
4.4 Defining exposure scenarios for quantitative risk assessment
Based on the analysis carried out above, the following exposure scenarios are considered appropriate for
assessing the risks of substances present in digestates or compost.
Scenario I: Solid digestates (and compost where it is applied to agricultural land) applied as a soil
amendment (soil improver or fertiliser)
Default application rate: 5000 kg/ha to agricultural land
1,000 kg/ha to grassland
Default mixing depth of soil: 20 cm agricultural soil
10 cm grassland
These values can be modified as appropriate based on the specific information available. The application
rates and the mixing depth in grassland can be modified easily in EUSES. The mixing depth in agricultural soil
cannot be modified directly but a “workaround” for this would be to adjust the application rate so it matches
the required depth using the approach outlined below.
𝐴𝑑𝑗𝑢𝑠𝑡𝑒𝑑 𝑎𝑝𝑝𝑙𝑖𝑐𝑎𝑡𝑖𝑜𝑛 𝑟𝑎𝑡𝑒 =𝐴𝑐𝑡𝑢𝑎𝑙 𝑎𝑝𝑝𝑙𝑖𝑐𝑎𝑡𝑖𝑜𝑛 𝑟𝑎𝑡𝑒 × 20
𝐷𝑒𝑝𝑡ℎ
where Depth = required mixing depth of the soil (cm).
Adjusted application rate = equivalent application rate (kg/ha) for a 20 cm mixing depth to be used in
EUSES.
Actual application rate = actual application rate (kg/ha) applied to the soil of the required mixing
depth.
It should be noted that the EUSES model does not include processes such as run-off into surface water or
input into surface water as a result of soil erosion.
Liquid digestates and spray application
With liquor and slurry products the solids and organic matter content varies; above-ground spraying may or
may not be applicable depending on the product and the user. If digestate liquor is sprayed, there is a
possibility of overspray into water sources.
It is reasonable to expect that the products available will lie on a spectrum in terms of solids content and
composition, but that only the most liquid products will be candidates for spray application due to the
equipment requirements (excess solids and fibres could cause a malfunction). The dry matter tolerance for
irrigator application of such products is up to 3% (WRAP, 2011a).
For context, reference has been made to approaches applied by models other than EUSES: Parameters
associated with the fraction of overspray (spray drift) and the local environment of a field and nearby
watercourse have been defined in an existing stand-alone model designed for exposure assessment of co-
formulants used in crop protection products in the REACH context. The ECPA Guidance on REACH chemical
safety assessment for co-formulants used in crop protection products (ECPA, 2015) contains values for these
parameters, which are in turn based on the ‘Steps 1-2 in FOCUS’ model (FOCUS, 2003).

D247 © Wood Environment & Infrastructure Solutions UK Limited
February 2019
Doc Ref. 40039CL003i3
For overspray, ECPA (2015) gives spray-drift values in the range 0 (for direct incorporation) to 33.2% (for
aerial application). The liquid digestates are not likely to be applied in the same way as crop protection
products (fine spray) and so the potential for spray-drift for liquid digestates would be expected to be much
lower than the crop protection products. Therefore, it is proposed to use a standard maximum value of 2.8%
(F = 0.028) for liquid digestates, which is the same as the values given in ECPA (2015) for spray application to
bare soil/pre-emergent use, as a realistic worst case.
The ECPA model (2015) covers exposure of watercourses via run-off, erosion and drainage and has been
used to calculate the PEClocal for water and sediment. The FOCUS calculations assume a standardised water
body scenario with 30 cm water depth overlying sediment of 5 cm depth. The sediment is assumed to have a
density of 0.8 g/cm3 and an organic carbon content of 5%. The water body is assumed to have an area
equivalent to one tenth of the field from which it receives run-off or drainage water (a field:water ratio of 10).
The ECPA model (2015) allows for greater evaporation from soil than EUSES and therefore predicts much
lower PECs for substances with vapour pressure higher than 0.001 Pa.
It is also of interest to consider the area of land being treated per event (per day). In Europe, farm holding
sizes vary considerably with just over half (50.7%) of utilised agricultural land being farmed by the largest
farms (100 ha or more) in 2010 (Eurostat, 2014). In terms of the number of holdings, the largest size range is
0-2 ha (46.9%) and 69.3% of all holdings are less than 5 ha. ECPA (2015) assumes treatment of a 1 ha field
with a 0.1 ha (1000 m2) water body with a volume of 300,000 litres to model the local scenario. As the field
area and water volume are relative, the variable size of fields for treatment is not expected to be a significant
factor for local PEC in the present assessment.
4.5 Regional and continental distribution of cropland and grassland
The concept of the ‘main region’ in exposure assessment in line with the ECHA R.16 guidance refers to a
semi-industrialised area notionally comprising 10% of the size of the EU, “represented by a typical densely-
populated EU-area located in Western Europe (~ 20 million inhabitants, 200 · 200 km2).”
Eurostat data (201577) provides useful reference information on land usage in the EU member states as
shown in Table 4.2. While the highest agricultural land use is in France, France is considerably larger than one
single region by both population and surface area definitions, and there is no need to modify the standard
assumption of 10% distribution of substance in the main region, which is appropriately conservative.
77 available online at http://ec.europa.eu/eurostat/statistics-explained/index.php?title=File:Land_cover,_2015.png

D248 © Wood Environment & Infrastructure Solutions UK Limited
February 2019
Doc Ref. 40039CL003i3
Table 4.2 EU member state land usage data (cropland and grassland)
Member
State
Total area
(km2)
Cropland
(%)
Cropland
(km2)
Fraction
of EU
total
cropland
Grassland
(%)
Grassland
(km2)
Fraction
of EU
total
grassland
Cropland
+
Grassland
Fraction of EU
total
(cropland+grass-
land)
Nominal
number of
EU
regions
(total area
/ 40,000
km2)
Popul-
ation
(millions)
Equivalent
number of
EU
regions
based on
average
popul-
ation
(total
popul-
ation /
20M)
4.37E+06 22.20 9.70E+05 1.00 20.70 9.04E+05 1.00 1.87E+06 1.00 109.23 508.45 25.42
Belgium 3.07E+04 28.50 8.74E+03 0.01 31.00 9.51E+03 0.01 1.82E+04 0.01 0.77 11.26 0.56
Bulgaria 1.11E+05 29.20 3.24E+04 0.03 18.80 2.09E+04 0.02 5.33E+04 0.03 2.77 7.20 0.36
Czech
Republic
7.89E+04 32.00 2.52E+04 0.03 22.30 1.76E+04 0.02 4.28E+04 0.02 1.97 10.54 0.53
Denmark 4.32E+04 50.60 2.18E+04 0.02 17.50 7.55E+03 0.01 2.94E+04 0.02 1.08 5.66 0.28
Germany 3.58E+05 32.30 1.16E+05 0.12 21.90 7.85E+04 0.09 1.94E+05 0.10 8.96 81.20 4.06
Estonia 4.53E+04 13.50 6.12E+03 0.01 15.90 7.21E+03 0.01 1.33E+04 0.01 1.13 1.31 0.07
Ireland 7.06E+04 5.80 4.09E+03 0.00 56.30 3.97E+04 0.04 4.38E+04 0.02 1.77 4.63 0.23
Greece 1.32E+05 15.30 2.02E+04 0.02 19.40 2.56E+04 0.03 4.58E+04 0.02 3.30 10.86 0.54
Spain 4.99E+05 21.30 1.06E+05 0.11 19.00 9.47E+04 0.10 2.01E+05 0.11 12.46 46.45 2.32

D249 © Wood Environment & Infrastructure Solutions UK Limited
February 2019
Doc Ref. 40039CL003i3
Member
State
Total area
(km2)
Cropland
(%)
Cropland
(km2)
Fraction
of EU
total
cropland
Grassland
(%)
Grassland
(km2)
Fraction
of EU
total
grassland
Cropland
+
Grassland
Fraction of EU
total
(cropland+grass-
land)
Nominal
number of
EU
regions
(total area
/ 40,000
km2)
Popul-
ation
(millions)
Equivalent
number of
EU
regions
based on
average
popul-
ation
(total
popul-
ation /
20M)
France 5.49E+05 28.90 1.59E+05 0.16 26.70 1.47E+05 0.16 3.05E+05 0.16 13.73 66.42 3.32
Croatia 5.65E+04 16.70 9.44E+03 0.01 19.10 1.08E+04 0.01 2.02E+04 0.01 1.41 4.23 0.21
Italy 3.01E+05 25.10 7.56E+04 0.08 21.70 6.54E+04 0.07 1.41E+05 0.08 7.53 60.80 3.04
Cyprus 9.25E+03 19.40 1.79E+03 0.00 13.20 1.22E+03 0.00 3.02E+03 0.00 0.23 0.85 0.04
Latvia 6.55E+04 14.30 9.37E+03 0.01 22.50 1.47E+04 0.02 2.41E+04 0.01 1.64 1.99 0.10
Lithuania 6.54E+04 29.40 1.92E+04 0.02 24.90 1.63E+04 0.02 3.55E+04 0.02 1.64 2.92 0.15
Luxembourg 2.60E+03 23.30 6.05E+02 0.00 28.90 7.50E+02 0.00 1.35E+03 0.00 0.06 0.56 0.03
Hungary 9.30E+04 43.70 4.06E+04 0.04 19.90 1.85E+04 0.02 5.92E+04 0.03 2.33 9.86 0.49
Malta 3.15E+02 26.30 8.28E+01 0.00 23.40 7.37E+01 0.00 1.57E+02 0.00 0.01 0.43 0.02
Netherlands 3.78E+04 24.20 9.15E+03 0.01 36.30 1.37E+04 0.02 2.29E+04 0.01 0.95 16.90 0.85
Austria 8.39E+04 15.30 1.28E+04 0.01 24.70 2.07E+04 0.02 3.36E+04 0.02 2.10 8.58 0.43

D250 © Wood Environment & Infrastructure Solutions UK Limited
February 2019
Doc Ref. 40039CL003i3
Member
State
Total area
(km2)
Cropland
(%)
Cropland
(km2)
Fraction
of EU
total
cropland
Grassland
(%)
Grassland
(km2)
Fraction
of EU
total
grassland
Cropland
+
Grassland
Fraction of EU
total
(cropland+grass-
land)
Nominal
number of
EU
regions
(total area
/ 40,000
km2)
Popul-
ation
(millions)
Equivalent
number of
EU
regions
based on
average
popul-
ation
(total
popul-
ation /
20M)
Poland 3.14E+05 33.20 1.04E+05 0.11 22.60 7.09E+04 0.08 1.75E+05 0.09 7.85 38.01 1.90
Portugal 8.88E+04 11.70 1.04E+04 0.01 23.60 2.10E+04 0.02 3.14E+04 0.02 2.22 10.37 0.52
Romania 2.39E+05 32.20 7.70E+04 0.08 27.10 6.48E+04 0.07 1.42E+05 0.08 5.98 19.87 0.99
Slovenia 2.03E+04 9.50 1.93E+03 0.00 21.70 4.40E+03 0.00 6.33E+03 0.00 0.51 2.06 0.10
Slovakia 4.90E+04 26.60 1.30E+04 0.01 19.50 9.56E+03 0.01 2.26E+04 0.01 1.23 5.42 0.27
Finland 3.38E+05 5.90 1.99E+04 0.02 4.40 1.49E+04 0.02 3.48E+04 0.02 8.44 5.47 0.27
Sweden 4.50E+05 4.20 1.89E+04 0.02 5.40 2.43E+04 0.03 4.32E+04 0.02 11.25 9.75 0.49
United
Kingdom
2.48E+05 19.70 4.88E+04 0.05 36.20 8.97E+04 0.10 1.38E+05 0.07 6.19 64.88 3.24

February 2019
Doc Ref. 40039CL003i3