diffusion fundamentals -...
TRANSCRIPT
Jörg Kärger, Leipzig University
The Benefit of Microscopic Measuring Techniques for Unveiling Structure-Mobility Rela-tions in Molecular Diffusion under Confinement
Contents
1. Introduction
2. The Measuring Technique
2.1. Pulsed Field Gradient N
2.1.1 The Measuring Princip
2.1.2 The Mean Propagator
2.1.3 Range of Applicability
2.2 Microscopy
2.2.1 Interference Microscop
2.2.2 IR Microscopy
2.2.3 Effects of Synergism iTechniques
3. Systems under Study
4. Long-Range Diffusion in B
4.1 Range of Measurement
4.2 Influence of Pressure of
4.3 Influence of a Carrier Ga
4.4 Multicomponent Diffusi
4.5 Regime-Dependent Tortu
4.6 An Anomaly of Long-Ra
5. Diffusion under Mesoscop
5.1 Confinement by Polymer
5.1.1 Restricted Diffusion in
5.1.2 Diffusion in Porous Po
5.2 Internal confinement in P
5.2.1 Anomalous Diffusion o
5.2.2 Diffusion under the Iduced by Block-Copolymers
)
Diffusion FundamentalsJ. Kärger, P. Heitjans, F. Grinberg, G. Schützwww.diffusion-fundamentals.org
(received 20 July 2005, accepted 27 July 2005
1
3
s Applied 4
MR 4
le 4
7
and Limitations 10
12
y 13
16
n the Application of the Two Microscopic 16
17
eds of Zeolite Crystallites 18
18
Compaction 20
s 21
vities and Separation Factors 23
osity Factors 24
nge Diffusion in Particle Agglomerates 25
ic Confinement 28
Host Systems 28
Polymer Matrices 28
lymer Membranes 29
olymers 31
f the Polymer Segments in the Melt 31
nfluence of Polymer Hyperstructures In-
33

2
5.3 The NMR Tracer Desorption Technique 36
5.3.1 Measuring Principle 36
5.3.2 Probing Zeolite Surface Barriers 38
5.3.3 Zeolite Coking 42
5.4 Tracing Surface-to-Volume Ratios 45
5.4.1 The Boundary of Zeolite Crystals 45
5.4.2 The Fractal Geometry of Sand Grains 47
6. Diffusion under Microscopic Confinement 50
6.1. Intracrystalline Zeolitic Diffusion 50
6.1.1 The Different Patterns of Concentration Dependence 50
6.1.2 Tracing Diffusion Anisotropy by PFG NMR 51
6.1.3 Correlated Diffusion Anisotropy 54
6.1.4 Multicomponent Diffusion 57
6.1.5 The Discrepancy between the Results of Different Measuring Techniques
61
6.1.6 Intracrystalline Concentration Profiles 68
6.1.7 Intracrystalline Transport Barriers 70
6.2 Confinement by Channels and Channel Networks of Molecular Dimension
75
6.2.1 Single-File Diffusion 75
6.2.2 Reactivity Enhancement by Molecular Traffic Control 79
6.2.3 Molecules in Channels and Channel Networks Observed by Interference and IR Microscopy
82
6.3 Diffusion in Ordered Mesoporous Solids 89
Conclusion and Acknowledgement 91

3
Summary
Molecular propagation under confinement reveals a multitude of peculiarities in comparison with diffusion in the bulk phase of a fluid. The present review is based on the experimental evidence of microscopic measuring techniques on tracing such phenomena. A short introduc-tion into the fundamentals, main applications and limitations of pulsed field gradient NMR as the probably most versatile technique for in-situ diffusion measurements in complex systems shall be given. The information provided by this technique is complemented by investigations using interference and IR microscopy. Confinement is considered to occur by both host – guest interactions and the formation of internal boundaries. In several cases the experimental studies are shown to give rise to quite general theoretical considerations, just like – vice versa – there is a multitude of theoretical predictions waiting for their experimental confirmation.
1. Introduction Diffusion is among the most pronounced examples illustrating the intimate interrelation be-tween molecular mobility and structural peculiarities.
Depending on the system under study, particle diffusivities cover a huge range of values from ~10-20 m2s-1 for solids up to ~1 m2s-1 for dilute gases. However, the nature of a system does not only affect the rate of particle propagation, it is also the pattern of its time dependence, which may be a function of the system, i.e. of the type of confinement. In general, the mean square displacement of the migrating particles increases in proportion to the observation time. This is the case of normal diffusion, which is commonly described by Fick's laws. However, under the influence of internal structures, particle propagation may deviate from this pattern. Owing to the intimate relation between structure and mobility, in the last few years the study of "anomalous diffusion" has become a most attractive subject of both fundamental and ap-plied research. Since the time exponent of the mean square displacement is generally found to be smaller than 1, anomalous diffusion is often referred to as subdiffusion.
The present review summarizes a number of studies on this topic, mainly devoted to the in-vestigation of the influence of the different types of confinement on molecular diffusion, which have been mainly performed in the Department of Interface Physics of the Faculty of Physics and Earth-Sciences of the Leipzig University. They are based on the pulsed field gra-dient NMR technique (PFG NMR), complemented by the use of interference and IR micros-copy. Examples shall be given how experimental studies give rise to tasks for theoretical in-vestigations, while – on the other hand – there are numerous results of theoretical studies, which are going to initiate challenging projects of experimental research.
After an introduction to the measuring techniques applied and their fundamentals, fields of application and limitations in section 2, the subsequent section 3 provides a summary of the systems under study and the way in which they may give rise to molecular confinement. They include fluid/solid interaction in microporous zeolitic adsorbate-adsorbent systems and in meso- and macroporous amorphous materials as well as fluid/fluid interaction in internally structured macromolecular melts and solutions. In all these cases, deviations from ordinary diffusion occur, which give rise to accompanying analytical studies and molecular modelling. The effect of confinement is considered in three different regimes. Under the conditions of long-range diffusion (section 4) the observed diffusion paths are large in comparison with the correlation lengths of mesoscopic confinement by, e.g., the crystal surface in beds of zeolite crystallites. In section 5 it is the effect of this mesoscopic confinement which is in the focus of investigations and which is found to give rise to various features of anomalous diffusion. Fi-
4
nally, in section 6, the case of microscopic confinement is considered. In this case, like in section 4 in the case of long-range diffusion, the observed displacements are large in compari-son with the correlation length of the (now microscopic) features of confinement. Therefore, with the exception of the so-called phenomenon of single-file diffusion, again normal diffu-sion is observed. Now the features of confinement appear in the anisotropy, absolute value, activation energy and concentration dependence of the diffusivities. Starting with a compari-son with results of other techniques, the concluding section suggests a few direction of future research in the field
2. The Measuring Techniques Applied
2.1. Pulsed Field Gradient NMR
2.1.1 The Measuring Principle
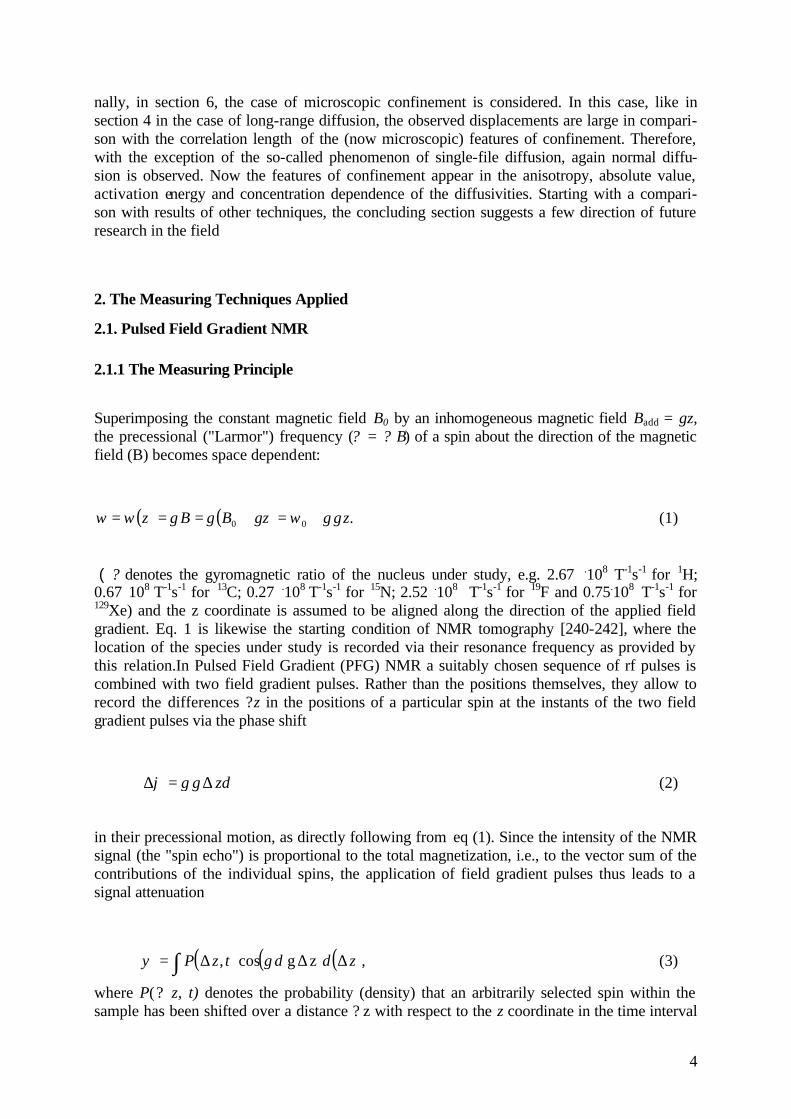
Superimposing the constant magnetic field B0 by an inhomogeneous magnetic field Badd = gz, the precessional ("Larmor") frequency (? = ? B) of a spin about the direction of the magnetic field (B) becomes space dependent:
( ) ( ) .00 zggzBBz γωγγωω +=+=== (1)
( ? denotes the gyromagnetic ratio of the nucleus under study, e.g. 2.67 .108 T-1s-1 for 1H; 0.67 108 T-1s-1 for 13C; 0.27 .108 T-1s-1 for 15N; 2.52 .108 T-1s-1 for 19F and 0.75.108 T-1s-1 for 129Xe) and the z coordinate is assumed to be aligned along the direction of the applied field gradient. Eq. 1 is likewise the starting condition of NMR tomography [240-242], where the location of the species under study is recorded via their resonance frequency as provided by this relation.In Pulsed Field Gradient (PFG) NMR a suitably chosen sequence of rf pulses is combined with two field gradient pulses. Rather than the positions themselves, they allow to record the differences ?z in the positions of a particular spin at the instants of the two field gradient pulses via the phase shift
∆ ∆ϕ γ δ= g z (2)
in their precessional motion, as directly following from eq (1). Since the intensity of the NMR signal (the "spin echo") is proportional to the total magnetization, i.e., to the vector sum of the contributions of the individual spins, the application of field gradient pulses thus leads to a signal attenuation
( ) ( ) ( )ψ γ δ= ∫ P z t d z∆ ∆ ∆, ,cos g z (3)
where P(? z, t) denotes the probability (density) that an arbitrarily selected spin within the sample has been shifted over a distance ? z with respect to the z coordinate in the time interval

5
t between the two field gradient pulses. P (? z, t) has been termed the (average) propagator [1] and represents the probability distribution of molecular displacements. The cosine term on the right hand side of Eq. (3) takes into account that the spins contribute to the total magnetiza-tion only by their projection on the direction of the total magnetization.
Fig. 1: Schematic representation of the measuring principle of PFG NMR
Fig. 1 summarizes the measuring principle in a schematic way. It turns out to be fully com-prehensible on the classical model of NMR, according to which a nuclear spin rotates about the direction of a magnetic field with a frequency (the “Larmor” frequency) proportional to the field intensity (Eq. 1 and top of the figure). During the two field gradient pulses (ramps in the figure), the Larmor frequencies are different for different spin positions, so that also the phases accumulated at the end of each individual field gradient pulse become space depend-ent. Besides giving rise to the NMR signal (the spin echo) at time 2τ the chosen rf-pulse se-
6
quence effects that the sense of the phases accumulated during the two field gradient pulses is reversed. Therefore, the gradient pulses mutually compensate their influence, provided that the spins occupy the same positions (identical z-coordinates in eqs.(1) to (3)) during the two field gradient pulses. This means that the signal intensity observed at time 2τ (S(g=0) in Fig. 1) remains the same as without field gradients. Any movement of the spins in the time inter-val between the two field gradient pulses, however, leads to an incomplete refocusation as expressed by Eq.(2). The vector sum of the magnetization of the individual spins is reduced by the remaining spreading of the phases effecting a decrease in the signal intensity to S(g≠0). The quantitative interrelation between the molecular propagation properties within the sample and the signal attenuation Ψ = S(g≠0)/ S(g=0) is provided by Eq.(3).
In many cases the propagator is exactly (viz. in an unfinitely extended, quasi homogeneous medium) or at least approximately given by a Gaussian
( ) ( )( ) ( ) ( )[ ]P z t z z z∆ ∆ ∆ ∆, / ,= −−
2 22
12 2 2
π exp (4)
with a half mean square width (mean square displacement) ⟨(∆z)2⟩ increasing linearly with the observation time. This is an immediate consequence of the central limit theorem of statistics. It applies as soon as the system under study may be considered as quasi-homogeneous, i.e. if the considered molecular displacements may be partitioned in a sequence of smaller dis-placements ("steps") with equal probability distributions. The self-diffusivity D of the process under study may be introduced by the Einstein relation
( )∆z Dt2
2= . (5)
The definition of D via Eq. (5) is equivalent to Fick's first law, where the self-diffusivity is introduced as a factor of proportionality between the concentration gradient of labelled mole-cules and their flux density. In isotropic systems one has
⟨(∆x)2⟩ = ⟨(∆y)2⟩ = ⟨(∆z)2⟩ = ⟨(∆r)2⟩/3 and Eq. (5) may be transferred into
( )∆r Dt2
6= (6)
By inserting Eq. (4) into Eq. (3), the PFG NMR signal attenuation may be simplified to
( )[ ]ψ γ δ= exp - 2 2 2 22g z∆ / (7)
7
or, with Eq. (5), to
( )ψ γ δ= exp - 2 2 2g Dt (8)
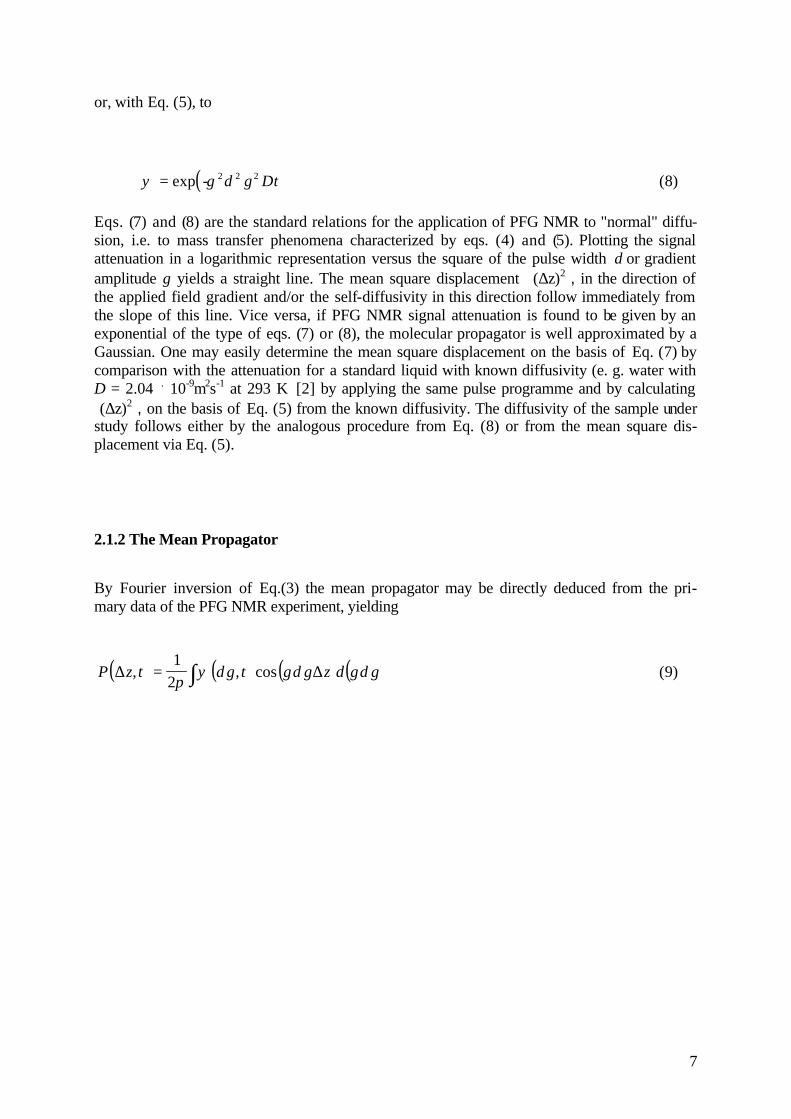
Eqs. (7) and (8) are the standard relations for the application of PFG NMR to "normal" diffu-sion, i.e. to mass transfer phenomena characterized by eqs. (4) and (5). Plotting the signal attenuation in a logarithmic representation versus the square of the pulse width d or gradient amplitude g yields a straight line. The mean square displacement ⟨(∆z)2⟩, in the direction of the applied field gradient and/or the self-diffusivity in this direction follow immediately from the slope of this line. Vice versa, if PFG NMR signal attenuation is found to be given by an exponential of the type of eqs. (7) or (8), the molecular propagator is well approximated by a Gaussian. One may easily determine the mean square displacement on the basis of Eq. (7) by comparison with the attenuation for a standard liquid with known diffusivity (e. g. water with D = 2.04 . 10-9m2s-1 at 293 K [2] by applying the same pulse programme and by calculating ⟨(∆z)2⟩, on the basis of Eq. (5) from the known diffusivity. The diffusivity of the sample under study follows either by the analogous procedure from Eq. (8) or from the mean square dis-placement via Eq. (5).
2.1.2 The Mean Propagator
By Fourier inversion of Eq.(3) the mean propagator may be directly deduced from the pri-mary data of the PFG NMR experiment, yielding
( ) ( ) ( ) ( )P z t g t g z d g∆ ∆, ,= ∫1
2πψ δ γ δ γ δ cos (9)

8
20 40 60 80
z /µm
P ( z,∆ )
∆ /ms 100 200 300 400
200
10 20 40 60 80
z
P ( z,∆ )
∆ /ms 100 200 300 400
200
10
z /µm 1 2 3 4
P ( z,∆ )
∆ /ms
5
45
0.5 1.0 1.5 2.0 z
P ( z,∆ )
∆ /ms
5
45
10 20 30 40 z
P ( z,∆ )
∆ /ms
4 10
21
20 40 60 80 z /µm
P ( z,∆ )
∆ /ms
20 40
60 80
100 120
140
153 K a b
233 K
293 K
Fig. 2: Propagator representation of the self-diffusion of ethane in zeolite NaCaA with mean crystallite radii of R = 8 µm (a) and 0.4 µm (b).
As an example, Fig. 2 displays the first application of this possibility showing the propagator representation of molecular self-diffusion of ethane in beds of zeolite NaCaA with two differ-ent crystallite sizes. Being symmetric in z, for simplicity the propagator is only represented for 0≥z . For the lowest temperature (153 K), the distribution widths of molecular displace-ment during the considered time intervals (5...45 ms) are found to be small in comparison with the mean radius of the larger crystallites (8 µm). In this case, PFG NMR is able to moni-tor genuine intracrystalline self-diffusion. In the smaller crystallites, the probability distribu-

9
tion of molecular displacement is found to remain unaffected by the observation time. More-over, the mean width is of the order of the crystallite radii. One has to conclude, therefore, that at the given temperature over the considered time intervals the ethane molecules are es-sentially confinded by the individual crystallites. Their thermal energy is not high enough to allow them to surpass the step in the potential energy from the intracrystalline space into the surrounding gas phase (intercrystalline space). Since in a crystallite of sufficiently large size the ethane molecules have been shown to be able to cover much larger diffusion paths (top left), molecular displacement in the small crystallites becomes a measure of the crystal size. This way of tracing the extension of microscopic regions has become popular under the name "dynamic imaging" [3, 4]. Eventually, with increasing temperature, a substantial fraction of the ethane molecules are able to leave the crystallites. This leads to distribution widths of mo-lecular propagation which are much larger than the crystallite radii. Under these conditions (T = 233K, bottom right), PFG NMR is able to monitor the rate of molecular propagation through the bed of crystallites ("long-range" diffusion). In the case of the larger crystallites (bottom left), at these temperatures one is able to distinguish between a narrow distribution (corresponding to those molecules which remain in the interior of the individual crystallites) and a broader constituent which corresponds to those molecules which have passed several crystallites. With increasing observation time, the contribution of the broader constituent in-creases at the expense of the narrower one, since more and more molecules will leave the in-dividual crystallites.
A plot of the relative intensity of the broad constituent versus the observation time (i.e. the separation between the two field gradient pulses) contains information which is analogous to that of a tracer exchange experiment between a particular crystallite containing e.g. labelled molecules and the unlabelled surroundings. Therefore, this way of analysis of PFG NMR data of zeolitic diffusion has been termed NMR tracer desorption technique [5] (cf., also, section 5.3). The first statistical moment („time constant“) of the NMR tracer desorption curve repre-sents the intracrystalline mean lifetime t intra of the molecules under study.
Fig. 3: Three types of information provided by applying PFG NMR to beds of nanoporous particles (zeolite crystallites)
Fig. 3 summarizes the three types of information which are thus shown to become accessible by diffusion studies with beds of nanoporous particles (such as, e.g., zeolite crystallites). They include the case of intracrystalline diffusion (i) as observed for molecular displacements neg-
10
ligibly small in comparison with the crystal diameters and shall be part of chapter 6, dealing with “diffusion under microscopic confinement”. In the case of long-range diffusion ((ii) and chapter 4) molecular displacements are considered to be much larger than any correlation length within the sample structure, i.e., in the given case, much larger than the crystallite di-ameters. Finally (iii), the interface between different phases (as, in the given case, between the adsorbed and gaseous/fluid phase) may be in the very focus of the measurements. In this case, in general, the most pronounced deviations form normal diffusion are observed. Such a situa-tion shall be discussed in chapter 5 as diffusion under mesoscopic confinement.
2.1.3 Range of Applicability and Limitations
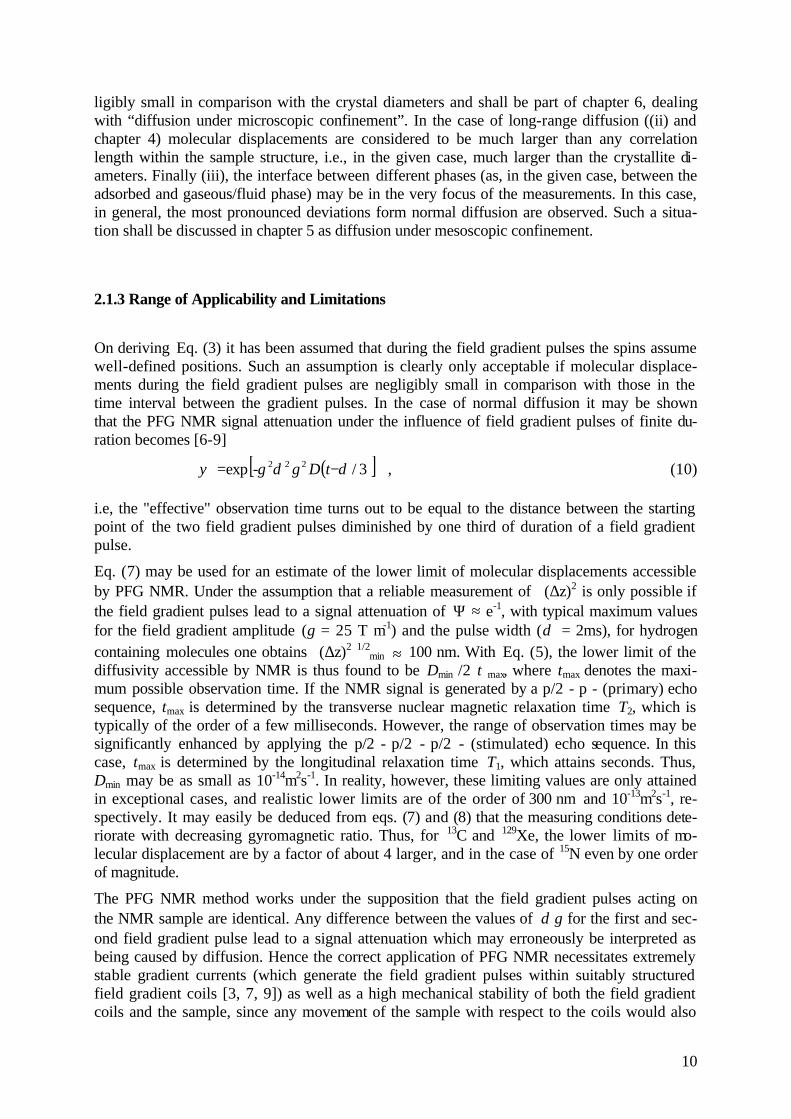
On deriving Eq. (3) it has been assumed that during the field gradient pulses the spins assume well-defined positions. Such an assumption is clearly only acceptable if molecular displace-ments during the field gradient pulses are negligibly small in comparison with those in the time interval between the gradient pulses. In the case of normal diffusion it may be shown that the PFG NMR signal attenuation under the influence of field gradient pulses of finite du-ration becomes [6-9]
( )[ ]3/-exp 222 δδγψ −= tDg , (10)
i.e, the "effective" observation time turns out to be equal to the distance between the starting point of the two field gradient pulses diminished by one third of duration of a field gradient pulse.
Eq. (7) may be used for an estimate of the lower limit of molecular displacements accessible by PFG NMR. Under the assumption that a reliable measurement of ⟨(∆z)2⟩is only possible if the field gradient pulses lead to a signal attenuation of Ψ ≈ e-1, with typical maximum values for the field gradient amplitude (g = 25 T m-1) and the pulse width (δ = 2ms), for hydrogen containing molecules one obtains ⟨(∆z)2⟩1/2
min ≈ 100 nm. With Eq. (5), the lower limit of the diffusivity accessible by NMR is thus found to be Dmin /2 t max, where tmax denotes the maxi-mum possible observation time. If the NMR signal is generated by a p/2 - p - (primary) echo sequence, tmax is determined by the transverse nuclear magnetic relaxation time T2, which is typically of the order of a few milliseconds. However, the range of observation times may be significantly enhanced by applying the p/2 - p/2 - p/2 - (stimulated) echo sequence. In this case, tmax is determined by the longitudinal relaxation time T1, which attains seconds. Thus, Dmin may be as small as 10-14m2s-1. In reality, however, these limiting values are only attained in exceptional cases, and realistic lower limits are of the order of 300 nm and 10-13m2s-1, re-spectively. It may easily be deduced from eqs. (7) and (8) that the measuring conditions dete-riorate with decreasing gyromagnetic ratio. Thus, for 13C and 129Xe, the lower limits of mo-lecular displacement are by a factor of about 4 larger, and in the case of 15N even by one order of magnitude.
The PFG NMR method works under the supposition that the field gradient pulses acting on the NMR sample are identical. Any difference between the values of δ g for the first and sec-ond field gradient pulse lead to a signal attenuation which may erroneously be interpreted as being caused by diffusion. Hence the correct application of PFG NMR necessitates extremely stable gradient currents (which generate the field gradient pulses within suitably structured field gradient coils [3, 7, 9]) as well as a high mechanical stability of both the field gradient coils and the sample, since any movement of the sample with respect to the coils would also
11
lead to differences in the local field at the instants of the first and second field gradient pulses. In order to ensure that the observed signal attenuation with increasing values of g or d is genu-inely due to diffusion (and not due to differences in the values of dg within a pair of field gra-dient pulses) it is therefore useful to apply the identical PFG NMR pulse programme to a sample with a sufficiently low diffusivity (e.g. cross-linked polybutadiene with a diffusivity smaller than 10-15 m2s-1 and a T2 in the ms range [10]). In this case the field gradient pulse programme must not lead to a signal attenuation. With powder samples like in the case of beds of zeolite crystallites one must be aware of another pitfall [11]. Even within completely fixed sample tubes the sample particles may move under the influence of the mechanical pulses generated by the forces acting on the field gradient coils during the current pulses. This influence is particularly stringent for short observation times (i.e. separations between the field gradient pulses) and may be reduced by avoiding any mechanical contact between the sample tube and the probe and/or by compacting the sample material below a contraction in the sample tube.
Intrinsic differences in the magnetic susceptibility of heterogeneous samples give rise to in-ternal field gradients, which are superimposed upon the externally applied ones. While under the influence of the modest external magnetic fields produced by iron magnets, for a number of important adsorbate-adsorbent systems such as zeolites these superpositions could be shown to be of no disturbing influence if only sufficiently large pulse gradient intensities are applied [12], in PFG NMR diffusion measurements with superconducting magnets such dis-turbing influences have to be considered. As a most effective possibility to circumvent such difficulties, the application of pairs of field gradient pulses with alternating signs (± g) sepa-rated by appropriate rf (viz. p) pulses has been suggested [13].
Fig. 4: NMR pulse sequences (rf and pulsed gradient schemes) suitable for diffusion studies: Primary (a) and stimulated (b) spin echo with unipolar pulsed field gradients; 13-interval se-quence (c) with bipolar pulsed field gradients
12
Fig. 4 provides a summary of the so far mentioned (and most frequently used) pulse se-quences in PFG NMR: in Fig. 4a the primary (or Hahn) spin echo series as the most simple version, in Fig. 4b the stimulated echo, where the π-pulse of the primary echo series may be thought to be split into two π/2-pulses (with the advantage that signal attenuation due to the time interval between these two pulses follows T1- rather than the generally much faster T2- relaxation, and with the disadvantage that the stimulated echo is formed by only one half of the total magnetization) and in Fig. 4c the so-called 13-interval sequence with bipolar pulsed field gradients, by which the disturbing influence of internal magnetic field gradients due to susceptibility differences within the sample may be eliminated. The spin echo attenuation in cases a and b are given by Eq. (10) with t = ∆ denoting the time interval between the two gra-dient pulses. In the case of the 13-interval sequence the spin echo attenuation results to be
{ })6/12/()2(exp 222 −−−= τ∆δγΨ Dg (11)
Methodical development in PFG NMR is focussed on the generation of extremely large field gradient pulses [14-16]. The difficulties arrising from the requirement of perfect matching between the two field gradient pulses may be circumvented by applying the stimulated spin echo method under the influence of a strong constant field gradient [17, 18], which is pro-vided by the stray field of the superconducting magnet ("stray field gradient" NMR). It may be shown that the intensity of the stimulated echo is only influenced by the field gradient ap-plied between the two first p/2 pulses and between the third p/2 pulse and the echo. Therefore, signal attenuation due to diffusion is also determined by eqs. (4), (7) or (8) with an effective pulse width which is identical to the spacing between the first two p/2 pulses (which is also the spacing between the third p/2 pulse and the maximum of the stimulated echo). By this technique, presently the largest field gradient "amplitudes" (up to 150 T/m) may be achieved [19]. In comparison with PFG NMR, hower, the signal-to-noise ratio in this technique is dra-matically reduced, so that much larger acquisition times are inevitable. Moreover, the con-stant magnetic field gradient excludes the application of Fourier Transform PFG NMR for diffusion studies of multicomponent systems (cf., e.g., section 6.1.4, in particular fig. 45). The measurements are additionally complicated by the fact that by varying the "width" of the field gradient "pulses" (i.e. by changing the spacing between the first two rf pulses) the signal is affected by both diffusion and transverse nuclear magnetic relaxation.
2.2 Microscopy
Owing to its ability to measure molecular displacements on typically the order of microme-ters, PFG NMR is referred to as a microscopic technique of diffusion measurement. Measur-ing the distribution function of molecular displacements in direction of the field gradient ap-plied, it is a technique which is generally applied under equilibrium conditions, i.e., for the observation of self-diffusion phenomena. In fact, together with Quasi-Elastic Neutron Scatter-ing (QENS) [20-23], PFG NMR is the only microscopic technique for diffusion studies in zeolite crystallites under equilibrium conditions. Since molecular random motion is likewise the elementary process of diffusion under non-equilibrium conditions, i.e., in particular, dur-ing the transport diffusion under the influence of a concentration gradient as considered in Fick’s first law, the information provided by PFG NMR is clearly of great value also for the characterization of non-equilibrium phenomena. If a mutual interaction of the diffusants may

13
be neglected and if there are no other possibly limiting processes like thermal heat release or additional transport resistances on the diffusion path to/from the individual zeolite crystal (such as surface barriers, “bed” and “valve” effects), transport and self-diffusion have even to coincide. This is a simple consequence of the fact that Fick’s first law and Einstein’s relation, if considered under quasi-homogeneous conditions for space and time (i.e., in the “diffusion limit”) are completely equivalent. This may be easily shown by calculating the propagator from Fick’s second law (i.e. from 22 / zcDc ∂∂=& with the initial condition )()0,( zzc δ= , where, for simplicity, only the one-dimensional case – in the direction of the filed gradient – has been considered, and we have made additionally use of the fact that the diffusivity is as-sumed to depend neither on concentration nor, hence, on the z coordinate.) As a result, one just obtains the propagator as given by Eq. 4 and hence also the Einstein relation, Eq. 5.
In practical applications, however, one is generally interested in non-equilibrium conditions – since it is the change of a substance (raw materials converted to valuable products) which counts. So far, in the field of zeolitic diffusion, no techniques existed which allowed to mi-croscopically observe diffusion phenomena under non-equilibrium conditions, i.e. under the conditions of varying intracrystaliine concentration profiles. In the last few years, two micro-scopic techniques, viz. interference microscopy and IR microscopy, have been successfully introduced into zeolite science and technology. In this section an introduction to their applica-tion and the limitations of their use shall be given.
2.2.1 Interference Microscopy
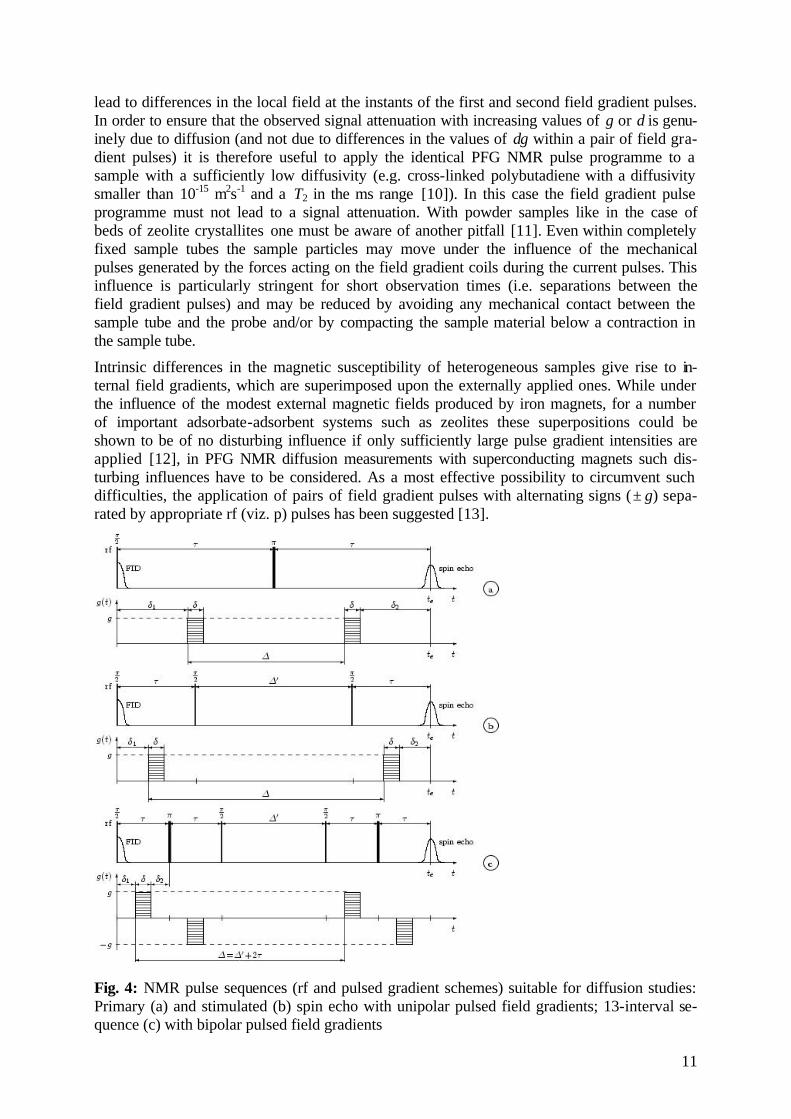
While in metals and alloys concentration profiles are generally monitored by invasive meth-ods, such as mechanical or sputter sectioning after interrupting the diffusion process by a sud-den drop of temperature [24, 25], diffusion processes in zeolitic host-guest systems are too fast to allow such a procedure. Owing to their optical transparence, however, zeolite crystal-lites offer the alternative possibility to determine internal concentration profiles by optical means, thus allowing the adoption of a measuring principle, well established in fluid research [26], to solid state physics. In these measurements one makes use of the fact that the refractive index of a medium is a function of its composition, i.e, in the present case, of the concentra-tion of guest molecules within the crystal. As schematically shown in fig. 5, the difference in the optical densities, n1 and n2, between the crystallite and the surrounding gives rise to a please difference ∆δ in the respective beams. Changes in intracrystalline concentration will affect n1 and hence the phase difference ∆δ. It is this effect which is used in our diffusion studies by interference microscopy.
14
Fig. 5: Measuring principle of Interfernce Microscopy applied to studying zeolitic diffusion
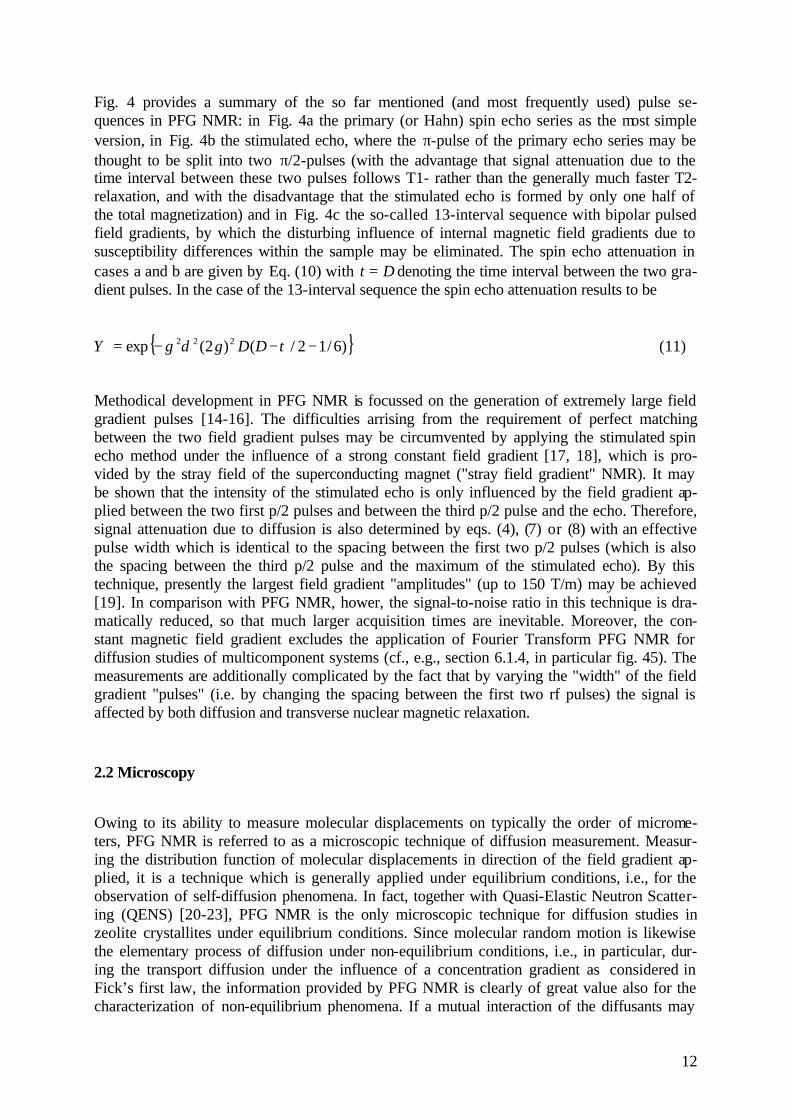
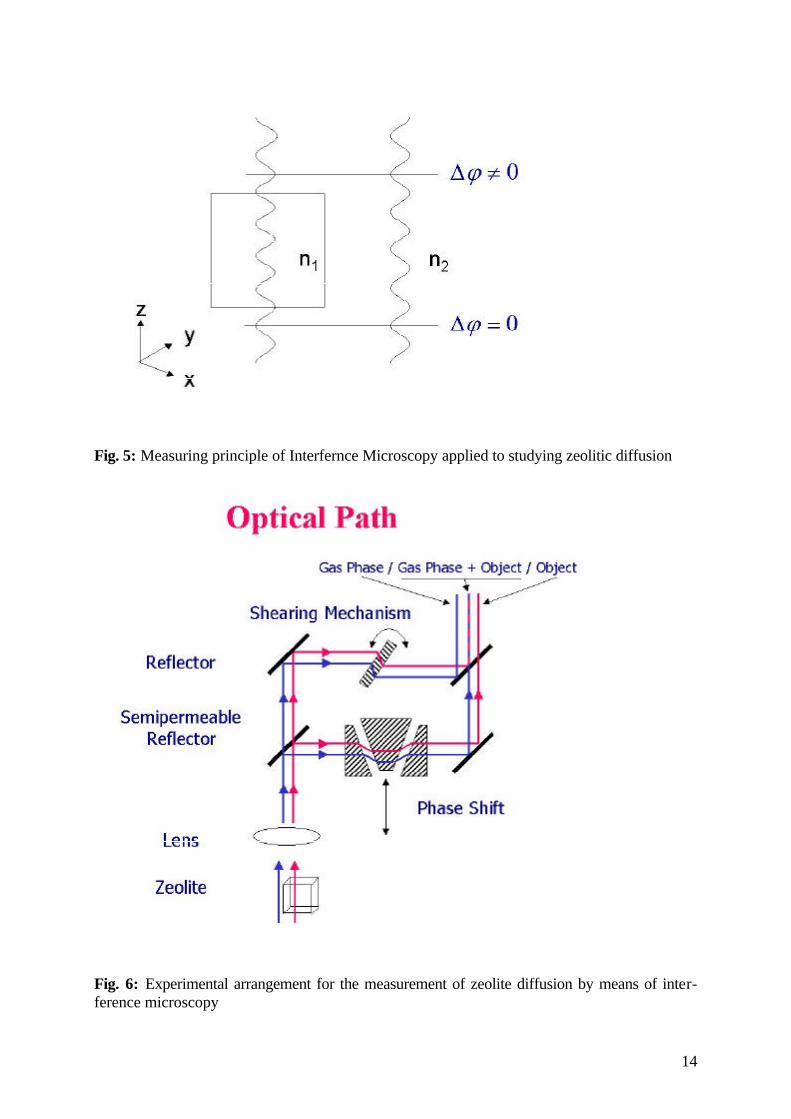
Fig. 6: Experimental arrangement for the measurement of zeolite diffusion by means of inter-ference microscopy

15
Fig. 6 displays the experimental arrangement used in these studies [27]. The interference mi-croscope (Jenamap, Carl Zeiss GmbH) uses a Mach-Zehnder interferometer splitting the im-age into two identical images. Finally one investigates the interference of the crystallite with its surroundings in the superposition of these two images. Such a procedure is giving fringes of interference in a way that each beam of light going through the crystallite is interfering with one going through the gas phase outside the crystallite only. Since the refractive index of the gas does not change to a measurable degree, only the time dependence of the optical path length of light going through the crystallite is observed. The phase shifter in one part of the interferometer is computer-controlled and necessary to calculate the change of the optical path length from the half-tone images sent from the CCD camera to the computer. For each phase determination it is necessary to take pictures at five different, precisely known positions of the phase shifter [28].
The primary data, i.e. the changes in the optical path length as appearing from the brightness of the image, are transferred to the desired concentration profiles in the following way. At first, in static measurements, the refractive index of the crystal under study is determined as a function of the gas pressure of the surrounding atmosphere. Then, in conventional measure-ment of the adsorption isotherm, the gas-phase pressure is attributed to the corresponding concentration of guest molecules. Using this correspondence, the time dependence of the op-tical path length may be directly translated into changes in intracrystalline concentration. The measured quantity is the optical path length
( ) ( ) .,,,0
dzzyxnyxL
∫ ∆=ψ (13)
∆n stands for the change of the refractive index at position (x, y, z) within the crystallite and L denotes the thickness of the crystal in observation which is assumed to coincide with the z-coordinate.
Thus it turns out that it is the integral ∫L
dzzyxc0
),,( in observation direction (coinciding with the
z coordinate, with L denoting the crystal extension in this direction) rather than the concentra-tion ),,( zyxc itself, which is accessible to immediate observation. If the observed concentra-tion patterns are independent of the z coordinate (like in diffusion studies with channel pores with the observation direction perpendicular to the channel axes) the complete information about the diffusion process is already contained in this integral. In cubic symmetry and under the additional supposition that the diffusivity is independent of concentration and that the ob-served (uptake, exchange or release) process is exclusively controlled by intracrystalline dif-fusion, this information may be deduced from an appropriate analysis of the dependence of the concentration integrals on the x and y coordinates. The concentration integrals can be re-corded with a spatial resolution of about 0.5 × 0.5µm2, as determined by the wave length of light applied in such studies.
16
2.2.2 IR Microscopy
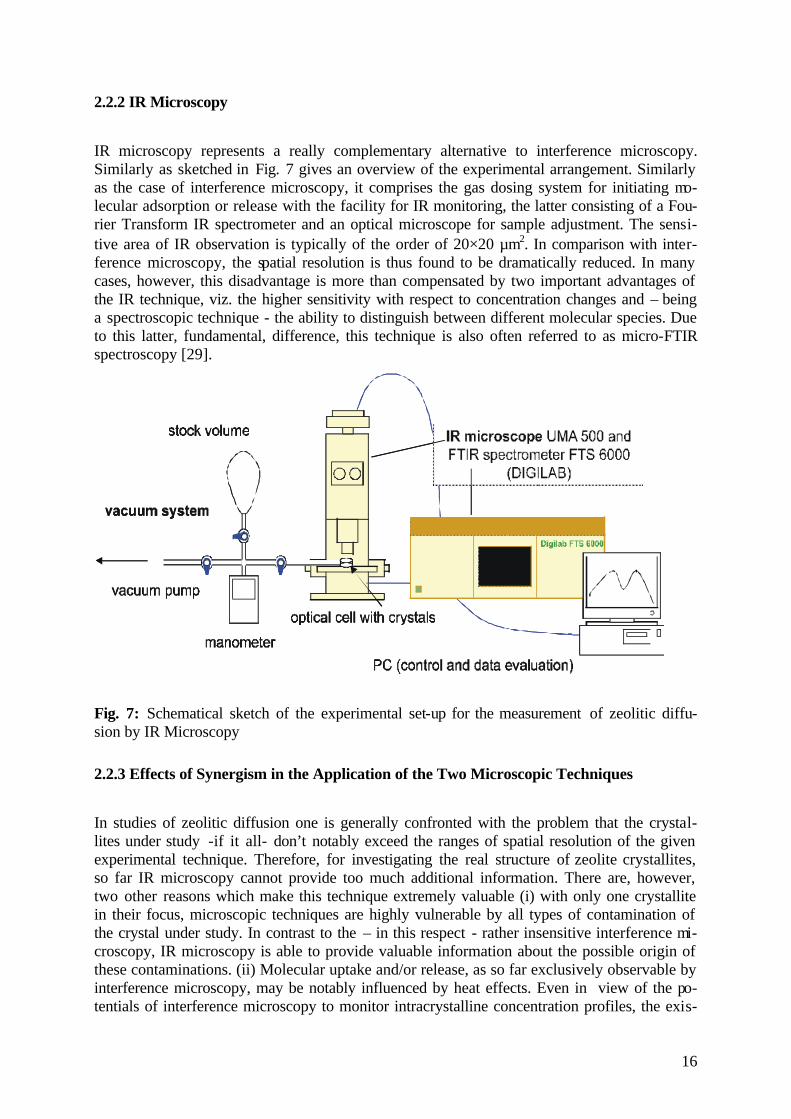
IR microscopy represents a really complementary alternative to interference microscopy. Similarly as sketched in Fig. 7 gives an overview of the experimental arrangement. Similarly as the case of interference microscopy, it comprises the gas dosing system for initiating mo-lecular adsorption or release with the facility for IR monitoring, the latter consisting of a Fou-rier Transform IR spectrometer and an optical microscope for sample adjustment. The sensi-tive area of IR observation is typically of the order of 20×20 µm2. In comparison with inter-ference microscopy, the spatial resolution is thus found to be dramatically reduced. In many cases, however, this disadvantage is more than compensated by two important advantages of the IR technique, viz. the higher sensitivity with respect to concentration changes and – being a spectroscopic technique - the ability to distinguish between different molecular species. Due to this latter, fundamental, difference, this technique is also often referred to as micro-FTIR spectroscopy [29].
Fig. 7: Schematical sketch of the experimental set-up for the measurement of zeolitic diffu-sion by IR Microscopy
2.2.3 Effects of Synergism in the Application of the Two Microscopic Techniques
In studies of zeolitic diffusion one is generally confronted with the problem that the crystal-lites under study -if it all- don’t notably exceed the ranges of spatial resolution of the given experimental technique. Therefore, for investigating the real structure of zeolite crystallites, so far IR microscopy cannot provide too much additional information. There are, however, two other reasons which make this technique extremely valuable (i) with only one crystallite in their focus, microscopic techniques are highly vulnerable by all types of contamination of the crystal under study. In contrast to the – in this respect - rather insensitive interference mi-croscopy, IR microscopy is able to provide valuable information about the possible origin of these contaminations. (ii) Molecular uptake and/or release, as so far exclusively observable by interference microscopy, may be notably influenced by heat effects. Even in view of the po-tentials of interference microscopy to monitor intracrystalline concentration profiles, the exis-

17
tence of heat effects cannot be easily confirmed or excluded, since - within the given limits of accuracy – additional transport resistances by valve effects (i.e. the finite rate of access of the adsorbate to the sorption volume) or surface barriers lead to similar concentration patterns. The possibility of heat effects may be easily confirmed or excluded, however, by comparison with tracer exchange experiments, where heat effects cannot occur. Owing to the possibility of IR spectroscopy to distinguish, e.g., between deuterated and undeuterated adsorbeate mole-cules, such tracer exchenage experiments may be easily carried out by means of IR micros-copy.
3. Systems under Study
Owing to their versatility and the relevance of the intrinsic diffusion properties, PFG NMR diffusion studies have been performed with essentially all types of molecular systems. Sum-maries of such studies may be found, e.g., in [3, 7, 9, 30, 31]. The systems of this contribution have been selected owing to their most favourable conditions with respect to the observation of diffusion phenomena under confinement, viz. nanoporous anorganic materials, in particular zeolites which are known to provide tailor-made pore architecture, and macromolecular sys-tems, where structural features over mesoscopic (with respect to the space scale of PFG NMR) ranges allow the performance of instructive diffusion studies. Moreover, together with a few more classes of substances like biological [32-35] [36-39], fuel-cell [39, 40, 246]), and construction materials ([41-43]), they are in the centre of research in our department.
Owing to both their favourable measuring conditions for PFG NMR and their technical rele-vance, zeolites of type LTA (in particular zeolite NaCaA), MFI (silicalite-1 and ZSM-5) and FAU (NaX) are in the focus of our PFG NMR diffusion studies with zeolitic adsorbate-adsorbent systems. Correspondingly, it are these systems which mainly dealt with in this re-view. They are generally investigated as crystal powders. With respect to their technical ap-plication, however, they are also studied in pelletized/compacted form (see, e.g., sects. 4.1 and 5.3). Interference and IR microscopy has been extensively applied to diffusion studies with the same systems, and in addition, with AFI-type zeolites (AlPO4-5; sect. 6.2.3), owing to their one-dimensional channel structure.
Similarly as with zeolitic adsorbate-adsorbent systems, also the polymer systems under study have been selected depending on the potentials of PFG NMR to observed the peculiarities of molecular transport generated by their tendency to self-organization. Owing to the multitude of different morphologies attainable, for these studies block-co-polymers turned out to be par-ticularly suitable. With transverse nuclear magnetic relaxation times in the range of several milliseconds (even for diffusivities down to 10-15 m2/s) and longitudinal relaxation times up to seconds (see 2.1.3), PDMS (polydimethylsiloxane) is among the favourite constituents of these polymers. As a particular group of self-organizing macromolecular systems we have investigated block-co-polymers representing linear chains with polypropylene oxide in the centre, and with polyethylene tails on either side. In aqueous solutions, as a consequence of the hydrophobicity of the medium part and the hydrophilicity of the tails, there is a tendency of micelle formation. As an example of PFG NMR diffusion studies with ordered mesoporous materials, sects. 4.5 (long-range diffusion in compacted particles) and 6.3 (diffusion anisotropy) present diffusion studies with MCM-41. For illustrating the potentials of PFG NMR as a means for recording surface-to-volume ratios, diffusion studies of molecules either in the intracrystalline space of
18
zeolite NaX (sect. 5.4.1) or in the free volume between sand grains (from a glacial deposit close to Leipzig, sect. 5.4.2) are also presented.
4. Long-Range Diffusion in Beds of Zeolite Crystallites
4.1 Range of Measurement
Once the molecular root mean square displacements observed by PFG NMR are much larger than the mean crystallite diameters, a direct measurement of the rate of mass transfer through the assemblage of zeolite crystallites becomes possible. This rate is represented by the coeffi-cient of long-range diffusion
( )
ttr
D6
inter2
range-long
><= (13)
if the observation time t is sufficiently long so that ⟨r2(t)⟩ inter1/2 is in fact much larger than the
mean radius of the crystallites. As an illustration, Fig. 8 provides results from a PFG NMR study of the long-range self-diffusion of n-butane in an assembly of crystallites of zeolite NaX [45]. The representation shows the quantity ⟨r2(t)⟩/6t as directly accessible in the experiments. For comparison, the value of
t
RD
5
2
restr. = (14)
where R denotes the mean radius of the crystallites, is given for all three observation times. The quantity restr.D may be understood as an apparent diffusivity, resulting from the PFG NMR measurements for sufficiently long observation times if molecular propagation is con-fined to the volume of a sphere of radius R [7, 46]. It is shown in Fig. 8 that the measured quantities ⟨r2(t)⟩/(6t) coincide with Dlong-range as soon as Drest. is sufficiently small in

19
Fig. 8: PFG NMR diffusivity data for n-butane in an assemblage of zeolite NaX with a mean crystallite diameter of about 16µm and a sorbate concentration of 80 mgg-1, represented by the quantity Deff = ⟨r2(t)⟩/(6t) (open symbols). Observation times are t = 50 ms (∇), 100 ms (∆), and 200 ms (Ο). In addition, comparison with values for Drestr. determined according to Eq. (14) coinciding with eq. (45) as indicated in the figure. For Deff >> Drestr., Dlong-range coin-cides with Deff. For Deff. approaching Drestr., Dlong-range has been estimated on the basis of Eq. (15) (filled symbols). The dashed line represents the values for the coefficient of intracrystal-line self-diffusion [45]
comparison with these quantities. In the transition region between restricted and long-range diffusion, to first-order approximation long-range diffusivity may be estimated by combining Eqs. (13) and (14)
( )
tR
ttr
D56
22
range-long −><
= (15)
as indicated by the filled symbols in Fig. 8 In the temperature range where Drestr. is larger than Dlong-range but smaller than Dintra, the pattern of molecular shifts observed in PFG NMR is completely determined by the shape of the crystallites. This is the situation reflected in the propagator representations of Fig. 2b at 153 K.

20
By both model consideration for mass transfer in composite systems [47-51] and simple ran-dom walk arguments, the contribution of intracrystalline mass transfer to long-range diffusion may be shown to be much less than that of mass transfer through the intercrystalline space [45]. The coefficient of long-range diffusion may therefore be represented in the form [52, 53],
interinterrange-long DpD = (16)
with pinter and Dinter denoting, respectively, the relative population of molecules in the inter-crystalline space and their diffusivity. As a consequence of the large intracrystalline surface, in the case of gas phase adsorption one has in general pinter << 1. In a first-order gas kinetic approach the diffusivity in the intercrystalline space is given by
tort.
effinter
3/1τ
νλ⋅=D (17)
with ν = (8kT/πm)1/2 denoting the mean velocity of molecules of mass m, and with the effec-tive mean free path effλ following by reciprocal addition as
111eff
−−− += dλλ (18)
from the mean free path in the gas phase (λ ) and the mean diameter of the intercrystalline pore system (d). τtort. stands for the tortuosity factor (being typically of order 2 to 4) which takes into account that, in comparison with unrestricted space, the diffusion path of the indi-vidual molecules is enhanced by the confinement brought about by the tortuosity of the inter-crystalline pore system. It follows from Eqs. (16) through (18) that for sufficiently small gas phase concentrations (that is, for λeff ≈ d, the case of Knudsen diffusion) the temperature de-pendence of Dlong-range is determined by pinter, so that in this case the activation energy of Dlong-
range coincides with the heat of adsorption. In fact, the value of (44 ± 4) kJmol-1 for the activa-tion energy of long-range self-diffusion of n-butane in NaX, as deduced from Fig. 8, is in satisfactory agreement with literature data for the heat of adsorption ((42-44) kJmol-1 [54]).
4.2 Influence of Pressure of Compaction
Fig. 9 compares the long-range diffusivity of n-butane in a loose bed of NaX zeolite crystal-lites with that of the same sample after compaction under a pressure of 2.5 MPa. It is found that long-range diffusion in the compacted material is reduced by a factor on the order of 3, which may be attributed to a reduction of both pinter (diminution of the intercrystalline void volume) and Dinter (decrease of the intercrystalline pore diameters and hence of the effective mean free path). This experimental result confirms that the contribution of intra-crystalline
21
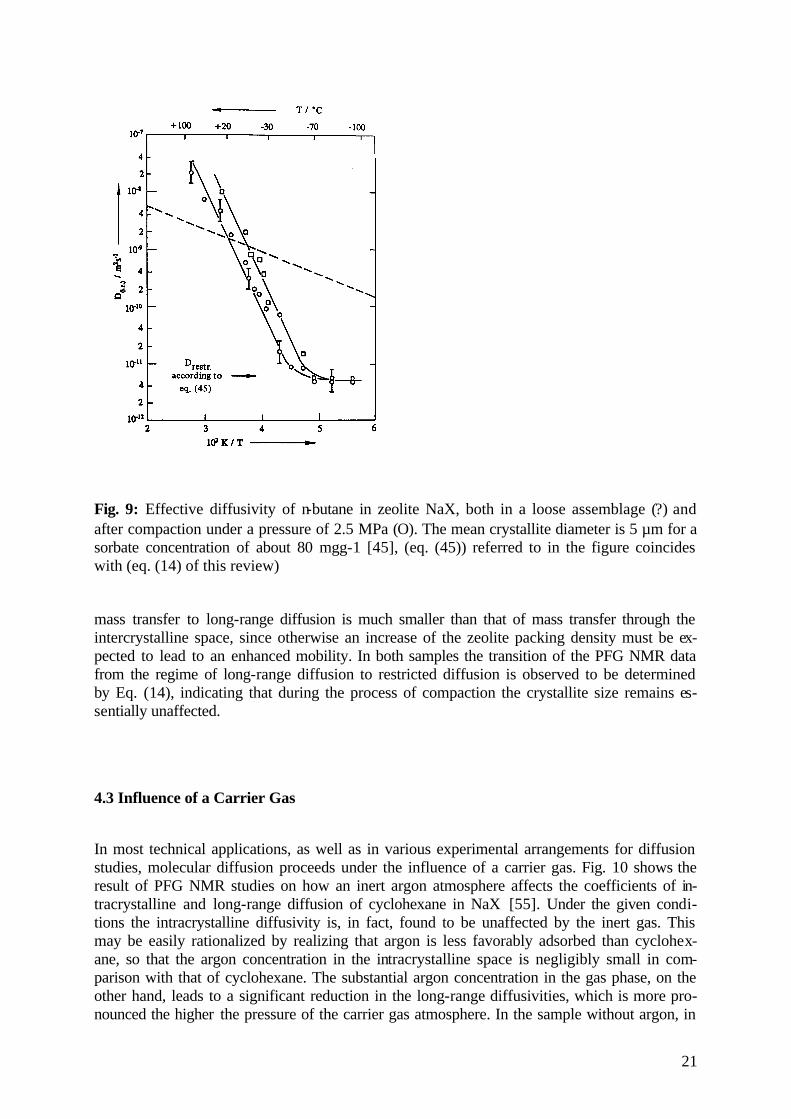
Fig. 9: Effective diffusivity of n-butane in zeolite NaX, both in a loose assemblage (?) and after compaction under a pressure of 2.5 MPa (Ο). The mean crystallite diameter is 5 µm for a sorbate concentration of about 80 mgg-1 [45], (eq. (45)) referred to in the figure coincides with (eq. (14) of this review)
mass transfer to long-range diffusion is much smaller than that of mass transfer through the intercrystalline space, since otherwise an increase of the zeolite packing density must be ex-pected to lead to an enhanced mobility. In both samples the transition of the PFG NMR data from the regime of long-range diffusion to restricted diffusion is observed to be determined by Eq. (14), indicating that during the process of compaction the crystallite size remains es-sentially unaffected.
4.3 Influence of a Carrier Gas
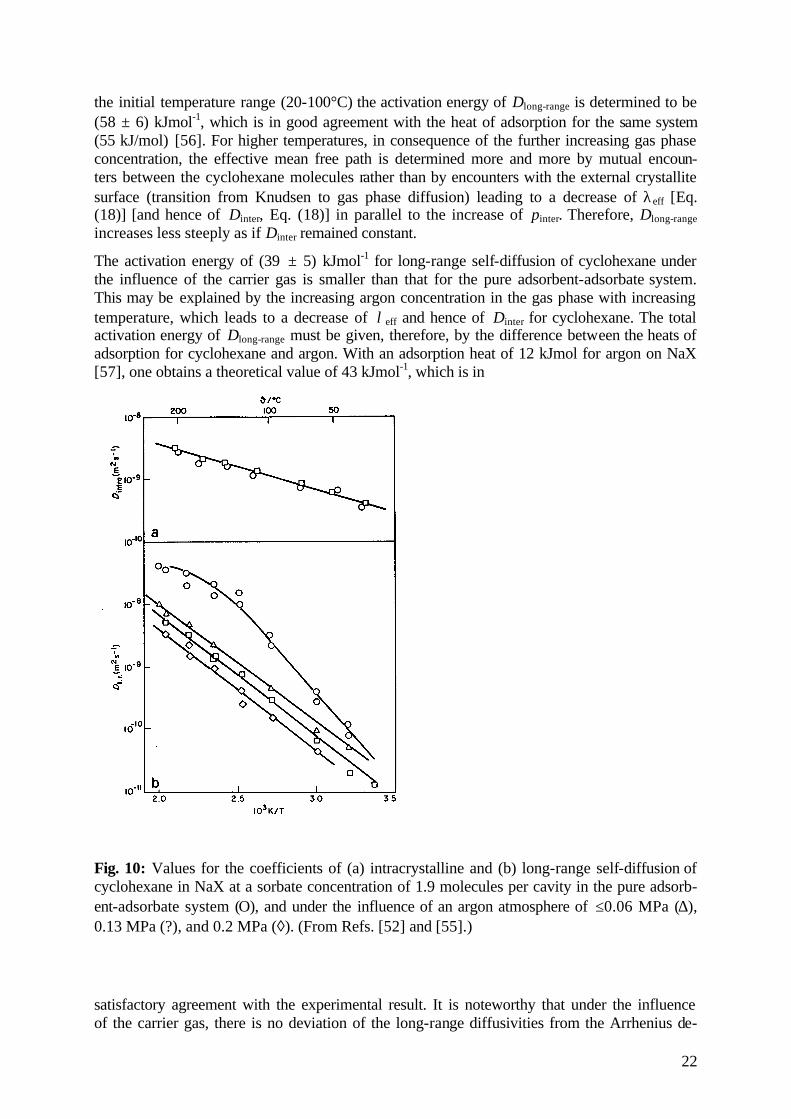
In most technical applications, as well as in various experimental arrangements for diffusion studies, molecular diffusion proceeds under the influence of a carrier gas. Fig. 10 shows the result of PFG NMR studies on how an inert argon atmosphere affects the coefficients of in-tracrystalline and long-range diffusion of cyclohexane in NaX [55]. Under the given condi-tions the intracrystalline diffusivity is, in fact, found to be unaffected by the inert gas. This may be easily rationalized by realizing that argon is less favorably adsorbed than cyclohex-ane, so that the argon concentration in the intracrystalline space is negligibly small in com-parison with that of cyclohexane. The substantial argon concentration in the gas phase, on the other hand, leads to a significant reduction in the long-range diffusivities, which is more pro-nounced the higher the pressure of the carrier gas atmosphere. In the sample without argon, in
22
the initial temperature range (20-100°C) the activation energy of Dlong-range is determined to be (58 ± 6) kJmol-1, which is in good agreement with the heat of adsorption for the same system (55 kJ/mol) [56]. For higher temperatures, in consequence of the further increasing gas phase concentration, the effective mean free path is determined more and more by mutual encoun-ters between the cyclohexane molecules rather than by encounters with the external crystallite surface (transition from Knudsen to gas phase diffusion) leading to a decrease of λeff [Eq. (18)] [and hence of Dinter, Eq. (18)] in parallel to the increase of pinter. Therefore, Dlong-range increases less steeply as if Dinter remained constant.
The activation energy of (39 ± 5) kJmol-1 for long-range self-diffusion of cyclohexane under the influence of the carrier gas is smaller than that for the pure adsorbent-adsorbate system. This may be explained by the increasing argon concentration in the gas phase with increasing temperature, which leads to a decrease of λeff and hence of Dinter for cyclohexane. The total activation energy of Dlong-range must be given, therefore, by the difference between the heats of adsorption for cyclohexane and argon. With an adsorption heat of 12 kJmol for argon on NaX [57], one obtains a theoretical value of 43 kJmol-1, which is in
Fig. 10: Values for the coefficients of (a) intracrystalline and (b) long-range self-diffusion of cyclohexane in NaX at a sorbate concentration of 1.9 molecules per cavity in the pure adsorb-ent-adsorbate system (Ο), and under the influence of an argon atmosphere of ≤0.06 MPa (∆), 0.13 MPa (?), and 0.2 MPa (◊). (From Refs. [52] and [55].)
satisfactory agreement with the experimental result. It is noteworthy that under the influence of the carrier gas, there is no deviation of the long-range diffusivities from the Arrhenius de-

23
pendence, since over the whole temperature range considered the mean free path of the cyclo-hexane molecules is determined by encounters with the argon atoms in the intercrystalline space.
Fig. 11: Values for the coefficients of (a) intracrystalline self-diffusion of the two components in n-heptane-benzene mixtures in NaX at 400 K and (b) long-range self-diffusion at 361 K, plus the separation factors calculated from them. [52, 58, 59].
4.4 Multicomponent Diffusivities and Separation Factors
Fig. 11 provides a comparison between the coefficients of intracrystalline and long-range self-diffusion of benzene and n-heptane at two-component adsorption in a bed of NaX zeolite crystallites [58-60]. In these studies, for each composition a pair of PFG NMR samples have been prepared, in which one component was applied in the protonated, the other in the deuter-ated form. The diffusivities were deduced from the proton NMR signal and refer, therefore, to the proton-containing component. In contrast to the regime of intracrystalline diffusion, where under conditions of two-component adsorption the diffusivities are found to decrease with increasing concentration (type I and type II patterns of single-component diffusion), here the long-range diffusivities tend to be enhanced with increasing concentration. This tendency comes about because with zeolites in general the amount adsorbed increases less than linearly with increasing gas phase concentration (Langmuir type isotherms), leading to an increase of pinter with increasing concentration. Therefore, as long as the gas phase concentration is small enough to ensure Knudsen diffusion, according to Eq. (16) the long-range diffusivity must be expected to increase with increasing concentration.
From the measurement of two-component long-range self-diffusivities, direct information about adsorption selectivity may be deduced. With xa
(i) and xg(i) denoting the mole fractions of
the ith mixture component in the adsorbed and gaseous phases, the sorption separation factor is defined by the relation [61]

24
( ) ( )
( ) ( )21
12
ga
ga
xx
xx=α (19)
Since p(i)inter is proportional to ( ) /i
gx ( )iax , Eq. (19) may be transformed via Eq. (16) into
( ) ( )
( ) ( )inter
1range-long
2
inter2
range-long1
DDDD
=α (20)
For molecules of comparable mass and cross-sections, the values of Dinter are of the same or-der, so that the separation factor may be estimated from the ratio of the two long-range diffu-sivities. These values, likewise indicated in Fig. 11 b, can be shown to be in satisfactory agreement with the separation factors determined in the traditional way from two-component desorption data [61].
4.5 Regime -Dependent Tortuosity Factors
Fig. 12 shows the temperature dependence of the long-range diffusivities obtained for ethane in a bed of zeolite NaX [62] and a theoretical estimate of the temperature dependence based on Eq.(16) using the approximation
D l.r. = pinter Dinter = τ
λ1
31
effu (21)
where u, ?eff and t denote the mean thermal velocity, the effective mean free path and the tor-tuosity factor as defined via
10 ≥=τeffD
D, (22)
respectively. The effective mean free path results by reciprocal addition of the mean free path in the gas phase and the mean crystal diameter, which - for the given packing density of zeo-lite crystallites serves as a good estimate for the mean pore diameter in the bed [62, 63].

25
Fig. 12: Temperature dependence of the long-range diffusion coefficients of ethane in a bed of NaX zeolites for two different loadings corresponding to gas phase pressures of 50 mbar (¦ ) and 80 mbar (?) at T = 295 K. The lines which fit the experimental data well represent the theoretical estimates of the temperature dependence based on Eq.(16) and Eq.(21) with differ-ent tortuosities in the bulk-phase (t b=1.6) and Knudsen (tK=16) regimes. The dashed line as-sumes only one tortuosity factor of tb = t K=1.6 for both regimes [62].
At high gas phase concentrations, which are attained in the closed NMR sample tubes at high temperatures, bulk-phase diffusion is the dominating mechanism for Dinter. At sufficiently low temperatures the so-called Knudsen (pore) diffusion is prevailing, i.e. mutual collisions of the diffusants are negligible in comparison with the particle-wall collisions. Most interestingly, satisfactory agreement is only obtained by assuming vastly differing tortuosity factors be-tween these two regimes. For identical tortuosity factors satisfactory agreement between the experimental data and the theoretical estimates would only result by assuming that the effec-tive mean free path under Knudsen regime is 2.5 µm, which would be rather difficult to be rationalized for packings of crystallites with diameters one order of magnitude larger. In fact, we consider these findings of PFG NMR as a first experimental confirmation of most recent theoretical papers claiming the existing of similarly vast differences in the tortuosities in de-pendence on the mechanism of molecular propagation [64, 65].
4.6 An Anomaly of Long-Range Diffusion in Particle Agglomerates
In their technical use as selective adsorbents or catalysts, the nanoporous materials are gener-ally used in the form of compacted agglomerates rather than as individual crystallites or parti-cles. In such cases, the rate of molecular transport relevant for the efficiency of the given technical processes is generally determined by the rate of transport through the agglomerate rather than by the diffusivity in any of the individual particles. As an example, Fig. 13 shows the electron scanning micrograph of an industrial sample of MCM-41 [66]. It is clearly visible that the sample consists of secondary particles of some 100 µm diameter.
26
Fig. 13: Electron scanning micrograph of an industrial sample of MCM-41 [66, 67]
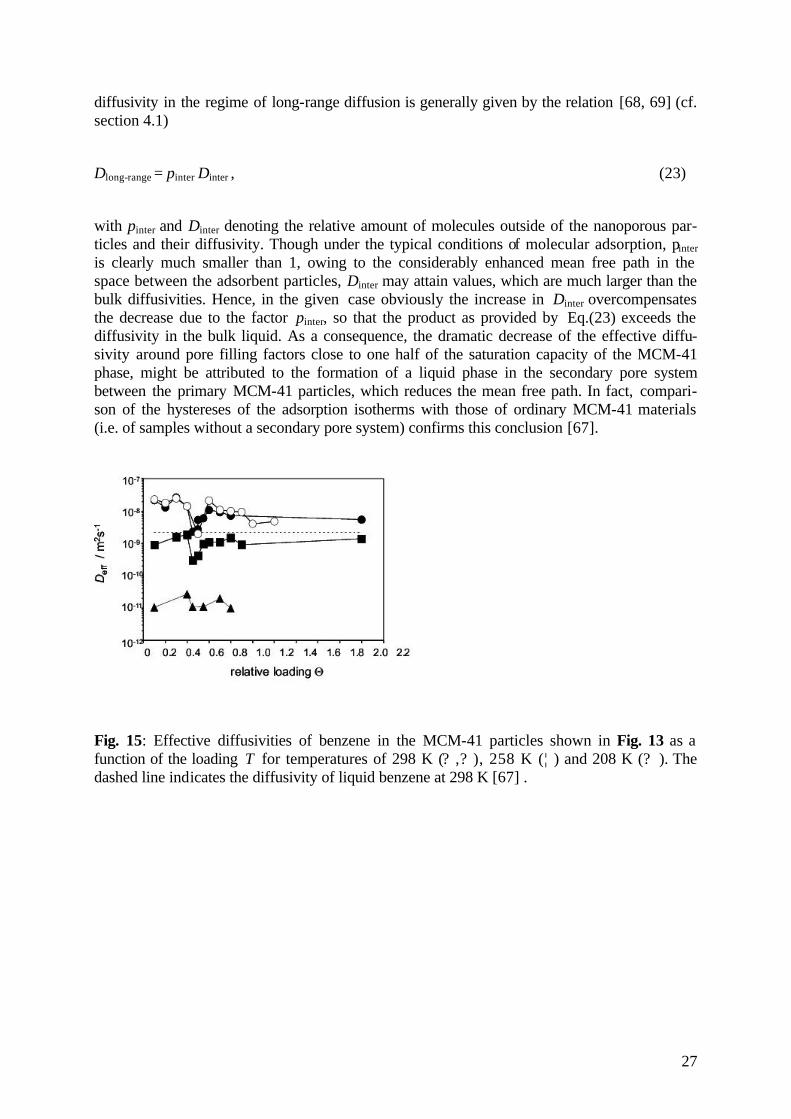
Typical diffusion paths as observable by PFG NMR are thus much smaller than these parti-cles. On the other side, however, they are much larger than the extensions of the primary par-ticles of genuine MCM-41 structure, which are scarcely to be distinguished from each other in the micrograph. Therefore, over the relevant diffusion paths the adsorbent must be expected to act as a quasi-isotropic host system. As a consequence, the curvature of the PFG NMR at-tenuation plots for benzene shown in Fig. 14 cannot be attributed to the occurrence of diffu-sion anisotropy as shall be discussed in section6.1.2. They are most likely an expression of the heterogeneity of the compacted material. Such a tendency is expected to be reduced with in-creasing observation time since then the averaging procedure embraces increasingly larger regions. In complete agreement with this expectation the echo attenuation in the master plot of Fig. 14 is in fact found to approach an exponential dependence (i.e. a linear dependence in a semilogarithmic representation) with increasing observation time.
Fig. 14: PFG NMR spin echo attenuation for benzene in the MCM-41 particles shown in Fig. 14 as function of observation time ? , which is given in the figure legend [67].
Fig. 15 shows the effective diffusivities as a function of the loading for different temperatures, where the pore filling factor T is referred to the pore volume of the genuine MCM-41 struc-ture within the particles. There are at least two remarkable features resulting from the dis-played data. First, over most of the considered concentration range the diffusivities are nota-bly larger than in the bulk liquid. This behaviour may be referred to the fact that the effective
27
diffusivity in the regime of long-range diffusion is generally given by the relation [68, 69] (cf. section 4.1)
Dlong-range = pinter Dinter , (23)
with pinter and Dinter denoting the relative amount of molecules outside of the nanoporous par-ticles and their diffusivity. Though under the typical conditions of molecular adsorption, pinter is clearly much smaller than 1, owing to the considerably enhanced mean free path in the space between the adsorbent particles, Dinter may attain values, which are much larger than the bulk diffusivities. Hence, in the given case obviously the increase in Dinter overcompensates the decrease due to the factor pinter, so that the product as provided by Eq.(23) exceeds the diffusivity in the bulk liquid. As a consequence, the dramatic decrease of the effective diffu-sivity around pore filling factors close to one half of the saturation capacity of the MCM-41 phase, might be attributed to the formation of a liquid phase in the secondary pore system between the primary MCM-41 particles, which reduces the mean free path. In fact, compari-son of the hystereses of the adsorption isotherms with those of ordinary MCM-41 materials (i.e. of samples without a secondary pore system) confirms this conclusion [67].
Fig. 15: Effective diffusivities of benzene in the MCM-41 particles shown in Fig. 13 as a function of the loading T for temperatures of 298 K (? ,? ), 258 K (¦ ) and 208 K (? ). The dashed line indicates the diffusivity of liquid benzene at 298 K [67] .

28
5. Diffusion under Mesoscopic Confinement 5.1 Confinement by Polymer Host Systems 5.1.1 Restricted Diffusion in Polymer Matrices
Polystyrene (PS) matrices with inclusions of polydimethylsiloxane (PDMS) droplets turned out to be a useful material for the production of self-lubricating components [70].
Fig. 16: Spin-echo attenuation of PDMS confined to cavities of mean diameter 1.1 µm in a polystyrene matrix in dependence on the observation time [71]. q/m-1= ?dg/m-1=1.13 .106 (?), 1.71.106 (? ), 2.27.106 (?) and 3.41.106 (? )

29
PFG NMR measurements with these systems may serve as a model for dynamic imaging. As an example,
Fig. 16 shows the spin-echo attenuation of the PDMS as a function of the observation time, with the gradient intensity (in terms of the generalized scattering vector q = ?dg) as a parame-ter. It turns out that with increasing observation time the spin-echo attenuation approaches a finite value ? ∞ , (i. e., eq. (8) with D = Drestr. given by eq. (14)) corresponding to the EISF of QNS. From the q (i.e. ?dg) -dependence of the spin-echo attenuation for each individual ob-servation time, via Eqs. (8) and (6), one may deduce both the effective diffusivity and the mean square displacement
Fig. 17: Deff in dependence on the observation time t for PDMS confined to cavities with a mean diameter of 0.6 µm. The diffusivity of the bulk PDMS is indicated as the dashed line [71].
Fig. 17 shows the resulting time dependence of the effective diffusivity. It turns out that for sufficiently small observation times the effective diffusivity approaches the value of the free PDMS (average molecular weight 28.000 g/mol), while with increasing observation time the effective diffusivities approach the reciprocal proportionality required by Eq. (14). The situa-tion is now the same as for the small crystallites at the lowest temperature considered in Fig. 2 where molecular propagation as observed by PFG NMR was controlled by the crystal size as well as for water diffusion in MCM-41 (cf. section 6.3), where in Fig. 66 for the largest ob-servation times molecular displacements were controlled by the geometrical shape of the ad-sorbent particles rather than by their intrinsic diffusivity. The mean droplet radii obtained in this way were found to be in excellent agreement with the microscopic measurements [71]. In contrast to these measurements, however, PFG NMR permits a non-destructive determination of the droplet sizes where the external conditions such as pressure and/or temperature may easily be varied. The described experiments revealed that PDMS diffuses out of the cavities into the PS matrix at elevated temperatures (the cavity radius decreases). This process was entirely reversible
5.1.2 Diffusion in Porous Polymer Membranes
The total confinement of molecular propagation considered in Sec .5.1.1 clearly excludes the possibility of anomalous diffusion. For this purpose, molecular propagation has to proceed in a network of interconnected pores, with small pores being the replica of larger ones. Com-mercially available polypropylene membranes of type „Accurel“' [72, 73] proved to be an excellent host matrix for such studies.

30
Fig. 18: Effective diffusivities of PDMS (22.5 kg/mol) in a polypropylene host matrix at porefilling factors as indicated [73].
As an example, Fig. 19 shows the time dependence of the effective diffusivities of PDMS (22.5 kg/mol) in this matrix. In contrast to Fig. 18, the time regime exhibiting a constant dif-fusivity is now followed by a less pronounced decay, indicating that molecular propagation - though being progressively hindered with increasing observation time - is not completely re-stricted. It is interesting to note that the slope of the representation, i.e. the effectiveness of the hindrance with increasing observation time, increases with decreasing pore-filling factors. This corresponds to the fact that the influence of the matrix on molecular propagation is the more pronounced, the larger the relative amount of molecules that are in immediate contact with the matrix. From the representation of Fig. 19 the time exponents ? are found to be ? = 0.83, 0.72 and 0.55 in the sequence of decreasing pore-filling factors where - as a generaliza-tion of the Einstein equation (eq. (6)) - the time exponent ? is introduced via the relation ⟨(∆r)2⟩ ~ tχ. From the representation of the effective diffusivities as a function of the dis-placement (Fig. 19), it becomes obvious that anomalous diffusion as reflected by a depend-ence of the diffusivity on the diffusion time and hence on the diffusion path length occurs for displacements between about 100 and 600 nm. It is interesting to note that these lower and upper cut-offs are of the order of the diameters of the smallest and largest pores of the host matrix which has a nominal pore width of 200 nm [72].
Fig. 19: Effective diffusivity of PDMS (22.5 kg/mol) in a polypropylene host matrix at a pore filling factor of 100% at 293K as a functionof the root mean square displacement of PDMS
31
during the NMR experiment. The filled circles refer to effective diffusivities extrapolated from measurements at 343K to room temperature by applying the well-established tempera-ture-time shift principle of polymer dynamics [73]
5.2 Internal confinement in Polymers
5.2.1 Anomalous Diffusion of the Polymer Segments in the Melt
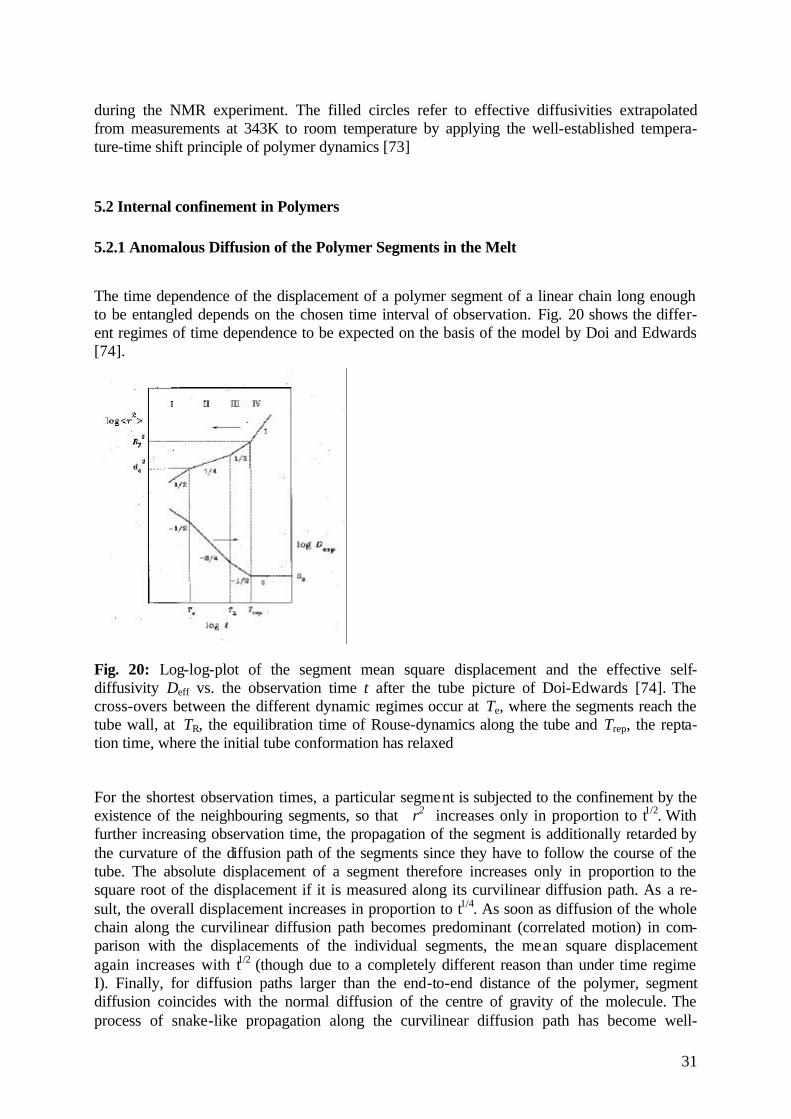
The time dependence of the displacement of a polymer segment of a linear chain long enough to be entangled depends on the chosen time interval of observation. Fig. 20 shows the differ-ent regimes of time dependence to be expected on the basis of the model by Doi and Edwards [74].
Fig. 20: Log-log-plot of the segment mean square displacement and the effective self-diffusivity Deff vs. the observation time t after the tube picture of Doi-Edwards [74]. The cross-overs between the different dynamic regimes occur at Te, where the segments reach the tube wall, at TR, the equilibration time of Rouse-dynamics along the tube and Trep, the repta-tion time, where the initial tube conformation has relaxed
For the shortest observation times, a particular segment is subjected to the confinement by the existence of the neighbouring segments, so that ⟨r2⟩ increases only in proportion to t1/2. With further increasing observation time, the propagation of the segment is additionally retarded by the curvature of the diffusion path of the segments since they have to follow the course of the tube. The absolute displacement of a segment therefore increases only in proportion to the square root of the displacement if it is measured along its curvilinear diffusion path. As a re-sult, the overall displacement increases in proportion to t1/4. As soon as diffusion of the whole chain along the curvilinear diffusion path becomes predominant (correlated motion) in com-parison with the displacements of the individual segments, the mean square displacement again increases with t1/2 (though due to a completely different reason than under time regime I). Finally, for diffusion paths larger than the end-to-end distance of the polymer, segment diffusion coincides with the normal diffusion of the centre of gravity of the molecule. The process of snake-like propagation along the curvilinear diffusion path has become well-
32
known by the term "reptation''. It is interesting to note that under the conditions of time-regime II, segment diffusion in polymers may be understood in a way, which is also very helpful for the analytical treatment of single-file diffusion (see section 6.2.1). In the polymer chain, the elementary step of propagation of a segment may be interpreted as the effect of a loop passing the segment under consideration [75], while in a single-file system a particle changes its position, if a "vacancy" is travelling across this particle from one to the other side [76, 77]. The benefit of this interpretation is due to the fact that instead of elements subjected to correlated movements (chain segments and particles in a single-file systems) one has to do with independent elements (loops or vacancies). It is not too complicated, therefore, to obtain in this way the t -dependence for the movement of the mutually dependent elements ana-lytically. In the case of the macromolecules, clearly, another square root has to be applied as a consequence of the curvilinear diffusion path. The space and time scales of transition between the individual regimes in Fig. 20 are characterized by characteristic quantities, which are ex-plained in the legend. From the values typical for the different quantities (tube diameter d0 = 4 nm and RF = 100 nm) one may deduce that - coming from large observation times - PFG NMR is only sensitive to the transition between regimes IV to III, (while - coming from short observation times - Quasi Elastic Neutron Scattering (QENS) is only appropriately applied to study regimes I and II).
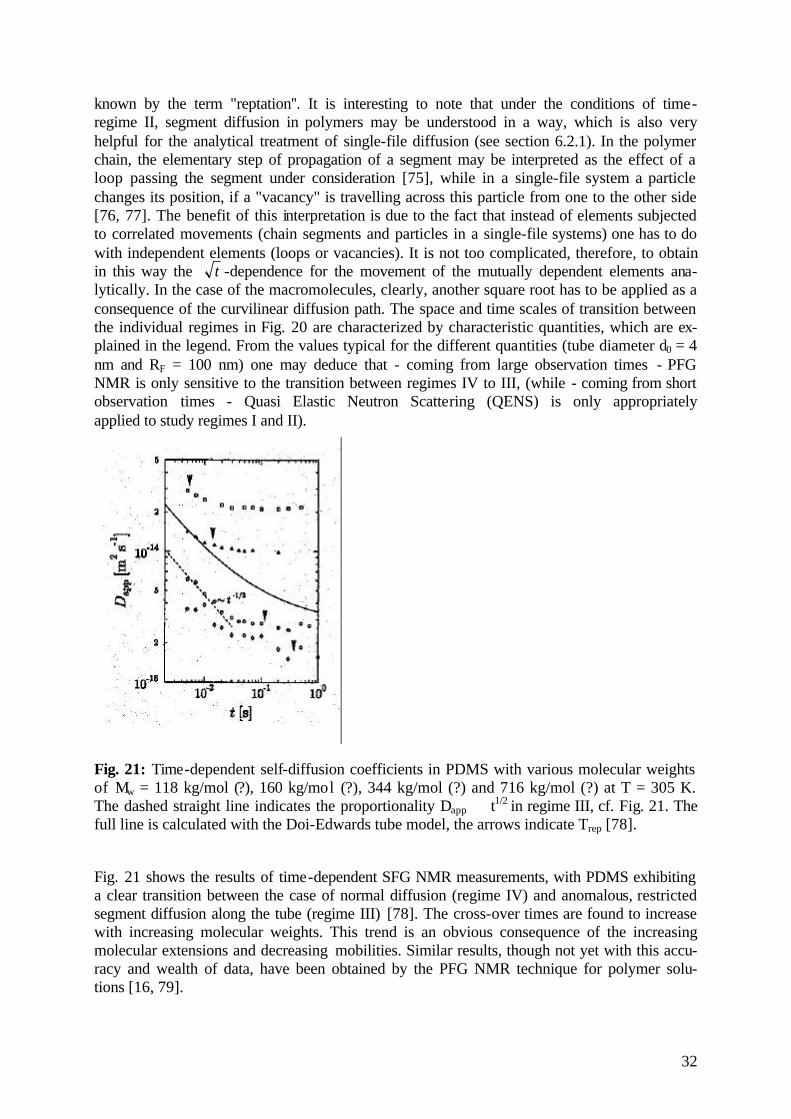
Fig. 21: Time-dependent self-diffusion coefficients in PDMS with various molecular weights of Mw = 118 kg/mol (?), 160 kg/mol (?), 344 kg/mol (?) and 716 kg/mol (?) at T = 305 K. The dashed straight line indicates the proportionality Dapp ∝ t1/2 in regime III, cf. Fig. 21. The full line is calculated with the Doi-Edwards tube model, the arrows indicate Trep [78].
Fig. 21 shows the results of time-dependent SFG NMR measurements, with PDMS exhibiting a clear transition between the case of normal diffusion (regime IV) and anomalous, restricted segment diffusion along the tube (regime III) [78]. The cross-over times are found to increase with increasing molecular weights. This trend is an obvious consequence of the increasing molecular extensions and decreasing mobilities. Similar results, though not yet with this accu-racy and wealth of data, have been obtained by the PFG NMR technique for polymer solu-tions [16, 79].
33
5.2.2 Diffusion under the Influence of Polymer Hyperstructures Induced by Block-Copolymers
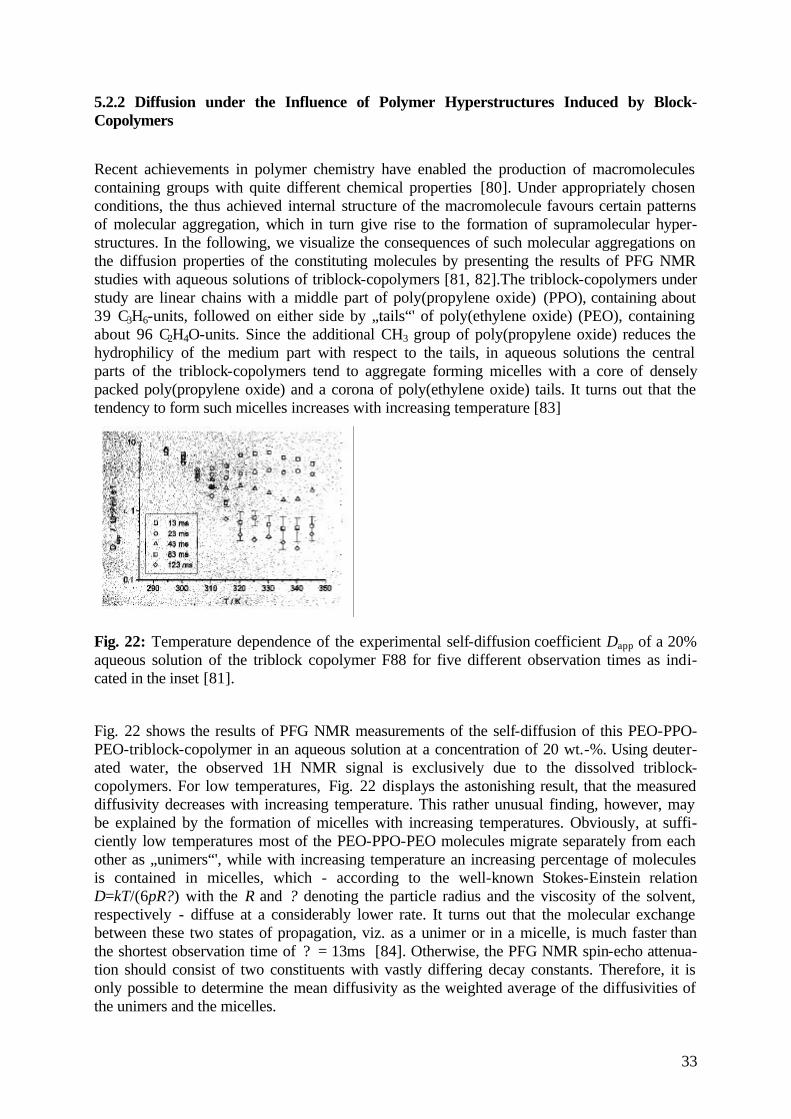
Recent achievements in polymer chemistry have enabled the production of macromolecules containing groups with quite different chemical properties [80]. Under appropriately chosen conditions, the thus achieved internal structure of the macromolecule favours certain patterns of molecular aggregation, which in turn give rise to the formation of supramolecular hyper-structures. In the following, we visualize the consequences of such molecular aggregations on the diffusion properties of the constituting molecules by presenting the results of PFG NMR studies with aqueous solutions of triblock-copolymers [81, 82].The triblock-copolymers under study are linear chains with a middle part of poly(propylene oxide) (PPO), containing about 39 C3H6-units, followed on either side by „tails“' of poly(ethylene oxide) (PEO), containing about 96 C2H4O-units. Since the additional CH3 group of poly(propylene oxide) reduces the hydrophilicy of the medium part with respect to the tails, in aqueous solutions the central parts of the triblock-copolymers tend to aggregate forming micelles with a core of densely packed poly(propylene oxide) and a corona of poly(ethylene oxide) tails. It turns out that the tendency to form such micelles increases with increasing temperature [83]
Fig. 22: Temperature dependence of the experimental self-diffusion coefficient Dapp of a 20% aqueous solution of the triblock copolymer F88 for five different observation times as indi-cated in the inset [81].
Fig. 22 shows the results of PFG NMR measurements of the self-diffusion of this PEO-PPO-PEO-triblock-copolymer in an aqueous solution at a concentration of 20 wt.-%. Using deuter-ated water, the observed 1H NMR signal is exclusively due to the dissolved triblock-copolymers. For low temperatures, Fig. 22 displays the astonishing result, that the measured diffusivity decreases with increasing temperature. This rather unusual finding, however, may be explained by the formation of micelles with increasing temperatures. Obviously, at suffi-ciently low temperatures most of the PEO-PPO-PEO molecules migrate separately from each other as „unimers“', while with increasing temperature an increasing percentage of molecules is contained in micelles, which - according to the well-known Stokes-Einstein relation D=kT/(6pR?) with the R and ? denoting the particle radius and the viscosity of the solvent, respectively - diffuse at a considerably lower rate. It turns out that the molecular exchange between these two states of propagation, viz. as a unimer or in a micelle, is much faster than the shortest observation time of ? = 13ms [84]. Otherwise, the PFG NMR spin-echo attenua-tion should consist of two constituents with vastly differing decay constants. Therefore, it is only possible to determine the mean diffusivity as the weighted average of the diffusivities of the unimers and the micelles.

34
Fig. 23: Experimental self-diffusion coefficient in dependence on the observation time t for the triblock copolymer F88 in a 20% aqueous solution at 345 K. Note the cross-over to com-pletely restricted diffusion at about t = 10 ms [83].
Starting from temperatures above about 300 K, the diffusivities appear to be time-dependent. For a temperature of 345 K, this dependency is explicitly shown in Fig. 23. Over the consid-ered time interval the effective diffusivity obeys the relation Deff ∝ t-1. According to Eq. (14), this proportionality suggests that - at least during the observation time - the molecules are confined within ranges, whose mean radii result to be of the order of 500 nm. This value is much larger than the typical dimensions of the micelles which are of the order of 10 nm. PFG NMR diffusivity data suggest, therefore, the existence of a hyperstructure, being caused, e.g., by the existence of different crystalline domains. The formation of a polycrystalline structure in PEO-PPO-PEO triblock copolymers was confirmed by SANS [85]. Such domains could in fact be observed by static light scattering experiments, which indicate the existence of aggre-gates with radii of the same order [81, 82]. Moreover, the dimensions of the confining regions were found to depend significantly on the time programme of temperature variation. Such a dependence is most likely if the confining regions are identified with domains of ordered mo-lecular and/or micellar arrangement.
Two-component systems are well known to tend to disintegrate into two separate phases, if the association of like molecules is favoured over the association of unlike molecules. In two-component polymer systems, such a tendency may be counteracted by involving diblock co-polymers of the two constituents as a third component. PFG NMR may serve as a valuable tool for the elucidation of internal dynamics of such systems, which are found to be dramati-cally affected by the presence of the diblock copolymer. As an example, Fig. 24 shows the results of extensive PFG NMR self-diffusion measurements with a ternary blend containing equal molar volumes of the homopolymers poly(dimethylsiloxane) (PDMS) and poly(ethylethylene) (PEE), and the nearly symmetric PDMS-PEE diblock copolymer [86]. The copolymer represents about 10% of the total volume. The blend is known to form a bi-continuous microemulsion below 356 K, while it is in the disordered state at higher tempera-tures [87]. In addition, Fig. 24 also displays the diffusivity data determined separately for the pure components of the blend.

35
Fig. 24: Arrhenius diagram of the PFG NMR diffusivities in the disordered state (!) as well as for the fast (?) and slow processes (?) in the ternary blend and comparison with the mean diffusivities of the pure PDMS (?) and PEE (?) homopolymers as well as of the PEE-PDMS diblock copolymer following two different averaging procedures (× ,+). The vertical line de-notes the phase transition between the microemulsion and the disordered state as identified using dynamic light scattering [87]. The arrow indicates the order-disorder transition in the PEE-PDMS diblock copolymer melt [86].
In the ternary blend, two constituents with different diffusivities may be identified. Owing to their prevailing contribution to the molecular volume, they are most likely to be attributed to the homopolymers PDMS and PEE of the blend. This assumption has been confirmed by con-sidering the influence of the nuclear magnetic relaxation times on the relative contributions of the respective constituents [86]. As a remarkable result, the diffusivity in the fast process (which has thus been attributed to PDMS in the blend) is found to be smaller than the diffu-sivity in the pure PDMS phase, while the diffusivity in the slow process (i.e. the PEE diffusiv-ity in the blend) is larger than the diffusivity in the pure PEE phase. The explanation of this behaviour may be based on the different translational mobility in the pure PDMS and PEE phases due to the differences in their viscosity [88]. There are in fact two mechanisms, which may explain the observed behaviour and which are most likely acting in parallel: Though there is an internal separation of the blent into two phases, there is no perfect disintegration into the two constituents. As a consequence, the contribution of PEE to the PDMS-enriched phase tends to decrease the internal mobility with respect to the pure PDMS phase, while, vice versa, the contribution of PDMS to the PEE-enriched phase is supposed to lead to an enhanced mobility. Further on, molecular propagation has to be influenced by the internal structure. This means that as a consequence of the tortuosity of the two phases, the diffusivity of PDMS will be additionally reduced in comparison with the extended phase. In the case of PEE, however, the existence of different phases may be expected to lead to an additional en-hancement of its mobility, since during their residence in the PDMS-enriched phases the PEE molecules will experience an enhanced translational mobility.
In contrast to the studies presented in Fig. 22, in this case varying the observation time did not show any essential influence on the measured diffusivities. This shows that any internal trans-port resistances are many times overcome during the observation time. In fact, an estimate of the domain size of the separated phases by small angle neutron scattering yields values of about 75 nm [87, 89], which are notably exceeded by the diffusion path lengths during the observation times. Studying such effects of molecular restrictions by choosing experimental

36
conditions, where the observed molecular displacements may be of the order of the phase ex-tensions, are among the most challenging tasks of future research.
5.3 The NMR Tracer Desorption Technique
5.3.1 Measuring Principle
In many cases the rate of molecular mass transfer through the bed of zeolite crystallites , i.e., the long-range diffusivity is found to be so fast that the propagator determined in the PFG NMR experiment may be easily separated into its two constituents.
One part stems from molecules that have left their crystallites during the observation time (i.e., during the time interval ∆ between the two field gradient pulses), and the other originates from those molecules which at the time of the second gradient pulse are in the same crystal as during the first gradient pulse. This is the situation depicted in the propagator representations given in Fig. 2a at 233 and 293 K. Since the activation energy of long-range diffusion, which generally coincides with the heat of adsorption (see chapter 4), is in general larger than that of intracrystalline diffusion, this condition may be fulfilled for most systems simply by enhanc-ing the measuring temperature. The intensity of either of these distribution curves is directly proportional to the relative amount of molecules that have left their crystallites (broad line) and those that are still in the same crystallite (narrow line). Hence by varying the observation time one is able to determine the time dependence of molecular exchange between the in-tracrystalline space and the surroundings. The information is completely equivalent to that obtained in conventional tracer exchange experiments, and therefore this method of analysing PFG NMR data has been called the NMR tracer desorption technique [91] or - in view of the very short observation times in the NMR experiments (ms to s) - fast tracer desorption [92]. In general, spin-echo attenuation in NMR tracer desorption experiments may be approximated by the superposition of two exponentials in the form of Eq. (8), corresponding to two Gaus-sians (eq. (4)) for the two constituents of the propagator. The intensity of the two constituents is given simply by the two preexponential factors determined from the echo attenuation.

37
Fig. 25: Analysis of PFG NMR data for NMR tracer desorption studies (butane/NaX, 165 mgg-1, R = 25 µm, 353 K) [91]
The usual way to analyze the PFG NMR data for NMR tracer desorption measurements is illustrated in Fig. 25 [91]: the intensity of the slowly decaying component (corresponding to the broader distribution within the propagator representation) coincides with the relative amount of molecules {1-γ(t)} which, for the given observation time ∆ (=t), have remained in their crystallites (Fig. 25a, b).
In general, the NMR tracer desorption data are represented in terms of the intracrystalline mean lifetime τintra, defined as the first statistical moment of the tracer desorption curve γ(t) the relation
( )( )dttra ∫∞
= −0
int 1 γτ , (24a)
which coincides with the shaded area in Fig. 25c. With commercial samples, the range of measurement may be considerably enhanced by applying a large constant field gradient in addition to the pulsed field gradients. It has been shown [93, 94], that in this case the NMR tracer desorption technique yields a time constant τ’
intra, which in the limit of small values coincides with the intracrystalline mean lifetimes (typically for τ’
intra ≤ 5 ms) and which in-creases with increasing values of τintra at a rate above that expected for a linear dependence.
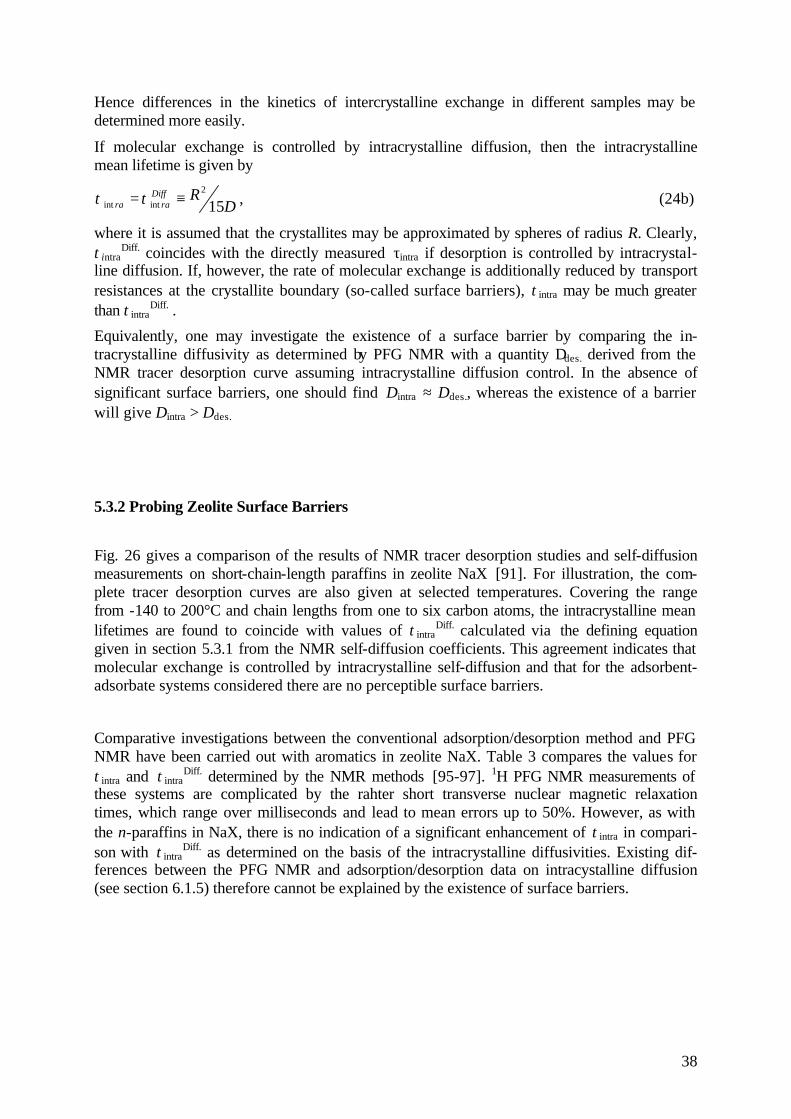
38
Hence differences in the kinetics of intercrystalline exchange in different samples may be determined more easily.
If molecular exchange is controlled by intracrystalline diffusion, then the intracrystalline mean lifetime is given by
DRDiff
rara 152
intint ≡= ττ , (24b)
where it is assumed that the crystallites may be approximated by spheres of radius R. Clearly, τintra
Diff. coincides with the directly measured τintra if desorption is controlled by intracrystal-line diffusion. If, however, the rate of molecular exchange is additionally reduced by transport resistances at the crystallite boundary (so-called surface barriers), τintra may be much greater than τintra
Diff. .
Equivalently, one may investigate the existence of a surface barrier by comparing the in-tracrystalline diffusivity as determined by PFG NMR with a quantity Ddes. derived from the NMR tracer desorption curve assuming intracrystalline diffusion control. In the absence of significant surface barriers, one should find Dintra ≈ Ddes., whereas the existence of a barrier will give Dintra > Ddes.
5.3.2 Probing Zeolite Surface Barriers
Fig. 26 gives a comparison of the results of NMR tracer desorption studies and self-diffusion measurements on short-chain-length paraffins in zeolite NaX [91]. For illustration, the com-plete tracer desorption curves are also given at selected temperatures. Covering the range from -140 to 200°C and chain lengths from one to six carbon atoms, the intracrystalline mean lifetimes are found to coincide with values of τintra
Diff. calculated via the defining equation given in section 5.3.1 from the NMR self-diffusion coefficients. This agreement indicates that molecular exchange is controlled by intracrystalline self-diffusion and that for the adsorbent-adsorbate systems considered there are no perceptible surface barriers.
Comparative investigations between the conventional adsorption/desorption method and PFG NMR have been carried out with aromatics in zeolite NaX. Table 3 compares the values for τintra and τintra
Diff. determined by the NMR methods [95-97]. 1H PFG NMR measurements of these systems are complicated by the rahter short transverse nuclear magnetic relaxation times, which range over milliseconds and lead to mean errors up to 50%. However, as with the n-paraffins in NaX, there is no indication of a significant enhancement of τintra in compari-son with τintra
Diff. as determined on the basis of the intracrystalline diffusivities. Existing dif-ferences between the PFG NMR and adsorption/desorption data on intracystalline diffusion (see section 6.1.5) therefore cannot be explained by the existence of surface barriers.

39
Fig. 26: NMR tracer desorption measurements with methane (?; 94 mgg-1, R = 25 µm), eth-ane (?; 113 mgg-1, R = 25 µm), n-butane (?; 165 mgg-1, R = 25 µm), and n-hexane (∆, ∇; 165 mgg-1, R = 10 µm) in zeolite NaX. (a) Intracrystalline mean lifetimes as determined from the NMR tracer desorption curves on the basis of Eq. (24a), plus comparison with the values of τintra
Diff. as calculated via Eq. (24b) from the intracrystalline diffusivities determined by PFG NMR. (b) NMR tracer desorption curves for selected temperatures [91].
Table 1: Comparison of Values for the Intracrystalline Mean Lifetime τintra and the Quantity τintra
Diff., Calculated on the Basis of the Coefficients of Intracrystalline Self-Diffusion for Aromatic Compounds in Zeolite NaX (Source: [96, 97]) Mean Crystallite Radius (µm)
Sorbate
Sorbate concentration (molecules per cavity)
T (K)
τintra (ms)
Dintra (10-11 m2s-1)
τintra
Diff
(ms)
2 2 18 18
benzene benzene toluene meta-xylene
4.7 4.3 2.1 1.65
393 423 463 463
12 20 37 98
15 2.0 40 15
18 13 54 140

40
In contrast to the large-pore zeolite NaX, where so far no indication for the formation of sur-face barriers has been observed, there are many PFG NMR studies showing unambiguous evidence for surface barriers in NaCaA and - to a lesser extent - in ZSM-5. One has to note, though, that the intensity of the transport resistance by the crystallite surface compared to that in the intracrystalline space may depend significantly on the method of sample preparation as well as on the nature of the probe molecule. Table 2 shows the results of combined PFG NMR and NMR tracer desorption studies of zeolite NaCaA as a powder and also in the granulated form with methane as an adsorbate [96]. The zeolite specimens have been activated under both “shallow bed” (SB: filling height ≤ 3 mm, heating rate 10 K/h, continuous evacuation, final pressure ≤ 10-2 Pa) and “deep bed” (DB: filling height ≥ 15 mm, heating rate 100 K/h, evacuation only at the final temperature, final pressure ≤ 10-2 Pa) conditions [98]. From the constancy of the values for τintra
Diff. it follows that neither the granulation procedure nor the mode of sample preparation significantly affects intracrystalline diffusion. However, only for the powder sample and only after moderate activation do the values of τintra and τintra
Diff. coin-cide. Thus both the deep bed activation and the process of granulation lead to the formation of a surface barrier. The common feature of the two processes is that the zeolite is subjected to hydrothermal conditions. This fact will be explored in more detail in the following.
Table 2: Influence of Sample Activation and Granulation on Molecular Transport of Methane in NaCaA at 293 K
Sample activation
τintraDiff.
(ms)
τintra
(ms)
Dlong-range
(10-7 m2s-1)
NaCaA (powder)
NaCaA (granule)
SB
DB
SB
DB
0.3 ± 0.1
0.3 ± 0.1
0.3 ± 0.1
0.3 ± 0.1
0.3 ± 0.1
2.5 ± 0.5
1.8 ± 0.4
5.6 ± 1.1
18 ± 7
21 ± 8
2.5 ± 1.0
2.8 ± 1.1
In their fundamental study of the influence of moisture on the transport properties of zeolites, Kondis and Dranoff [99] have noted a remarkable decrease in the adsorption/desorption rates of hydrocarbons in zeolite NaCaA after a hydrothermal treatment of the zeolites. Comparison of the values of τintra and τintra
Diff. in Table 2 indicates that this effect is attributable primarily to the formation of surface barriers rather than to a significant change of the intracrystalline mo-bility. Studies of the surface composition of the zeolite crystallites by x-ray photoelectron spectroscopy show that the formation and enhancement of the surface barrier is accompanied by a decrease of the cation content in the surface layer, thereby indicating a structural collapse of the surface layer of the zeolite crystallite [100].
Fig. 27 shows results from a systematic study dealing with the influence of a hydrothermal pretreatment of granulated zeolite NaCaA on the three main transport parameters accessible
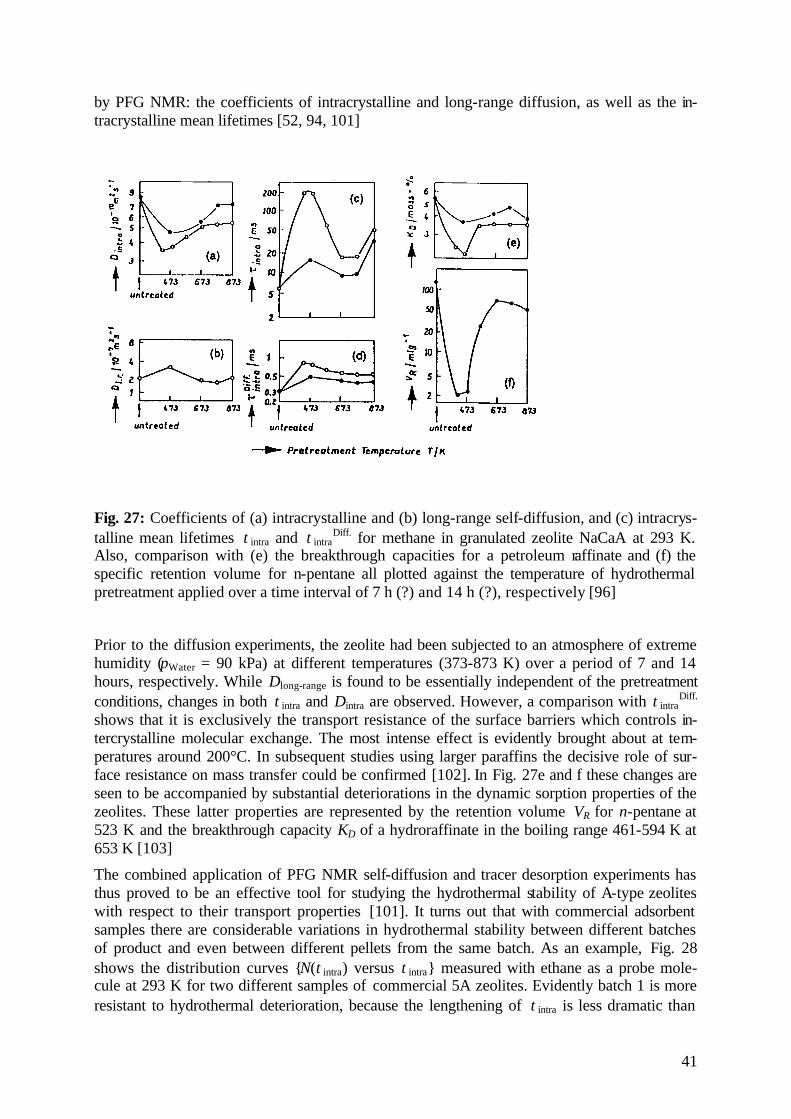
41
by PFG NMR: the coefficients of intracrystalline and long-range diffusion, as well as the in-tracrystalline mean lifetimes [52, 94, 101]
Fig. 27: Coefficients of (a) intracrystalline and (b) long-range self-diffusion, and (c) intracrys-talline mean lifetimes τintra and τintra
Diff. for methane in granulated zeolite NaCaA at 293 K. Also, comparison with (e) the breakthrough capacities for a petroleum raffinate and (f) the specific retention volume for n-pentane all plotted against the temperature of hydrothermal pretreatment applied over a time interval of 7 h (?) and 14 h (?), respectively [96]
Prior to the diffusion experiments, the zeolite had been subjected to an atmosphere of extreme humidity (pWater = 90 kPa) at different temperatures (373-873 K) over a period of 7 and 14 hours, respectively. While Dlong-range is found to be essentially independent of the pretreatment conditions, changes in both τintra and Dintra are observed. However, a comparison with τintra
Diff. shows that it is exclusively the transport resistance of the surface barriers which controls in-tercrystalline molecular exchange. The most intense effect is evidently brought about at tem-peratures around 200°C. In subsequent studies using larger paraffins the decisive role of sur-face resistance on mass transfer could be confirmed [102]. In Fig. 27e and f these changes are seen to be accompanied by substantial deteriorations in the dynamic sorption properties of the zeolites. These latter properties are represented by the retention volume VR for n-pentane at 523 K and the breakthrough capacity KD of a hydroraffinate in the boiling range 461-594 K at 653 K [103]
The combined application of PFG NMR self-diffusion and tracer desorption experiments has thus proved to be an effective tool for studying the hydrothermal stability of A-type zeolites with respect to their transport properties [101]. It turns out that with commercial adsorbent samples there are considerable variations in hydrothermal stability between different batches of product and even between different pellets from the same batch. As an example, Fig. 28 shows the distribution curves {N(τintra) versus τintra} measured with ethane as a probe mole-cule at 293 K for two different samples of commercial 5A zeolites. Evidently batch 1 is more resistant to hydrothermal deterioration, because the lengthening of τintra is less dramatic than
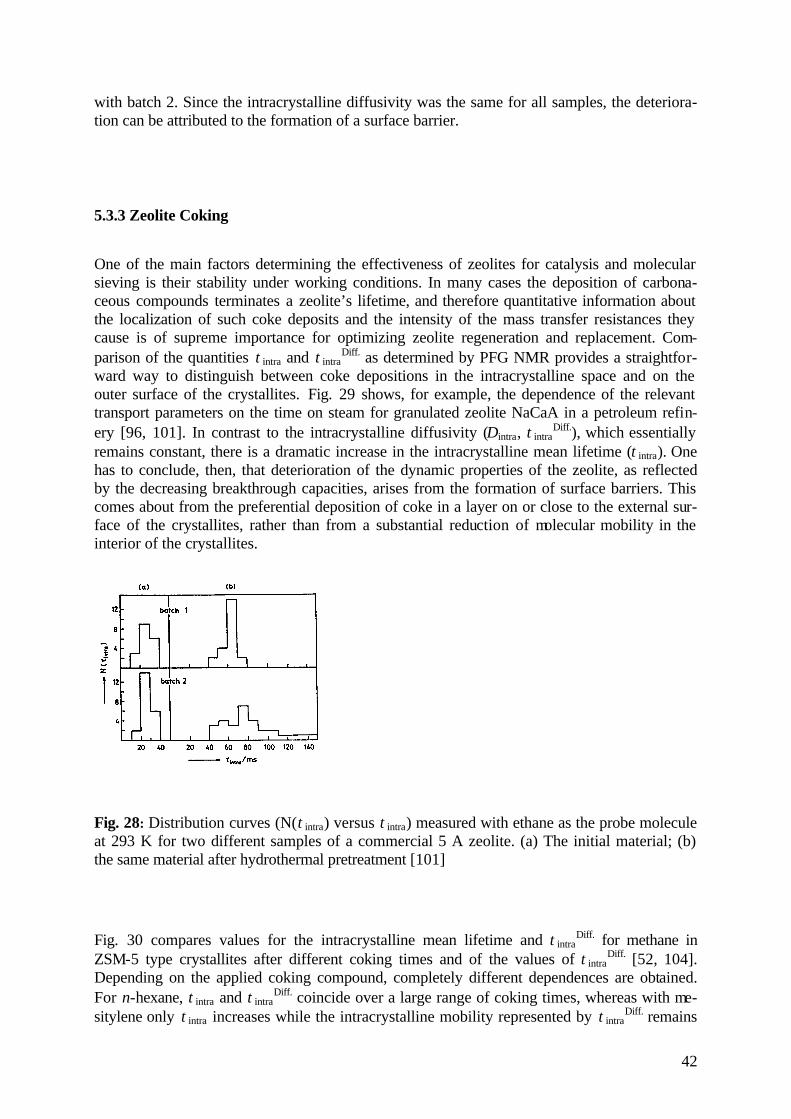
42
with batch 2. Since the intracrystalline diffusivity was the same for all samples, the deteriora-tion can be attributed to the formation of a surface barrier.
5.3.3 Zeolite Coking
One of the main factors determining the effectiveness of zeolites for catalysis and molecular sieving is their stability under working conditions. In many cases the deposition of carbona-ceous compounds terminates a zeolite’s lifetime, and therefore quantitative information about the localization of such coke deposits and the intensity of the mass transfer resistances they cause is of supreme importance for optimizing zeolite regeneration and replacement. Com-parison of the quantities τintra and τintra
Diff. as determined by PFG NMR provides a straightfor-ward way to distinguish between coke depositions in the intracrystalline space and on the outer surface of the crystallites. Fig. 29 shows, for example, the dependence of the relevant transport parameters on the time on steam for granulated zeolite NaCaA in a petroleum refin-ery [96, 101]. In contrast to the intracrystalline diffusivity (Dintra, τintra
Diff.), which essentially remains constant, there is a dramatic increase in the intracrystalline mean lifetime (τintra). One has to conclude, then, that deterioration of the dynamic properties of the zeolite, as reflected by the decreasing breakthrough capacities, arises from the formation of surface barriers. This comes about from the preferential deposition of coke in a layer on or close to the external sur-face of the crystallites, rather than from a substantial reduction of molecular mobility in the interior of the crystallites.
Fig. 28: Distribution curves (N(τintra) versus τintra) measured with ethane as the probe molecule at 293 K for two different samples of a commercial 5 A zeolite. (a) The initial material; (b) the same material after hydrothermal pretreatment [101]
Fig. 30 compares values for the intracrystalline mean lifetime and τintraDiff. for methane in
ZSM-5 type crystallites after different coking times and of the values of τintraDiff. [52, 104].
Depending on the applied coking compound, completely different dependences are obtained. For n-hexane, τintra and τintra
Diff. coincide over a large range of coking times, whereas with me-sitylene only τintra increases while the intracrystalline mobility represented by τintra
Diff. remains
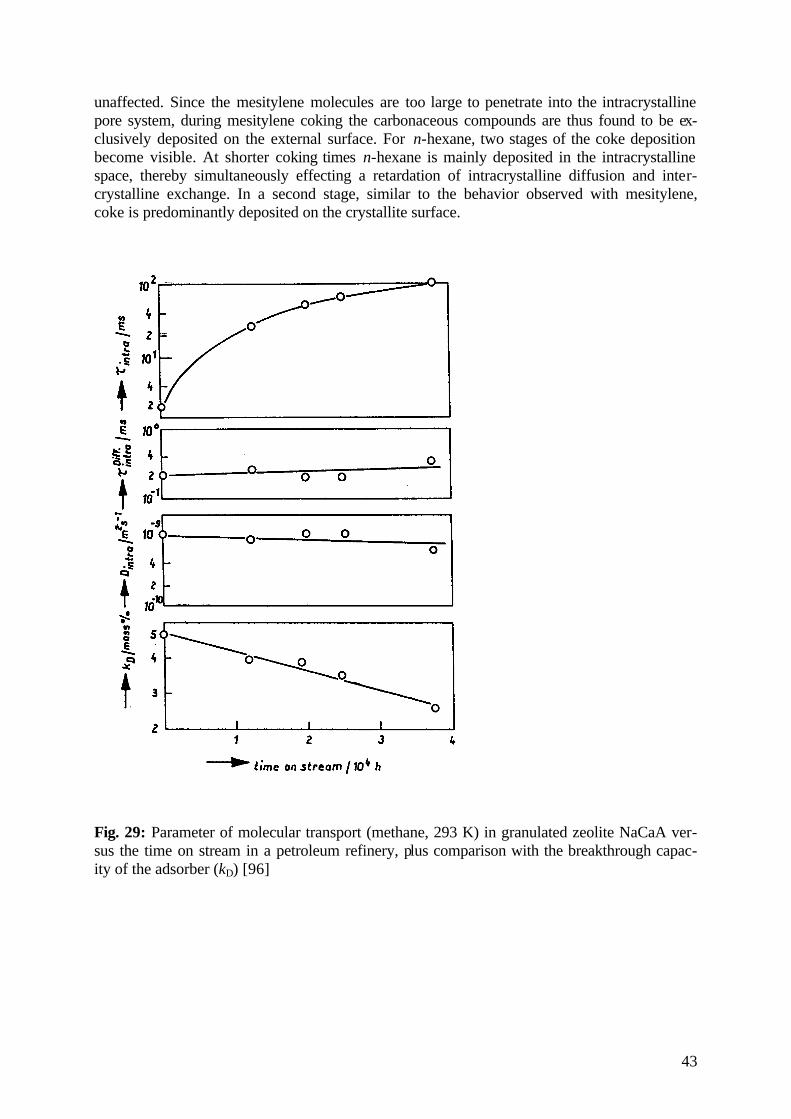
43
unaffected. Since the mesitylene molecules are too large to penetrate into the intracrystalline pore system, during mesitylene coking the carbonaceous compounds are thus found to be ex-clusively deposited on the external surface. For n-hexane, two stages of the coke deposition become visible. At shorter coking times n-hexane is mainly deposited in the intracrystalline space, thereby simultaneously effecting a retardation of intracrystalline diffusion and inter-crystalline exchange. In a second stage, similar to the behavior observed with mesitylene, coke is predominantly deposited on the crystallite surface.
Fig. 29: Parameter of molecular transport (methane, 293 K) in granulated zeolite NaCaA ver-sus the time on stream in a petroleum refinery, plus comparison with the breakthrough capac-ity of the adsorber (kD) [96]
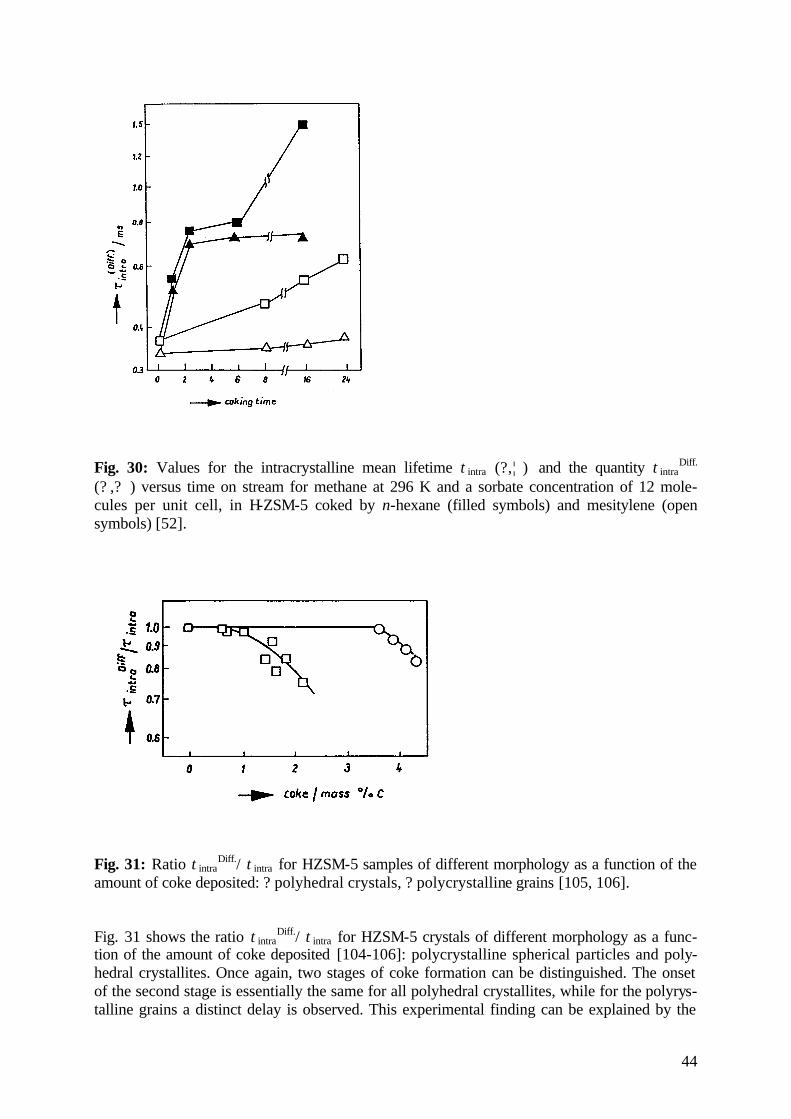
44
Fig. 30: Values for the intracrystalline mean lifetime τintra (?,¦ ) and the quantity τintraDiff.
(? ,? ) versus time on stream for methane at 296 K and a sorbate concentration of 12 mole-cules per unit cell, in H-ZSM-5 coked by n-hexane (filled symbols) and mesitylene (open symbols) [52].
Fig. 31: Ratio τintraDiff./ τintra for HZSM-5 samples of different morphology as a function of the
amount of coke deposited: ? polyhedral crystals, ? polycrystalline grains [105, 106].
Fig. 31 shows the ratio τintraDiff./ τintra for HZSM-5 crystals of different morphology as a func-
tion of the amount of coke deposited [104-106]: polycrystalline spherical particles and poly-hedral crystallites. Once again, two stages of coke formation can be distinguished. The onset of the second stage is essentially the same for all polyhedral crystallites, while for the polyrys-talline grains a distinct delay is observed. This experimental finding can be explained by the
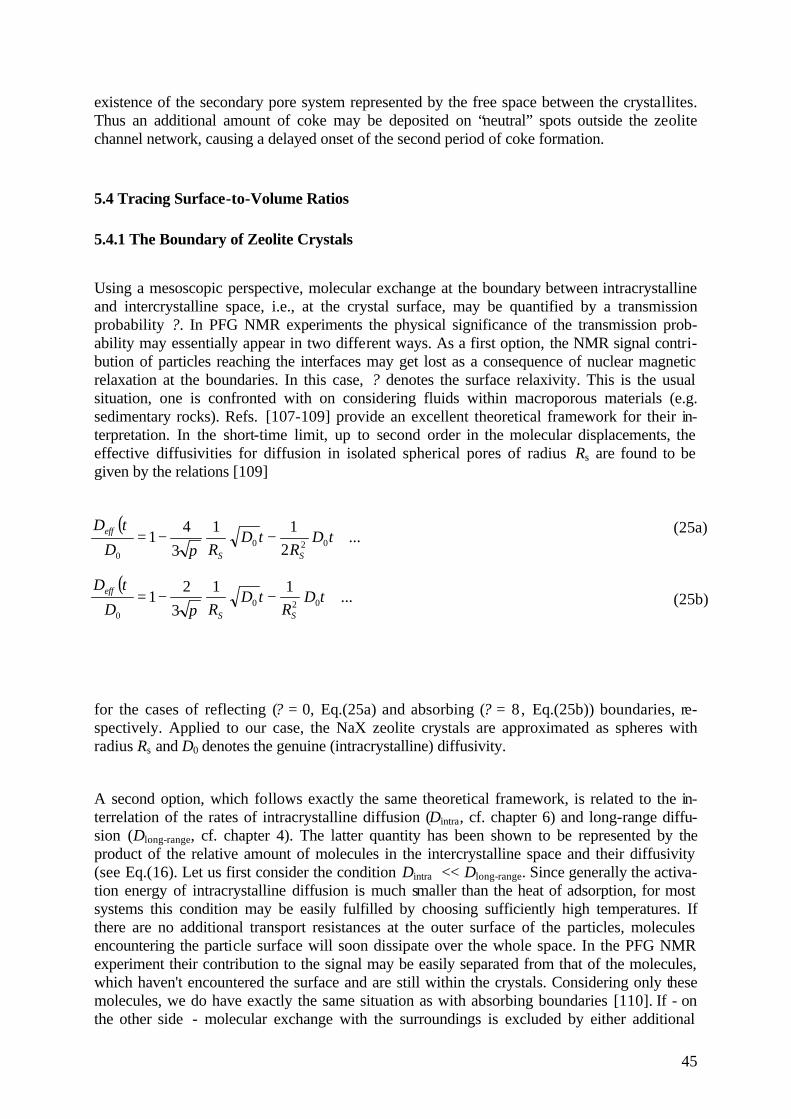
45
existence of the secondary pore system represented by the free space between the crystallites. Thus an additional amount of coke may be deposited on “neutral” spots outside the zeolite channel network, causing a delayed onset of the second period of coke formation.
5.4 Tracing Surface-to-Volume Ratios
5.4.1 The Boundary of Zeolite Crystals
Using a mesoscopic perspective, molecular exchange at the boundary between intracrystalline and intercrystalline space, i.e., at the crystal surface, may be quantified by a transmission probability ?. In PFG NMR experiments the physical significance of the transmission prob-ability may essentially appear in two different ways. As a first option, the NMR signal contri-bution of particles reaching the interfaces may get lost as a consequence of nuclear magnetic relaxation at the boundaries. In this case, ? denotes the surface relaxivity. This is the usual situation, one is confronted with on considering fluids within macroporous materials (e.g. sedimentary rocks). Refs. [107-109] provide an excellent theoretical framework for their in-terpretation. In the short-time limit, up to second order in the molecular displacements, the effective diffusivities for diffusion in isolated spherical pores of radius Rs are found to be given by the relations [109]
for the cases of reflecting (? = 0, Eq.(25a) and absorbing (? = 8 , Eq.(25b)) boundaries, re-spectively. Applied to our case, the NaX zeolite crystals are approximated as spheres with radius Rs and D0 denotes the genuine (intracrystalline) diffusivity.
A second option, which follows exactly the same theoretical framework, is related to the in-terrelation of the rates of intracrystalline diffusion (Dintra, cf. chapter 6) and long-range diffu-sion (Dlong-range, cf. chapter 4). The latter quantity has been shown to be represented by the product of the relative amount of molecules in the intercrystalline space and their diffusivity (see Eq.(16). Let us first consider the condition Dintra << Dlong-range. Since generally the activa-tion energy of intracrystalline diffusion is much smaller than the heat of adsorption, for most systems this condition may be easily fulfilled by choosing sufficiently high temperatures. If there are no additional transport resistances at the outer surface of the particles, molecules encountering the particle surface will soon dissipate over the whole space. In the PFG NMR experiment their contribution to the signal may be easily separated from that of the molecules, which haven't encountered the surface and are still within the crystals. Considering only these molecules, we do have exactly the same situation as with absorbing boundaries [110]. If - on the other side - molecular exchange with the surroundings is excluded by either additional
( )...
211
34
1 0200
+−−= tDR
tDRD
tD
SS
eff
π
( )...
113
21 020
0
+−−= tDR
tDRD
tD
SS
eff
π
(25a)
(25b)
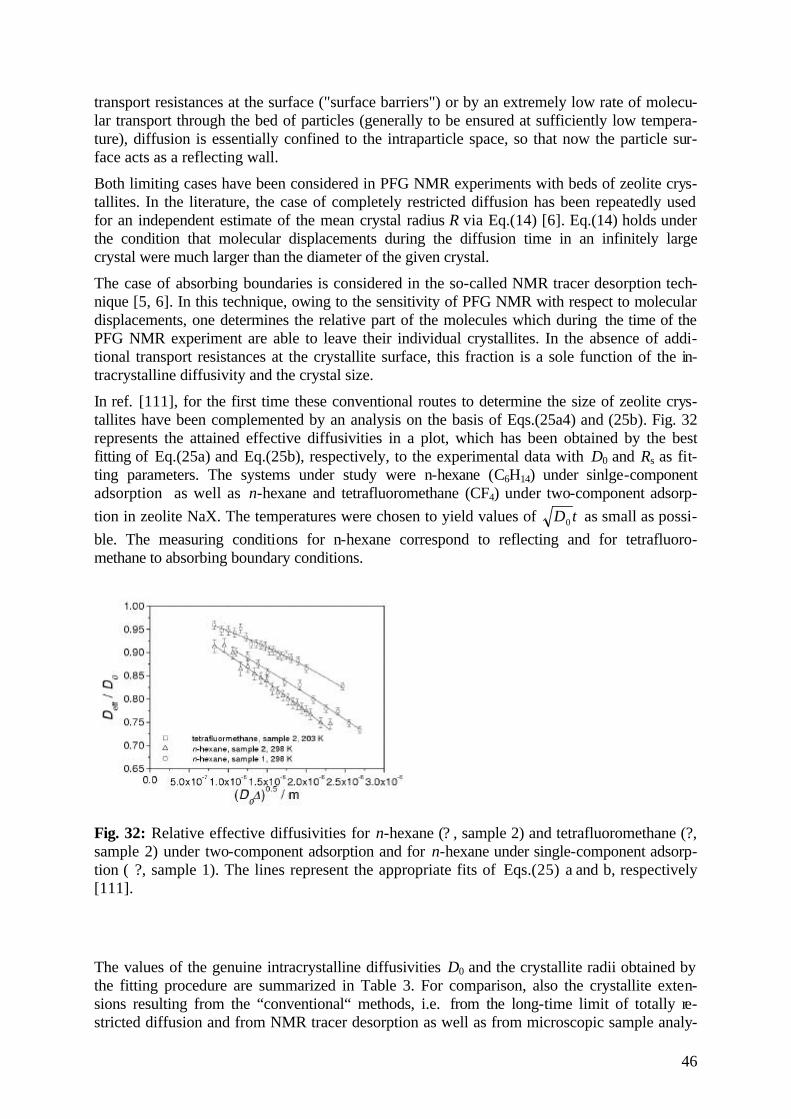
46
transport resistances at the surface ("surface barriers") or by an extremely low rate of molecu-lar transport through the bed of particles (generally to be ensured at sufficiently low tempera-ture), diffusion is essentially confined to the intraparticle space, so that now the particle sur-face acts as a reflecting wall.
Both limiting cases have been considered in PFG NMR experiments with beds of zeolite crys-tallites. In the literature, the case of completely restricted diffusion has been repeatedly used for an independent estimate of the mean crystal radius R via Eq.(14) [6]. Eq.(14) holds under the condition that molecular displacements during the diffusion time in an infinitely large crystal were much larger than the diameter of the given crystal.
The case of absorbing boundaries is considered in the so-called NMR tracer desorption tech-nique [5, 6]. In this technique, owing to the sensitivity of PFG NMR with respect to molecular displacements, one determines the relative part of the molecules which during the time of the PFG NMR experiment are able to leave their individual crystallites. In the absence of addi-tional transport resistances at the crystallite surface, this fraction is a sole function of the in-tracrystalline diffusivity and the crystal size.
In ref. [111], for the first time these conventional routes to determine the size of zeolite crys-tallites have been complemented by an analysis on the basis of Eqs.(25a4) and (25b). Fig. 32 represents the attained effective diffusivities in a plot, which has been obtained by the best fitting of Eq.(25a) and Eq.(25b), respectively, to the experimental data with D0 and Rs as fit-ting parameters. The systems under study were n-hexane (C6H14) under sinlge-component adsorption as well as n-hexane and tetrafluoromethane (CF4) under two-component adsorp-tion in zeolite NaX. The temperatures were chosen to yield values of tD0 as small as possi-ble. The measuring conditions for n-hexane correspond to reflecting and for tetrafluoro-methane to absorbing boundary conditions.
Fig. 32: Relative effective diffusivities for n-hexane (? , sample 2) and tetrafluoromethane (?, sample 2) under two-component adsorption and for n-hexane under single-component adsorp-tion ( ?, sample 1). The lines represent the appropriate fits of Eqs.(25) a and b, respectively [111].
The values of the genuine intracrystalline diffusivities D0 and the crystallite radii obtained by the fitting procedure are summarized in Table 3. For comparison, also the crystallite exten-sions resulting from the “conventional“ methods, i.e. from the long-time limit of totally re-stricted diffusion and from NMR tracer desorption as well as from microscopic sample analy-

47
sis are given. In these studies, for the first time the influence of the finite size of the zeolite crystallites has been simultaneously considered for one and the same sample (i) in the long-time limit of completely restricted diffusion, (ii) by NMR tracer exchange and (iii) in the short-time limit of diffusion. It is remarkable that all these mutually independent techniques lead to satisfactorily agreeing data on the crystal size. Note that this good agreement has been only obtained by considering the second-order terms as given in Eqs.(25) a and b instead of confining to the first-order approach.
So far, the measurements have been carried out under the limiting conditions of either reflect-ing or absorbing boundaries, for which analytical expressions are readily available. The con-sideration of the intermediate case shall be a challenging task of future investigations both with respect to the experimental procedure and the theoretical analysis.
Table 3: Values of the genuine intracrystalline diffusivities D0 and the crystallite radii Rs ob-tained by fitting the relative effective diffusivities plotted in Fig. 32 with the models presented by Eqs. (25) a and b. For comparison, the averaged radii ⟨Rc⟩ obtained from NMR tracer desorption, from the long-time limit of restricted diffusion (Eq. 14) and from analysis of the size distribution measured with optical microscopy are also included [111].
loading and temperature method D0 / m2s-1 Rs / µm cR / µm
2 n-C6H14 / cav., 298 K Eq. (25a) 3.53 × 10⁻¹⁰ 9.1
1 n-C6H14 / cav., 298 K Eq. (25a) 5.54 × 10⁻¹⁰ 7.8
1 CF4 / cav., 203 K Eq. (25b) 4.17 × 10⁻¹⁰ 9.1
1 CF4 / cav., 203 K tracer desorption 10.8
1 n-C6H14 / cav., 298 K Eq. (14) 11.9
unloaded zeolites opt. microscopy 10.5-10.9
5.4.2 The Fractal Geometry of Sand Grains
Using the PFG NMR approach to measure surface-to-volume ratios described in section 5.4.1, the surface properties of unconsolidated sediments were investigated in more detail. Fig. 33a displays the effective diffusivities of water in the four different grain size fractions of this quartz sand (shown in Fig. 33b) [112, 113].

48
a b
Fig. 33: (a)Effective self-diffusion coefficients D(?)/D0 as a function of (D0 ? )0.5 for water in the four grain size fractions of the unconsolidated quartz sand (b). The solid lines represent the results of the fits of Eq.(25a) (with first order terms only) to the early time dependence of these data [112]
Via Eq.(25a), the distinct increase in the initial slopes of the D(?)/D0 representations with decreasing grain diameters may easily be attributed to the corresponding increase in the sur-face-to-volume ratio. With the known grain density and porosity, these surface-to-volume ratios may be transferred into the specific surface areas (Sm = S / mg, surface area per mass of the grains mg). Their representation in Fig. 34 versus the averaged diameters (dg) of the grain size fractions reveals an interesting feature of these natural sand grains: Their specific surface area decreases less than linearly with increasing averaged grain diameter [112, 113].
Fig. 34: Specific surface areas Sm as function of the averaged grain diameters dg of the grain size fractions (?) and the original sand (*). The full and dotted lines represent the logSm -vs.- log dg fit and its confidence interval (slope -0.80 ± 0.05), respectively. The horizontal error bars show the width of the screen intervals used for sieving analysis [112].
Following the concept of Avnir et al. [114], who proposed an approach to determine the fractal dimension (Ds) of the surface area of granulated porous media by analyzing the scaling behaviour of the measured specific surface in dependence on the grain diameter [112, 114]
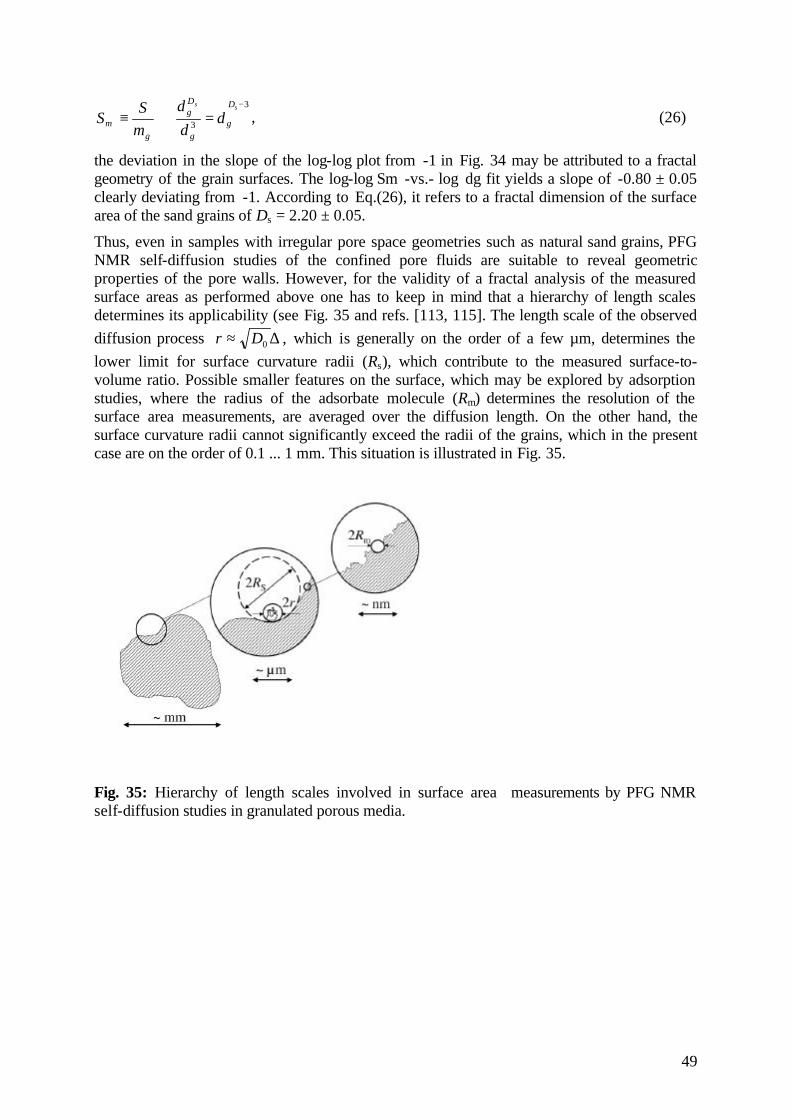
49
3
3
−
=∝≡ss D
gg
Dg
gm d
dd
mS
S , (26)
the deviation in the slope of the log-log plot from -1 in Fig. 34 may be attributed to a fractal geometry of the grain surfaces. The log-log Sm -vs.- log dg fit yields a slope of -0.80 ± 0.05 clearly deviating from -1. According to Eq.(26), it refers to a fractal dimension of the surface area of the sand grains of Ds = 2.20 ± 0.05.
Thus, even in samples with irregular pore space geometries such as natural sand grains, PFG NMR self-diffusion studies of the confined pore fluids are suitable to reveal geometric properties of the pore walls. However, for the validity of a fractal analysis of the measured surface areas as performed above one has to keep in mind that a hierarchy of length scales determines its applicability (see Fig. 35 and refs. [113, 115]. The length scale of the observed diffusion process ∆≈ 0Dr , which is generally on the order of a few µm, determines the lower limit for surface curvature radii (Rs), which contribute to the measured surface-to-volume ratio. Possible smaller features on the surface, which may be explored by adsorption studies, where the radius of the adsorbate molecule (Rm) determines the resolution of the surface area measurements, are averaged over the diffusion length. On the other hand, the surface curvature radii cannot significantly exceed the radii of the grains, which in the present case are on the order of 0.1 ... 1 mm. This situation is illustrated in Fig. 35.
Fig. 35: Hierarchy of length scales involved in surface area measurements by PFG NMR self-diffusion studies in granulated porous media.

50
6. Diffusion under Microscopic Confinement
6.1. Intracrystalline Zeolitic Diffusion
6.1.1 The Different Patterns of Concentration Dependence
The interrelation between the different features of intracrystalline zeolitic diffusion shall be discussed in some more detail in section 6.1.5. They all can be based on Fick's first law (eqs. (35) and (39)), i.e. on the proportionality between concentration gradients and the evolving fkuxes with the diffusion coefficients ("diffusivities") as the corresponding factors of propor-tionality. Fick’s law does not imply any requirement on the dependence of the respective dif-fusivities on the concentration of the diffusants. It is only required that the flux density in-creases linearly with the concentration gradient, since otherwise the diffusivity would have to become also a function of the concentration gradient. This possibility may be definitely ex-cluded for self-diffusion, where the labelling procedure (and hence the existence of gradients in the concentration of the diffusants, i.e. the labelled molecules) is postulated to be of no in-fluence on molecular dynamics.
Fig. 36: The different patterns of concentration dependence of the self-diffusivities observed by PFG NMR. From Keil et al. [116] based on experimental data from Kärger and Pfeifer [52]
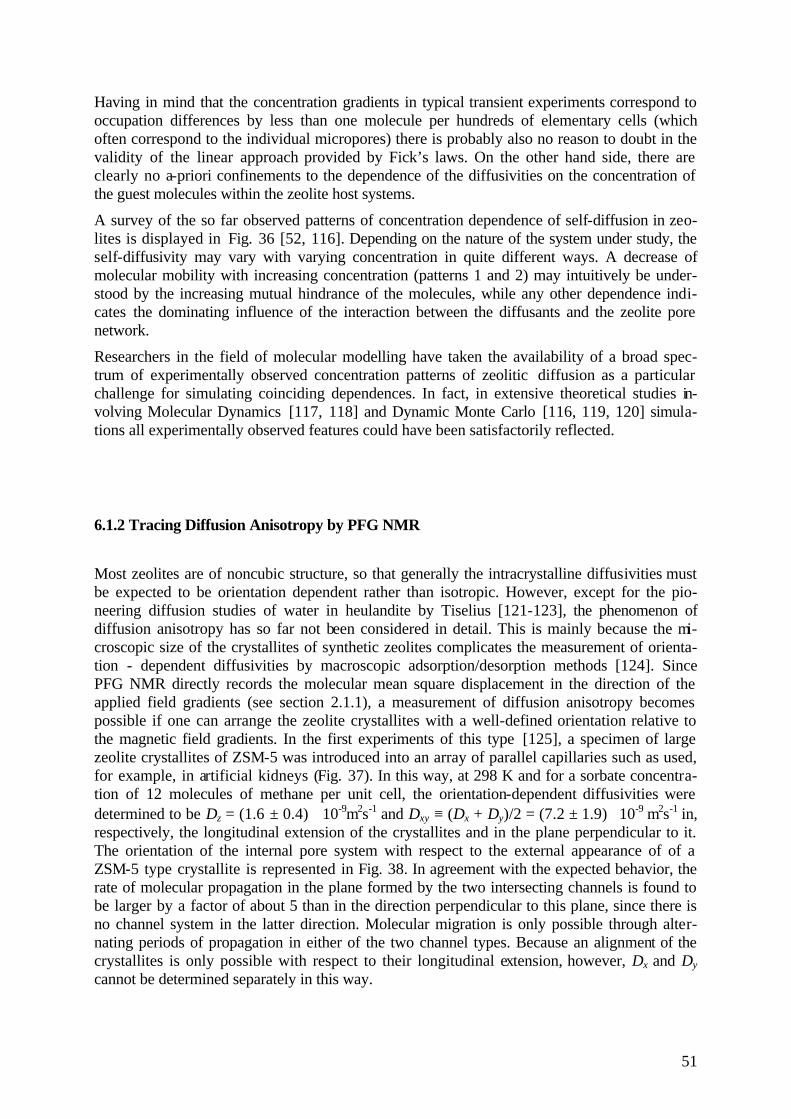
51
Having in mind that the concentration gradients in typical transient experiments correspond to occupation differences by less than one molecule per hundreds of elementary cells (which often correspond to the individual micropores) there is probably also no reason to doubt in the validity of the linear approach provided by Fick’s laws. On the other hand side, there are clearly no a-priori confinements to the dependence of the diffusivities on the concentration of the guest molecules within the zeolite host systems.
A survey of the so far observed patterns of concentration dependence of self-diffusion in zeo-lites is displayed in Fig. 36 [52, 116]. Depending on the nature of the system under study, the self-diffusivity may vary with varying concentration in quite different ways. A decrease of molecular mobility with increasing concentration (patterns 1 and 2) may intuitively be under-stood by the increasing mutual hindrance of the molecules, while any other dependence indi-cates the dominating influence of the interaction between the diffusants and the zeolite pore network.
Researchers in the field of molecular modelling have taken the availability of a broad spec-trum of experimentally observed concentration patterns of zeolitic diffusion as a particular challenge for simulating coinciding dependences. In fact, in extensive theoretical studies in-volving Molecular Dynamics [117, 118] and Dynamic Monte Carlo [116, 119, 120] simula-tions all experimentally observed features could have been satisfactorily reflected.
6.1.2 Tracing Diffusion Anisotropy by PFG NMR
Most zeolites are of noncubic structure, so that generally the intracrystalline diffusivities must be expected to be orientation dependent rather than isotropic. However, except for the pio-neering diffusion studies of water in heulandite by Tiselius [121-123], the phenomenon of diffusion anisotropy has so far not been considered in detail. This is mainly because the mi-croscopic size of the crystallites of synthetic zeolites complicates the measurement of orienta-tion - dependent diffusivities by macroscopic adsorption/desorption methods [124]. Since PFG NMR directly records the molecular mean square displacement in the direction of the applied field gradients (see section 2.1.1), a measurement of diffusion anisotropy becomes possible if one can arrange the zeolite crystallites with a well-defined orientation relative to the magnetic field gradients. In the first experiments of this type [125], a specimen of large zeolite crystallites of ZSM-5 was introduced into an array of parallel capillaries such as used, for example, in artificial kidneys (Fig. 37). In this way, at 298 K and for a sorbate concentra-tion of 12 molecules of methane per unit cell, the orientation-dependent diffusivities were determined to be Dz = (1.6 ± 0.4) ⋅ 10-9m2s-1 and Dxy ≡ (Dx + Dy)/2 = (7.2 ± 1.9) ⋅ 10-9 m2s-1 in, respectively, the longitudinal extension of the crystallites and in the plane perpendicular to it. The orientation of the internal pore system with respect to the external appearance of of a ZSM-5 type crystallite is represented in Fig. 38. In agreement with the expected behavior, the rate of molecular propagation in the plane formed by the two intersecting channels is found to be larger by a factor of about 5 than in the direction perpendicular to this plane, since there is no channel system in the latter direction. Molecular migration is only possible through alter-nating periods of propagation in either of the two channel types. Because an alignment of the crystallites is only possible with respect to their longitudinal extension, however, Dx and Dy cannot be determined separately in this way.
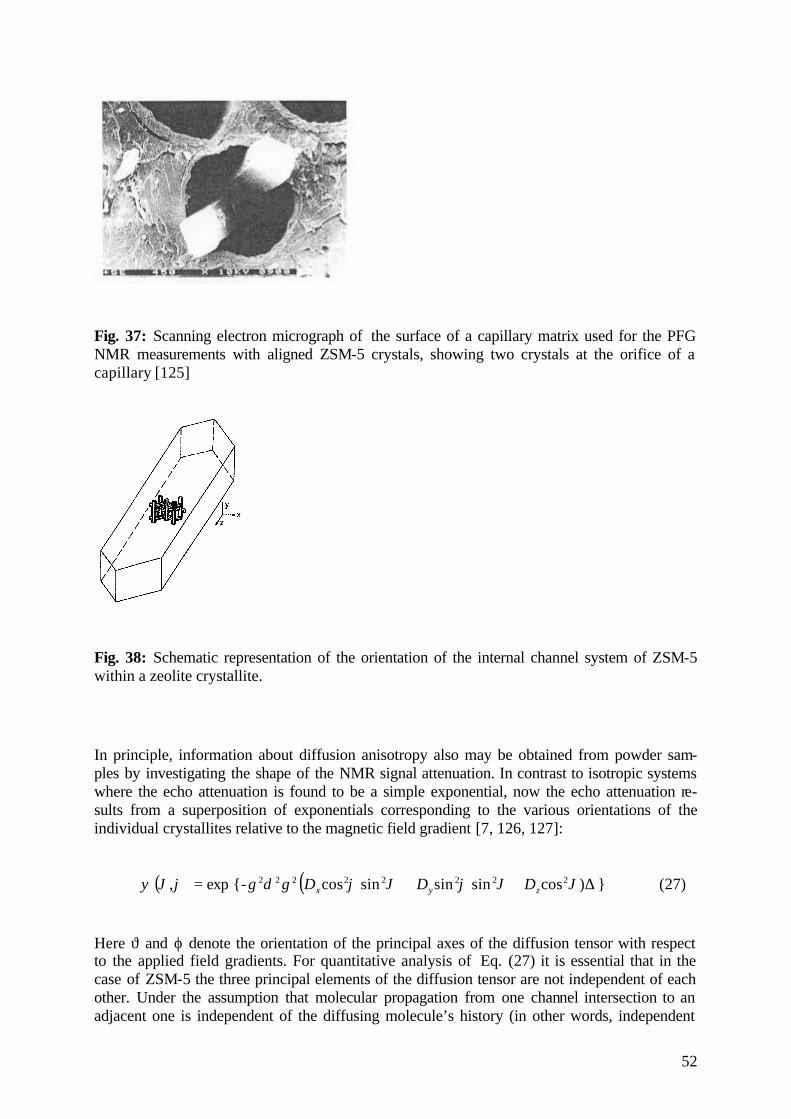
52
Fig. 37: Scanning electron micrograph of the surface of a capillary matrix used for the PFG NMR measurements with aligned ZSM-5 crystals, showing two crystals at the orifice of a capillary [125]
Fig. 38: Schematic representation of the orientation of the internal channel system of ZSM-5 within a zeolite crystallite.
In principle, information about diffusion anisotropy also may be obtained from powder sam-ples by investigating the shape of the NMR signal attenuation. In contrast to isotropic systems where the echo attenuation is found to be a simple exponential, now the echo attenuation re-sults from a superposition of exponentials corresponding to the various orientations of the individual crystallites relative to the magnetic field gradient [7, 126, 127]:
( ) exp, =ϕϑψ {- ( ) ∆++ )cossinsinsincos 22222222 ϑϑϕϑϕδγ zyx DDDg } (27)
Here ϑ and ϕ denote the orientation of the principal axes of the diffusion tensor with respect to the applied field gradients. For quantitative analysis of Eq. (27) it is essential that in the case of ZSM-5 the three principal elements of the diffusion tensor are not independent of each other. Under the assumption that molecular propagation from one channel intersection to an adjacent one is independent of the diffusing molecule’s history (in other words, independent
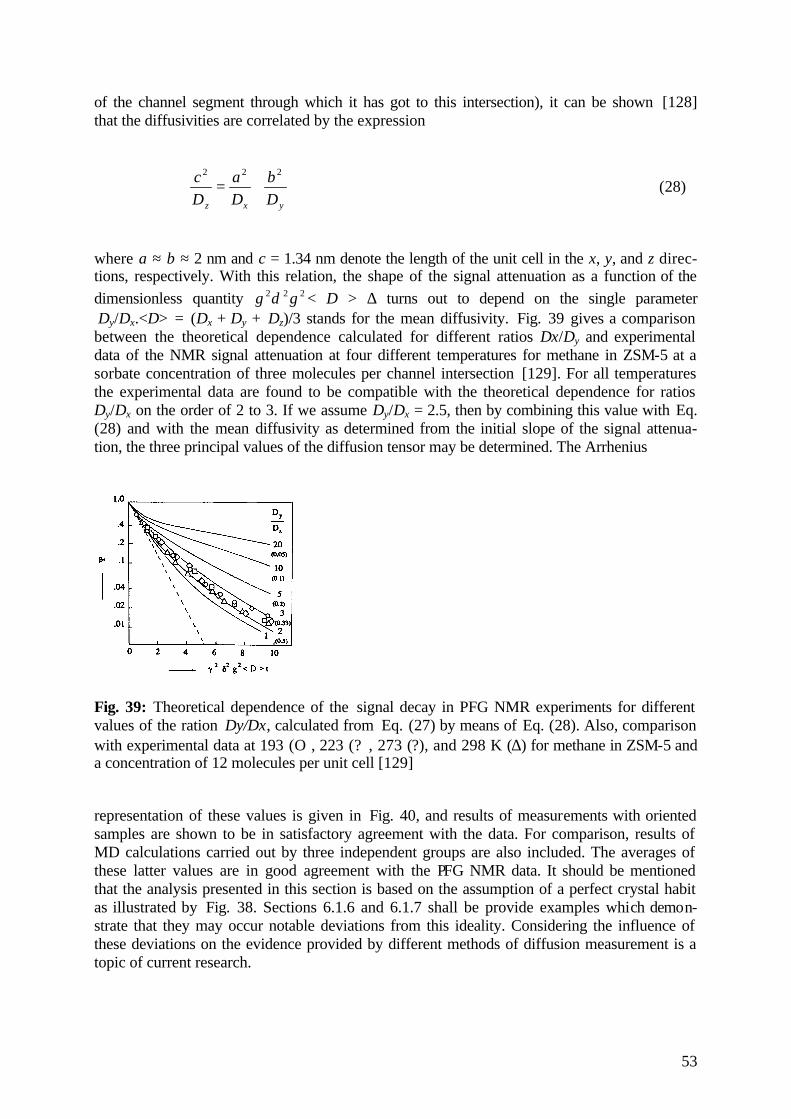
53
of the channel segment through which it has got to this intersection), it can be shown [128] that the diffusivities are correlated by the expression
yxz D
bDa
Dc 222
+= (28)
where a ≈ b ≈ 2 nm and c = 1.34 nm denote the length of the unit cell in the x, y, and z direc-tions, respectively. With this relation, the shape of the signal attenuation as a function of the dimensionless quantity 222 gδγ < D > ∆ turns out to depend on the single parameter Dy/Dx.<D> = (Dx + Dy + Dz)/3 stands for the mean diffusivity. Fig. 39 gives a comparison between the theoretical dependence calculated for different ratios Dx/Dy and experimental data of the NMR signal attenuation at four different temperatures for methane in ZSM-5 at a sorbate concentration of three molecules per channel intersection [129]. For all temperatures the experimental data are found to be compatible with the theoretical dependence for ratios Dy/Dx on the order of 2 to 3. If we assume Dy/Dx = 2.5, then by combining this value with Eq. (28) and with the mean diffusivity as determined from the initial slope of the signal attenua-tion, the three principal values of the diffusion tensor may be determined. The Arrhenius
Fig. 39: Theoretical dependence of the signal decay in PFG NMR experiments for different values of the ration Dy/Dx, calculated from Eq. (27) by means of Eq. (28). Also, comparison with experimental data at 193 (Ο), 223 (? ), 273 (?), and 298 K (∆) for methane in ZSM-5 and a concentration of 12 molecules per unit cell [129]
representation of these values is given in Fig. 40, and results of measurements with oriented samples are shown to be in satisfactory agreement with the data. For comparison, results of MD calculations carried out by three independent groups are also included. The averages of these latter values are in good agreement with the PFG NMR data. It should be mentioned that the analysis presented in this section is based on the assumption of a perfect crystal habit as illustrated by Fig. 38. Sections 6.1.6 and 6.1.7 shall be provide examples which demon-strate that they may occur notable deviations from this ideality. Considering the influence of these deviations on the evidence provided by different methods of diffusion measurement is a topic of current research.

54
Fig. 40: Principal values of the diffusion tensor for methane in ZSM-5 as determined on the basis of Fig. 39, plus comparison with results of measurement on oriented samples ((1), see Fig. 37) and MD simulations presented in Ref. 243 (2), Ref. 244 (3), and Ref. 255 (4) (open symbols with inserted numbers) (From Ref. 129)
6.1.3 Correlated Diffusion Anisotropy
The existence of a well-defined network of channels and/or pores gives rise to a peculiar fea-ture of diffusion in zeolites. Being subject to the confinement by the host systems, molecular displacements in different directions cannot occur independently from each other. As a con-sequence, one may also expect a correlation between the main elements of the diffusion ten-sor, characterizing diffusion anisotropy for zeolites deviating from a simple cubic structure. The schematic representation of the pore structure of the so-called zeolites of type MFI (with the zeolites ZSM-5 and silicalite-1 as their most important representatives) in Fig. 41 may be used to illustrate the given situation. The full lines represent the axes of the channels forming the intracrystalline pore system. It consists of straight channels in crystallographic y direction and of sinusoidal channels in x direction. There is no particular channel array along the crys-tallographic z axis. Molecular propagation in this direction has to proceed in alternating peri-ods of migration along the individual elements of both types of channels.
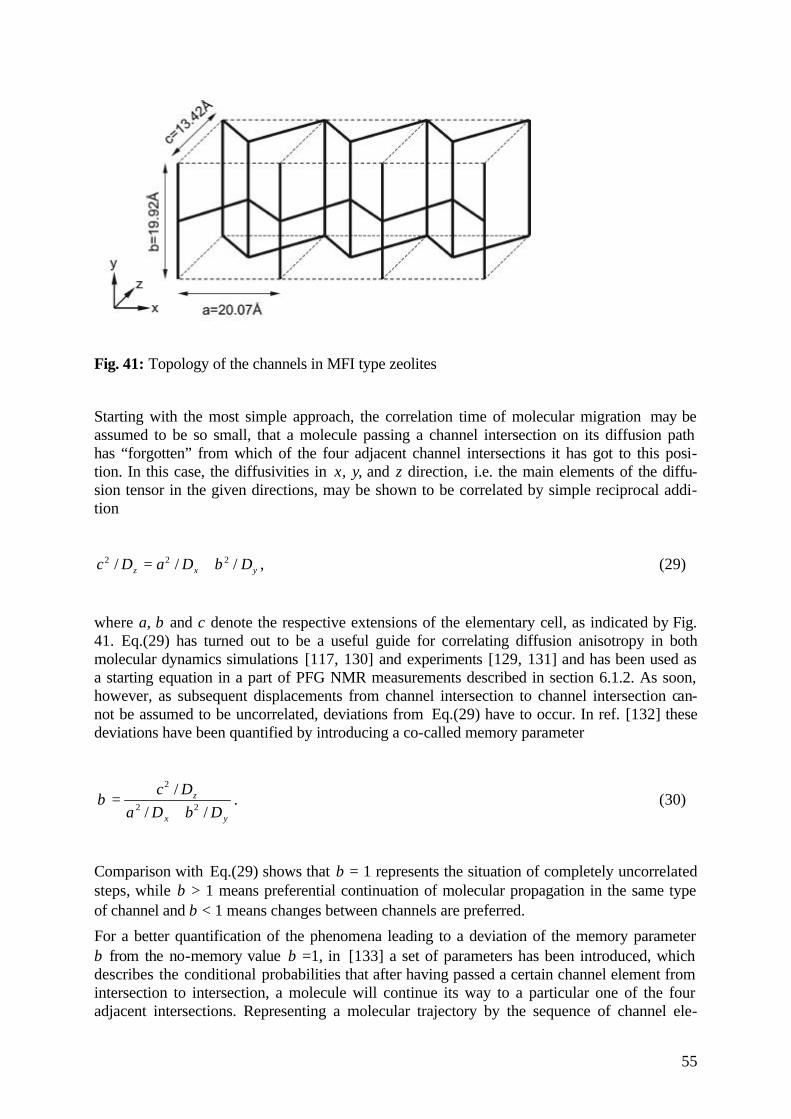
55
Fig. 41: Topology of the channels in MFI type zeolites
Starting with the most simple approach, the correlation time of molecular migration may be assumed to be so small, that a molecule passing a channel intersection on its diffusion path has “forgotten” from which of the four adjacent channel intersections it has got to this posi-tion. In this case, the diffusivities in x, y, and z direction, i.e. the main elements of the diffu-sion tensor in the given directions, may be shown to be correlated by simple reciprocal addi-tion
yxz DbDaDc /// 222 += , (29)
where a, b and c denote the respective extensions of the elementary cell, as indicated by Fig. 41. Eq.(29) has turned out to be a useful guide for correlating diffusion anisotropy in both molecular dynamics simulations [117, 130] and experiments [129, 131] and has been used as a starting equation in a part of PFG NMR measurements described in section 6.1.2. As soon, however, as subsequent displacements from channel intersection to channel intersection can-not be assumed to be uncorrelated, deviations from Eq.(29) have to occur. In ref. [132] these deviations have been quantified by introducing a co-called memory parameter
yx
z
DbDaDc
///
22
2
+=β . (30)
Comparison with Eq.(29) shows that β = 1 represents the situation of completely uncorrelated steps, while β > 1 means preferential continuation of molecular propagation in the same type of channel and β < 1 means changes between channels are preferred.
For a better quantification of the phenomena leading to a deviation of the memory parameter β from the no-memory value β =1, in [133] a set of parameters has been introduced, which describes the conditional probabilities that after having passed a certain channel element from intersection to intersection, a molecule will continue its way to a particular one of the four adjacent intersections. Representing a molecular trajectory by the sequence of channel ele-
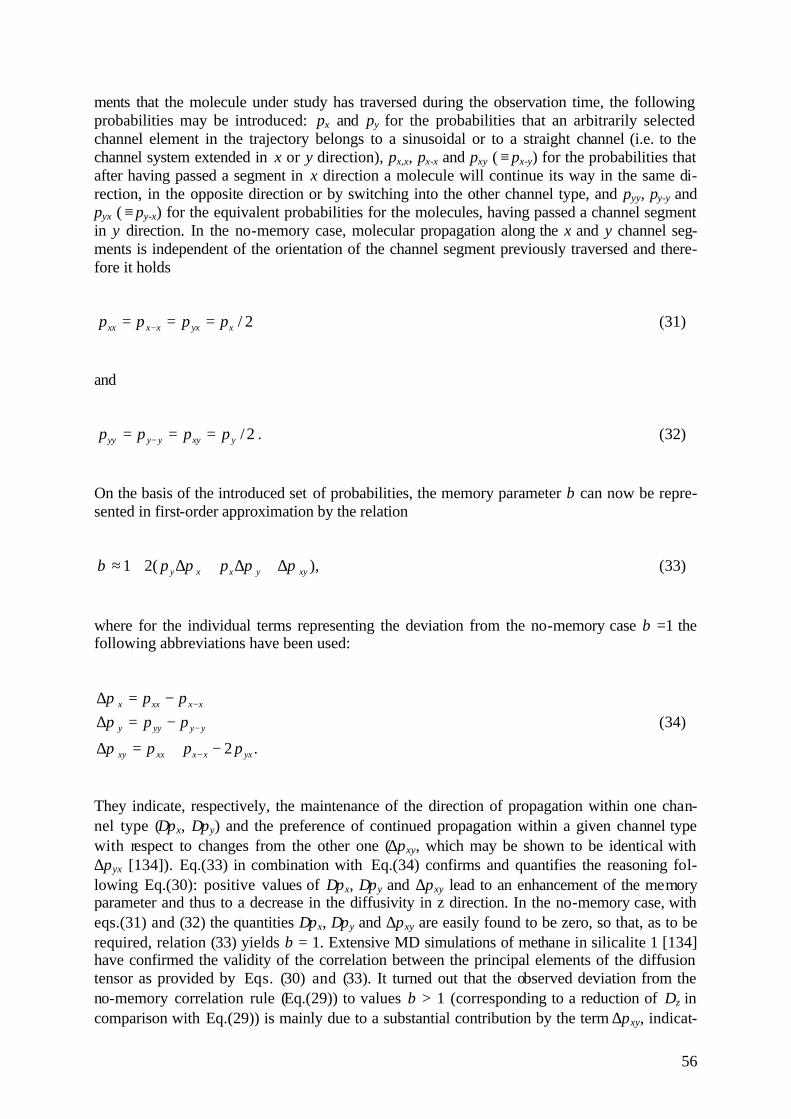
56
ments that the molecule under study has traversed during the observation time, the following probabilities may be introduced: px and py for the probabilities that an arbitrarily selected channel element in the trajectory belongs to a sinusoidal or to a straight channel (i.e. to the channel system extended in x or y direction), px,x, px-x and pxy ( ≡ px-y) for the probabilities that after having passed a segment in x direction a molecule will continue its way in the same di-rection, in the opposite direction or by switching into the other channel type, and pyy, py-y and pyx ( ≡ py-x) for the equivalent probabilities for the molecules, having passed a channel segment in y direction. In the no-memory case, molecular propagation along the x and y channel seg-ments is independent of the orientation of the channel segment previously traversed and there-fore it holds
2/xyxxxxx pppp === − (31)
and
2/yxyyyyy pppp === − . (32)
On the basis of the introduced set of probabilities, the memory parameter β can now be repre-sented in first-order approximation by the relation
),(21 xyyxxy pp πππβ ∆+∆+∆+≈ (33)
where for the individual terms representing the deviation from the no-memory case β =1 the following abbreviations have been used:
.2 yxxxxxxy
yyyyy
xxxxx
ppp
pppp
−+=∆
−=∆−=∆
−
−
−
π
ππ
(34)
They indicate, respectively, the maintenance of the direction of propagation within one chan-nel type (∆πx, ∆πy) and the preference of continued propagation within a given channel type with respect to changes from the other one (∆πxy, which may be shown to be identical with ∆πyx [134]). Eq.(33) in combination with Eq.(34) confirms and quantifies the reasoning fol-lowing Eq.(30): positive values of ∆πx, ∆πy and ∆πxy lead to an enhancement of the memory parameter and thus to a decrease in the diffusivity in z direction. In the no-memory case, with eqs.(31) and (32) the quantities ∆πx, ∆πy and ∆πxy are easily found to be zero, so that, as to be required, relation (33) yields β = 1. Extensive MD simulations of methane in silicalite 1 [134] have confirmed the validity of the correlation between the principal elements of the diffusion tensor as provided by Eqs. (30) and (33). It turned out that the observed deviation from the no-memory correlation rule (Eq.(29)) to values β > 1 (corresponding to a reduction of Dz in comparison with Eq.(29)) is mainly due to a substantial contribution by the term ∆πxy, indicat-

57
ing the tendency of the molecules to remain in one and the same channel type rather than to switch to the other. It is interesting to note that in refs. [135-137] the interpretation of both frequency response and ZLC diffusion measurements with rigid, extended molecules like 2-butyne and p-xylene in silicalite-1 could be satisfactorily interpreted by excluding essentially any significant molecular exchange between unlike channels, i.e. by assuming that pxy ≈ pyx ≈ 0.
The occurrence of correlated diffusion anisotropy is a phenomenon not restricted to zeolites of the considered MFI type. In fact, literature provides already both experimental and theo-retical studies of correlated diffusion anisotropy in zeolites of type silicalite-2 [138] and cha-bazite [139]. Moreover, interpreting features of diffusion anisotropy in non-cubic crystalline materials in terms of the presented formalism might quite generally be a worthwhile issue of future investigation in solid-state diffusion research [25].
6.1.4 Multicomponent Diffusion
In technical applications zeolite molecular sieves and catalysts are generally used under con-ditions of multicomponent diffusion. Selective diffusion measurements of the individual components are therefore of immediate practical relevance. In the conventional adsorp-tion/desorption method such measurements are complicated, however, by the requirement of maintaining well-defined initial and boundary conditions for any of the components involved. Being applied at equilibrium, such difficulties do not exist for PFG NMR. The traditional way to perform such experiments is to use deuterated compounds or compounds without hydro-gen, thereby leaving only one proton-containing component, which then yields the 1H NMR signal [58-60].
Fig. 42: Values for the self-diffusion coefficient of n-butane (?,? ) and butene-1 (?,¦ ) in zeo-lite NaX in dependence on the amount of co-adsorbed D2O (empty symbols) and ND3 (full symbols) at 293 K [140]

58
For example, Fig. 42 shows how the intracrystalline diffusivities of n-butane and butene-1 in zeolite NaX obtained in this way depend on the amount of co-adsorbed water molecules [140]. The decrease in the translational mobility by nearly three orders of magnitude may be explained by the formation of water-cation complexes [141, 142] in the windows between adjacent cavities. As expected, saturated and unsaturated hydrocarbons are subjected to this hindrance in a similar way, and so for sufficiently high water concentrations the diffusivities of butane and butene approach each other. As a second consequence of the formation of the water-cation complexes, the specific interaction between the cation and the double bonds of the unsaturated hydrocarbons must be expected to be reduced. This fact is evidently reflected by an increase in the diffusivities of butene at small water concentrations. Since the formation of the cation-water complexes may be easily understood as a consequence of the interaction between the cation and the electric dipole moment of the water molecules, a similar effect should be observed for other polar molecules. Fig. 42 demonstrates that this has indeed been found for co-adsorbed ammonia.
By applying deuterated hydrocarbons together with water or ammonia in the hydrogen-containing form, it is also possible to measure the mobility of water and ammonia. Fig. 43 shows how the diffusivities of these molecules depend on their concentration, with and with-out co-adsorbed hydrocarbons. It turns out that the diffusivities of both ammonia and water follow a type III concentration dependence, being nearly unaffected by the existence of addi-tional hydrocarbons (see Fig. 36, though it is the existence of the water molecules that leads to
Fig. 43: Concentration dependence of the self-diffusion coefficients of water (open symbols) and ammonia (filled symbols) without co-adsorbed hydrocarbons (? ,? ) and with 0.8 mole-cules per cavity of co-adsorbed n-butane - d10 (?,? ), and butene - d8 (? , 12% butene-1, 56% trans-butene-2, 32% cis-butene-2), respectively [143]
the low hydrocarbon diffusivities. This apparent contradiction may be explained, however, by realizing that obstruction of the windows might be brought about by only a small fraction of the water molecules, while the others are able to move much more freely than the larger hy-drocarbon molecules.
Fig. 44 compares the effect of co-adsorbed water molecules on the mobility of n-butane in zeolites NaX and NaCs (55%) X [140]. The diameter of the cesium ions (0.338 nm) is consid-erably larger than that of sodium (0.190 nm). What happens is that the cesium ions cause an effective obstruction of molecular propagation, leading to a decrease of the diffusivity by one
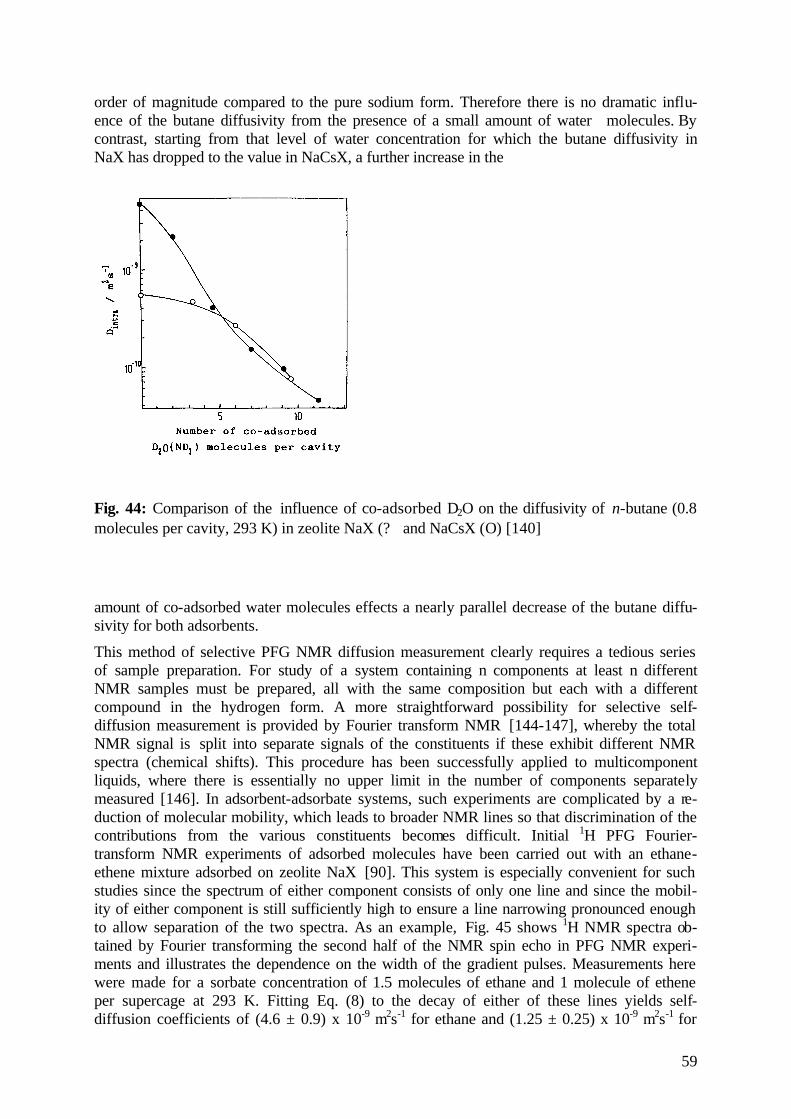
59
order of magnitude compared to the pure sodium form. Therefore there is no dramatic influ-ence of the butane diffusivity from the presence of a small amount of water molecules. By contrast, starting from that level of water concentration for which the butane diffusivity in NaX has dropped to the value in NaCsX, a further increase in the
Fig. 44: Comparison of the influence of co-adsorbed D2O on the diffusivity of n-butane (0.8 molecules per cavity, 293 K) in zeolite NaX (? ) and NaCsX (Ο) [140]
amount of co-adsorbed water molecules effects a nearly parallel decrease of the butane diffu-sivity for both adsorbents.
This method of selective PFG NMR diffusion measurement clearly requires a tedious series of sample preparation. For study of a system containing n components at least n different NMR samples must be prepared, all with the same composition but each with a different compound in the hydrogen form. A more straightforward possibility for selective self-diffusion measurement is provided by Fourier transform NMR [144-147], whereby the total NMR signal is split into separate signals of the constituents if these exhibit different NMR spectra (chemical shifts). This procedure has been successfully applied to multicomponent liquids, where there is essentially no upper limit in the number of components separately measured [146]. In adsorbent-adsorbate systems, such experiments are complicated by a re-duction of molecular mobility, which leads to broader NMR lines so that discrimination of the contributions from the various constituents becomes difficult. Initial 1H PFG Fourier-transform NMR experiments of adsorbed molecules have been carried out with an ethane-ethene mixture adsorbed on zeolite NaX [90]. This system is especially convenient for such studies since the spectrum of either component consists of only one line and since the mobil-ity of either component is still sufficiently high to ensure a line narrowing pronounced enough to allow separation of the two spectra. As an example, Fig. 45 shows 1H NMR spectra ob-tained by Fourier transforming the second half of the NMR spin echo in PFG NMR experi-ments and illustrates the dependence on the width of the gradient pulses. Measurements here were made for a sorbate concentration of 1.5 molecules of ethane and 1 molecule of ethene per supercage at 293 K. Fitting Eq. (8) to the decay of either of these lines yields self-diffusion coefficients of (4.6 ± 0.9) x 10-9 m2s-1 for ethane and (1.25 ± 0.25) x 10-9 m2s-1 for
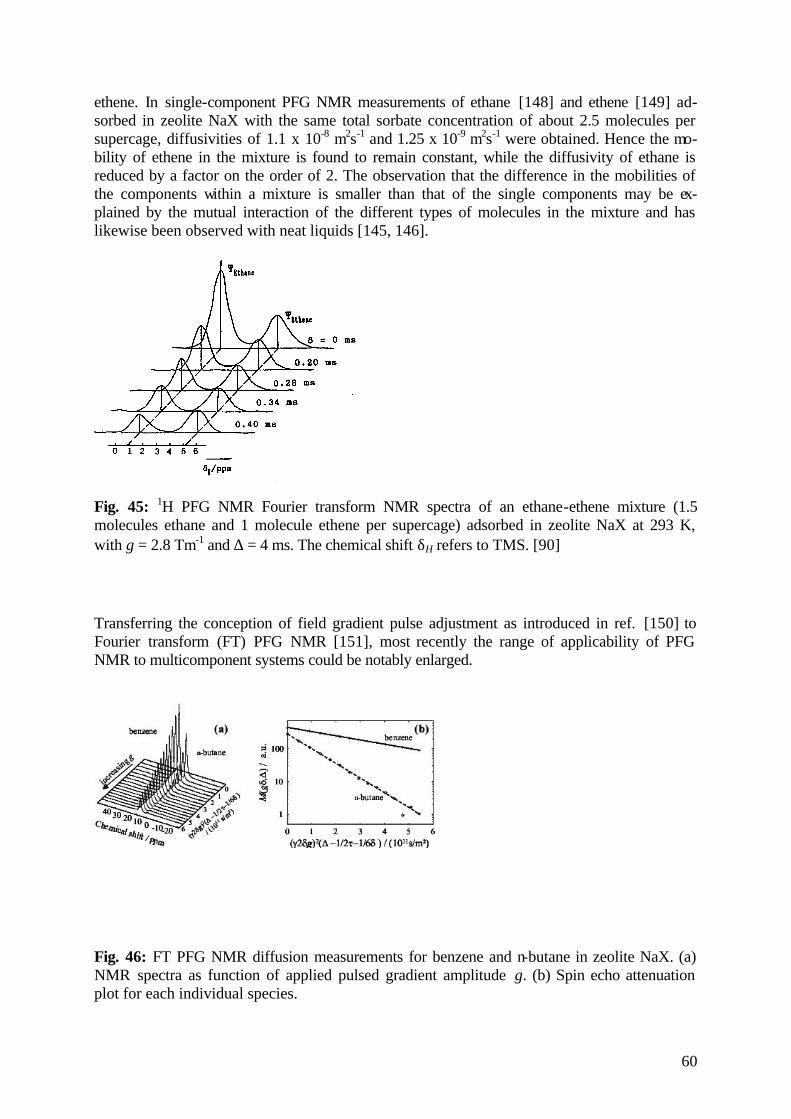
60
ethene. In single-component PFG NMR measurements of ethane [148] and ethene [149] ad-sorbed in zeolite NaX with the same total sorbate concentration of about 2.5 molecules per supercage, diffusivities of 1.1 x 10⁻⁸ m2s-1 and 1.25 x 10⁻⁹ m2s-1 were obtained. Hence the mo-bility of ethene in the mixture is found to remain constant, while the diffusivity of ethane is reduced by a factor on the order of 2. The observation that the difference in the mobilities of the components within a mixture is smaller than that of the single components may be ex-plained by the mutual interaction of the different types of molecules in the mixture and has likewise been observed with neat liquids [145, 146].
Fig. 45: 1H PFG NMR Fourier transform NMR spectra of an ethane-ethene mixture (1.5 molecules ethane and 1 molecule ethene per supercage) adsorbed in zeolite NaX at 293 K, with g = 2.8 Tm-1 and ∆ = 4 ms. The chemical shift δH refers to TMS. [90]
Transferring the conception of field gradient pulse adjustment as introduced in ref. [150] to Fourier transform (FT) PFG NMR [151], most recently the range of applicability of PFG NMR to multicomponent systems could be notably enlarged.
Fig. 46: FT PFG NMR diffusion measurements for benzene and n-butane in zeolite NaX. (a) NMR spectra as function of applied pulsed gradient amplitude g. (b) Spin echo attenuation plot for each individual species.

61
As an example, Fig. 46 displays the results of a PFG NMR study of the mixture diffusion of n-butane and benzene adsorbed in zeolite NaX. These spectra were measured using the 13-interval sequence (Fig. 4c) witch |gmax| =20 T/m, d = 500 µs, t = 1.5 ms and ? = 25 ms. From the intensity of the two lines in the NMR spectra in dependence on the applied pulsed field gradients (Fig. 46a), the attenuation plots of each of the two components (Fig. 46b) are easily found. Their slopes correspond to diffusion coefficients of (1.03 ± 0.04) ×10-11 m2/s and (2.94 ± 0.10) ×10-12 m2/s for n-butane and benzene, respectively.
FT PFG NMR diffusion studies are meanwhile well established with the described studies [9, 90, 152, 153]. What is really new is the quality in attaining low diffusivities on the basis of the instrumental improvements described in ref. [50]. In fact, as to our knowledge, such small diffusivities have so far not been observed by Fourier transform PFG NMR under comparable short gradient widths and observation times.
6.1.5 The Discrepancy between the Results of Different Measuring Techniques
In order to correlate the results of different techniques of diffusion measurement it is worth-while to start by recollecting the different conditions under which diffusion may be observed and, correspondingly, the “different” diffusivity definitions.
Diffusion is the process of molecular transport associated with the stochastic movement of the individual molecules. Fig. 47 illustrates 3 different situations of diffusion measurement. Any heterogeneity in the distribution of the molecules under study over the sample will give rise to molecular fluxes into the direction of decreasing concentration (Fig. 47a). Flux density and concentration gradient are related to each other by Fick’s first law
.dd
d zc
Djz −= (35)
Dd denotes the so-called transport diffusivity. The subscript d has been added to distinguish this quantity from the coefficient of self-diffusion (D) which is the main subject of this con-tribution. With the conservation equation
,zj
c z
∂∂
−=& (36)
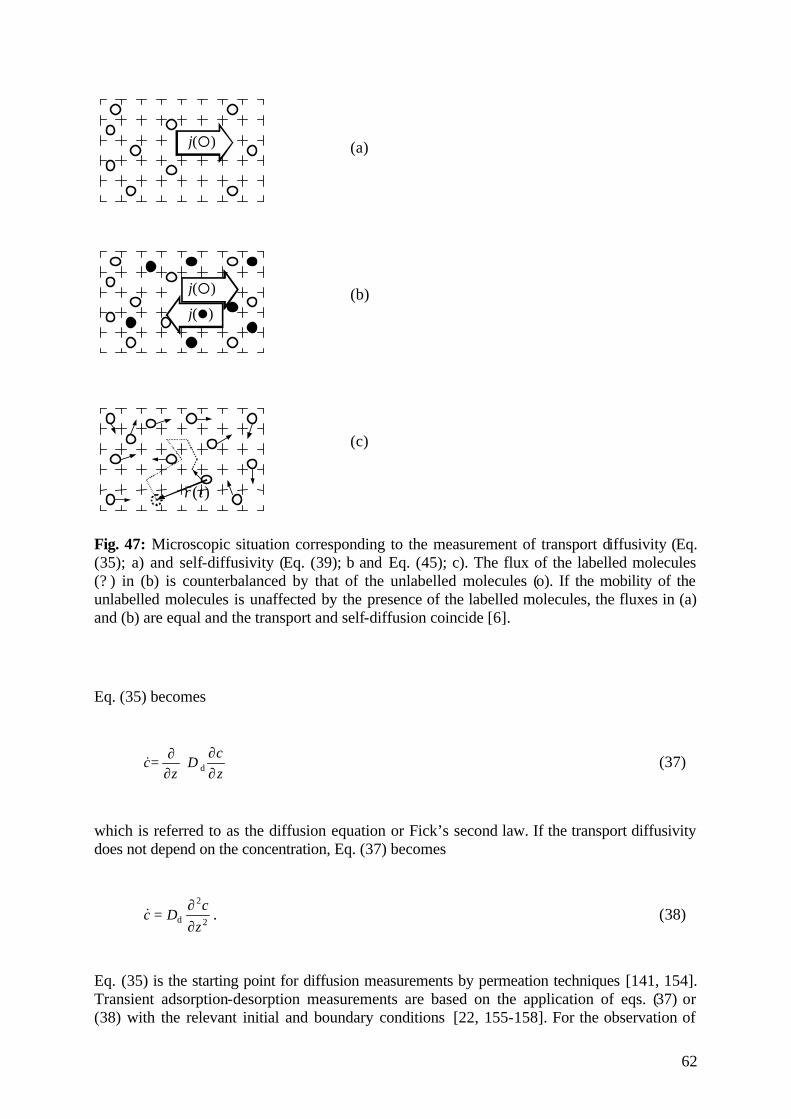
62
j(¡)
j(l)
j(¡)
)(trr
Fig. 47: Microscopic situation corresponding to the measurement of transport diffusivity (Eq. (35); a) and self-diffusivity (Eq. (39); b and Eq. (45); c). The flux of the labelled molecules (? ) in (b) is counterbalanced by that of the unlabelled molecules (o). If the mobility of the unlabelled molecules is unaffected by the presence of the labelled molecules, the fluxes in (a) and (b) are equal and the transport and self-diffusion coincide [6].
Eq. (35) becomes
∂∂
∂∂=
zc
Dz
c d& (37)
which is referred to as the diffusion equation or Fick’s second law. If the transport diffusivity does not depend on the concentration, Eq. (37) becomes
2
2
d zc
Dc∂∂
=& . (38)
Eq. (35) is the starting point for diffusion measurements by permeation techniques [141, 154]. Transient adsorption-desorption measurements are based on the application of eqs. (37) or (38) with the relevant initial and boundary conditions [22, 155-158]. For the observation of
(a) (b) (c)

63
the adsorption/desorption process a multitude of techniques including gravimetry, piezometry and, more recently, also spectroscopic methods like IR microscopy [159, 160] or 129Xe NMR [161, 162] may be applied.
Fig. 46b illustrates the situation of a tracer exchange experiment. It is assumed that the molecular species under study is available in two modifications (e.g. as different isotopes) which are identical with respect to their transport properties. Again, as in the case of transport diffusion, a relation of the type of Fick’s first equation combines the flux density and the con-centration gradient of either of these species. One has
j Ddcdzz
**
= − (39)
where c* refers to the concentration of the labelled (or unlabelled) species with the under-standing, that the flux of this species *
zj is exactly compensated by the flux of the other spe-cies so that the overall concentration, i.e. the sum of the concentrations of the two species, remains unchanged. D denotes the coefficient of tracer diffusion or self-diffusion. It depends exclusively on the overall concentration, and not on the concentration of the labelled (or unla-belled) molecules. Hence, Fick’s second law of tracer exchange may quite generally be writ-ten in the form of Eq. (38), viz.
2
2 **
zc
Dc∂
∂=& . (40)
Equation (40) is the basis of self-diffusion studies by tracer techniques [163, 164]. Equation (40) may be used to determine the probability that a molecule, initially at position 0 has migrated to position z after a time interval t. For this purpose one has to solve Eq. (40) with the initial condition ( ) ( )ztzc δ== 0,* (41) and with the boundary condition
( )c z t* , .= ± ∞ = 0 (42) δ (z) denotes Dirac’s delta function, which is equal to zero for any z ≠ 0, and whose integral
( )dzz∫∞
∞−δ is equal to one. By insertion into Eq. (40) one may easily see that the solution is a
Gaussian of the form
( ) ( ) ( )
−=≡ −
DtzDttzPtzc
4exp4,,*
2
21
π . (43)
P (z,t) contains the maximum information attainable about the stochastic process of molecular diffusion and has been termed propagator. The particular shape of the propagator as given by Eq. (43) results for molecular diffusion in an unconfined space as expressed by the boundary
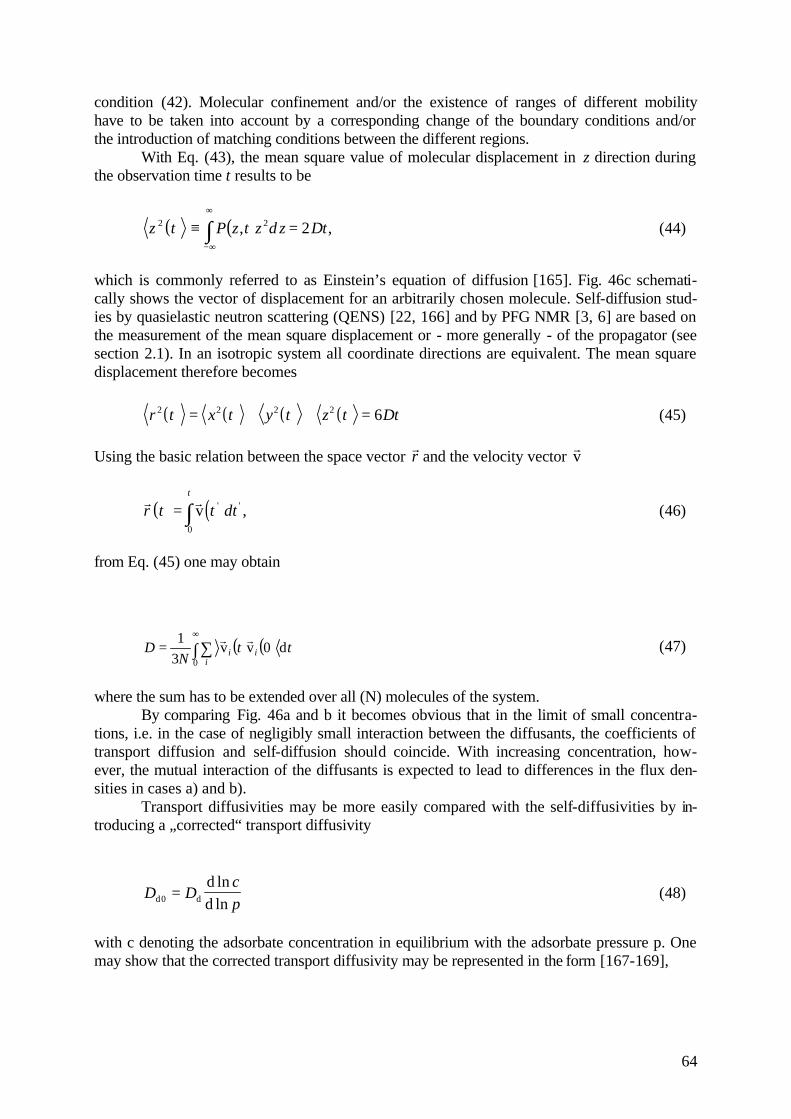
64
condition (42). Molecular confinement and/or the existence of ranges of different mobility have to be taken into account by a corresponding change of the boundary conditions and/or the introduction of matching conditions between the different regions. With Eq. (43), the mean square value of molecular displacement in z direction during the observation time t results to be
( ) ( )z t P z t z d z Dt2 2 2≡ =−∞
∞
∫ , , (44)
which is commonly referred to as Einstein’s equation of diffusion [165]. Fig. 46c schemati-cally shows the vector of displacement for an arbitrarily chosen molecule. Self-diffusion stud-ies by quasielastic neutron scattering (QENS) [22, 166] and by PFG NMR [3, 6] are based on the measurement of the mean square displacement or - more generally - of the propagator (see section 2.1). In an isotropic system all coordinate directions are equivalent. The mean square displacement therefore becomes
( ) ( ) ( ) ( )r t x t y t z t Dt2 2 2 2 6= + + = (45) Using the basic relation between the space vector
rr and the velocity vector
rv
( ) ( )r rr t t dt
t
= ∫ v ' ' ,0
(46)
from Eq. (45) one may obtain
( ) ( ) ttN
Di
ii d0vv31
0∫ ∑∞
=rr (47)
where the sum has to be extended over all (N) molecules of the system. By comparing Fig. 46a and b it becomes obvious that in the limit of small concentra-tions, i.e. in the case of negligibly small interaction between the diffusants, the coefficients of transport diffusion and self-diffusion should coincide. With increasing concentration, how-ever, the mutual interaction of the diffusants is expected to lead to differences in the flux den-sities in cases a) and b). Transport diffusivities may be more easily compared with the self-diffusivities by in-troducing a „corrected“ transport diffusivity
D Dcpd d
dd0 =
lnln
(48)
with c denoting the adsorbate concentration in equilibrium with the adsorbate pressure p. One may show that the corrected transport diffusivity may be represented in the form [167-169],

65
( ) ( ) ( ) ( )DN
t t t ti i i ji ji
d v v d v v d000
13
0 0= +
≠
∞∞
∑∫∑∫ r r r r . (49)
The first term on the right hand side of Eq. (49) coincides with the right hand side of Eq. (47), while the second term takes account of the correlation between the velocities of different molecules. If this correlation is negligibly small - as to be expected for sufficiently small concen-trations - the self-diffusivity therefore coincides with the corrected transport diffusivity. How-ever, also in the case of larger concentrations, the second term on the right hand side of Eq. (49) should still be smaller than the first one, so that quite generally the self-diffusivities and corrected transport diffusivities should be comparable with each other. It is one of the most intriguing problems of current zeolite research that there are a number of systems where this assumption is reasonably well fulfilled while for other systems large discrepancies between the self-diffusivities and the corrected transport diffusivities are observed [22, 155-157]. The proportionality between the mean square displacement and the observation time as expressed by eqs. (44) and (45) may be intuitively understood by considering the total dis-placement
rr as the vector sum of displacements
rrk during equal time intervals, which are
large enough so that the displacements in subsequent intervals are uncorrelated. In this case one has
r r rkk
kk
2
2
2=
=∑ ∑ (50)
since any cross term ( r rr rk l with k ≠ l), which otherwise also would occur on the right hand side of Eq. (50), becomes zero. For a given length of the time interval, the mean square dis-placement r2 is thus found to be proportional to the total number of time intervals consid-ered, i.e. to the total observation time. Molecular propagation which proceeds under such conditions is called normal diffusion. Only under such conditions, Fick’s laws as expressed by eqs. (39) and (40) are applicable. PFG NMR studies dealing with different aspects of nor-mal zeolitic diffusion are considered in chapters 4 and 6 of this review. One must have in mind, however, that molecular confinement generally leads to a correlation of subsequent displacements. Depending on the nature of the confinement, quite different patterns of devia-tion from normal diffusion, i.e. from the proportionality between the mean square displace-ment and the observation time, may be observed. Examples of phenomena of anomalous dif-fusion and of their investigation by PFG NMR have been presented in chapter 5. Thus, conceptually understanding diffusion in nanoporous materials is not only complicated by the various physical conditions under which the diffusion phenomena may appear. It is also complicated by the fact that both the spatial and temporal ranges over which diffusion phenomena are perceived by the different experimental techniques may dramatically vary. The representation of the various techniques applied to study molecular diffusion in nanopor-ous materials in table 4 follows the classification scheme, which is commonly used in the lit-erature [170]. It distinguishes between equilibrium and non-equilibrium techniques on the one-hand side, and between macroscopic, mesoscopic and microscopic on the other.
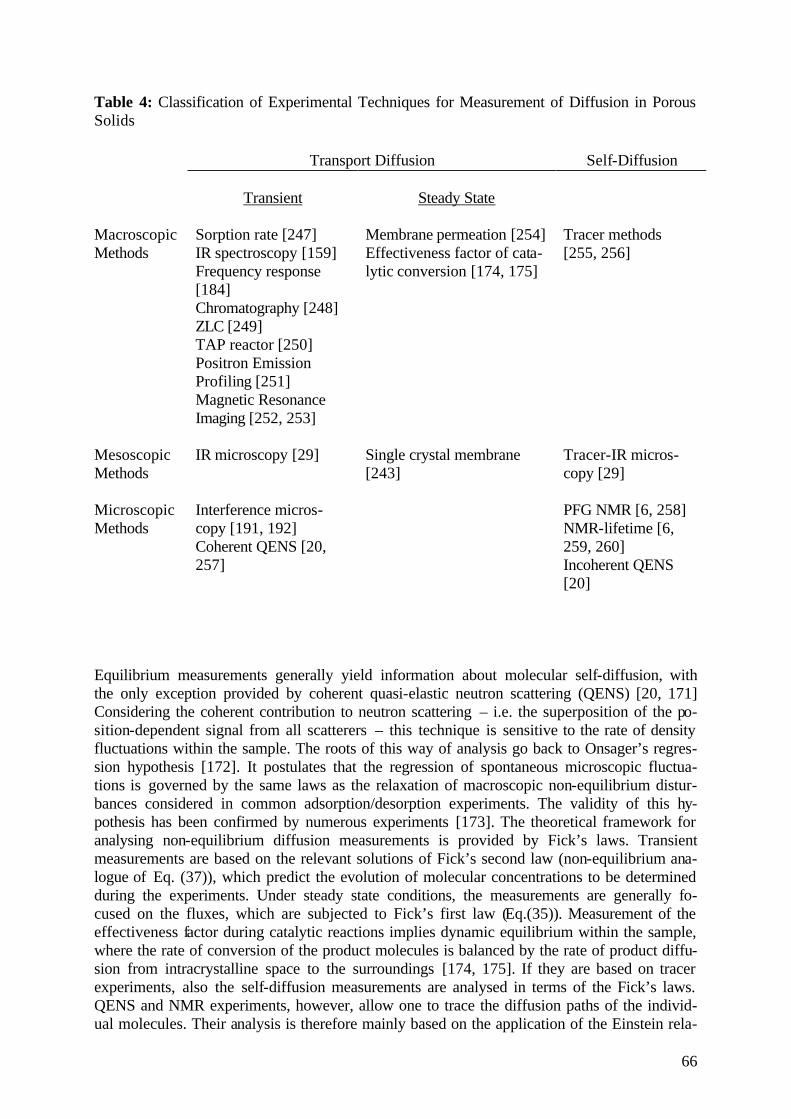
66
Table 4: Classification of Experimental Techniques for Measurement of Diffusion in Porous Solids
Transport Diffusion Self-Diffusion
Transient
Steady State
Macroscopic Methods
Sorption rate [247] IR spectroscopy [159] Frequency response [184] Chromatography [248] ZLC [249] TAP reactor [250] Positron Emission Profiling [251] Magnetic Resonance Imaging [252, 253]
Membrane permeation [254] Effectiveness factor of cata-lytic conversion [174, 175]
Tracer methods [255, 256]
Mesoscopic Methods
IR microscopy [29] Single crystal membrane [243]
Tracer-IR micros-copy [29]
Microscopic Methods
Interference micros-copy [191, 192] Coherent QENS [20, 257]
PFG NMR [6, 258] NMR-lifetime [6, 259, 260] Incoherent QENS [20]
Equilibrium measurements generally yield information about molecular self-diffusion, with the only exception provided by coherent quasi-elastic neutron scattering (QENS) [20, 171] Considering the coherent contribution to neutron scattering – i.e. the superposition of the po-sition-dependent signal from all scatterers – this technique is sensitive to the rate of density fluctuations within the sample. The roots of this way of analysis go back to Onsager’s regres-sion hypothesis [172]. It postulates that the regression of spontaneous microscopic fluctua-tions is governed by the same laws as the relaxation of macroscopic non-equilibrium distur-bances considered in common adsorption/desorption experiments. The validity of this hy-pothesis has been confirmed by numerous experiments [173]. The theoretical framework for analysing non-equilibrium diffusion measurements is provided by Fick’s laws. Transient measurements are based on the relevant solutions of Fick’s second law (non-equilibrium ana-logue of Eq. (37)), which predict the evolution of molecular concentrations to be determined during the experiments. Under steady state conditions, the measurements are generally fo-cused on the fluxes, which are subjected to Fick’s first law (Eq.(35)). Measurement of the effectiveness factor during catalytic reactions implies dynamic equilibrium within the sample, where the rate of conversion of the product molecules is balanced by the rate of product diffu-sion from intracrystalline space to the surroundings [174, 175]. If they are based on tracer experiments, also the self-diffusion measurements are analysed in terms of the Fick’s laws. QENS and NMR experiments, however, allow one to trace the diffusion paths of the individ-ual molecules. Their analysis is therefore mainly based on the application of the Einstein rela-
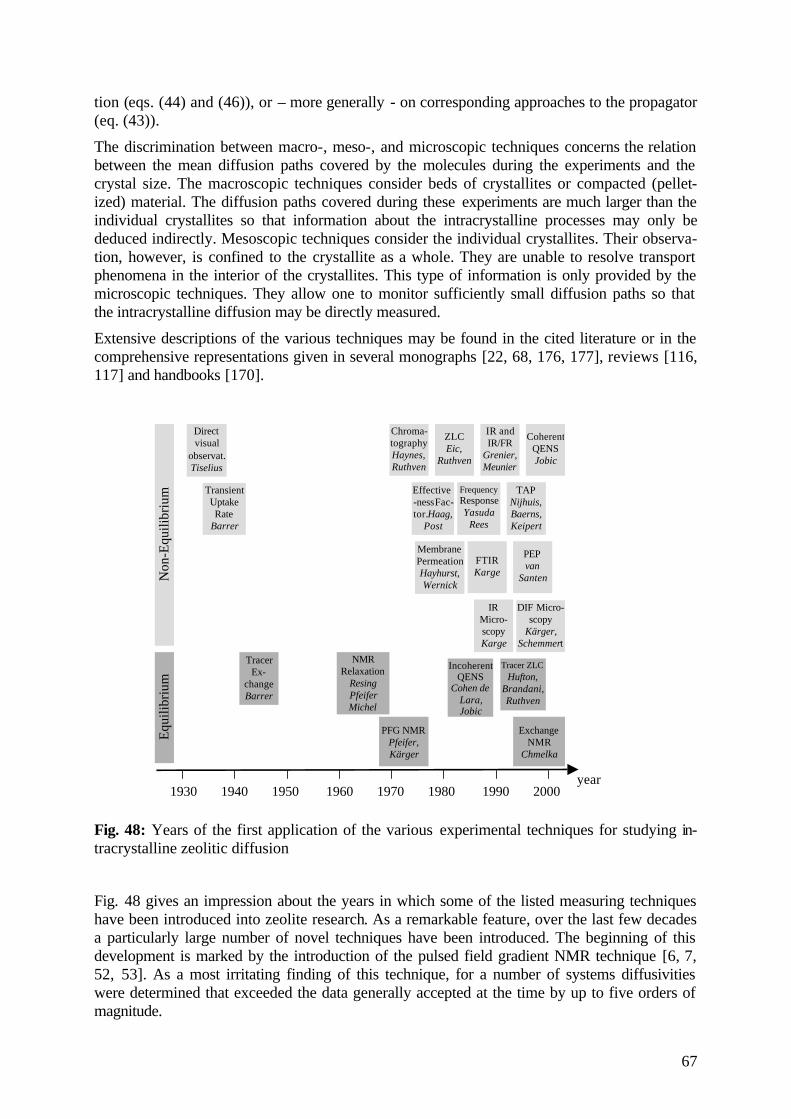
67
tion (eqs. (44) and (46)), or – more generally - on corresponding approaches to the propagator (eq. (43)).
The discrimination between macro-, meso-, and microscopic techniques concerns the relation between the mean diffusion paths covered by the molecules during the experiments and the crystal size. The macroscopic techniques consider beds of crystallites or compacted (pellet-ized) material. The diffusion paths covered during these experiments are much larger than the individual crystallites so that information about the intracrystalline processes may only be deduced indirectly. Mesoscopic techniques consider the individual crystallites. Their observa-tion, however, is confined to the crystallite as a whole. They are unable to resolve transport phenomena in the interior of the crystallites. This type of information is only provided by the microscopic techniques. They allow one to monitor sufficiently small diffusion paths so that the intracrystalline diffusion may be directly measured.
Extensive descriptions of the various techniques may be found in the cited literature or in the comprehensive representations given in several monographs [22, 68, 176, 177], reviews [116, 117] and handbooks [170].
1930 1940 1950 1960 1970 1980 1990 2000 year
PFG NMRPfeifer,Kärger
TracerEx-
changeBarrer
DIF Micro-scopy
Kärger,Schemmert
MembranePermeationHayhurst,Wernick
TransientUptakeRate
Barrer
Directvisual
observat.Tiselius
Chroma-tographyHaynes,Ruthven
ZLCEic,
Ruthven
IR andIR/FR
Grenier,Meunier
CoherentQENSJobic
Effective-ness Fac-tor.Haag,
Post
TAPNijhuis,Baerns,Keipert
FTIRKarge
PEPvan
Santen
NMRRelaxation
ResingPfeiferMichel
IncoherentQENS
Cohen deLara,Jobic
Tracer ZLCHufton,
Brandani,Ruthven
ExchangeNMR
Chmelka
FrequencyResponseYasuda
Rees
IRMicro-scopyKarge
Equ
ilibr
ium
Non
-Equ
ilibr
ium
Fig. 48: Years of the first application of the various experimental techniques for studying in-tracrystalline zeolitic diffusion
Fig. 48 gives an impression about the years in which some of the listed measuring techniques have been introduced into zeolite research. As a remarkable feature, over the last few decades a particularly large number of novel techniques have been introduced. The beginning of this development is marked by the introduction of the pulsed field gradient NMR technique [6, 7, 52, 53]. As a most irritating finding of this technique, for a number of systems diffusivities were determined that exceeded the data generally accepted at the time by up to five orders of magnitude.

68
It is now well established that many of the earlier transient diffusion measurements with zeo-lites were corrupted by the intrusion of processes other than intracrystalline diffusion, in par-ticular by external resistances to mass and heat transfer [178-181], having thus given rise to the vast discrepancies. In addition to numerous experiments yielding reasonable agreement between the PFG NMR results and conventional uptake measurements [181, 182], as well as with their more modern modifications like the ZLC [183] or the frequency response [184] technique, it were in particular the extensive diffusion studies by Quasi-Elastic Neutron Scat-tering [20, 185] that confirmed the validity of the message derived from PFG NMR.
On the other hand, there are still a number of carefully investigated systems like benzene in zeolite NaX [186] and n-alkanes in zeolites NaX and silicalite/ZSM-5 [187, 188] where the PFG NMR measurements yield diffusivities, which are much larger than expected from the rate of molecular uptake or release, though the measuring conditions are comparable with those for systems where satisfactory agreement has been observed. As a consequence of the complexity of the contributing processes, the possibilities for an elimination or for reliable quantitative corrections for the intrusion of processes other than intracrystalline diffusion dur-ing molecular adsorption/desorption may obviously be rather limited. For many systems it is still unclear, therefore, whether the apparent complexity and disagreement between the results of different techniques is real or merely the result of poor experimentation and/or incorrect interpretation of the experimental data.
Moreover one has to take into consideration that the experimental techniques, which are com-pared with each other, may be sensitive to quite different spatial and temporal scales and op-erate under different physical situations. Imperfections in the habit of the zeolite crystals un-der study may completely differently affect the deduced diffusivities [189]. Most recent stud-ies by interference microscopy, which for the first time has enabled monitoring of intracrys-talline fluxe, have revealed that intracrystalline diffusion may dramatically deviate from the patterns expected on the basis of their textbook structure [190-192]. Unveiling the real struc-ture of nanoporous solids thus appears to become a great challenge of advanced material sci-ence. In parallel to the requirement for such types of studies, there is also a substantial defi-ciency in our knowledge of the real correlations between the transport diffusivities and self-diffusivities, taking into account that even an ideal zeolite is far from being an inert rigid lat-tice as supposed for simplicity in the above considerations. In view of the widespread com-mercial use and attractive issues of further application of nanoporous materials in advanced technologies, the eventual clarification of the origin between the diverging messages of dif-ferent experimental technique is a task of both fundamental interest and economic importance, which urgently requires concerted activities of the specialists in the various fields involved.
6.1.6 Intracrystalline Concentration Profiles
Though being a microscopic technique, the information directly provided by interference mi-croscopy is the concentration integral in observation direction rather than the concentration itself. Knowing the crystal symmetry and presupposing an ideal crystalline structure, one may attempt to de-convolute the information contained in the primary experimental data. An ideal model system for this type of studies are zeolites of type LTA. In fact, this type of zeolite served as a test object in the very first attempts of applying interference microscopy to study-ing diffusion in zeolites [190]. In these early times, however, neither long-distance observa-tion nor data processing had attained the level indispensable for this type of experiments.

69
Fig. 49: Evolution of the methanol concentration in zeolite NaCaA at room temperature after increasing the pressure in the surrounding atmosphere from 0.5 kPa to 9.0 kPa. The concen-tration profiles are shown in x-y planes through the crystal at heights z=L/16, L/4 and L/2 as indicated in the top of the figure. The profiles are monitored (from bottom to top) at times t=0 s, 40 s, 80 s and 160 s after the pressure step. (Ref. [191])
Fig. 49 displays the evolution of the intracrystalline concentration of methanol in zeolite NaCaA during uptake from an initial concentration of about 2 molecules per large cavity (i.e., per pseudo-unit cell) up to about 8.5 molecules corresponding to an external pressure of 9 kPa at room temperature. Owing to the cubic symmetry and the cubic shape of the crystallites un-der study, the intracrystalline concentrations c(x,y,z) could be derived from the primarily ac-
cessible information, the concentration integral ∫L
xzyxc0
d),,( , by a de-convolution procedure
assuming that the rate of the methanol uptake is exclusively controlled by intracrystalline dif-fusion, as described in Ref. [191]. Fig. 49 displays the evolution of the intracrystalline con-centration in three different planes, parallel to one of the six outer crystallite faces. It clearly appears from the representations that the concentration in the volume elements, which are closer to the external surfaces, much faster attain their equilibrium concentrations than those in the centre. This appears both in the curvature of any individual profile and in the fact that the evolution of the concentrations in the central plane (i.e. at z = L/2) is behind that for z = L/4 and even more pronounced behind that for z = L/12, i.e. in a plane quite close to the outer surface.
In the case of complete diffusion limitation [6, 170], the concentration in the volume elements close to the outer surface must be expected to immediately attain the equilibrium values cor-responding to the sorbate pressure in the surrounding atmosphere. Such a behaviour cannot be identified in Fig. 49. However, one must have in mind that due to optical boundary effects regions close to the crystal faces are excluded from direct observation and do not appear, therefore, in the representations of Fig. 49. Moreover, both the influence of (additional) trans-port resistances on the outer crystal boundary (surface barriers) and the finite rate of heat re-

70
lease during adsorption [6, 170] may lead to the fact that the concentration close to the crystal boundary only gradually attains the equilibrium value. As a main virtue of interference mi-croscopy, these limitations don’t decisively restrict its potential for measuring intracrystalline zeolitic diffusion as long as one is able to observe non-uniform intracrystalline concentrations and their evolution with time. In this case, the intracrystalline diffusivities follow from a mi-croscopic application of Fick’s second law, since one is able to directly deduce the spatial and temporal derivatives of the intracrystalline concentrations. Even, if the gradients in the evolv-ing concentration profiles are below the limits of sensitivity, in this way at least a lower limit of the intracrystalline diffusivities may be estimated. In the studies presented in Ref. [192], in this way the coefficient of intracrystalline transport diffusion of methanol in NaCaA was found to be within the range from 8×10-14 to 10-13, which is compatible with corresponding PFG NMR self-diffusion results.
6.1.7 Intracrystalline Transport Barriers
With respect to their suitability for diffusion measurement by interference microscopy, LTA-type zeolites are exceptional. Owing to their internal and external symmetry, the directly ob-servable concentration integrals may be transferred to a three-dimensional entity of data points corresponding to the local concentrations within the zeolite crystallite under study. This type of analysis, however, so far was successfully applied only to the single crystals with LTA symmetry assuming that the rate of uptake is exclusively controlled by the intracrystal-line diffusion. For a number of zeolite structure types it is well known, that the uptake dynam-ics may be strongly influenced by the diffusion anisotropy as well as by transport resistances on the crystal surface. In addition, the crystals themselves often cannot at all be considered as ideal single crystals. As an example, Fig. 50 displays two models of MFI crystal morphology currently discussed in the literature. According to one of the models [131, 193, 194], each crystal is composed of three constituents, i.e., the two identical pyramid units and the central component (Fig. 50a). According to the other model [195], the central component of Fig. 50a is not a single section but, in its turn, consists of four components (Fig. 50b), two of which are identical to the pyramid units in Fig. 50a.
Interference microscopy may serve as a valuable tool for detecting regions of different struc-ture, in particular of different sorbate accessibility, and for discriminating the role of their interfaces in molecular transportation. Ref. [196] describes a detailed study of this type, where isobutane has been used to probe the pore architecture of MFI-type zeolites.
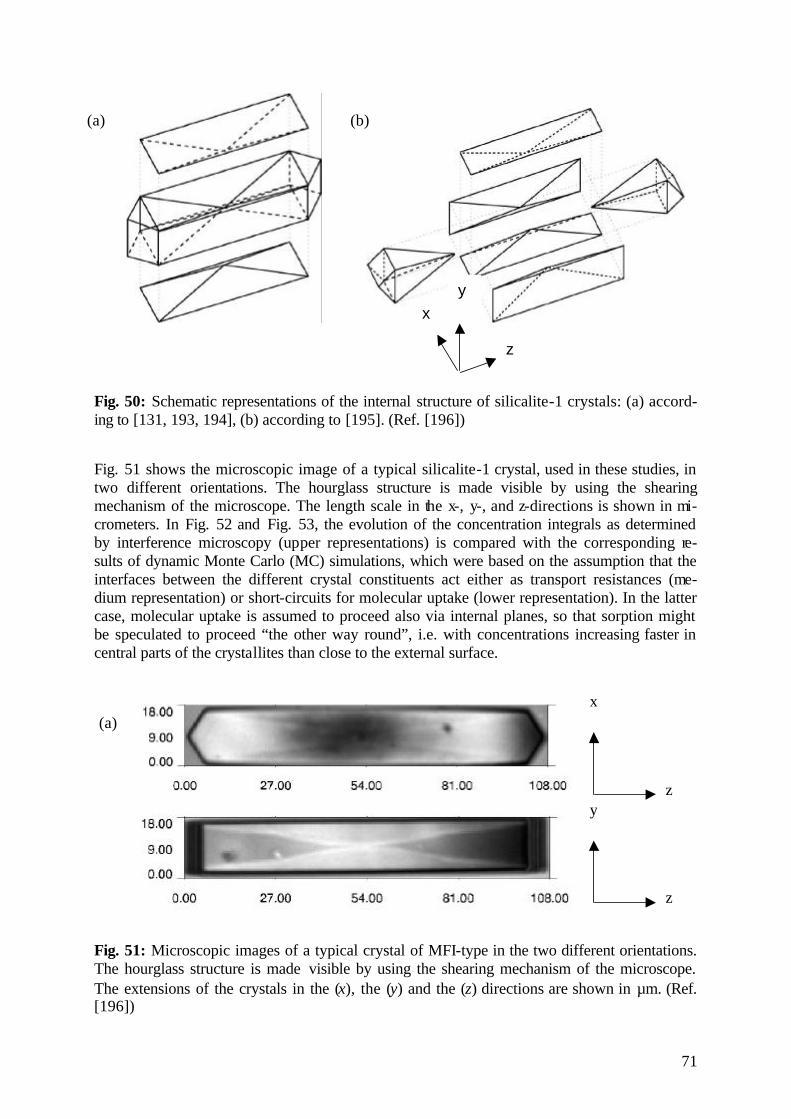
71
Fig. 50: Schematic representations of the internal structure of silicalite-1 crystals: (a) accord-ing to [131, 193, 194], (b) according to [195]. (Ref. [196])
Fig. 51 shows the microscopic image of a typical silicalite-1 crystal, used in these studies, in two different orientations. The hourglass structure is made visible by using the shearing mechanism of the microscope. The length scale in the x-, y-, and z-directions is shown in mi-crometers. In Fig. 52 and Fig. 53, the evolution of the concentration integrals as determined by interference microscopy (upper representations) is compared with the corresponding re-sults of dynamic Monte Carlo (MC) simulations, which were based on the assumption that the interfaces between the different crystal constituents act either as transport resistances (me-dium representation) or short-circuits for molecular uptake (lower representation). In the latter case, molecular uptake is assumed to proceed also via internal planes, so that sorption might be speculated to proceed “the other way round”, i.e. with concentrations increasing faster in central parts of the crystallites than close to the external surface.
Fig. 51: Microscopic images of a typical crystal of MFI-type in the two different orientations. The hourglass structure is made visible by using the shearing mechanism of the microscope. The extensions of the crystals in the (x), the (y) and the (z) directions are shown in µm. (Ref. [196])
z
x y
z
y z
x (a)
(a) (b)

72
The measurements were performed for the crystal orientation shown in Fig. 51b. For this ori-entation the direction of light propagation, and thus the direction of integration, coincides with the x-direction. We will only consider the rectangular part of the crystal (z between 13 and 88 µm in Fig. 51). For this part of the crystal the direction of light is perpendicular to the crystal outer surface exposed to the light. In this case, unambiguous measurements of the con-centration profiles are possible. Fig. 52 shows the integrated concentration profiles in longitu-dinal direction, viz. along the middle part of the crystal (y = 9.8 µm, left), and near the crystal border (y = 4.4 µm, right), while profiles along the “width” of the crystal, viz. through the middle (z = 51 µm, left) and closer to the crystal edge (z = 20 µm, right), are displayed in Fig. 53. The simulations have been carried out by assuming the mutual interdependence of the principal elements of the diffusion tensor, as resulting from Ref. [197] by transition path sam-pling and the correlation rule of diffusion anisotropy in MFI [6, 128]. Further details of the experimental procedure, data analysis and simulation may be found in Ref. [196]. The results of this study show, that fitting of the experimental concentration integrals by the results of the dynamic MC simulations allow to obtain qualitative and quantitative information on in-tracrystalline transport even in most complex systems, such as the MFI-type zeolites. Com-parison between the experimentally observed integral concentrations and the simulated con-centration profiles unanimously yield a satisfactory agreement between the experimental data and the simulations, in which the different constituents of the crystals are assumed to exhibit a modest transport resistance. There is no agreement at all if in the simulations the internal in-terfaces are assumed to be freely accessible for molecular adsorption. One may exclude, therefore, that molecular uptake may as well proceed via internal interfaces. This conclusion seems to be in contrast with the results obtained in Ref. [194] with the iodine indicator tech-nique, where iodine was found to be able to distribute over the interfaces. However, in view of the much larger size of the isobutane molecules and the different time scale used in the present studies, such a difference might be quite acceptable.

73
(a) (b)
0 25 50 75 100
0.0
0.5
1.0
measurements y = 9.8 µm t=200s t= 27s t= 17s t= 7s
t= 0s
C (
y,z)
/ re
lativ
e un
its
z / µm0 25 50 75 100
0.0
0.5
1.0
measurements y = 4.4 µm t=200s t= 27s t= 17s t= 7s
t = 0s
C (
y,z)
/ re
lativ
e un
its
z / µm
(c) (d)
0 25 50 75 100
0.0
0.5
1.0
simulations y = 9.8 µm
t = 4.3 t = 2.7 t = 1.1
t = 0
C (
y,z)
/ re
lativ
e un
its
z / µm0 25 50 75 100
0.0
0.5
1.0
simulations y = 4.4 µm
t = 4.3 t = 2.7 t = 1.1
t = 0
C (
y,z)
/ re
lativ
e un
its
z / µm
(e) (f)
0 25 50 75 100
0.0
0.5
1.0
simulations y = 9.8 µm
t = 0.5 t = 0.3 t = 0.1 t = 0
C (
y,z)
/ re
lativ
e un
its
z / µm 0 25 50 75 100
0.0
0.5
1.0
simulations y = 4.4 µm
t = 0.5 t = 0.3 t = 0.1
t = 0
C (
y,z)
/ re
lativ
e un
its
z / µm
Fig. 52: Intracrystalline concentration profiles of isobutane in an MFI-type crystal along z-direction during adsorption: (a), (b) profiles measured by interference microscopy; (c), (d) simulated profiles, assuming that the internal interfaces serve only as transport barriers; (e), (f) simulated profiles, assuming that adsorption/desorption may occur through the internal interfaces. For the simulated profiles the time unit is 103 elementary diffusion steps. The equlibrium values of C(y,z) after the end of adsorption are equal to 1. (Ref. [196])
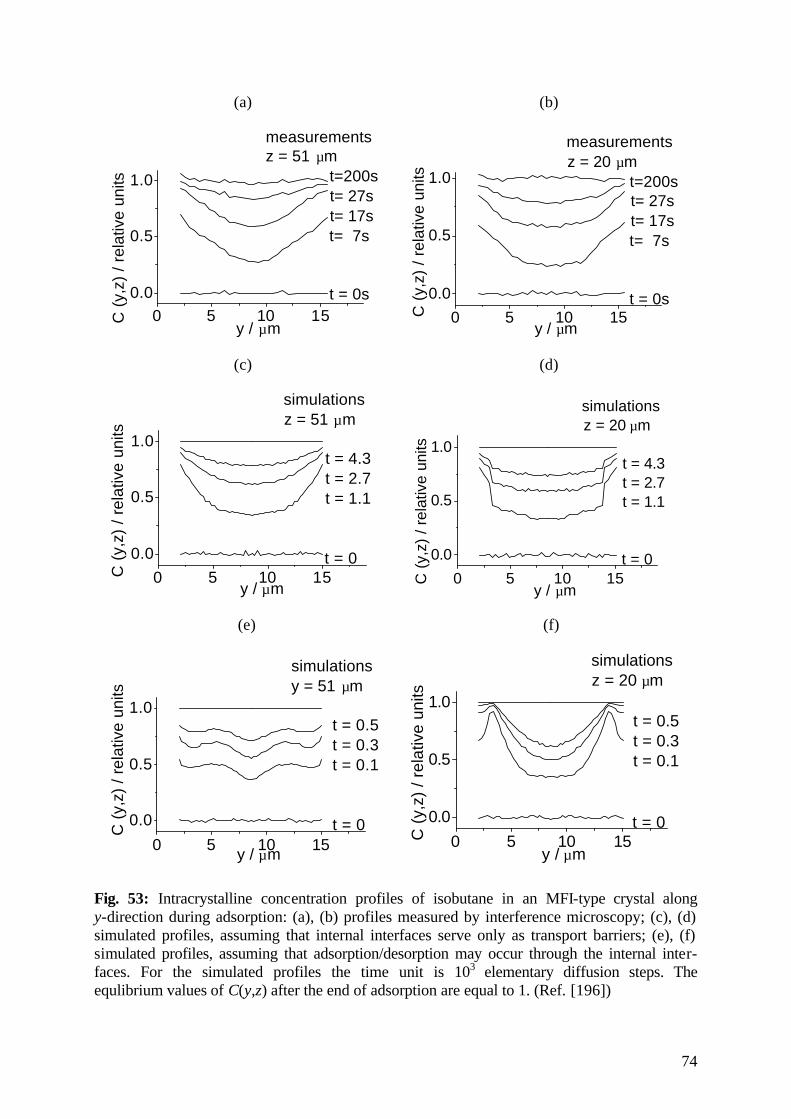
74
(a) (b)
0 5 10 150.0
0.5
1.0
measurements z = 51 µm t=200s t= 27s t= 17s t= 7s
t = 0s
C (
y,z)
/ re
lativ
e un
its
y / µm0 5 10 15
0.0
0.5
1.0
measurements z = 20 µm t=200s t= 27s t= 17s t= 7s
t = 0s
C (
y,z)
/ re
lativ
e un
its
y / µm
(c) (d)
0 5 10 150.0
0.5
1.0
simulations z = 51 µm
t = 4.3 t = 2.7 t = 1.1
t = 0
C (
y,z)
/ re
lativ
e un
its
y / µm0 5 10 15
0.0
0.5
1.0
simulations z = 20 µm
t = 4.3 t = 2.7 t = 1.1
t = 0
C (
y,z)
/ re
lativ
e un
its
y / µm
(e) (f)
0 5 10 15
0.0
0.5
1.0
simulations y = 51 µm
t = 0.5 t = 0.3 t = 0.1
t = 0C (
y,z)
/ re
lativ
e un
its
y / µm0 5 10 15
0.0
0.5
1.0
simulations z = 20 µm
t = 0.5 t = 0.3 t = 0.1
t = 0
C (
y,z)
/ re
lativ
e un
its
y / µm
Fig. 53: Intracrystalline concentration profiles of isobutane in an MFI-type crystal along y-direction during adsorption: (a), (b) profiles measured by interference microscopy; (c), (d) simulated profiles, assuming that internal interfaces serve only as transport barriers; (e), (f) simulated profiles, assuming that adsorption/desorption may occur through the internal inter-faces. For the simulated profiles the time unit is 103 elementary diffusion steps. The equlibrium values of C(y,z) after the end of adsorption are equal to 1. (Ref. [196])

75
Recent PFG NMR diffusion studies with methane and n-butane in silicalite-1 and ZSM-5 [189] did reveal that in addition to the transport resistances at the boundaries between the dif-ferent MFI constituents as revealed by interference microscopy, there have to exist a great number of further internal transport barriers. Their existence follows from a remarkable de-pendence of the intracrystalline self-diffusivities on the diffusion path length, which can be traced below the micrometer range. Such a behaviour strongly suggests the existence of trans-port resistances with mutual spacing in the range of hundreds of nanometers up to microme-ters. The formation of MFI-type zeolites is known to proceed via an aggregation of primary particles [198-200]. In some cases particles which attain extensions up to 350 nm [201, 202] were observed. Therefore, the formation of the internal barriers might be associated with pe-culiar structural features in the transition range between these primary particles. One should have in mind that the intensity of these resistances has to be inferior to the transport resistance at the boundaries between the MFI constituents, since otherwise the latter would remain un-observable by interference microscopy. Moreover, for the probe molecules under study the internal barriers were found to become unimportant above room temperature. This may easily be referred to the fact that with increasing temperature their influence is progressively reduced in comparison with the diffusional transport resistance of the zeolite bulk phase [203]. Due to the rather limited influence of such barriers it is probably premature to speculate up to which extent their existence might contribute to an eventual clarification of the origin of the discrep-ancy between some results of the different techniques of diffusion measurement.
6.2 Confinement by Channels and Channel Networks of Molecular Dimension
6.2.1 Single-File Diffusion
If the intracrystalline pore system consists of a single array of parallel channels rather than the mutually intersecting two channel systems as considered in the previous section, molecular propagation may be obliged to occur under very peculiar conditions. As soon as the channel diameters are too small to allow the mutual passage of adjacent molecules, subsequent mo-lecular displacements are not uncorrelated anymore so that the main prerequisite of the central limit theorem is no longer valid. The situation may be compared with a file of pearls, where each individual pearl may only be shifted in a certain direction if the other pearls have been shifted in a similar way. This type of particle migration, which for the first time was discussed in connection with the functionality of ion channels in cell membranes [204, 205], has there-fore been termed single-file diffusion. Under such conditions, molecular shifts in a given di-rection will most likely effect an increased sorbate concentration “in front” of the considered molecule and a diminished concentration “behind” it. Any displacement is therefore followed by displacements in the opposite direction with a higher probability than by displacements in the same direction. In contrast with the well-known correlation effect in solid-state diffusion [25], this “anti”-correlation is preserved over infinitely large distances. As a consequence, neither Fick’s laws, eqs. (39) and (40), nor the Gaussian propagator (Eq.(43)) may be applied to describe molecular displacement in such systems. Interestingly enough, the propagator is still found to be of Gaussian shape [77], however with a mean square displacement increasing with the square root of time [206]
⟩⟨ )(2 tx = 2Ft1/2. (51)
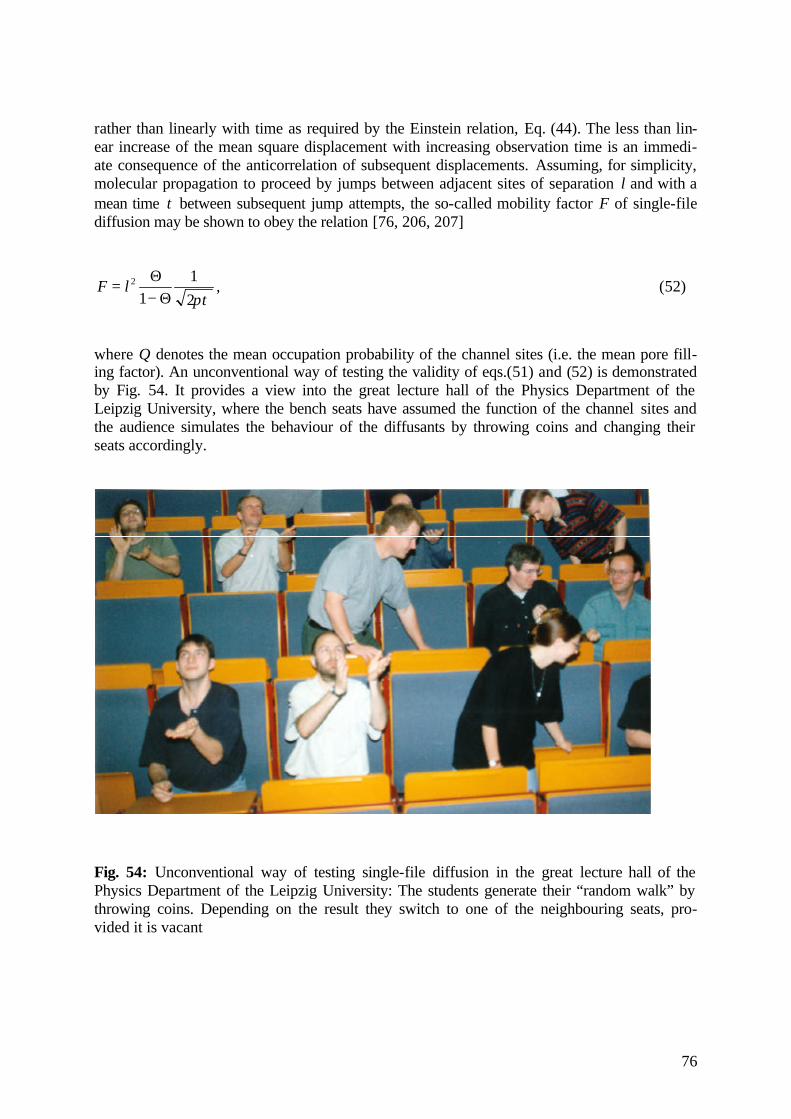
76
rather than linearly with time as required by the Einstein relation, Eq. (44). The less than lin-ear increase of the mean square displacement with increasing observation time is an immedi-ate consequence of the anticorrelation of subsequent displacements. Assuming, for simplicity, molecular propagation to proceed by jumps between adjacent sites of separation l and with a mean time τ between subsequent jump attempts, the so-called mobility factor F of single-file diffusion may be shown to obey the relation [76, 206, 207]
πτ21
12
Θ−Θ
= lF , (52)
where Θ denotes the mean occupation probability of the channel sites (i.e. the mean pore fill-ing factor). An unconventional way of testing the validity of eqs.(51) and (52) is demonstrated by Fig. 54. It provides a view into the great lecture hall of the Physics Department of the Leipzig University, where the bench seats have assumed the function of the channel sites and the audience simulates the behaviour of the diffusants by throwing coins and changing their seats accordingly.
Fig. 54: Unconventional way of testing single-file diffusion in the great lecture hall of the Physics Department of the Leipzig University: The students generate their “random walk” by throwing coins. Depending on the result they switch to one of the neighbouring seats, pro-vided it is vacant
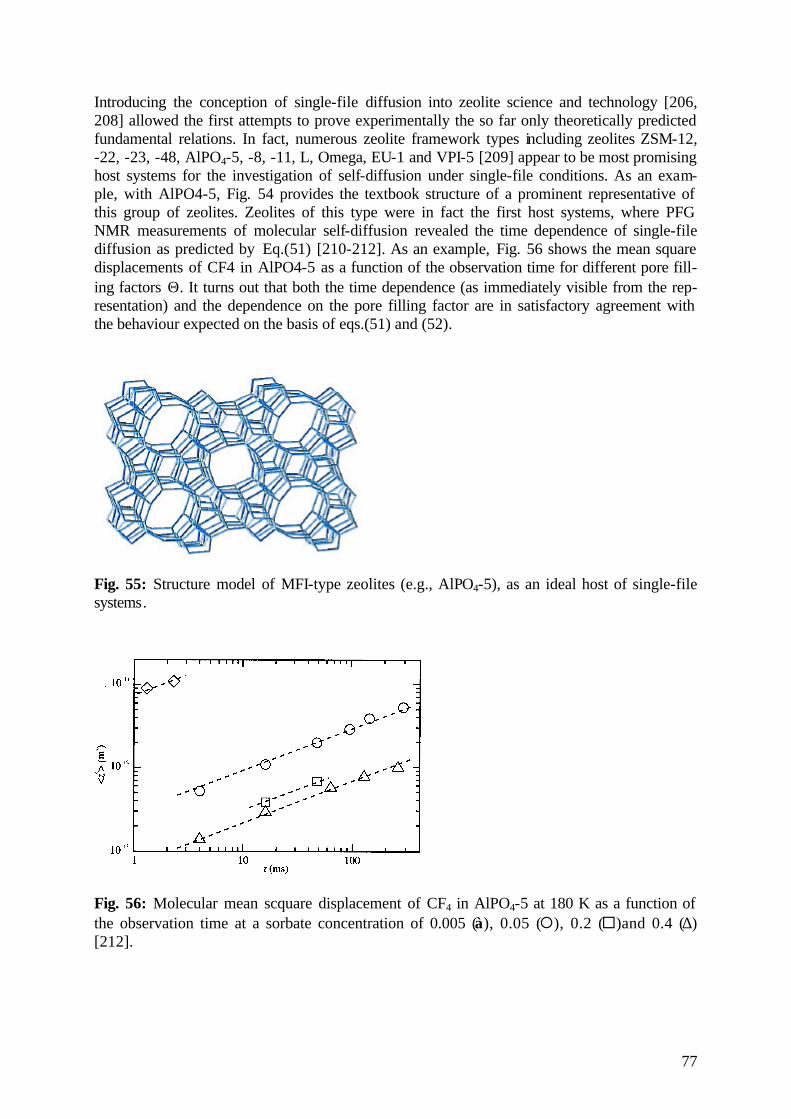
77
Introducing the conception of single-file diffusion into zeolite science and technology [206, 208] allowed the first attempts to prove experimentally the so far only theoretically predicted fundamental relations. In fact, numerous zeolite framework types including zeolites ZSM-12, -22, -23, -48, AlPO4-5, -8, -11, L, Omega, EU-1 and VPI-5 [209] appear to be most promising host systems for the investigation of self-diffusion under single-file conditions. As an exam-ple, with AlPO4-5, Fig. 54 provides the textbook structure of a prominent representative of this group of zeolites. Zeolites of this type were in fact the first host systems, where PFG NMR measurements of molecular self-diffusion revealed the time dependence of single-file diffusion as predicted by Eq.(51) [210-212]. As an example, Fig. 56 shows the mean square displacements of CF4 in AlPO4-5 as a function of the observation time for different pore fill-ing factors Θ. It turns out that both the time dependence (as immediately visible from the rep-resentation) and the dependence on the pore filling factor are in satisfactory agreement with the behaviour expected on the basis of eqs.(51) and (52).
Fig. 55: Structure model of MFI-type zeolites (e.g., AlPO4-5), as an ideal host of single-file systems.
Fig. 56: Molecular mean scquare displacement of CF4 in AlPO4-5 at 180 K as a function of the observation time at a sorbate concentration of 0.005 (◊), 0.05 (¡), 0.2 (̈ )and 0.4 (∆) [212].
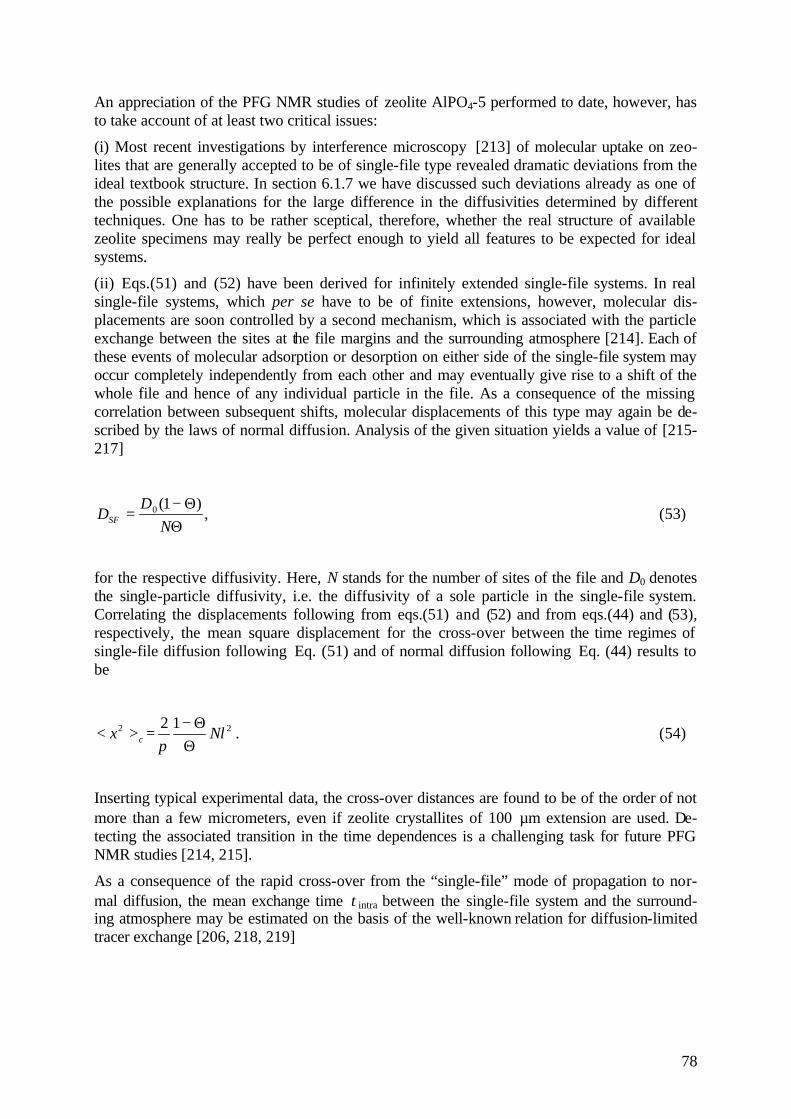
78
An appreciation of the PFG NMR studies of zeolite AlPO4-5 performed to date, however, has to take account of at least two critical issues:
(i) Most recent investigations by interference microscopy [213] of molecular uptake on zeo-lites that are generally accepted to be of single-file type revealed dramatic deviations from the ideal textbook structure. In section 6.1.7 we have discussed such deviations already as one of the possible explanations for the large difference in the diffusivities determined by different techniques. One has to be rather sceptical, therefore, whether the real structure of available zeolite specimens may really be perfect enough to yield all features to be expected for ideal systems.
(ii) Eqs.(51) and (52) have been derived for infinitely extended single-file systems. In real single-file systems, which per se have to be of finite extensions, however, molecular dis-placements are soon controlled by a second mechanism, which is associated with the particle exchange between the sites at the file margins and the surrounding atmosphere [214]. Each of these events of molecular adsorption or desorption on either side of the single-file system may occur completely independently from each other and may eventually give rise to a shift of the whole file and hence of any individual particle in the file. As a consequence of the missing correlation between subsequent shifts, molecular displacements of this type may again be de-scribed by the laws of normal diffusion. Analysis of the given situation yields a value of [215-217]
,)1(0
ΘΘ−
=N
DDSF (53)
for the respective diffusivity. Here, N stands for the number of sites of the file and D0 denotes the single-particle diffusivity, i.e. the diffusivity of a sole particle in the single-file system. Correlating the displacements following from eqs.(51) and (52) and from eqs.(44) and (53), respectively, the mean square displacement for the cross-over between the time regimes of single-file diffusion following Eq. (51) and of normal diffusion following Eq. (44) results to be
22 12Nlx c Θ
Θ−=><
π . (54)
Inserting typical experimental data, the cross-over distances are found to be of the order of not more than a few micrometers, even if zeolite crystallites of 100 µm extension are used. De-tecting the associated transition in the time dependences is a challenging task for future PFG NMR studies [214, 215].
As a consequence of the rapid cross-over from the “single-file” mode of propagation to nor-mal diffusion, the mean exchange time τintra between the single-file system and the surround-ing atmosphere may be estimated on the basis of the well-known relation for diffusion-limited tracer exchange [206, 218, 219]
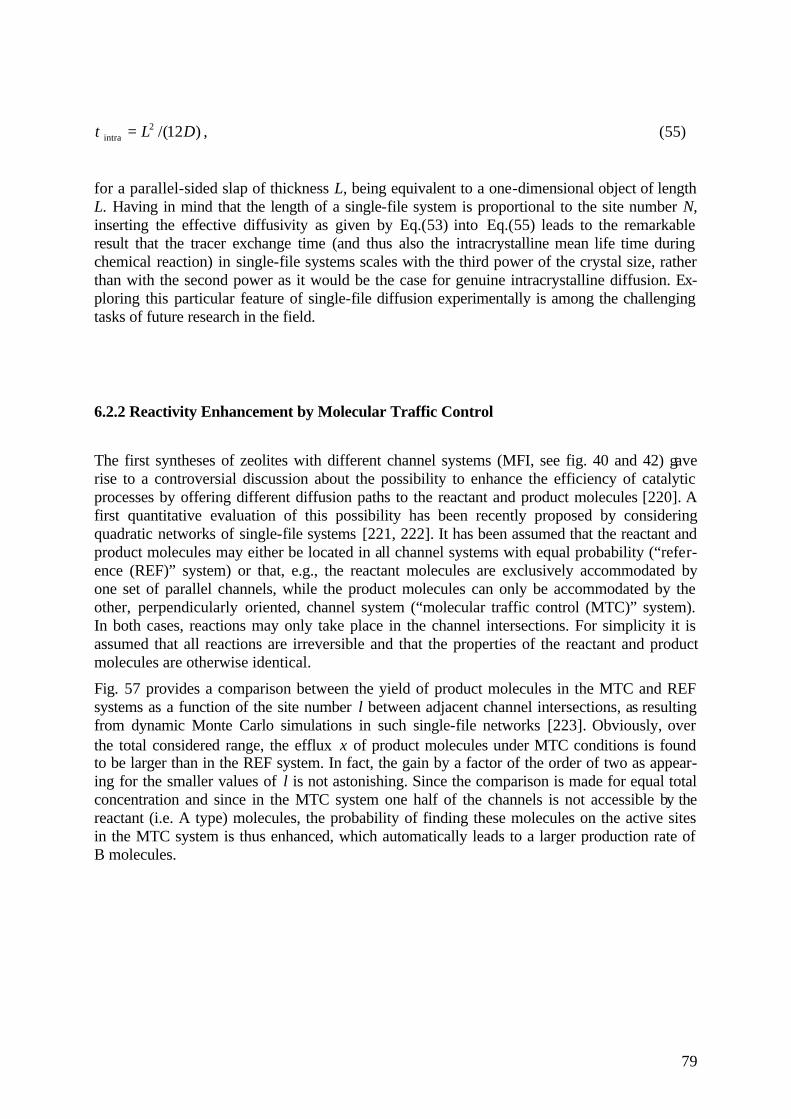
79
)12/(2intra DL=τ , (55)
for a parallel-sided slap of thickness L, being equivalent to a one-dimensional object of length L. Having in mind that the length of a single-file system is proportional to the site number N, inserting the effective diffusivity as given by Eq.(53) into Eq.(55) leads to the remarkable result that the tracer exchange time (and thus also the intracrystalline mean life time during chemical reaction) in single-file systems scales with the third power of the crystal size, rather than with the second power as it would be the case for genuine intracrystalline diffusion. Ex-ploring this particular feature of single-file diffusion experimentally is among the challenging tasks of future research in the field.
6.2.2 Reactivity Enhancement by Molecular Traffic Control
The first syntheses of zeolites with different channel systems (MFI, see fig. 40 and 42) gave rise to a controversial discussion about the possibility to enhance the efficiency of catalytic processes by offering different diffusion paths to the reactant and product molecules [220]. A first quantitative evaluation of this possibility has been recently proposed by considering quadratic networks of single-file systems [221, 222]. It has been assumed that the reactant and product molecules may either be located in all channel systems with equal probability (“refer-ence (REF)” system) or that, e.g., the reactant molecules are exclusively accommodated by one set of parallel channels, while the product molecules can only be accommodated by the other, perpendicularly oriented, channel system (“molecular traffic control (MTC)” system). In both cases, reactions may only take place in the channel intersections. For simplicity it is assumed that all reactions are irreversible and that the properties of the reactant and product molecules are otherwise identical.
Fig. 57 provides a comparison between the yield of product molecules in the MTC and REF systems as a function of the site number l between adjacent channel intersections, as resulting from dynamic Monte Carlo simulations in such single-file networks [223]. Obviously, over the total considered range, the efflux ξ of product molecules under MTC conditions is found to be larger than in the REF system. In fact, the gain by a factor of the order of two as appear-ing for the smaller values of l is not astonishing. Since the comparison is made for equal total concentration and since in the MTC system one half of the channels is not accessible by the reactant (i.e. A type) molecules, the probability of finding these molecules on the active sites in the MTC system is thus enhanced, which automatically leads to a larger production rate of B molecules.

80
0,0 0,5 1,0 1,5 2,0 2,50
3
6
9
12
l = 1
l = 300
l = 150
l = 30
l = 15l = 5ξ MTC
/ξRE
F
lg ( l )
Fig. 57: Benefit ξMTC/ξREF of the MTC system in comparison with the REF system as a func-tion of the decadic logarithm of the number l of sites in the channel segments between the intersections for a total average pore filling factor of 0.1 [223]
For rationalizing the origin of the further gain in reactivity in MTC with increasing l it is use-ful to consult the plots of intrinsic concentrations as provided by Fig. 58: Qualitatively, as shown in Fig. 58a, b, d and e, the concentration profiles of the reactant and product molecules in both the MTC and REF systems correspond to the patterns well-known from the Thiele concept [6, 176, 177], i.e. concentration drop from outside to inside for the reactant and, vice versa, from inside to outside for the product molecules. Considering, however, the total con-centration (Fig. 58c and f) a decisive difference becomes visible: As a most remarkable fea-ture, in the case of MTC there is a pronounced drop in overall concentration from outside to inside along the α channels and from inside to outside along the β channels, while in the REF system the total concentration is uniform over all channels.

81
Fig. 58: The concentration profiles of the A molecules (figs. a and d), B molecules (figs. b and e) and of both molecules (figs. c and f) in the α and β channels for an overall site occu-pancy of 0.4 and a reaction rate of 0.01 in case of the MTC (figs. a, b and c) and the REF sys-tem (figs. d, e and f) [223]
This difference is of immediate relevance for the microdynamics of molecular transport within the channel network. As a consequence of the exclusion of mutual passages, the propagation of the involved molecules is subject to single-file confinement as discussed in section 4.4. This means in particular that in infinitely extended channels under uniform over-all concentration, the molecular mean square displacements would only increase in proportion

82
with the square root of the observation time rather than with the observation time itself. In the present case of intersecting channels, the elements of ideal single-file constraint are the chan-nel segments of length λ)1( +l between adjacent intersections, where λ denotes the distance between neighbouring sites. Molecular propagation may be understood as a random walk on the lattice formed by the channel intersections with mean transition time τ from intersection to intersection determined by the propagation rate through the channel elements. As an esti-mate of the order of magnitude of this transition time, one may consider the mean exchange time of a single-file system of identical length with its surroundings. In section 6.2.1 this ex-change time has been shown to scale with the third power of the file length, i.e., in the given case, with 3)1( +l . Since from the classical Thiele concept [6, 176, 177] the efficiency of chemical reaction is known to decrease with increasing intracrystalline mean life times, and the latter are directly proportional to the mean exchange times between channel intersection, any increase in the length l of the channel elements must thus be expected to lead to a dra-matic decrease of the overall reactivity.
This reduction must be expected to be far less pronounced in the case of MTC. As has been demonstrated in Fig. 58c, overall molecular concentration is then far from being constant. As a consequence, molecular propagation is then subjected to transport diffusion rather than to self-diffusion as in the case of constant overall concentration. For transport diffusion, how-ever, single-file systems exhibit no peculiarities. This may be easily rationalized by realizing that the mutual exchange of adjacent molecules, which is prohibited in single-file systems, is ineffective with respect to their transport diffusion. Therefore, in the MTC system the rate of molecular propagation may be estimated by the relations for ordinary diffusion (cf. Eq.(44)), where the mean passage time from intersection to intersection increases with the square of their distance rather than with the third power. In complete agreement with this consideration, the effect of reactivity reduction by transport inhibition due to prolonged distances between the channel intersections, i.e. with increasing value of l, is much more pronounced in the REF than in the MTC system, as reflected by the simulation results shown in Fig. 57.
6.2.3 Molecules in Channels and Channel Networks Observed by Interference and IR Microscopy
Owing to their crystallinity, zeolites of type AFI offer much better prospects of structure analysis by interference microscopy than the mesoporous materials considered in the subse-quent section 6.3. As an example, Fig. 59 displays the equilibrium concentration of methanol in a CrAPO-5 crystal [224, 225] in equilibrium with a surrounding methanol atmosphere of 1 mbar, as observed by interference microscopy [213]. The text-book structure of AFI-type zeo-lites [209] is known to exhibit an hexagonal arrangement of channels with an effective diame-ter of about 0.7 nm. Therefore, they appear to be ideal host systems for observing single-file diffusion with sufficiently bulky molecules, such as tetrafluoromethane with a molecular di-ameter of 0.47 nm [226]. In fact, Fig. 59 clearly shows that the crystal under study may by far not be considered as an array of parallel equally accessible channels, representing a ”bundle of macaronis” of atomistic diameters. The finding of interference microscopy has been con-firmed by complementary concentration profiling by IR microscopy. Fig. 60 exemplifies the satisfactory agreement between the results of both techniques. It simultaneously illustrates the poorer spatial resolution of IR microscopy in comparison with interference microscopy. On the other hand, owing to the much higher sensitivity and its sensitivity to particular molecular
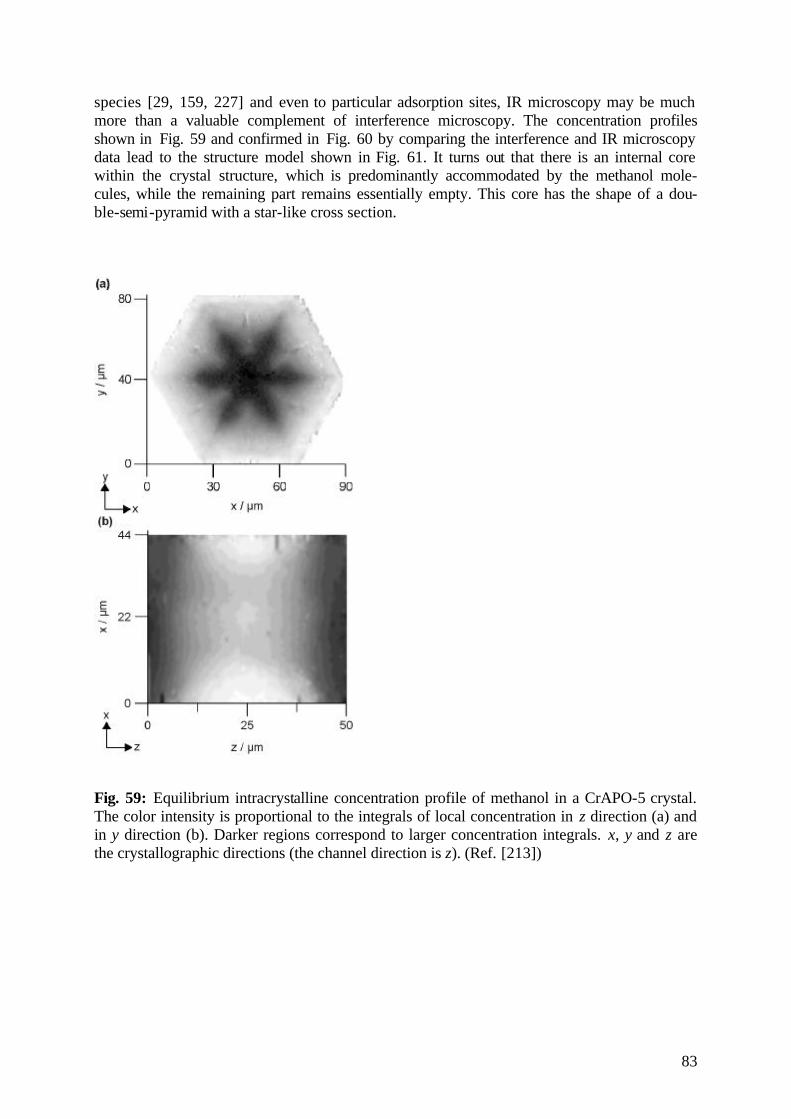
83
species [29, 159, 227] and even to particular adsorption sites, IR microscopy may be much more than a valuable complement of interference microscopy. The concentration profiles shown in Fig. 59 and confirmed in Fig. 60 by comparing the interference and IR microscopy data lead to the structure model shown in Fig. 61. It turns out that there is an internal core within the crystal structure, which is predominantly accommodated by the methanol mole-cules, while the remaining part remains essentially empty. This core has the shape of a dou-ble-semi-pyramid with a star-like cross section.
Fig. 59: Equilibrium intracrystalline concentration profile of methanol in a CrAPO-5 crystal. The color intensity is proportional to the integrals of local concentration in z direction (a) and in y direction (b). Darker regions correspond to larger concentration integrals. x, y and z are the crystallographic directions (the channel direction is z). (Ref. [213])
84
Fig. 60: The mean concentration integrals I recorded by FTIR and interference microscopy for a CrAPO-5 crystal: a) along y direction for x values between 35 and 55 µm (see Fig. 58); b) along z direction for x values between 12 and 32 µm. x, y and z are the crystallographic directions (see Fig. 58). (Ref. [213])
Fig. 61: Suggested internal structure of CrAPO-5 crystals (shown only for the lower part of the crystal). x, y and z are the crystallographic directions. (Ref. [213])

85
Fig. 62: Intracrystalline concentration profiles of water in the CrAPO-5 (a, c) and SAPO-5 (b, d) crystals integrated along the y direction under equilibrium with water vapour at 1 (a, b) and 20 mbar (c, d). The profiles are shown only for the crystal surface marked on the image (e). The channels run along the z axis. Darker regions correspond to higher concentration inte-grals. (Ref. [228])
The origin of the intergrowth effects in CrAPO-5 may be found in the crystallization history. It was shown in Refs. [229, 230] that the dumbbell shape is characteristic of some AFI-type crystals in the intermediate stage of growth. Further growth leads to a filling of the gap in the central part of the crystals. Obviously, though this process leads to the formation of perfectly hexagonally shaped crystals, their internal structure is by far not perfect.
It is interesting to note (cf. Fig. 62a) that a similar, although not as pronounced, distribution pattern is observed with water at a vapour pressure 1 mbar [228]. One may conclude, there-fore, that the range of essentially excluded accessibility of methanol as reflected by the struc-ture model shown in Fig. 61, likewise represents a region of reduced water concentration un-der the given conditions. With increasing water pressure (Fig. 62c), however, in parallel with a general concentration enhancement, also the differences over the different regions of the intracrystalline space essentially disappear.
In order to understand the transition from the non-homogeneous to the homogeneous profile it is helpful to consider the adsorption isotherm of water in CrAPO-5 zeolite. It belongs to the type IV isotherms [231]. Such isotherms exhibit relatively slow adsorption with increasing adsorbate pressure followed by a sudden increase of the amount adsorbed at a certain “criti-cal” pressure. The initial, slow adsorption is usually associated with the adsorption of single molecules on different functional groups of the pore surface. The sudden increase of the con-centration in the pores with increasing pressure is explained by the formation of a liquid-like adsorbate phase. It is reasonable to assume that the structure of the different intergrowth com-ponents of CrAPO-5 crystals may be slightly different. One of the candidates for the struc-tural factor, which strongly influences intracrystalline water concentration at low loadings
e)

86
and, at the same time, may give rise to some sort of heterogeneity in CrAPO-5 is the content of Cr atoms. Indeed, different Cr content in the different crystal components may be responsi-ble for the non-homogeneous intracrystalline concentration profile observed at the low water pressure. Clearly, a non-homogeneous distribution of any other adsorption sites, such as de-fect sites over the crystal components may lead to the same result. The concentration and the strength of adsorption sites does not, however, influence the sorption capacity of CrAPO-5 for water. This explains the homogeneous profiles observed at high water pressure, when the total available pore volume is expected to be filled with the liquid-like water [228, 231].
The concentration profiles of water observed in SAPO-5 (Fig. 62b and d) can be explained in a qualitatively similar way. These profiles, like those recorded for the CrAPO-5 crystals, show a non-homogeneous water distribution at low water pressures, which transforms to the homogeneous distribution upon the pressure increase. The heterogeneities in the structure of SAPO-5 crystals, which were observed earlier by electron microprobe analysis [232], may be responsible for the non-homogeneous profile of water. The microprobing has revealed that the silicon concentration in the central part of the SAPO-5 crystals was lower by a factor of two to three than that on the crystal margins. Studies of the growth of the SAPO-5 crystals helped to clarify the reasons of the non-homogeneous silicon distribution [232]. It was found that initially “pencil-like” crystals are formed. At the later stages of the crystal growth, the tips of the “pencils” flatten out, which in some cases gives rise to the ideally shaped hexagonal crys-tals. These later stages proceed under consumption of much higher amounts of silicon than the initial stage. Hence, in agreement with the results of the microprobe sampling, the “pencil-like” core of the crystals may be expected to have depleted silicon content. This finding was correlated with the non-homogeneous intracrystalline distribution of pyridine species in SAPO-5 at 373 K [227]. The concentration of pyridine species was found to be lower at the crystal edges than in the central part of the crystal. This is in qualitative agreement with the intracrystalline water distribution in SAPO-5 recorded by the interference microscopy method under equilibrium with 1 mbar of water (Fig. 62b). At high water pressures, condensation leading to pore volume saturation occurs. In this case, the water concentration is expected to depend primarily on the accessible pore volume. This explains the homogeneous concentra-tion profile observed in SAPO-5 under equilibrium with 20 mbar of water (Fig. 62d).
In contrast to zeolites with three-dimensional channel networks considered above, zeolites of ideal AFI structure offer the unique chance of allowing the direct determination of local con-centrations. This is due to the fact that observation perpendicular to the channel direction yields integral concentrations, which are proportional to the crystal thickness in observation direction times the local channel concentration, provided that all channels – being subject to identical boundary conditions – are also structurally identical. With the findings leading to the model of intergrowth structure in Fig. 61, however, for the so far considered specimens such a simple possibility has to be abandoned. It has to be admitted that for a substantially larger amount of investigated AFI-type zeolite crystals interference microscopy revealed even much more pronounced deviations from the ideal textbook structure of parallel, equally extended channels expected for single crystals. There is no doubt, therefore, that irrespective of the numerous attempts of the last few years [224, 225], the synthesis of nanoporous large single crystals with identical, unrestrictedly accessible channels remains a challenging task of the future. In view of the lack of host systems of AFI structure type, which would allow the immediate observation of transient local concentrations and a direct estimation of the associated transport diffusivities, consistency checks between the observed integrated concentration profiles and the profiles obtained by the MC simulations on the basis of the structure models are particu-larly important. As an example, Fig. 63 compares the profiles of concentration, integrated perpendicular to the channel direction, for methanol in CrAPO-5, as resulting from interfer-
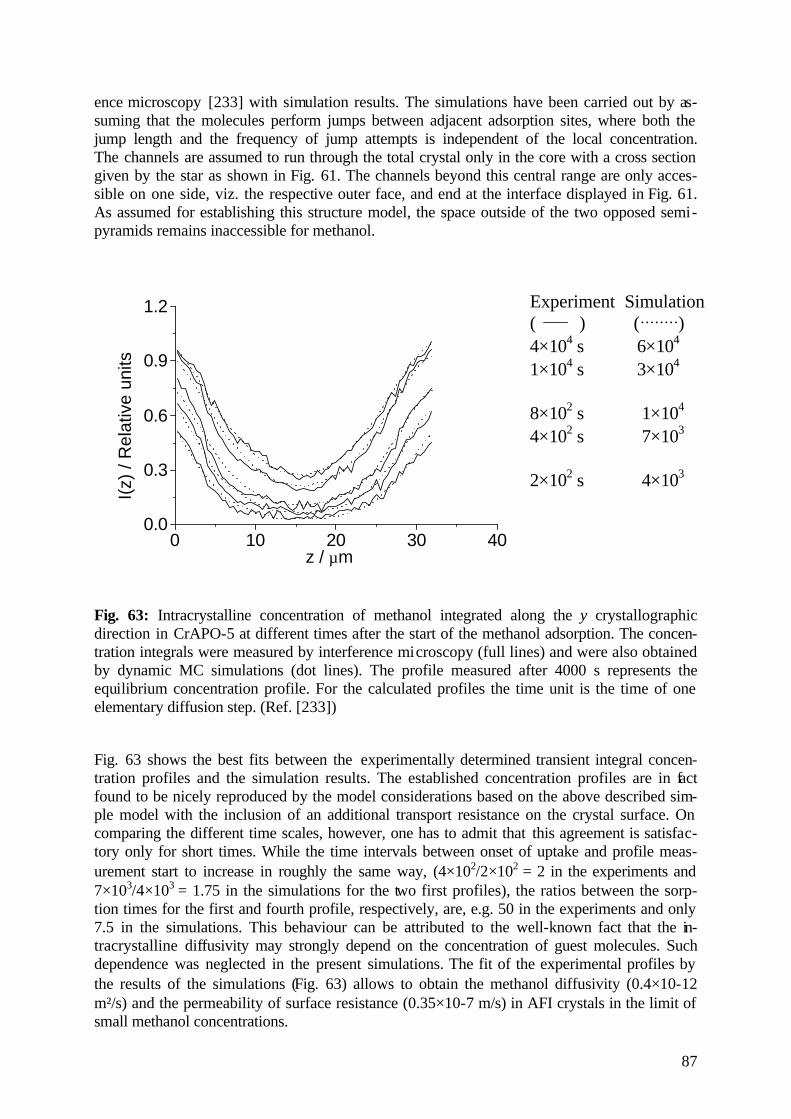
87
ence microscopy [233] with simulation results. The simulations have been carried out by as-suming that the molecules perform jumps between adjacent adsorption sites, where both the jump length and the frequency of jump attempts is independent of the local concentration. The channels are assumed to run through the total crystal only in the core with a cross section given by the star as shown in Fig. 61. The channels beyond this central range are only acces-sible on one side, viz. the respective outer face, and end at the interface displayed in Fig. 61. As assumed for establishing this structure model, the space outside of the two opposed semi-pyramids remains inaccessible for methanol.
0 10 20 30 400.0
0.3
0.6
0.9
1.2
I(z)
/ R
elat
ive
units
z / µm
Fig. 63: Intracrystalline concentration of methanol integrated along the y crystallographic direction in CrAPO-5 at different times after the start of the methanol adsorption. The concen-tration integrals were measured by interference microscopy (full lines) and were also obtained by dynamic MC simulations (dot lines). The profile measured after 4000 s represents the equilibrium concentration profile. For the calculated profiles the time unit is the time of one elementary diffusion step. (Ref. [233])
Fig. 63 shows the best fits between the experimentally determined transient integral concen-tration profiles and the simulation results. The established concentration profiles are in fact found to be nicely reproduced by the model considerations based on the above described sim-ple model with the inclusion of an additional transport resistance on the crystal surface. On comparing the different time scales, however, one has to admit that this agreement is satisfac-tory only for short times. While the time intervals between onset of uptake and profile meas-urement start to increase in roughly the same way, (4×10²/2×102 = 2 in the experiments and 7×10³/4×103 = 1.75 in the simulations for the two first profiles), the ratios between the sorp-tion times for the first and fourth profile, respectively, are, e.g. 50 in the experiments and only 7.5 in the simulations. This behaviour can be attributed to the well-known fact that the in-tracrystalline diffusivity may strongly depend on the concentration of guest molecules. Such dependence was neglected in the present simulations. The fit of the experimental profiles by the results of the simulations (Fig. 63) allows to obtain the methanol diffusivity (0.4×10⁻¹² m²/s) and the permeability of surface resistance (0.35×10⁻⁷ m/s) in AFI crystals in the limit of small methanol concentrations.
Experiment Simulation ( ) (��������) 4×10⁴ s 6×10⁴ 1×10⁴ s 3×10⁴
8×10² s 1×10⁴ 4×10² s 7×10³
2×10² s 4×10³

88
Ferrierite consists of a network of mutually intersecting channels with elliptical cross-sections with diameters of 0.42 nm and 0.54 nm (“10-ring” channels), and 0.35 nm and 0.48 nm (“8-ring” channels), respectively. Offering in this way two different types of diffusion paths, fer-rierite may serve as a model system for experimentally tracing conditions of “molecular traf-fic control” [220, 222, 234, 235]. The conception of molecular traffic control has been intro-duced as a possibility of reactivity enhancement in heterogeneous catalysis [220, 236]. It is based on the assumption that the reactant and product molecules are preferentially accommo-dated in different parts of the pore system. As a consequence, the mutual hindrance of reactant and product molecules on their diffusion paths to and from the reactive sites is reduced, lead-ing to enhanced exchange rates and hence - under the conditions of diffusion control – to en-hanced reactivities. It has been demonstrated by MD simulations that under the conditions of multicomponent adsorption different parts of the pore system may in fact accommodate the individual constituents with different probabilities [235, 237]. In recent dynamic MD simula-tions the phenomenon of reactivity enhancement in networks of intersecting channels with mutually excluded accessibility for the reactant and product molecules could in fact be quanti-fied [221, 238] (cf. section 6.2.2).
Fig. 64: Profiles of the integrals of intracrystalline concentration of methanol in ferrierite measured by interference microscopy at different times after the start of the methanol adsorp-tion. The profile measured after 12800 s represent the equilibrium concentration profile. The pressure of methanol vapor in the gas phase surrounding the crystals was kept at 80 mbar dur-ing the measurements. (Ref. [239])
Monitoring the evolution of intracrystalline concentration profiles might be one way of ex-perimentally deciding about the preferred diffusion paths. As an example, Fig. 64 displays the evolution of the distribution of methanol in a ferrierite crystal during adsorption [239]. The
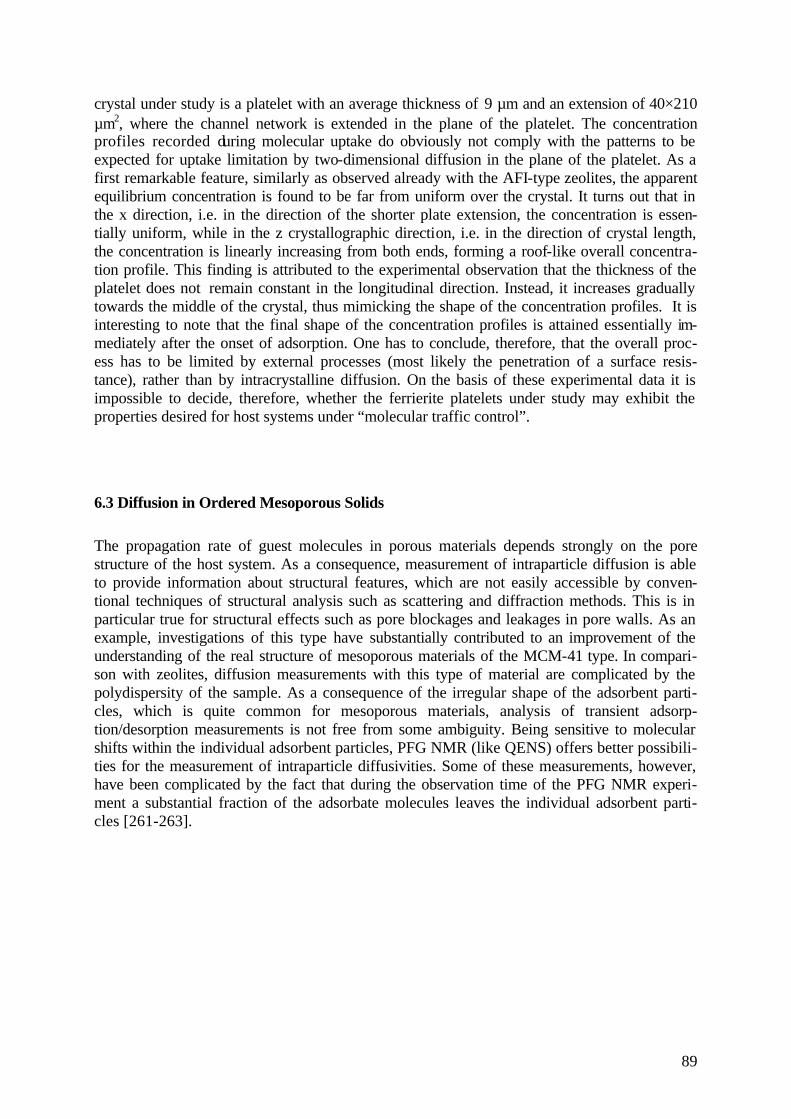
89
crystal under study is a platelet with an average thickness of 9 µm and an extension of 40×210 µm2, where the channel network is extended in the plane of the platelet. The concentration profiles recorded during molecular uptake do obviously not comply with the patterns to be expected for uptake limitation by two-dimensional diffusion in the plane of the platelet. As a first remarkable feature, similarly as observed already with the AFI-type zeolites, the apparent equilibrium concentration is found to be far from uniform over the crystal. It turns out that in the x direction, i.e. in the direction of the shorter plate extension, the concentration is essen-tially uniform, while in the z crystallographic direction, i.e. in the direction of crystal length, the concentration is linearly increasing from both ends, forming a roof-like overall concentra-tion profile. This finding is attributed to the experimental observation that the thickness of the platelet does not remain constant in the longitudinal direction. Instead, it increases gradually towards the middle of the crystal, thus mimicking the shape of the concentration profiles. It is interesting to note that the final shape of the concentration profiles is attained essentially im-mediately after the onset of adsorption. One has to conclude, therefore, that the overall proc-ess has to be limited by external processes (most likely the penetration of a surface resis-tance), rather than by intracrystalline diffusion. On the basis of these experimental data it is impossible to decide, therefore, whether the ferrierite platelets under study may exhibit the properties desired for host systems under “molecular traffic control”.
6.3 Diffusion in Ordered Mesoporous Solids
The propagation rate of guest molecules in porous materials depends strongly on the pore structure of the host system. As a consequence, measurement of intraparticle diffusion is able to provide information about structural features, which are not easily accessible by conven-tional techniques of structural analysis such as scattering and diffraction methods. This is in particular true for structural effects such as pore blockages and leakages in pore walls. As an example, investigations of this type have substantially contributed to an improvement of the understanding of the real structure of mesoporous materials of the MCM-41 type. In compari-son with zeolites, diffusion measurements with this type of material are complicated by the polydispersity of the sample. As a consequence of the irregular shape of the adsorbent parti-cles, which is quite common for mesoporous materials, analysis of transient adsorp-tion/desorption measurements is not free from some ambiguity. Being sensitive to molecular shifts within the individual adsorbent particles, PFG NMR (like QENS) offers better possibili-ties for the measurement of intraparticle diffusivities. Some of these measurements, however, have been complicated by the fact that during the observation time of the PFG NMR experi-ment a substantial fraction of the adsorbate molecules leaves the individual adsorbent parti-cles [261-263].

90
Fig. 65: Dependence of the parallel (? ) and perpendicular ( ? ) components of the axisym-metrical self-diffusion tensor on the inverse temperature for water in MCM-41 as measured at 10 ms observation time with PFG NMR. The dotted lines may be used as a guide for the eyes. For comparison, the full line represents the self-diffusion coefficients of super-cooled bulk liquid water.
In ref. [264] this complication has been circumvented by monitoring the water diffusivity in MCM-41 samples overloaded with water at temperatures below 0 °Celsius. In this way it is possible to find experimental conditions under which the phase of intraparticle water is still mobile, while the ice formed in the space between the particles definitely excludes any ex-change of water molecules between different adsorbent particles. The signal attenuation ob-served in PFG NMR is found to be in excellent agreement with the theoretical fit based on the assumption that intraparticle diffusion is described by an axisymmetrical diffusion tensor. Fig. 65 shows the main elements of the diffusion tensor in comparison with the diffusivities of free water. The larger component, which represents the diffusivity in the direction of the axis of symmetry, has obviously to be attributed to diffusion in the direction of the channels of the MCM-41 structure. Fig. 65 allows the following conclusions: (i) Diffusion along the channels is slower than in the free liquid by about one order of magni-tude, it is obviously inhibited by partial channel blockages. (ii) Though being much smaller than the diffusivity in axis direction, there is also a finite of molecular propagation perpendicular to the channel axes. As the most obvious explanation, the channel walls should therefore be considered as being somewhat permeable to the water molecules. In the PFG NMR studies, molecular confinement within the intraparticle space was used as an independent check of the data compatibility [Fig. 66]. With increasing observation times the diffusion path lengths along the main axes of the diffusion tensor were found to be in satisfac-tory agreement with the particle dimensions.
91
Fig. 66: Dependence of the parallel (full and empty ?) and perpendicular (?,?) components of the mean square displacement on the observation time for water in two MCM-41 samples at 263 K. The mean square displacements were calculated via ( ) Dttz 22 = from the compo-nents of the axisymmetrical self-diffusion tensor. The horizontal lines indicate the limiting values for the axial (full lines) and radial (dotted lines) components of the mean square dis-placements for restricted diffusion in cylindrical rods. The lengths l and diameters d of the rods are written in micrometers on the lines. The oblique lines, which are plotted for short observation times only, represent the calculated time dependences of the mean square dis-placements for unrestricted (free) diffusion with Dpar = 1.0 x 10⁻¹⁰ m2s-1 (full line) and Dperp = 2.0 x 10⁻¹² m2s-1 (dotted line), respectively.
7. Conclusion and Acknowledgement The pulsed field gradient technique of NMR (PFG NMR) enables the measurement of mo-lecular propagation over microscopic scales. The present review illustrates some of the pecu-liarities of molecular propagation under microscopic confinement, which in this way become accessible to direct experimental observation. The examples are taken from the experimental work of our group and focus on features of molecular diffusion in nanoporous solids and in self-organizing macromolecular systems. They are also intended to illustrate the interrelation between experimental evidence and novel theoretical approaches and emphasize the benefit of the use of various, often complementary, techniques, such as, in the given case, interference and IR microscopy. Many processes in nature and technology are based on the special features of molecular trans-port over microscopic dimensions. Their discrimination has to remain, therefore, one of the crucial tasks also in future applied and fundamental research. The present review has been prepared as a contribution to a web-site, devoted to the funda-mentals of diffusion (“diffusion-fundamentals.org”). Nobody of us is able to predict the future development of the traditional media for documenting scientific progress, like hard-copy journals and books. There is no doubt, however, that the relevance of electronic media is still increasing progressively. I am therefore obliged to my colleagues who have succeeded in convincing me to contribute to this development by summarizing the main results of our work in one of the most prosperous subjects of current research by using this novel possibility . It is obvious to anybody who is looking through this contribution that it has to be the result of the diligent work of many more individuals, than I can indicate in this place. Let me confine
92
myself, therefore, to expressing my sincerest thanks to Harry Pfeifer, who – as my supervisor – has directed my interest to this field several decades ago, and to Katrin Kunze and Cordula Krause, who have spent a lot of time for bringing my notes into the form, you have now in front of you on this web-site.
Literature
1. J. Kärger and W. Heink, The Propagator Representation of Molecular Transport in Microporous Crystallites, J. Magn. Reson. 51 (1983) 1-7.
2. H. Weingartner, Self-Diffusion in Liquid Water - a Reassessment, Z. Phys. Chem. - Wiesbaden 132 (1982) 129-149.
3. P. T. Callaghan, "Principles of NMR Microscopy", Clarendon Press, Oxford, (1991).
4. P. T. Callaghan, D. Macgowan, K. J. Packer, and F. O. Zelaya, High-Resolution Q-Space Imaging in Porous Structures, J. Magn. Reson. 90 (1990) 177-182.
5. J. Kärger, A Study of Fast Tracer Desorption in Molecular-Sieve Crystals, AIChE J. 28 (1982) 417-423.
6. J. Kärger and D. M. Ruthven, "Diffusion in Zeolites and Other Microporous Solids", Wiley & Sons, New York, (1992).
7. J. Kärger, H. Pfeifer, and W. Heink, Principles and Application of Self-Diffusion Measurements by Nuclear Magnetic Resonance, Advances in Magn. Reson. 12 (1988) 2-89.
8. E. O. Stejskal and J. E. Tanner, Spin Diffusion Measurements - Spin Echoes in Pres-ence of a Time-Dependent Field Gradient, J. Chem. Phys. 42 (1965) 288.
9. P. Stilbs, Fourier transform pulsed-gradient spin-echo studies of molecular diffusion, Prog. Nucl. Magn. Reson. Spectrosc. 19 (1987) 1-45.
10. V. D. Skirda, M. M. Doroginizkij, V. I. Sundukov, A. I. Maklakov, G. Fleischer, K. G. Hausler, and E. Straube, Detection of Spatial Fluctuations of Segments in Swollen Polybutadiene Networks by Nuclear Magnetic-Resonance Pulsed Field Gradient Technique, Makromolekulare Chemie-Rapid Communications 9 (1988) 603-607.
11. N. K. Bär, J. Kärger, C. Krause, W. Schmitz, and G. Seiffert, Pitfalls in PFG NMR Self-Diffusion Measurements With Powder Samples, J. Magn. Reson. Series A 113 (1995) 278-280.
12. J. Kärger, H. Pfeifer, and S. Rudtsch, The Influence of Internal Magnetic-Field Gradi-ents on NMR Self- Diffusion Measurements of Molecules Adsorbed on Microporous Crystallites, J. Magn. Reson. 85 (1989) 381-387.
13. R. M. Cotts, M. J. R. Hoch, T. Sun, and J. T. Markert, J. Magn. Reson. 83 (1989) 252.
14. W. Heink, J. Kärger, G. Seiffert, G. Fleischer, and J. Rauchfuss, Pfg Nmr Self-Diffusion Measurements with Large Field Gradients, J. Magn. Reson. Series A. 114 (1995) 101-104.
15. P. T. Callaghan, Pgse Massey, a Sequence for Overcoming Phase Instability in Very-High-Gradient Spin-Echo Nmr, J. Magn. Reson. 88 (1990) 493-500.
93
16. P. T. Callaghan and A. Coy, Evidence for Reptational Motion and the Entanglement Tube in Semidilute Polymer Solutions, Phys. Rev. Lett. 68 (1992) 3176-3179.
17. F. Fujara, B. Geil, H. Sillescu, and G. Fleischer, Translational and rotational diffusion in supercooled orthoterphenyl close to the glass transition, Z. Phys. B 88 (1992) 195-204.
18. R. Kimmich, W. Unrath, G. Schnur, and E. Rommel, NMR Measurements of Small Self-Diffusion Coefficients in the Fringe Field of Superconducting Magnets, J. Magn. Reson. 91 (1991) 136-140.
19. I. Y. Chang, F. Fujara, B. Geil, G. Hinze, H. Sillescu, and A. Tolle, New Perspectives of Nmr in Ultrahigh Static Magnetic Field Gradients, J. Non-Cryst. Solids 172 (1994) 674-681.
20. H. Jobic, Diffusion Studies Using Quasi-Elastic Neutron Scattering, in "Recent Ad-vances in Gas Separation by Microporous Ceramic Membranes", (N. K. Kanellopou-los, Eds.), pp. 109-138, Elsevier, Amsterdam, (2000).
21. H. Jobic, M. Bee, J. Kärger, R. S. Vartapetian, C. Balzer, and A. Julbe, Mobility of Cyclohexane in a Microporous Silica Sample - a Quasielastic Neutron Scattering and Nmr Pulsed-Field Gradient Technique Study, J. Membrane Sci. 108 (1995) 71-78.
22. H. Jobic, M. Bee, and G. J. Kearley, Mobility of Methane in Zeolite Nay between 100 and 250 K - a Quasi-Elastic Neutron-Scattering Study, J. Phys. Chem. 98 (1994) 4660-4665.
23. H. Jobic, H. Ernst, W. Heink, J. Kärger, A. Tuel, and M. Bee, Diffusion of ammonia in silicalite studied by QENS and PFG NMR, Microporous Mesoporous Mater. 26 (1998) 67-75.
24. H. Mehrer, "Diffusion in Solid Metals and Alloys", Springer, Berlin, (1990).
25. A. R. Allnatt and A. B. Lidiard, "Atomic Transport in Solids", University Press, Cam-bridge, (1993).
26. H. J. V. Tyrrell and R. K. Harris, "Difusion in Liquids", Butterworth, London, (1984).
27. U. Schemmert, PhD Thesis,
28. J. Schwider, R. Burow, K. E. Elssner, J. Grzanna, R. Spolaczyk, and K. Merkel, Digi-tal Wave-Front Measuring Interferometry - Some Systematic- Error Sources, Appl. Optics 22 (1983) 3421-3432.
29. M. Hermann, W. Niessen, and H. G. Karge, Sorption Kinetics of n-Hexane in MFI-Type Zeolites Investigated by Micro-FTIR Spectroscopy, in "Catalysis by Micropor-ous Materials", (H. K. Beyer, H. G. Karge, I. Kiricsi, and J. B. Nagy, Eds.), pp. 131-138, Elsevier, Amsterdam, (1995).
30. R. Kimmich, "NMR Tomography, Diffusometry, Relaxometry", Springer, Berlin, (1997).
31. B. Blümich, "NMR Imaging of Materials", Clarendon Press, Oxford, (2000).
32. J. Kärger, N. K. Bär, W. Heink, H. Pfeifer, and G. Seiffert, On the Use of Pulsed Field Gradients in a High-Field Nmr Spectrometer to Study Restricted Diffusion in Zeolites, Z. Naturforschung Physical Sciences. 50 (1995) 186-190.
33. R. L. June, A. T. Bell, and D. N. Theodorou, J. Chem. Phys. 95 (1991) 8866.
94
34. M. Hunger, U. Schenk, and A. Buchholz, Mobility of cations and guest compounds in cesium-exchanged and impregnated zeolites Y and X investigated by high-temperature MAS NMR spectroscopy, J. Phys. Chem. B. 104 (2000) 12230-12236.
35. P. Grenier, F. Meunier, P. G. Gray, J. Kärger, Z. Xu, and D. M. Ruthven, Diffusion of Methanol in Nax Crystals - Comparison of Ir, Zlc, and PFG-NMR Measurements, Zeolites 14 (1994) 242-249.
36. R. Trampel, J. Schiller, L. Naji, F. Stallmach, J. Kärger, and K. Arnold, Self-Diffusion of Polymers in Cartilage as Studied by Pulsed Field Gradient NMR, Biophysical Chemistry, Biophys. Chem. 97 (2002) 251-260.
37. S. M. Schoberth, N. K. Bar, R. Kramer, and J. Karger, Pulsed high-field gradient in vivo NMR spectroscopy to measure diffusional water permeability in Corynebacte-rium glutamicum, Anal. Biochem. 279 (2000) 100-105.
38. R. Knauss, J. Schiller, G. Fleischer, J. Karger, and K. Arnold, Self-diffusion of water in cartilage and cartilage components as studied by pulsed field gradient NMR, Magn. Reson. Med. 41 (1999) 285-292.
39. A. Reiche, T. Cramer, G. Fleischer, R. Sandner, B. Sandner, F. Kremer, and J. Karger, Ionic conductivity structure property relationship in gel electrolytes on the basis of oligo(ethyleneglycol)(23) dimethacrylate plasticized with oligo(ethyleneglycol)(11) dimethyl ether, J. Phys. Chem. B 102 (1998) 1861-1869.
40. A. Reiche, G. Dlubek, A. Weinkauf, B. Sandner, H. M. Fretwell, A. A. Alam, G. Fleischer, F. Rittig, J. Karger, and W. Meyer, Local free volume and structure of polymer gel electrolytes on the basis of alternating copolymers, J. Phys. Chem. B 104 (2000) 6397-6407.
41. N. Nestle, A. Qadan, P. Galvosas, W. Suss, and J. Karger, PFG NMR and internal magnetic field gradients in plant-based materials, Magn. Reson. Imaging 20 (2002) 567-573.
42. N. Nestle, C. Zimmermann, M. Dakkouri, and J. Karger, Transient high concentrations of chain anions in hydrating cement - indications from proton spin relaxation meas-urements, J. Phys. D: Appl. Phys. 35 (2002) 166-171.
43. N. Nestle, P. Galvosas, C. Zimmermann, M. Dakkouri, and J. Karger, Nuclear spin relaxation and water self-diffusion in hardening magnesium oxychloride cement, Z. Naturfors. Sect. A-J. Phys. 56 (2001) 561-564.
44. J. Caro, M. Bulow, M. Derewinski, J. Haber, M. Hunger, J. Karger, H. Pfeifer, W. Storek, and B. Zibrowius, NMR and IR Studies of Zeolite H-ZSM-5 Modified with Orthophosphoric Acid, J. Catal. 124 (1990) 367-375.
45. J. Kärger, M. Kocirik, and A. Zikanova, Molecular-Transport through Assemblages of Microporous Particles, J. Colloid Interface Sci. 84 (1981) 240-249.
46. J. E. Tanner and E. O. Stejskal, Restricted Self-Diffusion of Protons in Colloidal Sys-tems by Pulsed-Gradient Spin-Echo Method, J. Chem. Phys. 49 (1968) 1768-&.
47. R. M. Barrer, "Diffusion in Polymers", Academic Press, London, (1968).
48. J. Crank, "The Mathematics of Diffusion", Clarendon Press, Oxford, (1975).
49. R. E. Meredith and C. W. Tobias, Resistance to Potential Flow through a Cubical Ar-ray of Spheres, J. Appl. Phys. 31 (1960) 1270-1273.

95
50. S. C. Cheng and R. I. Vachon, Prediction of Thermal Conductivity of 2-Phase and 3-Phase Solid Heterogeneous Mixtures, Int. J. Heat Mass Transf. 12 (1969) 249-&.
51. S. H. Jury, Transport Phenomena in Heterogeneous Media, J. Frankl. Inst.-Eng. Appl. Math. 305 (1978) 79-98.
52. J. Kärger and H. Pfeifer, NMR-Self-Diffusion Studies in Zeolite Science and Technol-ogy, Zeolites 7 (1987) 90-107.
53. H. Pfeifer, Surface Phenomena Investigated by Nuclear Magnetic Resonance, Phys. Reports 26 (1976) 293-338.
54. H. Stach, thesis "Thesis Prom. B", Academy of Sciences, Berlin, (1977)
55. J. Kärger, A. Zikanova, and M. Kocirik, NMR Study of the Influence of a Carrier Gas on Zeolitic Diffusion, Z. Phys. Chem. (Leipzig) 265 (1984) 587-592.
56. H. Thamm, thesis "Thesis Promotion A", Academy of Sciences, Berlin, (1975)
57. H. Ernst and H. Pfeifer, Synthesis of Methylamines Studied by Insitu C-13 MAS NMR- Spectroscopy, J. Catal. 136 (1992) 202-208.
58. J. Kärger, M. Bülow, and P. Lorenz, NMR Self-Diffusion Measurements in n-Heptane-Benzene Mixtures Adsorbed on NaX zeolites, J. Coll. Interf. Sci. 65 (1978) 181-185.
59. P. Lorenz, M. Bülow, and J. Karger, Self-Diffusion Behavior of Normal-Heptane Benzene Mixtures in the Intercrystalline Space of Packings of Nax Zeolite Crystals as Observed by the Nmr Pulsed Field Gradient Technique, Coll. Surf. 11 (1984) 353-364.
60. P. Lorenz, M. Bülow, and J. Kärger, Untersuchung zur Selbstdiffusion von n-Heptan-Benzen-Gemischen adsorbiert am Zeolith NaX mit Hilfe der NMR-Feldgradienten-impulstechnik, Izv. Akad. Nauk SSSR, Ser. Khim (1980) 1741.
61. M. Bülow, W. Schirmer, and Grossman.A, Adsorption of Binary Gas-Mixtures on Solid Surfaces - Possible Determination of Equilibrium Parameters of Mixtures on Ba-sis of Corresponding Individual Gas Adsorption Equilibria, Z. Chem. 12 (1972) 161-&.
62. O. Geier, S. Vasenkov, and J. Karger, Pulsed field gradient nuclear magnetic reso-nance study of long- range diffusion in beds of NaX zeolite: Evidence for different ap-parent tortuosity factors in the Knudsen and bulk regimes, J. Chem. Phys. 117 (2002) 1935-1938.
63. P. Levitz, Knudsen Diffusion and Excitation Transfer in Random Porous- Media, J. Phys. Chem. 97 (1993) 3813-3818.
64. K. Malek and M. O. Coppens, Effects of surface roughness on self- and transport dif-fusion in porous media in the Knudsen regime, Phys. Rev. Lett. 8712 (2001) art. no.-125505.
65. V. N. Burganos, Gas diffusion in random binary media, J. Chem. Phys. 109 (1998) 6772-6779.
66. S. Spange, A. Graser, H. Muller, Y. Zimmermann, P. Rehak, C. Jager, H. Fuess, and C. Baehtz, Synthesis of inorganic/organic host-guest hybrid materials by cationic vinyl polymerization within Y zeolites and MCM-41, Chem. Mat. 13 (2001) 3698-3708.

96
67. C. Krause, F. Stallmach, D. Hönicke, S. Spange, and J. Kärger, A surprising drop of the diffusivities of benzene in a mesoporous material of type MCM-41 at medium pore filling factors, Adsorption 9 (2003) 235-241.
68. P. Heitjans and J. Kärger, "Diffusion in Condensed Matter: From the Elementary Step to Transport in Complex Systems", Springer, Heidelberg, (2003).
69. J. Kärger, P. Heitjans, and R. Haberlandt, "Diffusion in Condensed Matter", Vieweg, Braunschweig/Wiesbaden, (1998).
70. A. C. Dieng, L. Lavielle, and G. Riess, Self-lubricating properties of polystyrene-polydimethylsiloxane two-phase materials, New Polym. Mater 5 (1996) 13-24.
71. M. Appel, G. Fleischer, J. Kärger, A. C. Dieng, and G. Riess, Investigation of the Re-stricted Diffusion in Spherical Cavities of Polymers By Pulsed Field Gradient Nuclear Magnetic Resonance, Macromolecules. 28 (1995) 2345-2350.
72. A. PP, "Akzo Nobel", Wuppertal, Germany.
73. M. Appel, G. Fleischer, J. Kärger, F. Fujara, and S. Siegel, Nmr Evidence of Anoma-lous Molecular Diffusion Due to Structural Confinement, Europhys. Lett. 34 (1996) 483-487.
74. M. Doi and S. F. Ewards, "The Theory of Polymer Dynamics", Oxford, (1986).
75. R. G. de Gennes, Reptation of a Polymer Chain in the Presence of Fixed Obstacles, J. Chem. Phys. 55 (1971) 572-579.
76. J. Kärger, A Straightforward Derivation of the Long-Time Limit of the Mean Square Displacement in Single-File Systems, Phys. Rev. A 45 (1992) 4173-4174.
77. J. Kärger, Long-Time Limit of the Self-Correlation-Function of One-Dimensional Diffusion, Phys. Rev. E 47 (1993) 1427-1428.
78. S. Pahl, G. Fleischer, F. Fujara, and B. Geil, Anomalous segment diffusion in polydi-methylsiloxane melts, Macromolecules 30 (1997) 1414-1418.
79. G. Fleischer and F. Fujara, Segmental Diffusion in Polymer Melts and Solutions of Poly(ethylene Oxide) Measured with Field Gradient NMR in High-Field Gradients, Macromolecules 25 (1992) 4210-4212.
80. F. S. Bates and G. H. Fredrickson, Block Copolymer Thermodynamics - Theory and Experiment, Annu. Rev. Phys. Chem. 41 (1990) 525-557.
81. H. Scheller, G. Fleischer, and J. Kärger, Restricted Self-Diffusion in an Aqueous Solu-tion of Poly(Ethylene Oxide) Poly(Propylene Oxide) Poly(Ethylene Oxide) Triblock Copolymer, Colloid Polym. Sci. 275 (1997) 730-735.
82. H. Scheller, thesis "PhD Thesis",
83. K. Mortensen and W. Brown, Poly(Ethylene Oxide)-Poly(Propylene Oxide)-Poly(Ethylene Oxide) Triblock Copolymers in Aqueous-Solution - the Influence of Relative Block Size, Macromolecules 26 (1993) 4128-4135.
84. G. Fleischer, Micellization in Aqueous-Solution of a Poly(Ethylene Oxide) Poly(Propylene Oxide) Poly(Ethylene Oxide) Triblock Copolymer Investigated with Pulsed Field Gradient Nmr, J. Phys. Chem. 97 (1993) 517-521.
85. K. Mortensen, Structural studies of aqueous solutions of PEO-PPO-PEO triblock co-polymers, their micellar aggregates and mesophases; A small- angle neutron scattering study, J. Phys.-Condes. Matter 8 (1996) A103-A124.

97
86. S. Gröger, F. Rittig, F. Stallmach, K. Almdal, P. Stepanek, and C. M. Papadakis, A pulsde field gradient nuclear magnetic resonance study of a ternary homopoly-mer/diblock copolymer blend in the bicontinuous microemulsion phase, J. Chem. Phys. 117 (2002) 396-406.
87. T. L. Morkved, B. R. Chapman, F. S. Bates, T. P. Lodge, P. Stepanek, and K. Almdal, Dynamics of ternary polymer blends: Disordered, ordered and bicontinuous microe-mulsion phases, Faraday Discuss. (1999) 335-350.
88. J. Brandrup, E. H. Immergut, and E. A. Grulke, "Polymer Handbook", Wiley, New York, (1999).
89. T. L. Morkved, P. Stepanek, K. Krishnan, F. S. Bates, and T. P. Lodge, Static and dy-namic scattering from ternary polymer blends: Bicontinuous microemulsions, Lifshitz lines, and amphiphilicity, J. Chem. Phys. 114 (2001) 7247-7259.
90. U. Hong, J. Kärger, and H. Pfeifer, Slective Two-Component Self-Diffusion Meas-urement of Adsorbed Molecules by Pulsed Field Gradient Fourier Transform NMR, J. Am. Chem. Soc. 113 (1991) 4812-4815.
91. J. Kärger, A Study of Fast Tracer Desorption in Molecular Sieve Crystals, CIChE Journal 28 (1982) 417-423.
92. D. M. Ruthven, "Principles of Adsorption and Adsorption Processes", New York, (1984).
93. R. Richter, thesis "Thesis Promotion A", Leipzig University, (1983)
94. R. Richter, R. Seidel, J. Karger, W. Heink, H. Pfeifer, H. Furtig, W. Hose, and W. Roscher, Molecular-Transport in Granulated Zeolite Nacaa .1. Application of the Nmr Pulsed Field Gradient Technique and the Limiting Steps of Molecular-Transport, Z. Phys. Chem. - Leipzig 267 (1986) 841-850.
95. S. Rudtsch, thesis "Diploma Thesis", Leipzig University, (1988)
96. J. Kärger and H. Pfeifer, Transport-Properties of Molecular-Sieves Studied by the Nmr Pulsed Field Gradient Technique, ACS Symposium Series 368 (1988) 376-396.
97. J. Kärger, Ruthven, D.M., On the Comparison between Macroscopic and NMR Meas-urements of Intracrystalline Diffusion in Zeolites, Zeolites 9 (1989) 267-281.
98. G. T. Kerr, Chemistry of Crystalline Aluminosilicates .7. Thermal Decomposition Products of Ammonium Zeolite Y, J. Catal. 15 (1969) 200-&.
99. E. F. Kondis and J. S. Dranoff, Kinetics of Isothermal Sorption of Ethane on 4a Mo-lecular Sieve Pellets, Ind. Eng. Chem. Proc. DD 10 (1971) 108-&.
100. J. Kärger, H. Pfeifer, R. Seidel, B. Staudte, and T. Gross, Investigation of Surface Bar-riers on Canaa Type Zeolites by Combined Application of the Nmr Tracer Desorption Method and X- Ray Photoelectron-Spectroscopy, Zeolites 7 (1987) 282-284.
101. J. Kärger, H. Pfeifer, R. Richter, H. Fürtig, W. Roscher, and R. Seidel, NMR Study of Mass Transfer in Granulated Molecular Sieves, AICHE J. 34 (1988) 1185-1189.
102. J. Kärger, H. Pfeifer, F. Stallmach, M. Bulow, P. Struve, R. Entner, H. Spindler, and R. Seidel, Influence of Molecular Shape on Probing Mass-Transfer Resistances on Zeolites, AICHE J. 36 (1990) 1500-1504.
103. R. Richter, R. Seidel, J. Kärger, H. Heink, H. Pfeifer, H. Fürtig, W. Höse, and W. Ro-scher, Molecular-Transport in Granulated Zeolite NACAA .2. Sieve Deterioration by
98
Hydrothermal Treatment and by Contact With Hydrocarbons, Z Phys. Chem. - Leipzig 267 (1986) 1145-1151.
104. J. Kärger, H. Pfeifer, J. Caro, M. Bulow, H. Schlodder, R. Mostowicz, and J. Volter, Controlled Coke Deposition on Zeolite Zsm5 and Its Influence on Molecular-Transport, Appl. Catal. 29 (1987) 21-30.
105. J. Völter, J. Caro, M. Bulow, B. Fahlke, J. Karger, and M. Hunger, Diffusion, Crack-ing and Coking on HZSM-5 of Various Morphologies, Appl. Catal. 42 (1988) 15-27.
106. J. Kärger, H. Pfeifer, J. Caro, M. Bulow, J. Richtermendau, B. Fahlke, and L. V. C. Rees, Comparison of Molecular-Transport in ZSM-5 Crystals of Different Habit, Appl. Catal. 24 (1986) 187-198.
107. P. P. Mitra, P. N. Sen, and L. M. Schwartz, Short-Time Behavior of the Diffusion-Coefficient as a Geometrical Probe of Porous-Media, Phys. Rev. B 47 (1993) 8565-8574.
108. P. P. Mitra, P. N. Sen, L. M. Schwartz, and P. Ledoussal, Diffusion Propagator as a Probe of the Structure of Porous- Media, Phys. Rev. Lett. 68 (1992) 3555-3558.
109. P. P. Mitra and P. N. Sen, Effects of Microgeometry and Surface Relaxation on Nmr Pulsed- Field-Gradient Experiments - Simple Pore Geometries, Physical Review B 45 (1992) 143-156.
110. S. Frey, J. Karger, H. Pfeifer, and P. Walther, Nmr Self-Diffusion Measurements in Regions Confined by Absorbing Walls, J. Magn. Reson. 79 (1988) 336-342.
111. O. Geier, R. Q. Snurr, F. Stallmach, and J. Kärger, Boundary Effects of Molecular Diffusion in Nanoporous Materials: an Pulsed Field Gradient Nuclear Magnetic Reso-nance Study, submitted, J. Chem. Phys.
112. F. Stallmach, C. Vogt, J. Karger, K. Helbig, and F. Jacobs, Fractal geometry of surface areas of sand grains probed by pulsed field gradient NMR, Phys. Rev. Lett. 88 (2002) art. no.-105505.
113. F. Stallmach and J. Karger, Using NMR to measure fractal dimensions - Reply, Phys. Rev. Lett. 90 (2003) art. no.-039602.
114. D. Avnir, D. Farin, and P. Pfeifer, Surface Geometric Irregularity of Particulate Mate-rials - the Fractal Approach, J. Colloid Interface Sci. 103 (1985) 112-123.
115. D. Candela and P. Z. Wong, Using NMR to measure fractal dimensions, Physical Re-view Letters 90 (2003) art. no.-039601.
116. F. J. Keil, R. Krishna, and M. O. Coppens, Modeling of Diffusion in Zeolites, Rev. Chem. Engin. 16 (2000) 71-197.
117. D. N. Theodorou, R. Q. Snurr, and A. T. Bell, Molecular Dynamics and Diffusion in Microporous Materials, in "Comprehensive Supramolecular Chemistry", (G. Alberti, and T. Bein, Eds.), pp. 507-548, Oxford, (1996).
118. S. Fritzsche, R. Haberlandt, G. Hofmann, J. Kärger, K. Heinzinger, and M. Wolfsberg, An MD Study on the Diffusion of Methane in a Cation-Free LTA Zeolite - Illustra-tions and New Results, Chem. Phys. Lett. 265 (1997) 253-258.
119. F. J. Keil, Diffusion and Reaction in Porous Networks, Catal. Today 53 (1999) 245-258.
99
120. J. Hinderer and F. J. Keil, Three-Dimensional Monte Carlo Calculations of Diffusion and Reaction Phenomena in Zeolite, Chem. Eng. Sci. 51 (1996) 2667-2672.
121. A. Tiselius, Nature 133 (1933) 212.
122. A. Tiselius, J. Phys. Chem. 40 (1936) 223.
123. R. M. Barrer, Intracrystalline Diffusion, Advan. Chem. Ser. (1971) 1-&.
124. D. M. Ruthven, M. Eic, and E. Richard, Diffusion of C-8 Aromatic-Hydrocarbons in Silicalite, Zeolites 11 (1991) 647-653.
125. U. Hong, J. Kärger, R. Kramer, H. Pfeifer, G. Seiffert, U. Müller, K. K. Unger, H. B. Lück, and T. Ito, PFG NMR Study of Diffusion Anisotropy in Oriented ZSM-5 Type Zeolite Crystallies, Zeolites 11 (1991) 816-821.
126. P. T. Callaghan, Pulsed Field Gradient Nuclear Magnetic-Resonance as a Probe of Liquid-State Molecular-Organization, Aust. J. Phys. 37 (1984) 359-387.
127. B. Zibrowius, J. Caro, and J. Karger, Application of Nmr-Spectroscopy to Study Dif-fusion Anisotropy in Polycrystalline Samples, Z. Phys. Chem. - Leipzig 269 (1988) 1101-1106.
128. J. Kärger, Random Walk through Two-Channel Networks: A Simple Means to Corre-late the Coefficients of Anisotropic Diffusion in ZSM-5 Type Zeolite, J. Phys. Chem. 95 (1991) 5558-5560.
129. U. Hong, J. Kärger, H. Pfeifer, U. Müller, and K. K. Unger, Observing Diffusion Ani-sotropy in Zeolites by Pulsed Field Gradient NMR, Z. Phys. Chem. 173 (1991) 225-234.
130. S. Jost, N. K. Bär, S. Fritzsche, R. Haberlandt, and J. Kärger, Diffusion of a Mixture of Methane and Xenon in Silicalite: A Molecular Dynamics Study and Pulsed Field Gradient Nuclear Magnetic Resonance Experiments, J. Phys. Chem. B. 102 (1998) 6375-6381.
131. J. Caro, M. Noack, F. Marlow, D. Peterson, M. Griepenstrog, and J. J. Kornatowksi, Selective Sorption Uptake Kinetics of n-Hexane on ZSM-5. A New Method for Meas-uring Anitsotropic Diffusivities, J. Phys. Chem. 97 (1993) 13685-13690.
132. E. J. Maginn, A. T. Bell, and D. N. Theodorou, Dynamics of Long n-Alkanes in Sili-calite - a Hierarchical Simulation Approach, Journal of Physical Chemistry. 100 (1996) 7155-7173.
133. S. Fritzsche and J. Kärger, Memory Effects in Correlated Anisotropic Diffusion, Eu-rophys. Lett. 63 (2003) 465-471.
134. S. Fritzsche and J. Kärger, Tracing memory effects in correlated diffusion anisotropy in MFI-type zeolites by MD simulation, J. Phys. Chem. B 107 (2003) 3515-3521.
135. D. Shen and L. V. C. Rees, Adsorption and Diffusion of n-Butane and 2-Butyne in Silicalite-1, Zeolites 11 (1991) 684-689.
136. D. Shen and L. V. C. Rees, Analysis of Bimodal Frequency-Response Behaviour of p-Xylene Diffusion in Silicalite-1, J. Chem. Soc. Faraday Trans. 91 (1995) 2027-2033.
137. S. Brandani, M. Jama, and D. Ruthven, Diffusion, Self-Diffusion and Counter-Diffusion of Benzene and p-Xylene in Silicalite, Microporous Mesoporous Mater. 6 (2000) 283-300.

100
138. J. Kärger and H. Pfeifer, On the Interdependence of the Principal Values of the Diffu-sion Tensor in Zeolites with Channel Networks, Zeolites 12 (1992) 872-873.
139. N. K. Bär, J. Kärger, H. Pfeifer, H. Schäfer, and W. Schmitz, Diffusion Anisotropy in Natural Chabazite, Microporous Mesoporous Mater. 22 (1998) 289-295.
140. C. Forste, A. Germanus, J. Karger, G. Mobius, M. Bulow, S. P. Zdanov, and N. N. Feoktistova, Application of Deuterated Molecules for the Determination of Self-Diffusion Coefficients at 2-Component Adsorption in Zeolites by Nmr-Spectroscopy, Isotopenpraxis 25 (1989) 48-52.
141. D. L. Wernick and E. J. Osterhuber, Diffusional Translation in Zeolite NaX: 1. Single Crystal Gas Permeation Studies, 6th International Zeolite Conference, Guildford (1984).
142. O. H. Tezel, D. M. Ruthven, and D. L. Wernick, Proc. 6th International Zeolite Con-ference, 6th International Zeolite Conference, Guildford (1984).
143. R. Ash and R. M. Barrer, Mechanisms of Surface Flow, Surf. Sci. 8 (1967) 461-&.
144. T. L. James and G. G. McDonald, Measurement of Self-Diffusion Coefficient of Each Component in a Complex System Using Pulsed-Gradient Fourier-Transform Nmr, J. Magn. Reson. 11 (1973) 58-61.
145. P. Stilbs and M. E. Moseley, Nuclear Spin-Echo Experiments on Standard Fourier-Transform Nmr Spectrometers - Application to Multicomponent Self-Diffusion Stud-ies, Chem. Scr. 13 (1979) 26-28.
146. P. Stilbs, M. E. Moseley, and B. Lindman, Fourier-Transform Nmr Self-Diffusion Measurements on Micro- Emulsions, J. Magn. Reson. 40 (1980) 401-404.
147. K. P. Datema, C. J. J. Denouden, W. D. Ylstra, H. Kuipers, M. F. M. Post, and J. Kar-ger, Fourier-Transform Pulsed-Field-Gradient H-1 Nuclear-Magnetic- Resonance In-vestigation of the Diffusion of Light Normal- Alkanes in Zeolite Zsm-5, J. Chem. Soc.-Faraday Trans. 87 (1991) 1935-1943.
148. A. Germanus, J. Kärger, H. Pfeifer, N. N. Samulevich, and S. P. Zhdanov, Intracrys-talline Self-Diffusion of Benzene, Toluene and Xylene Isomers in Zeolites Na-X, Zeo-lites 5 (1985) 91-95.
149. A. Germanus, J. Karger, and H. Pfeifer, Self-Diffusion of Paraffins and Olefins in Zeolite Na-X under the Influence of Residual Water-Molecules, Zeolites 4 (1984) 188-190.
150. P. Galvosas, F. Stallmach, G. Seiffert, J. Kärger, U. Kaess, and G. Majer, Generation and Application of Ultra-High-Intensity Magnetic Field Gradient Pulses for NMR Spectroscopy, J. Magn. Reson. 151 (2001) 260-268.
151. P. Galvosas, S. Gröger, and F. Stallmach, in preparation,
152. E. J. Cabrita, S. Berger, P. Brauer, and J. Karger, High-resolution DOSY NMR with spins in different chemical surroundings: Influence of particle exchange, J. Magn. Reson. 157 (2002) 124-131.
153. S. S. Nirvarthi and A. V. McCormick, Diffusion of Coadsorbed Molecules in Zeolites - a Pulsed Field Gradient Nmr Study, J. Phys. Chem. 99 (1995) 4661-4666.
154. A. Paravar and D. T. Hayhurst, Direct Measurement of Diffusivity for Butane across a Single Large Silicalite Crystal, 6th International Zeolite Conference, Guildford (1994).

101
155. D. Ruthven, Fundamentals of diffusion in porous and microporous solids, in "Physical Adsorption: Experiment, Theory and Applications", (J. Fraissard, and C. W. Conner, Eds.), pp. 241-260, Kluwer Academic Publishers, Dordrecht/Boston/London, (1997).
156. D. Ruthven and S. Brandani, Measurement of diffusion in microporous solids by mac-roscopic methods, in "Physical Adsorption: Experiment, Theory and Applications", (J. Fraissard, and C. W. Conner, Eds.), pp. 261-196, Kluwer Academic Press, Dordrecht/Boston/London, (1997).
157. D. Ruthven, in "Zeolites: a refined tool for designing catalytic sites", (L. Bonneviot, and S. Kaliaguine, Eds.), pp. 223, Elsevier, Amsterdam, (1996).
158. M. Bülow and A. Micke, Determination of Transport Coefficients in Microporous Solids, Adsorption 1 (1995) 29-48.
159. H. G. Karge and W. Niessen, A New Method for the Study of Diffusion and Counter Diffusion in Zeolites, Cat. Today 8 (1991) 451-465.
160. H. G. Niessen and H. G. Karge, Adsorption 1 (1993) 1.
161. J. Kärger, H. Pfeifer, T. Wutscherk, S. Ernst, J. Weitkamp, and J. Fraissard, Direct Observation of Intracrystalline Transport Diffusion in Zeolites by Xenon-129 NMR, J. Phys. Chem. 96 (1992) 5059-5063.
162. M. A. Springuel-Huet, A. Nosov, J. Kärger, and J. Fraissard, Xe-129 NMR Study of the Bed Resistance to Molecular Transport in Assemblages of Zeolite Crystallites, J. Phys. Chem. 100 (1996) 7200-7203.
163. A. Dyer and A. M. Yosof, Diffusion in Heteroionic Analcimes: Part 1. Sodium-Potassium-Water System, Zeolites 7 (1987) 191-196.
164. A. Dyer and R. P. Towsend, Mobility of Cations in Synthetic Zeolites with Faujasite Framework. 5.Self-Diffusion of Zinc into X and Y Zeolites, J.Inorg. Nucl. Chem. 35 (1973) 3001-3008.
165. A. Einstein, Über die von der molekularkinetischen Theorie der Wärme geforderte Bewegung von in ruhenden Flüssigkeiten suspendierten Teilchen, Ann. Phys. 17 (1905) 549-560.
166. H. Jobic, "Catalyst Characterization: Physical Techniques for Solid Materials", Imelik, B., Vedrine, J.C., New York, (1994).
167. D. J. Evans and P. G. Morris, "Statistical Mechanics of Nonequilibrium Liquids", Academic Press, London, (1990).
168. I. L. Moudrakovski, A. Sanchez, C. I. Ratcliffe, and J. A. Ripmeester, Applications of hyperpolarized xenon to diffusion in vycor porous glass, J. Phys. Chem. B. 104 (2000) 7306-7310.
169. E. J. Maginn, A. T. Bell, and D. N. Theodorou, Transport Diffusivity of Methane in Silicalite from Equilibrium and Nonequilibrium Simulations, J. Phys. Chem. 97 (1993) 4173-4181.
170. J. Kärger and D. Ruthven, Diffusion and Adsorption in Porous Solids, in "Handbook of Porous Solids", (F. Schüth, K. S. W. Sing, and J. Weitkamp, Eds.), pp. 2089-2173, Wiley-VCH, Wienheim, (2002).
171. R. L. June, A. T. Bell, and D. N. Theodorou, A Molecular Dynamics Study of Mehane and Xenon in Silicalite, J. Phys. Chem. 94 (1990) 8232-8240.

102
172. L. Onsager, Reciprocal Relations in Irreversible Processes, Phys. Rev. 37 (1931) 405-426.
173. S. Will and A. Leipertz, Diffusion Measurements by Dynamic Light Scattering, in "Diffusion in Condensed Matter", (J. Kärger, P. Heitjans, and R. Haberlandt, Eds.), pp. 219-244, Vieweg, Springer, Braunschweig, Wiesbaden, (1998).
174. W. O. Haag, R. M. Lago, and P. B. Weisz, Transport and Reactivity of Hydrocarbon Molecules in a Shape-Selective Zeolite, Faraday Disc. 72 (1981) 317-330.
175. M. Post, Diffusion in Zeolite Molecular Sieves, in "Introduction to Zeolite Science and Practice", (H. van Bekkum, E. M. Flanigen, and J. C. Jansen, Eds.), pp. 391-443, El-sevier, Amsterdam, (1991).
176. N. Y. Chen, T. F. Degnan, and C. M. Smith, "Molecular Transport and Reaction in Zeolites", New York, (1994).
177. F. Keil, "Diffusion und Chemische Reaktion in der Gas/Feststoff-Katalyse", Berlin, (1999).
178. L. V. C. Rees, Exciting New Advances in Diffusion of Sorbates in Zeolites and Mi-croporous Materials, in "Zeolites and Related Microporous Materials: State of the Art 1994", (J. Weitkamp, H. G. Karge, H. Pfeifer, and W. Hölderich, Eds.), pp. 1133-1150, Elsevier, Amsterdam, (1994).
179. D. M. Ruthven and L. K. Lee, Kinetics of Nonisothermal Sorption: Systems with Bed Diffusion Control, AIChE J. 27 (1981) 654-663.
180. D. Prinz and L. Riekert, Observation of Rates of Sorption and Diffusion in Zeolite Crystals at Constant Temperature and Pressure, Ber. Bunsenges. Phys. Chem. 90 (1986) 413-420.
181. M. Bülow, P. Struve, W. Mietk, and M. Kocirik, Experimental Evidence of the Influ-ence of Sorption-heat Release Processes on the Sorption Kinetics of Benzene in NaX Zeolite Crystals, J. Chem. Soc. Faraday Trans. I 80 (1984) 813-822.
182. J. Kärger and D. M. Ruthven, Diffusion in Zeolites, J. Chem. Soc. Faraday Trans. I 77 (1981) 1485-1496.
183. S. Brandani, D. M. Ruthven, and J. Kärger, Concentration Dependence of Self-Diffusivity of Methanol in NaX Zeolite Crystals, Zeolites 15 (1995) 494-495.
184. L. V. C. Rees and L. Song, Frequency Response Methods for the Characterization of Microporous Solids, in "Recent Advances in Gas Separation by Microporous Ceramic Membranes", (N. K. Kanellopoulos, Eds.), pp. 139-186, Elsevier, Amsterdam, (2000).
185. H. Jobic and A. N. Fitch, Diffusion of Benzene in NaX and NaY Zeolites Studied by Quasi-Elastic Neutron Scattering, J. Phys. Chem. B 104 (2000) 8491-8497.
186. S. Brandani, Z. Xu, and D. M. Ruthven, Transport Diffusion and Self-Diffusion of Benzene in NaX and CaX Zeolite Crystal Studied by ZLC and Tracer ZLC Method, Microporous Mater. 7 (1996) 323-331.
187. M. Eic and D. M. Ruthven, Intracrystalline Diffusion of Linear Paraffins and Benzene in Silicalite Studied by the ZLC Method, in "Zeolites: Facts, Figures, Future", (P. A. Jacobs, and R. A. van Santen, Eds.), pp. 897-906, Elsevier, Amsterdam, (1989).
188. M. Eic and D. M. Ruthven, Diffusion of Linear Paraffins and Cyclohexane in NaX and 5A Zeolite Crystals, Zeolites 8 (1988) 472-479.

103
189. S. Vasenkov, W. Böhlmann, P. Galvosas, O. Geier, H. Liu, and J. Kärger, PFG NMR Study of Diffusion in MFI-Type Zeolites: Evidence of the Existence of Intracrystalline Transport Barriers, J. Phys. Chem. B. 105 (2001) 5922-5927.
190. J. Kärger, R. Danz, and J. Caro, Anwendung der Interferenzmikroskopie bei der Beo-bachtung intrakristalliner Transportvorgänge, Feingerätetechnik 27 (1978) 539-542.
191. U. Schemmert, J. Kärger, and J. Weitkamp, Interference Microscopy as a Technique for Directly Measuring Intracrystalline Transport Diffusion in Zeolites, Microporous Mesoporous Mater. 32 (1999) 101-110.
192. U. Schemmert, J. Kärger, C. Krause, R. A. Rakoczy, and J. Weitkamp, Monitoring the Evolution of Intracrystalline Concentration, Europhys. Lett. 46 (1999) 204-210.
193. C. Weidenthaler, R. X. Fischer, R. D. Shannon, and O. Medenbach, Optical Investiga-tions of Intergrowth Effects in the Zeolite Catalysts ZSM-5 and ZSM-8, J. Phys. Chem. 98 (1994) 12687-12694.
194. M. Kocirik, J. Kornatowski, V. Masarik, P. Novak, A. Zikanova, and J. Maixner, In-vestigation of sorption and transport of sorbate molecules in crystals of MFI structure type by iodine indicator technique, Microporous Mesoporous Mat. 23 (1998) 295-308.
195. E. R. Geus, J. C. Jansen, and H. Vanbekkum, Calcination of Large Mfi-Type Single-Crystals .1. Evidence for the Occurrence of Consecutive Growth Forms and Possible Diffusion-Barriers Arising Thereof, Zeolites 14 (1994) 82-88.
196. O. Geier, S. Vasenkov, E. Lehmann, J. Kärger, U. Schemmert, R. A. Rakoczy, and J. Weitkamp, Interference Microscopy Investigation of the Influence of Regular Inter-growth Effects in MFI-Type Zeolites on Molecular Uptake, J. Phys. Chem. B 105 (2001) 10217-10222.
197. T. J. H. Vlugt, C. Dellago, and B. Smit, Diffusion of isobutane in silicalite studied by transition path sampling, J. Chem. Phys. 113 (2000) 8791-8799.
198. R. Ravishankar, C. E. A. Kirschhock, P. P. Knops-Gerrits, E. J. P. Feijen, P. J. Grobet, P. Vanoppen, F. C. De Schryver, G. Miehe, H. Fuess, B. J. Schoeman, P. A. Jacobs, and J. A. Martens, Characterization of nanosized material extracted from clear suspen-sions for MFI zeolite synthesis, J. Phys. Chem. B 103 (1999) 4960-4964.
199. C. E. A. Kirschhock, R. Ravishankar, F. Verspeurt, P. J. Grobet, P. A. Jacobs, and J. A. Martens, Identification of precursor species in the formation of MFI zeolite in the TPAOH-TEOS-H2O system, J. Phys. Chem. B 103 (1999) 4965-4971.
200. C. E. A. Kirschhock, R. Ravishankar, L. Van Looveren, P. A. Jacobs, and J. A. Mar-tens, Mechanism of transformation of precursors into nanoslabs in the early stages of MFI and MEL zeolite formation from TPAOH-TEOS- H2O and TBAOH-TEOS-H2O mixtures, J. Phys. Chem. B 103 (1999) 4972-4978.
201. P. P. E. A. de Moor, T. P. M. Beelen, B. U. Komanschek, O. Diat, and A. vanSanten, In situ investigation of Si-TPA-MFI crystallization using (ultra-) small- and wide-angle X-ray scattering, J. Phys. Chem. B 101 (1997) 11077-11086.
202. P. de Moor, T. P. M. Beelen, B. U. Komanschek, and R. A. van Santen, Nanometer scale precursors in the crystallization of Si-TPA-MFI, Microporous Mesoporous Ma-ter. 21 (1998) 263-269.
203. S. Vasenkov and J. Karger, Evidence for the existence of intracrystalline transport barriers in MFI-type zeolites: a model consistency check using MC simulations, Mi-croporous Mesoporous Mat. 55 (2002) 139-145.
104
204. E. Neher, Ion Channels for Communication Between and Within Cells, Science 256 (1992) 498-502.
205. B. Sakmann, Elementary Steps in Synaptic Transmission Revealed by Currents Through Single Ion Channels, Science 256 (1992) 503-512.
206. J. Kärger, M. Petzold, H. Pfeifer, S. Ernst, and J. Weitkamp, Single-File Diffusion and Reaction in Zeolites, J. Catal. 136 (1992) 283-299.
207. P. A. Fedders, Two-Point Correlation Functions for a Distinguishable Particle Hop-ping on a Uniform One-Dimensional Chain, Phys. Rev. B 17 (1978) 40-46.
208. L. Riekert, Sorption, Diffusion, and Catalytic Reaction in Zeolites, Adv. Catal. 21 (1970) 281-322.
209. C. Baerlocher, W. M. Meier, and D. H. Olson, (Elsevier, Amsterdam, 2001), p. 302.
210. V. Gupta, S. S. Nivarthi, A. V. McCormick, and H. T. Davis, Evidence For Single File Diffusion of Ethane in the Molecular Sieve AlPO4-5, Chem. Phys. Lett. 247 (1995) 596-600.
211. K. Hahn, J. Karger, and V. Kukla, Single-File Diffusion Observation, Phys. Rev. Lett. 76 (1996) 2762-2765.
212. V. Kukla, J. Kornatowski, D. Demuth, I. Gimus, H. Pfeifer, L. V. C. Rees, S. Schunk, K. K. Unger, and J. Kärger, Nmr Studies of Single-File Diffusion in Unidimensional Channel Zeolites, Science. 272 (1996) 702-704.
213. E. Lehmann, C. Chmelik, H. Scheidt, S. Vasenkov, B. Staudte, J. Kärger, F. Kremer, G. Zadrozna, and J. Kornatowski, Regular Intergrowth in the AFI Type Crystals: In-fluence on the Intracrystalline Adsorbate Distribution as Observed by Interference and FTIR-Microscopy, J. Amer. Chem. Soc. 124 (2002) 8690-8692.
214. K. Hahn and J. Kärger, Deviations from the Normal Time Regime of Single-File Dif-fusion, J. Phys. Chem. 102 (1998) 5766-5771.
215. P. H. Nelson and S. M. Auerbach, Self-Diffusion in Single-File Zeolite Membranes is Fickian at Long Times, J. Chem. Phys. 110 (1999) 9235-9243.
216. P. H. Nelson and S. M. Auerbach, Modeling Tracer Counter-Permeation through Ani-sotropic Zeolite Membranes: From Mean-Field Theory to Single-File Diffusion, Chem. Eng. J. 74 (1999) 43-56.
217. C. Rödenbeck and J. Kärger, Length and Occupancy Dependence of the Tracer Ex-change in Single-File Systems, J. Chem. Phys. 110 (1999) 3970-3980.
218. J. Kärger and D. M. Ruthven, Diffusion and Adsorption in Porous Solids, in "Hand-book of Porous Solids", (F. Schüth, K. S. W. Sing, and J. Weitkamp, Eds.), pp. 2089-2173, Wiley-VCH, Weinheim, (2002).
219. S. Vasenkov and J. Kärger, The Different Time Regimes of Tracer Exchange in Sin-gle-File Systems, Phys. Rev. Lett. E 66 (2002) 052601-052601-052604.
220. E. G. Derouane and Z. Gabelica, A Novel Effect of Shape Selectivity: Molecular Traf-fic Control in Zeolite ZSM-5, J. Catal. 65 (1980) 486-489.
221. N. Neugebauer, P. Bräuer, and J. Kärger, Reactivity Enhancement by Molecular Traf-fic Control, J. Catal. 194 (2000) 1-3.
222. P. Bräuer, J. Kärger, and N. Neugebauer, Reaction and Particle Distribution in Net-works of Single-File Systems, Europhys. Lett. 53 (2001) 8-14.

105
223. P. Bräuer and J. Kärger, Reactivity Enhancement by Molecular Traffic Control - A Consequence of Released Single-File Constraints, in "Zeolites and Mesoporous Mate-rials at the Dawn of the 21st Century", (A. Galarneau, F. Di Renzo, F. Vajula, and J. Vedrine, Eds.), pp. 173, Elsevier, Amsterdam, (2001).
224. B. V. Padlyak, J. Kornatowski, G. Zadrozna, M. Rozwadowski, and A. Gutsze, Elec-tron paramagnetic resonance spectroscopy of chromium in CrAPO-5 molecular sieves, J. Phys. Chem. A 104 (2000) 11837-11843.
225. J. Kornatowski, G. Zadrozna, M. Rozwadowski, B. Zibrowius, F. Marlow, and J. A. Lercher, New strategy for chromium substitution and crystal morphology control - Synthesis and characteristics of CrAPO-5, Chem. Mater. 13 (2001) 4447-4456.
226. D. W. Breck, "Zeolite Molecular Sieves", John Wiley & Sons, New York, (1974).
227. W. Jacobs, D. G. Demuth, S. A. Schunk, and F. Schuth, Orientation of the acidity probes benzene, acetonitrile and pyridine in SAPO-5 and GaAPO-5 molecular sieves: An FTIR microscopy study, Microporous Mater. 10 (1997) 95-109.
228. E. Lehmann, S. Vasenkov, J. Karger, G. Zadrozna, J. Kornatowski, O. Weiss, and F. Schuth, Inhomogeneous distribution of water adsorbed under low pressure in CrAPO-5 and SAPO-5: An interference microscopy study, J. Phys. Chem. B 107 (2003) 4685-4687.
229. G. J. Klap, M. Wubbenhorst, J. C. Jansen, H. van Koningsveld, H. van Bekkum, and J. van Turnhout, Polar growth and directional adsorption of large AlPO4-5 crystals de-termined by scanning pyroelectric microscopy, Chem. Mater. 11 (1999) 3497-3503.
230. G. J. Klap, H. van Koningsveld, H. Graafsma, and A. M. M. Schreurs, Absolute con-figuration and domain structure of AlPO4-5 studied by single crystal X-ray diffraction, Microporous Mesoporous Mat. 38 (2000) 403-412.
231. J. Kornatowski, G. Zadrozna, J. Wloch, and M. Rozwadowski, Compositional hetero-geneity of CrAPO-5 with neutral framework: Effect oil sorption properties in compari-son to other MeAPO-5 with charged frameworks and analytical evaluation of adsorp-tion potentials, Langmuir 15 (1999) 5863-5869.
232. S. A. Schunk, D. G. Demuth, B. SchulzDobrick, K. K. Unger, and F. Schuth, Element distribution and growth mechanism of large SAPO-5 crystals, Microporous Mater. 6 (1996) 273-285.
233. E. Lehmann, S. Vasenkov, J. Karger, G. Zadrozna, and J. Kornatowski, Intracrystal-line monitoring of molecular uptake into the one- dimensional channels of the AFI-type crystals using interference microscopy, J. Chem. Phys. 118 (2003) 6129-6132.
234. A. G. Stepanov, A. A. Shubin, M. V. Luzgin, H. Jobic, and A. Tuel, Molecular Dy-namics of n-Octane Inside Zeolite ZSM-5 as Studied by Deuterium Solid-State NMR and Quasi-Elastic Neutron Scattering, J. Phys. Chem. B. 102 (1998) 10860-10870.
235. L. A. Clark, G. T. Ye, and R. Q. Snurr, Molecular Traffic Control in a Nanoscale Sys-tem, Phys. Rev. Lett. 84 (2000) 2893-2896.
236. J. Weitkamp and L. Puppe, "Catalysis and Zeolites", Springer, Berlin Heidelberg, (1999).
237. R. Q. Snurr and J. Kärger, Molecular Simulations and Nmr Measurements of Binary Diffusion in Zeolites, J. Phys. Chem. B. 101 (1997) 6469-6473.
106
238. P. Bräuer, A. Brzank, and J. Kärger, Adsorption and reaction in single-file networks, J. Phys. Chem. B 107 (2003) 1821-1831.
239. E. Lehmann, S. Vasenkov, J. Kärger, and J. Weitkamp, J. Catal. in preparation.
240. H.H. Hausser, H.R. Kalbitzer, "NMR in Medicine and Biology", Springer, Berlin Hei-delberg (1989).
241. Kimmich, R., "NMR Tomography, Diffusometry, Relaxometry", Springer, Berlin Heidelberg (1997).
242. Blümich, B., "`NMR Imaging of Materials", Clarendon Press, Oxford (2000).
243. D.T. Hayhurst, A.R. Paravar, Diffusion of C1 to C5 Normal Paraffins in Silicalite Zeo-lites 8 (1988) 27.
244. D.N. Theodorou, private communication.
245. S.J. Goodbody, K. Watanabe, D. MacGowan, J.P.B. Walton, and N. Quirke, J. Chem. Soc. Faraday Trans. 87 (1991) 1951.
246. D. Prochnow, PhD thesis "Festkörper-NMR-Untersuchungen an Phosphat-Materialien" (2003).
247. R.M. Barrer, B.E.F. Fender, The Diffusion and Sorption of Water in Zeolites, J. Phys. Chem. Solids 21 (1961) 1-24.
248. H.W. Haynes, P.N. Sarma, Application of Gas-Chromatography to Measurements of Diffusion in Zeolites, Adv. Chem. 133 (1974) 205-217.
249. D. M. Ruthven and S. Brandani, Measurement of Diffusion in Porous Solids by Zero Length Column (ZLC) Methods, in "Recent Advances in Gas Separation by Micro porous Ceramic Membranes", (N.K. Kanellopoulos, Ed.), pp. 187-212, Elsevier, Am sterdam, (2000).
250. Keipert, O.P., Baerns, M., Determination of the Intracrystalline Diffusion Coefficients of Alkanes in H-ZSM-5 Zeolite by a Transient Technique Using the Temporal-Analysis-of-Products (TAP) Reactor, Chem. Engin. Science 53 (1998) 3623-3634.
251. R. R. Schumacher, B. G. Anderson, N. J. Noordhoek, F. J. M. M. de Gauw, A. M. de Jong, M. J. A. de Voigt, and R. A. van Santen, Tracer-Exchange Experiments with Positron Emission Profiling: Diffusion in Zeolites, Microporous Mesoporous Mater. 6 (2000) 315-326.
252. W. Heink, J. Kärger, H. Pfeifer, Application of zeugmathography to study kinetics of physical adsorption, Chem. Engi. Sci. 33 (1978) 1019-1023.
253. N.-K. Bär, B. J. Balcom, and D. M. Ruthven, Direct Measurement of Transient Con-centration Profiles in Molecular Sieve Particles and Columns by MRI, in "Adsorption Science and Technology", (D.D. Do, Ed.), pp. 6-13, W. Scientific, Singapore, (2000).
254. J. Caro, M. Noack, P. Kölsch, and R. Schäfer, Zeolite Membranes - State of their De-velopment and Perspective [Review], Microporous Mesoporous Mater. 38 (2000) 3-24.
255. M. Goddard and D. M. Ruthven, Sorption and Diffusion of C8 Aromatic Hydrocar bons in Faujasite Type Zeolites III. Self-Diffusivities by Tracer Exchange, Zeolites 6 (1986) 445-448. 256. D. V. Cao, R. J. Mohr, M. B. Rao, and S. Sircar, Self-Diffusivities of N2, CH4, and Kr on 4A Zeolite Pellets by Isotope Exchange Technique, J. Phys. Chem. B 104 (2000) 10498-10501.

107
257. H. Jobic, J. Kärger, and M. Bee, Simultaneous Measurement of Self- and Transport Diffusivities in Zeolites, Phys. Rev. Lett. 82 (1999) 4260-4263.
258. J. Kärger and H. Pfeifer, NMR-Self-Diffusion Studies in Zeolite Science and Technol-ogy, Zeolites 7 (1987) 90-107.
259. D. Michel and V. Rössinger, Proton Spin Relaxation of Butenes and Butane in CaNaA Zeolites, Surf. Sci. 54 (1976) 463-476.
260. D. E. Favre, D. J. Schaefer, S. M. Auerbach, and B. F. Chmelka, Direct Measurement of Intercage Hopping in Strongly Adsorbing Guest-Zeolite Systems, Phys. Rev. Lett. 81 (1998) 5852-5855.
261. Matthae, F.P., Basler, W.D., Lechert, H., Mesoporous Molecular Sieves 1998 in "Studies in Surface Science and Catalysis" (Bounneviot, L., Béland, f. Danumah, C. Giasson, S., Kaliaguine, S., Eds.) Elsevier, Amsterdam (1998).
262. Hansen, E. W., Courivaud, F., Karlsson, A., Kolboe, S., Stöcker, M., Effect of Pore Dimension and Pore Surface Hydrophobicity on the Diffusion of n-Hexane Confined in Mesoporous MCM-41 Probed by NMR - a Preliminary Investigation, Microporous Mesoporous Mater. 22 (1998) 309-320.
263. Courivaud, F., Hansen, E. W., Karlsson, A., Kolboe, S., Stöcker, M., Pulsed Field Gradient NMR Study of the Diffusion of n-Hexane Confined in Hydroxylated and De-hydroxylated MCM-41 of Various Pore Diameters, Microporous Mesoporous Mater. 6 (2000) 327-339.
264. Stallmach, F., Kärger, J., Krause, C., Jeschke, M., Oberhagemann, U., Evidence of Anisotropic Self-Diffusion of Guest Molecules in Nanoporous Materials of MCM-41 Type, J. Am. Chem. Soc., 122 (2000) 9237-9242.