diffusion and impacts of e-commerce in the united states
TRANSCRIPT

Communications of the Association for Information Systems
Volume 16 Article 28
October 2005
Diffusion and Impacts of E-Commerce in theUnited States of America: Results from an IndustrySurveyVladislav V. FominCopenhagen Business School, [email protected]
John L. KingUniversity of Michigan, [email protected]
Kalle J. LyytinenCase Western Reserve University, [email protected]
Sean T. McGannOhio University, [email protected]
Follow this and additional works at: https://aisel.aisnet.org/cais
This material is brought to you by the AIS Journals at AIS Electronic Library (AISeL). It has been accepted for inclusion in Communications of theAssociation for Information Systems by an authorized administrator of AIS Electronic Library (AISeL). For more information, please [email protected].
Recommended CitationFomin, Vladislav V.; King, John L.; Lyytinen, Kalle J.; and McGann, Sean T. (2005) "Diffusion and Impacts of E-Commerce in theUnited States of America: Results from an Industry Survey," Communications of the Association for Information Systems: Vol. 16 , Article28.DOI: 10.17705/1CAIS.01628Available at: https://aisel.aisnet.org/cais/vol16/iss1/28
Communications of the Association for Information Systems (Volume 16, 2005) 559-603 559
Diffusion and Impacts of E-Commerce in the United State of America: Results from an Industry Survey by V.V. Fomin, J.L. King, K.J. Lyttinen, and S. T. McGann
DIFFUSION AND IMPACTS OF E-COMMERCE
IN THE UNITED STATES OF AMERICA: RESULTS FROM AN INDUSTRY SURVEY
Vladislav V. Fomin Department of Informatics Copenhagen Business School [email protected] John L. King, School of Information University of Michigan Kalle J. Lyytinen Weatherhead School of Management Case Western Reserve University Sean T. McGann Ohio University
ABSTRACT
The paper provides baseline conditions of the U.S. e-commerce in the post-dot.com era. The article examines the key factors that act as determinants of e-commerce diffusion. It is based on qualitative analysis of the U.S. industry survey data, matched to a similar data and analyses from other countries. It presents data taken from one of the most comprehensive sample surveys yet done of the U.S. firm activity in e-commerce.
The paper analyses differences among three industry sectors, and between small/medium and large firms using both qualitative interpretations and direct observations from the survey data, as well as use of structural equation modeling of e-commerce diffusion and impacts. Some differences in e-commerce orientation and experience were found across the three industry sectors studied in the survey of 10 countries. These differences are related largely to the nature of the tasks done in the respective industries, and to prior industry-level investment and learning related to e-commerce. There were also differences found in e-commerce attitudes and experience between small/medium sized enterprises (SMEs) and large establishments. Only modest differences were found between U.S. and non-U.S. establishments. Quantitative analysis found significant regression relationships with their level of statistical significance. Results show that e-commerce adoption is path dependent (i.e., establishments

560 Communications of the Association for Information Systems (Volume 16, 2005) 559-603
Diffusion and Impacts of E-Commerce in the United State of America: Results from an Industry Survey by V.V. Fomin, J.L. King, K.J. Lyttinen, and S. T. McGann
follow earlier investment patterns), and that each industry’s market and institutional context play a significant role in adoption. Keywords: e-commerce, EDI, globalization, ICT, information technologies, IT economic impacts, IT, technology diffusion, telecommunication infrastructure, industry survey, qualitative analysis, structural equation modeling
I. INTRODUCTION
This paper examines the evolution, adoption and impacts of e-commerce in the U.S. using data from an e-commerce survey in ten countries completed in 2002 by the Global Electronic Commerce study (hereafter called the survey) at the University of California at Irvine [Kling et al., 2003, Kraemer et al., 2003]. In addition, the paper draws upon other public data sets, including U.S. Census data and ITU data sets.
The paper addresses three broad questions:
1. Do e-commerce experiences in terms of readiness, deployment, adoption and impact of e-commerce technologies of the U.S. establishments differ from those in other countries studied?
2. Do e-commerce experiences in the manufacturing, finance, and distribution differ from one another?
3. Do e-commerce experiences differ significantly between small and medium-sized establishments versus large establishments?
The paper seeks answers to these questions using both qualitative interpretations and direct observations from the survey data, as well as use of structural equation modeling of e-commerce diffusion and impacts. Results show that e-commerce is growing steadily, and that drivers encouraging use of e-commerce technologies outweigh barriers to use. E-commerce use will grow as benefits start to materialize across industry sectors, but it will be a considerable period of time before e-commerce overtakes traditional commerce.
II. METHODS
The methods employed in this paper include documentary study of secondary sources on demographic and economic factors and on experience with e-commerce in the U.S. and internationally. Data sources include government agencies’ reports, reports from international non-governmental organizations, scholarly and trade publications, and publications by commercial establishments engaged in research and analysis related to IT and e-commerce. Following documentary analysis, the study shifts to a survey conducted in 2002 by the Center for Research on Information Technology and Organizations at the University of California at Irvine, and the International Data Corporation1. The survey included 300 establishments in the United States that use the Internet to buy, sell or support products and services. The survey covered three sectors: manufacturing, distribution (wholesale and retail), and finance (banking and insurance). The sample was split evenly by industry sector and by establishment size into large (>250 employees) and small/medium (25 to 250 employees). Additional data from the survey 1 Given the variables we focused on in the analysis, the findings presented in the paper are still valid today, even though the survey data were obtained in 2002. This paper is best positioned as a documentary utility in a historical analysis of the rise of e- commerce. The paper provides baseline conditions of the U.S. e- commerce in the post-dot.com era. It presents data taken from one of the most comprehensive sample surveys yet done of the U.S. firm activity in e-commerce, and matches similar data and analyses from nine other countries obtained as part of the research project.

Communications of the Association for Information Systems (Volume 16, 2005) 559-603 561
Diffusion and Impacts of E-Commerce in the United State of America: Results from an Industry Survey by V.V. Fomin, J.L. King, K.J. Lyttinen, and S. T. McGann
cover nine other countries. Throughout this paper analyses compare the responses of establishments within the U.S. to responses of the whole sample of establishments. For convenience, the nomenclature adopted for these analyses refers to the sample of U.S.-only establishments as the U.S. Firms, and the total sample as All Firms.
Descriptive data analyses were done to discover significant differences within the variables covered in survey instrument. Analysis focused on
1. what factors, if any, cause e-commerce adoption across industry sectors and over the whole data set, and
2. whether e-commerce impact businesses significantly across sectors, or sampled sectors as a whole, and
3. what factors produce such impacts.
III EXPECTATIONS ABOUT THE STATUS OF E-COMMERCE
This paper investigates the use, diffusion, and effects of e-commerce activities in the U.S in the context of earlier work [Fomin et al., 2003] that formed a set of six initial expectations in the economy as a whole, and in the sectors of manufacturing, distribution and finance.
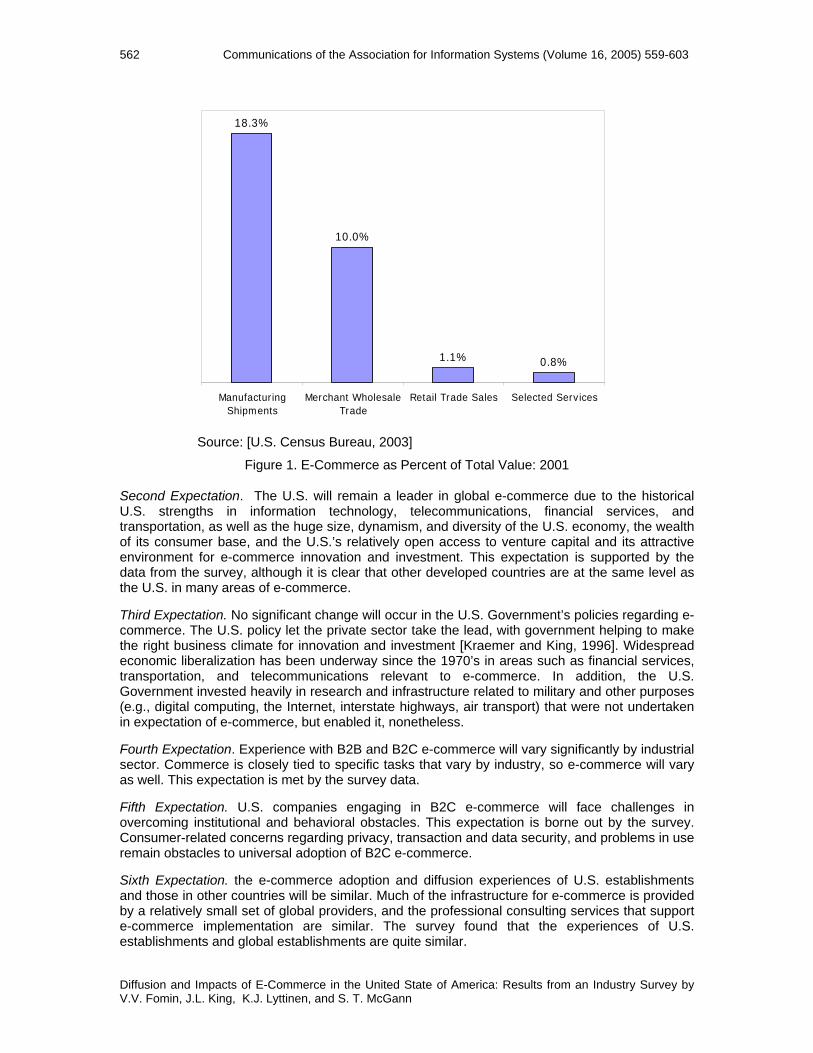
First expectation. E-commerce will continue to grow, despite the collapse of the dot.com boom. This expectation appears to be borne out by the data, with the volume of electronic transactions growing steadily with the 2002 level surpassing the 2000 peak (Table 1) [OECD, 2002, p.7]. Manufacturing leads all industry sectors in e-commerce shipments, with merchant wholesale trade and retail trade and sales following (Figure 1).
Table 1. Estimated Quarterly U.S. Retail Sales: Total and E-commerce
Retail Sales E-commerce as a % of Total Sales
Total a E-commerce b 1999 Q4 784,278 5,481 0.7 2000 Q1 711,600 5,814 0.8 Q2 771,691 6,346 0.8 Q3 765,536 7,266 0.9 Q4 810,311 9,459 1.2 2001 Q1 724,224 8,256 1.1 Q2 805,245 8,246 1.0 Q3 782,088 8,236 1.1 Q4 856,285 11,178 1.3 2002 Q1 743,810 9,880 1.3 Q2 c 825,243 10,265 1.2 Q3 d 827,461 11,061 1.3
Source: [U.S. Census Bureau, 2003] Data in millions of dollars, not adjusted for seasonal, holiday and trading-day differences a - Does not include Food Services. b - E-commerce sales are sales of goods and services where an order is placed by the buyer or price and terms of sale are negotiated over an Internet, extranet, Electronic Data Interchange (EDI) network, electronic mail, or other online system. Payment may or may not be made online. c – Revised. d – Preliminary
562 Communications of the Association for Information Systems (Volume 16, 2005) 559-603
Diffusion and Impacts of E-Commerce in the United State of America: Results from an Industry Survey by V.V. Fomin, J.L. King, K.J. Lyttinen, and S. T. McGann
Source: [U.S. Census Bureau, 2003]
Figure 1. E-Commerce as Percent of Total Value: 2001
Second Expectation. The U.S. will remain a leader in global e-commerce due to the historical U.S. strengths in information technology, telecommunications, financial services, and transportation, as well as the huge size, dynamism, and diversity of the U.S. economy, the wealth of its consumer base, and the U.S.’s relatively open access to venture capital and its attractive environment for e-commerce innovation and investment. This expectation is supported by the data from the survey, although it is clear that other developed countries are at the same level as the U.S. in many areas of e-commerce.
Third Expectation. No significant change will occur in the U.S. Government’s policies regarding e-commerce. The U.S. policy let the private sector take the lead, with government helping to make the right business climate for innovation and investment [Kraemer and King, 1996]. Widespread economic liberalization has been underway since the 1970’s in areas such as financial services, transportation, and telecommunications relevant to e-commerce. In addition, the U.S. Government invested heavily in research and infrastructure related to military and other purposes (e.g., digital computing, the Internet, interstate highways, air transport) that were not undertaken in expectation of e-commerce, but enabled it, nonetheless.
Fourth Expectation. Experience with B2B and B2C e-commerce will vary significantly by industrial sector. Commerce is closely tied to specific tasks that vary by industry, so e-commerce will vary as well. This expectation is met by the survey data.
Fifth Expectation. U.S. companies engaging in B2C e-commerce will face challenges in overcoming institutional and behavioral obstacles. This expectation is borne out by the survey. Consumer-related concerns regarding privacy, transaction and data security, and problems in use remain obstacles to universal adoption of B2C e-commerce.
Sixth Expectation. the e-commerce adoption and diffusion experiences of U.S. establishments and those in other countries will be similar. Much of the infrastructure for e-commerce is provided by a relatively small set of global providers, and the professional consulting services that support e-commerce implementation are similar. The survey found that the experiences of U.S. establishments and global establishments are quite similar.
18.3%
10.0%
1.1% 0.8%
ManufacturingShipments
Merchant WholesaleTrade
Retail Trade Sales Selected Services
Communications of the Association for Information Systems (Volume 16, 2005) 559-603 563
Diffusion and Impacts of E-Commerce in the United State of America: Results from an Industry Survey by V.V. Fomin, J.L. King, K.J. Lyttinen, and S. T. McGann
The rapid expansion of e-commerce was enabled as well as constrained by industry structure in the U.S., as reviewed in the next subsection.
INDUSTRY STRUCTURE
Manufacturing, wholesale and retail trade, and finance are the largest industries in the U.S., representing together over two thirds of the economy (Table 2). The U.S. finance industry contributes over 30% to the U.S. GDP with 4% of the total number of the U.S. establishments (among all sectors). Manufacturing, the second largest U.S. industry, generates 19.6% of GDP with 5.4% of establishments [U.S. Census Bureau, 2003].
U.S. industry is dominated in number by small and medium-sized enterprise (SMEs) in all three sectors defined in Table 2. About 98% of U.S. establishments employ less than 100 people: 93% in manufacturing, 97% in wholesale and 98% in retail distribution, and 98% in finance [U.S. Census Bureau, 2003].2
E-Stats3 [U.S. Census Bureau, 2003] provides detail on e-business in these sectors: (Table 3). E-commerce outperformed total economic activity in three of four major economic sectors measured between 2000 and 2001. B2B, which depends critically on EDI, dominated e-commerce activity (93% of total e-commerce activity). All industry groups in each sector participate in e-commerce, though there are differences among the sectors on certain measures. Manufacturing and wholesale trade, where goods are typically sold to other businesses, report substantially higher e-commerce activity percentages than retail trade and selected service industries. The long-standing use of EDI systems for online B2B transactions in these industries might account for this difference. In manufacturing, for example, EDI systems continue to dominate in terms of dollar volume [Mesenbourg, 2001]. Among establishments that provide online ordering capabilities for their customers, half use the Internet most frequently compared to
2 Although the U.S. Census Bureau’s data on employment size are not grouped according to the same classification as defined in the UCI’s survey, there is no significant difference in proportions of SME to large firms using either 100 or 250 employee as an SME’s size. 3 The data are collected from over 125,000 manufacturing, wholesale, services, and retail businesses. The report does not cover agriculture, mining, utilities, construction, non-merchant wholesalers, and approximately one-third of service-related industries (Source: U.s. Census Bureay [2003]).
Table 2. GPD Distributed by Industrial Sector, United States, France, and Germany (%)
Sector U.S. Firms as % of Total
France Germany
Manufacturing 19.6% 5.4% 24.5% 28.6% Wholesale and retail trade, restaurants and hotels
18.1% 19.2% 19.1% n.a.
Finance 30.8% 4.0% 29.1% 16.7% GDP total U.S.$ (Billions), 2001
10,065.3 1,309.8 1,846.1
GDP per capita (U.S.$), 2001
35,445.80 22,138.21 22,459.65
Sources. United Nations National Accounts 1999, World Bank World Development Indicators, 2003, U.S. Census Bureau, 2003

564 Communications of the Association for Information Systems (Volume 16, 2005) 559-603
Diffusion and Impacts of E-Commerce in the United State of America: Results from an Industry Survey by V.V. Fomin, J.L. King, K.J. Lyttinen, and S. T. McGann
little over one-third that use EDI most frequently [Mesenbourg, 2001]4. However, in terms of dollar value, Internet ordering systems account for only one-twentieth of total manufacturing e-commerce shipments, while plants offering EDI online ordering account for more than one-half [Mesenbourg, 2001].
Table 3. U.S. Shipments, Sales, Revenues and E-Commerce: 2001 and 2000
Value of Shipments, Sales, or Revenue 2001 2000 Y/Y % Change %Distribution of EC Description
Total EC Total EC Total EC 2001 2000 Total 14,572 1,066 14,657 1,062 -0.6 0.4 100.0 100.0 B2B 6,676 995 6,950 997 -3.9 -0.2 93.3 93.9 Manufacturing 3,971 725 4,209 756 -5.7 -4.1 68.0 71.2 Merchant Wholesale 2,705 270 2,741 241 -1.3 12.0 25.3 22.7 B2C 7,896 71 7,707 65 2.5 9.2 6.7 6.1 Retail 3,141 34 3,059 28 2.7 22.1 3.2 2.6 Selected Services 4,755 37 4,648 37 2.3 -1.4 3.5 3.5
In millions of dollars Source: [U.S. Census Bureau, 2003]
SECTOR ANALYSIS
Manufacturing The manufacturing sector encompasses five industry groups (Table 4). Transportation Equipment is the largest industry group, accounting for a quarter of total manufacturing and nearly half of all e-shipments in manufacturing [U.S. Census Bureau, 2003]. Transportation Equipment is followed by Computer and Electronic Products, Chemicals, Food Products, Beverage and Tobacco, Machinery, and Electrical Equipment, Appliances, and Components. In 2001 e-commerce-based shipments within manufacturing declined 4%, compared to a 6% decline in total manufacturing sales, a proportional increase in e-commerce activity within the value chain.
Distribution Wholesale
U.S. wholesale sales suffered a decline of 1.2% between 2000 and 2001, but e-commerce sales reached $272 billion, an increase of 12.9% (Table 5) [U.S. Census Bureau, 2003]. Wholesale e-commerce is concentrated, with 63% of total e-sales in just three industry groups led by drugs (35%), motor vehicles and automotive equipment (17%), and professional and commercial equipment and supplies (11%).
Retail
Retail e-commerce sales reached $34 billion in 2001, an increase of 22% over 2000. This amount, however, accounted for only 1.1% of total retail sales (Figure 1) [U.S. Census Bureau, 2003]. Electronic shopping and mail-order houses account for over 90% of retail e-commerce sales, [U.S. Census Bureau, 2003]. Clothing and computer hardware contribute over one-third of volume in electronic shopping and mail order e-commerce (Table 6).
4 In contrast, 64.6% of manufacturing firms exchange operational data over Internet with business customers in GEC survey data (Table ).

Communications of the Association for Information Systems (Volume 16, 2005) 559-603 565
Diffusion and Impacts of E-Commerce in the United State of America: Results from an Industry Survey by V.V. Fomin, J.L. King, K.J. Lyttinen, and S. T. McGann
Table 4. Historical. U.S. Manufacturing Shipments1 - Total and E-commerce Value: 1999-2001
Value of Shipments, Sales, or Revenue
2001 2000 Y/Y % Change EC as
% of Total Shipments
% Distrib. of
EC Shipments
Description
Total EC Total EC Total EC 2001 2000 2001 Total Manufacturing 2,421,169 555,154 2,563,572 580,446 -5.6 -4.4 22.9% 22.6% 100.0% Transportation equipment 602,496 264,368 639,861 281,396 -5.8 -6.1 43.9% 44.0% 47.6% Computer and electronic products 429,471 73,232 510,639 77,933 -15.9 -6.0 17.1% 15.3% 13.2% Chemicals 438,410 54,515 449,159 52,974 -2.4 2.9 12.4% 11.8% 9.8% Food products 451,386 53,556 435,230 54,837 3.7 -2.3 11.9% 12.6% 9.6% Beverage and tobacco 118,786 45,665 111,692 42,862 6.4 6.5 38.4% 38.4% 8.2% Machinery 266,553 35,799 291,548 40,441 -8.6 -11.5 13.4% 13.9% 6.4% Electrical equipment, appliances, and components 114,067 28,019 125,443 30,003 -9.1 -6.6 24.6% 23.9% 5.0%
Note: Estimates are not adjusted for price changes. For information on confidentiality protection, sampling error, nonsampling error, sample design, and definitions, visit www.census.gov/eos/www/mestats.html. 1Estimates include data only for businesses with paid employees and are subject to revision.Source: U.S. Census Bureau, Annual Survey of Manufactures
Table 5. U.S. Merchant Wholesale Trade Sales – Total and E-commerce Sales: 2001 and 2000
Note: Estimates are not adjusted for price changes. For information on confidentiality protection, sampling error, nonsampling error, sample design, and definitions, visit www.census.gov/eos/www/mestats.html. 1Estimates include data only for businesses with paid employees and are subject to revision Sales in millions of dollars. Source: U.S. Census Bureau, 2001 Annual Trade Survey (Revised April 2003)
Value of Shipments, Sales, or Revenue
2001 2000 Y/Y % Change EC as
% of Total Shipments
% Distrib. of
EC Shipments
Description
Total EC Total EC Total EC 2001 2000 2001 Total Merchant Wholesale Trade
2,708,666 272,183 2,742,593 241,109 -1.2% 12.9% 10.0% 8.8% 100.0%
Nondurable goods
1,358,394 146,976 1,320,010 126,920 2.9% 15.8% 10.8% 9.6% 54.0%
Drugs, drug proprietaries and druggists' sundries 201,114 96,363 168,471 77,790 19.4% 23.9% 47.9% 46.2% 35.4%
Durable goods 1,350,272 125,207 1,422,583 114,189 -5.1% 9.6% 9.3% 8.0% 46.0%
Motor vehicles and automotive Equipment 205,577 46,771 199,522 40,106 3.0% 16.6% 22.8% 20.1% 17.2% Professional and commercial equipment and supplies 249,981 30,904 269,129 30,827 -7.1% 0.2% 12.4% 11.5% 11.4% Computer equipment and supplies 122,458 15,776 150,402 18,948
-18.6%
-16.7% 12.9% 12.6% 5.8%

566 Communications of the Association for Information Systems (Volume 16, 2005) 559-603
Diffusion and Impacts of E-Commerce in the United State of America: Results from an Industry Survey by V.V. Fomin, J.L. King, K.J. Lyttinen, and S. T. McGann
Table 6. Top 20 U.S. Internet Retailers, 2000
Rank Company Primary Web Site(s) Online Sales to
U.S. Consumers
Past-Year Customers
Average 12-month Spending
Repeat Purchase Potential
Index 1 eBay ebay.com $3.5-3.7B 10M $350 101 2 Amazon.com amazon.com 1.7-1.9B 12M 150 115 3 Dell dell.com 1.1-1.3B 600K 2,000 66 4 buy.com buy.com 700-800M 3M 250 105 5 Egghead.com egghead.com, onsale.com
(formerly) 500-600M 700K 800 79
6 Gateway gateway.com 500-600M 350K 1,500 73 7 Quixtar quixtar.com 400-450M 600K 700 140 8 uBid ubid.com 275-325M 600K 500 82 9 Barnes & Noble bn.com 275-325M 3M 100 98 10 Cyberian
Outpost outpost.com 200-250M 425K 550 80
11 Value America* va.com 200-250M 250K 900 83 12 MicroWarehouse microwarehouse.com 200-250M 175K 1,200 92 13 Office Depot officedepot.com,
vikingop.com 175-200M 250K 750 114
14 eToys.com etoys.com,babycenter.com 150-175M 1.7M 100 93 15 Lands' End landsend.com 150-175M 800K 200 105 16 The Spiegel
Group spiegel.com, eddiebauer.com, newport-news.com
150-175M 450K 350 97
17 Fingerhut fingerhut.com, andysauctions.com, andysgarage.com
150-175M 400K 375 96
18 CDW cdw.com 150-175M 200K 800 92 19 JCPenney jcpenney.com 150-175M 500K 300 103 20 Gap gap.com, oldnavy.com,
bananarepublic.com 125-150M 800K 175 114
*Ceased retail operations Source: National Retail Federation
Finance Detailed data on e-commerce activities in finance are not available. The U.S. Census Bureau does provide data for selected parts of finance (Table 7) [U.S. Census Bureau, 2003]. For example, securities and commodity contracts intermediation accounted for 10% of total e-commerce revenues among selected service industries.
SUMMARY OF SECTOR ANALYSIS
The secondary data on sector characteristics in e-commerce are spotty, but some conclusions can be drawn. Considerable activity and genuine growth occurred in e-commerce across the sectors, but as yet e-commerce accounts for a relatively small share of overall commerce in any sector, if a narrow definition of e-commerce as Internet-based exchange is used. If use of non-Internet-based EDI is considered to be a form of electronic commerce, the manufacturing sector shows a much greater level of e-commerce activity. Nevertheless, even with EDI the manufacturing sector shows less than one-fifth of its total commerce in electronic form.

Communications of the Association for Information Systems (Volume 16, 2005) 559-603 567
Diffusion and Impacts of E-Commerce in the United State of America: Results from an Industry Survey by V.V. Fomin, J.L. King, K.J. Lyttinen, and S. T. McGann
Table 7. U.S. Selected Services Revenue1 – Total and E-commerce: 2001 and 2000
Value of Shipments, Sales, or Revenue
2001 2000 Y/Y %
Change
EC as % of Total Shipments
% Distrib. of
EC Shipments
Description
Total EC Total EC Total EC ‘01 ‘00 ‘01 Total for Selected Service Industries 4,759,796 37,261 4,647,156 37,312 2.4 -0.1 0.8 0.8 100.0
Information 870,204 10,438 845,665 9,305 2.9 12.2 1.2 1.1 28.0 Publishing industries 233,110 4,941 233,327 4,748 -0.1 4.1 2.1 2.0 13.3
Broadcasting and telecommunications 487,538 2,516 469,707 1,880 3.8 33.8 0.5 0.4 6.8
Online information services 32,390 1,850 31,438 1,997 3.0 -7.4 5.7 6.4 37.4
Administrative and Support and Waste Management and Remediation Services5
411,947 9,599 411,236 9,680 0.2 -0.8 2.3 2.4 25.8
Travel arrangement and
reservation services 26,054 6,272 26,306 6,185 -1.0 1.4 24.1 23.5 16.8
Selected Finance3 293,981 3,754 338,071 5,976 -13.0 -37.2 1.3 1.8 10.1 Securities and
commodity contracts
intermediation and brokerage
195,667 3,570 232,798 5,664 -15.9 -37.0 1.8 2.4 9.6
Note: Estimates are not adjusted for price changes. For information on confidentiality protection, sampling error, nonsampling error, sample design, and definitions, visit www.census.gov/eos/www/mestats.html. 1Estimates include data only for businesses with paid employees and are subject to revision.
Source: U.S. Census Bureau, 2001 Service Annual Survey (Revised April 2003)
IV E-COMMERCE READINESS IN THE U.S. SURVEY
E-commerce readiness refers to the extent to which a country has physical and institutional infrastructure and organizational and intellectual capabilities in place to support and expand e-commerce activities. This section concentrates on a set of factors that define readiness including information infrastructure, IT investment, industry readiness and globalization of e-commerce. This section provides some indications of the U.S. position with respect to these factors.
INFORMATION INFRASTRUCTURE
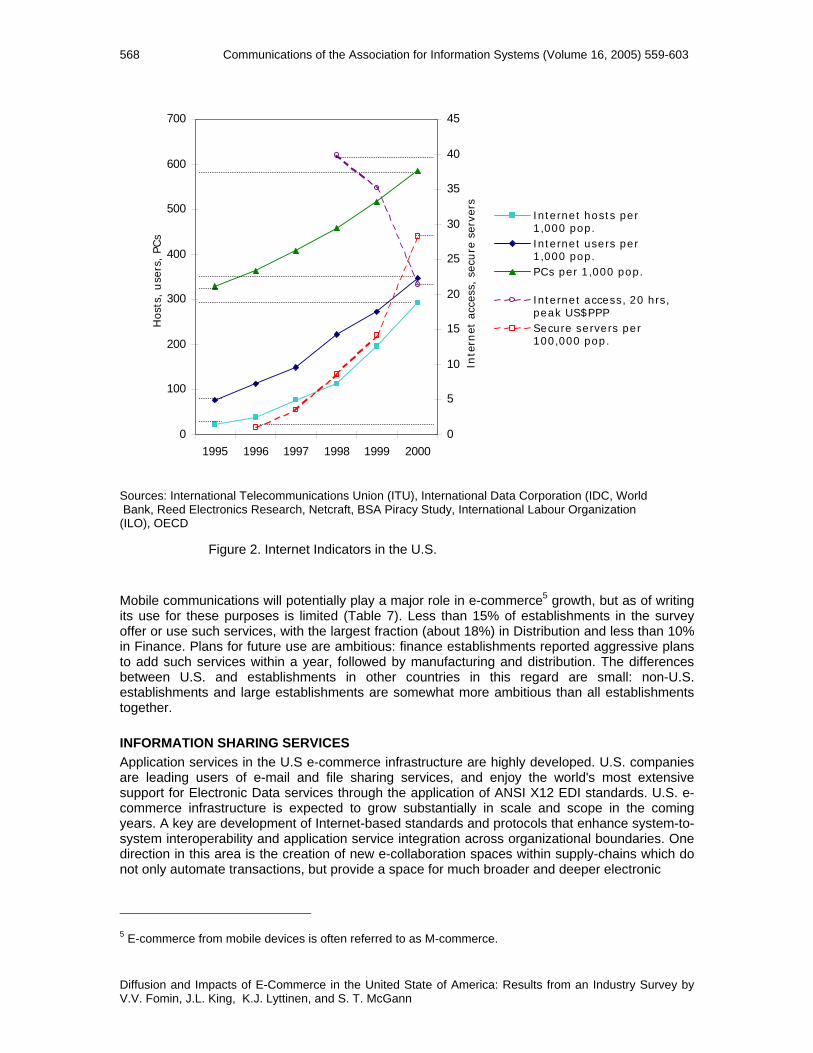
Telecommunication infrastructure Earlier work [Fomin et al., 2003] pointed out that five types of infrastructure – communications, information processing, Internet, transportation, and enterprise – are important to the promotion of e-commerce in the U.S. Wire-line telephone penetration is high, including nearly all households (70% of the population). An increasing proportion of wire-line telephony is digital. Residential satellite communications (mainly downloads for television) is growing slowly, and remains below 5% of the population. The fastest growing sector is cellular telephony, which grew from 10% to about 40% of the population between 1995 and 2000 [Fomin et al., 2003]. Internet access fees increased steadily (Figure 2). Since 1995, growth in personal computer use and in the number of Internet users grew significantly, whilst the price of Internet access has dropped rapidly. On the supply side, the number of Internet hosts grew quickly since 1995, and in the past few years, the number of secure servers increased sharply.
568 Communications of the Association for Information Systems (Volume 16, 2005) 559-603
Diffusion and Impacts of E-Commerce in the United State of America: Results from an Industry Survey by V.V. Fomin, J.L. King, K.J. Lyttinen, and S. T. McGann
0
100
200
300
400
500
600
700
1995 1996 1997 1998 1999 2000
Hos
ts, use
rs, PC
s
0
5
10
15
20
25
30
35
40
45
Inte
rnet
acc
ess,
sec
ure
ser
vers
Internet hosts per1,000 pop.Internet users per1,000 pop.PCs per 1,000 pop.
Internet access, 20 hrs,peak US$PPPSecure servers per100,000 pop.
Sources: International Telecommunications Union (ITU), International Data Corporation (IDC, World Bank, Reed Electronics Research, Netcraft, BSA Piracy Study, International Labour Organization (ILO), OECD
Mobile communications will potentially play a major role in e-commerce5 growth, but as of writing its use for these purposes is limited (Table 7). Less than 15% of establishments in the survey offer or use such services, with the largest fraction (about 18%) in Distribution and less than 10% in Finance. Plans for future use are ambitious: finance establishments reported aggressive plans to add such services within a year, followed by manufacturing and distribution. The differences between U.S. and establishments in other countries in this regard are small: non-U.S. establishments and large establishments are somewhat more ambitious than all establishments together.
INFORMATION SHARING SERVICES Application services in the U.S e-commerce infrastructure are highly developed. U.S. companies are leading users of e-mail and file sharing services, and enjoy the world's most extensive support for Electronic Data services through the application of ANSI X12 EDI standards. U.S. e-commerce infrastructure is expected to grow substantially in scale and scope in the coming years. A key are development of Internet-based standards and protocols that enhance system-to-system interoperability and application service integration across organizational boundaries. One direction in this area is the creation of new e-collaboration spaces within supply-chains which do not only automate transactions, but provide a space for much broader and deeper electronic
5 E-commerce from mobile devices is often referred to as M-commerce.
Figure 2. Internet Indicators in the U.S.

Communications of the Association for Information Systems (Volume 16, 2005) 559-603 569
Diffusion and Impacts of E-Commerce in the United State of America: Results from an Industry Survey by V.V. Fomin, J.L. King, K.J. Lyttinen, and S. T. McGann
Table 7. Content/Services To Mobile Customers, 2002
Establishment Sizea
Sectorb
Total
Percent providing or planning to provide mobile content or servicese
SME
Large
Mfg.
Distrib.
Finance
U.S.c
Globald
Already available 14.7 13.9 10.7 18.0 8.1 14.6 13.7 Plan to add within the next
year 15.1 19.7 17.7 11.0 29.4 15.7 18.2
Notes: a SME (small and medium sized establishments) are those with 25-250 employees; large are those with more than 250 employees. b Manufacturing includes all establishments classified as SIC 20-39; distribution includes wholesale and retail (SIC 50-54, 56-57, 59); finance includes banking and insurance (SIC 60-65). c Responses were weighted based on the total number of establishments by employee size within the sector for each country. Survey sample sizes for U.S. by sector are 100 establishments in manufacturing , 100 in wholesale & retail distribution, and 100 in banking & insurance; by size are 155 establishments classified as SME and 145 as large. d Consists of weighted survey responses in 10 countries combined: United States, Mexico, Brazil, Germany, France, Denmark, Singapore, Taiwan, China and Japan. “Global” sample sizes by sector are 743 in manufacturing , 701 in wholesale/retail distribution, and 695 in banking & insurance; by size are 1,088 establishments classified as SME and 1,053 as large. e Exact wording of question: Today it is possible to access content or services from various mobile devices such as mobile phones and handhelds such as Palms or Pocket PC devices. Does your organization provide or plan to provide content or services that mobile customers can access?
Source: CRITO Global E-Commerce Survey, 2002
integration between supply chain partners (e.g., quality control, design modifications, and demand information sharing). The adoption of such systems has been increasing due to their low cost compared to earlier EDI services, their flexibility, and the broad range of support functionality they provide.
The U.S. is a leading participant in the development of second-generation B2B platforms to follow first-generation EDI services. These platforms include the standardization of business-related web services at W3C6 and OASIS consortia where new business inter-operability standards drawing upon XML (Extensible Markup Language) [Solomon and Simon, 2001] are being developed. Such standards cover SOAP (Simple Object Access Protocol), WSDL (Web Service Description Language) and UDDI (Universal Description, Discovery and Integration). Both IBM and Microsoft have developed centralized UDDI registry services they offer to business partners for free. Also higher-level business transaction protocols and frameworks that are expected to replace earlier EDI ANSI X12 standards are forged through EbXML and Biznet consortia. These frameworks have been adopted in many emerging industry-wide e-market places as underlying standards including Rosettanet (electronics), Covisint (Car industry), and Esteel (steel industry), just to name a few. Though the development of standards has been relatively fast, the adoption and impact of such technologies is still in early stages and uncertain. Unresolved issues remain related to cross-industry standardization, security, and performance of such technologies. Another challenge is the political and business problems in developing and maintaining industry wide e-market places.
BusinessWeek [2003d] outlines two important emerging standardization initiatives affecting system interoperability within e-commerce space. The first, seeks to standardize and maintain e-
6 A list of abbreviations and their meanings is included following Appendix I.

570 Communications of the Association for Information Systems (Volume 16, 2005) 559-603
Diffusion and Impacts of E-Commerce in the United State of America: Results from an Industry Survey by V.V. Fomin, J.L. King, K.J. Lyttinen, and S. T. McGann
catalogs of the products retailers sell. This initiative is expected to save retailers and manufacturers $50 billion a year [Mullaney and Coy, 2003, p.72]. Another similar initiative, dubbed UUCnet7, seeks to standardize manufacturers’ product catalogs and how to distribute them to retailers. It is estimated, that stores and manufacturers each lose up to $2 million in profits on every $1 billion of sales because of bad data [Mullaney and Coy, 2003]. Another important cross-industry project is an attempt to standardize radio-frequency identification (RFID) chips and related product information catalogues. This initiative will allow retailers and suppliers to track goods downstream all the way from the factory to the retail sales and after-sales service including maintenance and service. Wal-Mart, for example, is heavily investing in the project, expecting by 2007 to boost earnings 38% by using RFID widely [Hof, 2003, p.70].
IT INVESTMENT
Two different types of investment are relevant to e-commerce:
1. investment in telecommunication infrastructure, and 2. investment in e-commerce equipment and protocols.
Investments in Telecom U.S. telecommunications investment ran between .17% and .32% of GDP between 1995 and 2002. Levels of investment in 2002 were down from what they were through the years of slow growth between 1996 and 1998. Overall spending on telecommunications services is expected to exceed $165.2 billion by 2009, from the $154.4 billion spent in 2004, a CAGR of 1.4% [Tekrati.com, 2005b]. Despite the fall in telecom investments between 1995 and 1998 the number of main and digital line and cell phone subscribers was growing. The sharp decline in investment in 2002 coincided with the reversal of the trend in fixed line growth, but has not affected the steady growth in cellphone subscribers. The post-1995 decline in investment can be attributed to several factors, including the cut in surplus investments due to recession. With flat revenues, carriers are increasingly buying new equipment only when their networks need fixing [BusinessWeek Online, 2003h]. Hardware costs (including fiber optic cables) decreased drastically. Two other important reasons for the decline are
1. the debt that the biggest telecom providers created during the reintegration of local and long-distance services in the 1990s8 into an “all-distance” telecom [BusinessWeek Online, 2003a], and
2. the regulatory tension created by the 1996 Telecommunications Act that obliged incumbent operators to sell capacity on their local networks at wholesale rates to all comers – at rates reported to be below cost [BusinessWeek Online, 2003b].
Although the decline in telecom investments reversed in 1998, the growth was slow just to see a swift decline in 2002. The year 2003 is believed to be the first year of a telecom recovery [BusinessWeek Online, 2003b]. The increase in investments is due mostly to the result of the advent of IP telephony. Some analysts report that 2004 was a break-through year for VoIP adoption in North America, and 2005 is shaping up for more of the same9 [Tekrati.com, 2005a]. On the other hand, the growth of investment in IP telephony is being held back by the installed
7 UUCnet received its name from the Uniform Code Council trade group, which coordinates the project. 8 For example, AT&T spent $97 billion buying cable TV properties that it has since sold to Comcast at a loss, SBC spent $56 billion to buy Bell Ameritech, and Vrizon spent 52.9 million to purchase GTE [BusinessWeek Online, 2003b]. 9 A report released in February 2004 from National Cable and Telecommunications Association states the following: �”Compared to circuit-switched telephony, VoIP offers lower rollout costs, increased flexibility, and more innovative and advanced services. More specifically, VoIP allows a provider to avoid the huge capital expenditures and investments needed to purchase and install circuit switches” [NCTA, 2004].

Communications of the Association for Information Systems (Volume 16, 2005) 559-603 571
Diffusion and Impacts of E-Commerce in the United State of America: Results from an Industry Survey by V.V. Fomin, J.L. King, K.J. Lyttinen, and S. T. McGann
base of telecom service providers in the traditional circuit-switched PBXs, which still meet customer demand. IP PBX shipments in 2004 accounted only for 10% of the total PBX line shipments worldwide, with 44 percent of the total revenue coming from North American sales [TechWeb.com, 2004]. Carriers also are experimenting with new services including high-speed wireless Internet access, but with precautions [BusinessWeek Online, 2003h]. Analysts suggest that wireless and IP services can be expected to drive telecom growth in the near future, but the bulk of telecommunications revenue is going to continue to be supported by voice services [Tekrati.com, 2005b]. For the moment there is not enough data traffic for carriers to justify the cost of building municipal or nation- wide Wi-Fi networks [BusinessWeek Online, 2003c, Tekrati.com, 2005c].
Investments in IT IT investment in the US are traditionally strong, and are likely to remain so in the future [Fomin et al., 2003]. Improving cost/performance in ICT encouraged investment (Figure 3). A major bubble in IT investment in computers between 1995 and 2000 relative to flat GDP growth resulted in a major increase in IT capital stock. Software investment also rose during this time, but with a somewhat flatter slope. Overall, IT investment rose during the 1990s, but decelerated significantly in 2001 as the dot.com bubble burst and a recession in the high-technology sector began. Still, investment in the sector continues and in the long run the decrease in IT investment between 1998 and 2001 (Figure 3) does not necessarily imply negative growth in the IT industry. The decline of the curve was affected, among other factors, by drastic reduction of prices as technological progress in materials, design, and manufacturing accelerated [Bayoumi and Haacker, 2002]. Also, during the downturn of dot.com firms, companies like Amazon and Google were actually expanding, buying office spaces and equipment of less successful IT entrepreneurs at liquidation prices [Vogelstein, 2003].
-10%
0%
10%
20%
30%
40%
50%
60%
1990 91 92 93 94 95 96 97 98 99 00 01 Q2
Computers and peripheral equipmentSoftwareTelecommunications equipmentReal GDP growth
Notes: 1 Real gross fixed investment. Source: [International Monetary Fund, 2001], referring to the U.S. Department of Commerce, Bureau of Economic Analysis.
Figure 3. Information Technology Investment in the United States1.
572 Communications of the Association for Information Systems (Volume 16, 2005) 559-603
Diffusion and Impacts of E-Commerce in the United State of America: Results from an Industry Survey by V.V. Fomin, J.L. King, K.J. Lyttinen, and S. T. McGann
The current situation is well reflected in the business trade press.
“Investors are cautious about handing over more dough to venture capitalists after being left with battered remnants of hundreds of dot-com flops. Indeed, the money committed to venture capital is expected to total just $25 billion this year, down from a high of $99.8 billion in 2000. But that still would be one of the industry’s best years ever and puts it back above its 1997 level – in other words, back to what was normal before the Internet boom knocked everything off-kilter” [BusinessWeek Online, 2003f]
Investment in IT is expected to continue and might accelerate again as the economy begins to recover. In their report, Standard & Poor estimated that IT equipment investment will rise more than twice as fast as the overall economy grows between 2004-06 – somewhere between 8.5% and 9.5% [BusinessWeek Online, 2003e]. Forrester predicts that spending on IT goods, services, and staff will grow 7 percent in 2005 and continue at a similar pace through 2008 – only slightly faster than overall economic growth [Tekrati.com, 2004].
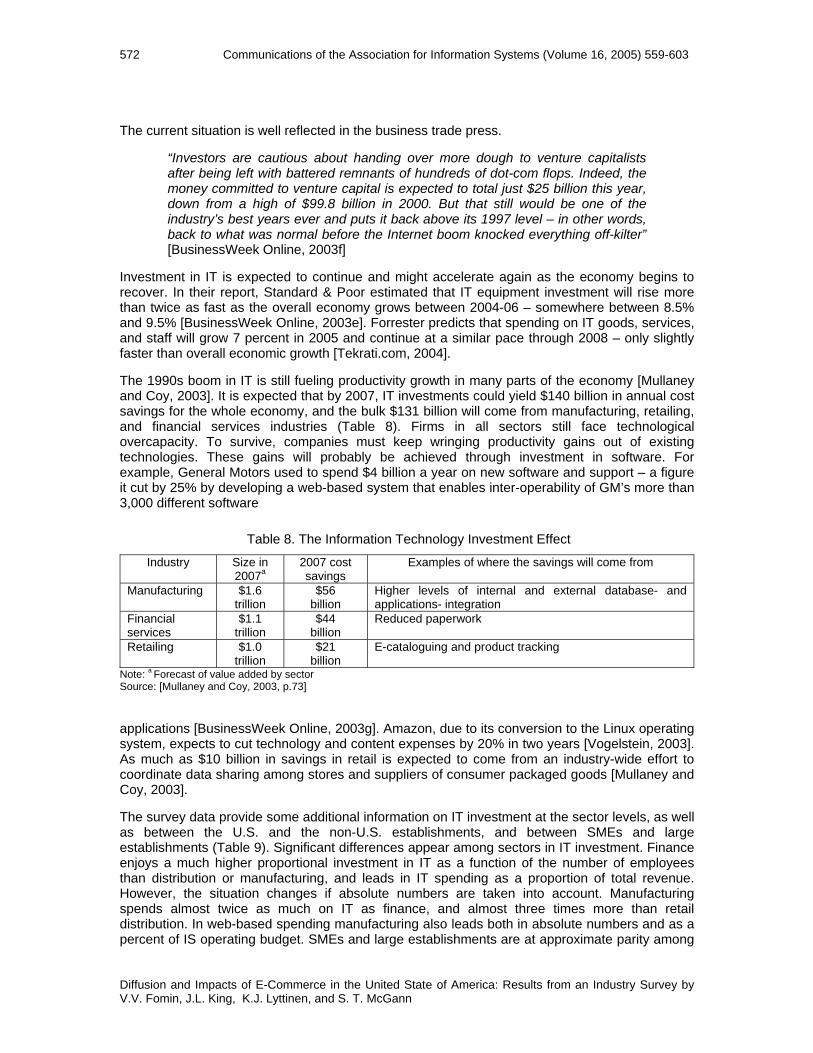
The 1990s boom in IT is still fueling productivity growth in many parts of the economy [Mullaney and Coy, 2003]. It is expected that by 2007, IT investments could yield $140 billion in annual cost savings for the whole economy, and the bulk $131 billion will come from manufacturing, retailing, and financial services industries (Table 8). Firms in all sectors still face technological overcapacity. To survive, companies must keep wringing productivity gains out of existing technologies. These gains will probably be achieved through investment in software. For example, General Motors used to spend $4 billion a year on new software and support – a figure it cut by 25% by developing a web-based system that enables inter-operability of GM’s more than 3,000 different software
Table 8. The Information Technology Investment Effect
Industry Size in 2007a
2007 cost savings
Examples of where the savings will come from
Manufacturing $1.6 trillion
$56 billion
Higher levels of internal and external database- and applications- integration
Financial services
$1.1 trillion
$44 billion
Reduced paperwork
Retailing $1.0 trillion
$21 billion
E-cataloguing and product tracking
Note: a Forecast of value added by sector Source: [Mullaney and Coy, 2003, p.73]
applications [BusinessWeek Online, 2003g]. Amazon, due to its conversion to the Linux operating system, expects to cut technology and content expenses by 20% in two years [Vogelstein, 2003]. As much as $10 billion in savings in retail is expected to come from an industry-wide effort to coordinate data sharing among stores and suppliers of consumer packaged goods [Mullaney and Coy, 2003].
The survey data provide some additional information on IT investment at the sector levels, as well as between the U.S. and the non-U.S. establishments, and between SMEs and large establishments (Table 9). Significant differences appear among sectors in IT investment. Finance enjoys a much higher proportional investment in IT as a function of the number of employees than distribution or manufacturing, and leads in IT spending as a proportion of total revenue. However, the situation changes if absolute numbers are taken into account. Manufacturing spends almost twice as much on IT as finance, and almost three times more than retail distribution. In web-based spending manufacturing also leads both in absolute numbers and as a percent of IS operating budget. SMEs and large establishments are at approximate parity among

Communications of the Association for Information Systems (Volume 16, 2005) 559-603 573
Diffusion and Impacts of E-Commerce in the United State of America: Results from an Industry Survey by V.V. Fomin, J.L. King, K.J. Lyttinen, and S. T. McGann
large and small in the area of IT investments per employee, but major differences in both IT spending and web-based spending are seen as a proportion of revenue or budget, where larger establishments clearly out-invest smaller establishments in those categories.
Table 9. Investment in IT technologies, 2002
United States Large SME Mfg. Distrib. Finance
Number of PCs per employee 0.65 0.64 0.77 0.14 0.98 1.33IT employees as % of total employees 5.95 5.96 5.83 0.90 8.17 13.41Total IS operating budget (in millions of dollars) 90,832.6189,187.021,645.5843,137.3218,876.5628,818.73Total IS operating budget as % of 2001 Revenue 4.17 4.39 1.10 3.40 3.18 9.09Web-based spending (in millions of dollars) 12,374.6812,300.74 73.9410,482.40 531.36 1,360.92Web-based spending as % of IS operating budget 13.62 13.79 4.49 24.30 2.81 4.72
Note: Survey data, our own calculations
The findings in Table 9 must be understood in conjunction with Table 3, shown in Section III, and Table 21, shown in Section VI. Manufacturing uses the lowest number of PCs per employee and the lowest number of IT employees as a percent of total employees among the three sectors. Yet, manufacturing reports substantially higher web-based spending than the other two sectors. This high expenditure on web-based applications might be explained by the globalized character of the sector, and its more diverse system-to-system applications (Table 21, Section VI). In manufacturing, more companies report using extranets accessible to supplier and business partners than in the other two sectors (20% vs. 16%, Table 10 in the next subsection). Manufacturing is also the highest Internet-based EDI and extranet services user. As Table 22 shows, almost 60% of manufacturers’ web sites support product configuration – a complex information-intensive service. The survey data, unfortunately, do not include data on similar, complex services for either finance10 or distribution sectors. It is not clear why web-based service provision costs so much in manufacturing. What we assume is that on-line product configuration and use of Internet-based EDI are costly services that manufacturing establishments must undertake as part of their B2B effort if they are to reap operational benefits such as lower manufacturing costs, faster cycle times, and lower inventories.
ORGANIZATIONAL READINESS FOR E-COMMERCE
Organizational readiness is an organization’s capability to make sense of, appropriate, deploy and mobilize emerging and available e-commerce technologies in their competitive and organizational environment. We used three measures to profile organizational readiness:
• the extent of on-line buying and selling, • types of technologies used in e-commerce, and • the level of business integration (internal and external) with information technologies.
Types of Technologies Used Seven technologies used for e-commerce in 2002 are shown in Table 10. More than 82% of all American businesses reported being connected to the Internet in some way. Among medium and large businesses, more than 90% were connected. Between one-quarter and one-half of companies in the electronics, IT, and telecommunications sectors were engaging in an electronic supply chain. Among U.S. establishments, nearly all use email and over 80% maintain web sites of some kind. Over 80% of finance establishments use electronic funds transfer; levels for
10 The closest comes probably bill payment in the finance sector (60% of surveyed companies offered this service).

574 Communications of the Association for Information Systems (Volume 16, 2005) 559-603
Diffusion and Impacts of E-Commerce in the United State of America: Results from an Industry Survey by V.V. Fomin, J.L. King, K.J. Lyttinen, and S. T. McGann
manufacturing and distribution are somewhat lower. Between one-third and two-thirds of establishments use EDI, Intranets, and call centers, with less than one-third using extranets.
Table 10. Use of E-Commerce Technologies, 2002
Establishment Sizea
Sectorb
Total
Percent using … SME Large Mfg. Distrib. Finance U.S.c Globald E-mail 99.5 99.9 98.3 100.0 100.0 99.6 98.5 Web-site 78.2 90.2 85.1 76.1 85.5 79.8 74.1 Intranet 53.0 77.7 52.1 57.7 56.6 56.2 63.6 Extranet 26.4 43.7 29.9 28.9 26.3 28.7 32.7 • accessible by suppliers/
business partnerse
14.0
35.8
20.0
15.9
16.4
16.9
20.9 • accessible by customerse 14.1 25.5 19.0 13.6 17.6 15.6 17.8 • EDI 39.2 64.7 58.1 37.6 37.2 42.5 44.3 • over private networks onlye 15.3 29.5 26.4 16.9 4.6 17.1 19.4 • Internet-based onlye 8.4 8.6 11.7 6.7 9.8 8.4 8.4 • bothe 25.5 19.0 13.1 22.7 16.1 15.9 14.7
EFT 62.4 65.1 53.7 60.3 82.0 62.7 43.4 Call center 55.6 48.3 35.4 48.1 40.5 32.3 38.2
Notes: a SME (small and medium sized establishments) are those with 25-250 employees; large are those with more than 250 employees.
b Manufacturing includes all establishments classified as SIC 20-39; distribution includes wholesale and retail (SIC 50-54, 56-57, 59); finance includes banking and insurance (SIC 60-65).
c Responses were weighted based on the total number of establishments by employee size within the sector for each country. Survey sample sizes for U.S. by sector are 100 establishments in manufacturing , 100 in wholesale & retail distribution, and 100 in banking & insurance; by size are 155 establishments classified as SME and 145 as large.
d Consists of weighted survey responses in 10 countries combined: United States, Mexico, Brazil, Germany, France, Denmark, Singapore, Taiwan, China and Japan. “Global” sample sizes by sector are 743 in manufacturing , 701 in wholesale/retail distribution, and 695 in banking & insurance; by size are 1,088 establishments classified as SME and 1,053 as large.
e Percent based on total sample. Source: CRITO Global E-Commerce Survey, 2002
The U.S. manufacturing sector is a slightly higher user of extranets by customers and suppliers than are the distribution and finance sectors. Because manufacturing is more globalized than the other two sectors, the observed reliance on extranets is not surprising. Manufacturing establishments also report they use EDI almost twice as often as companies in the other two sectors (58% vs. 37%). This data also reflects the global nature of manufacturing that draws upon a large network of customers and suppliers. Although Internet-based EDI systems are cheaper and easier to install than those using VANs, the lack of security issues might be one reason for manufacturing and distribution companies to use to a larger proportion of VAN-based EDI services.
Except for modestly greater use of EFT by the U.S. establishments, the U.S. and the non-U.S. establishments were quite similar in their use of different e-commerce technologies. As expected, large establishments showed somewhat greater use of different technologies than SMEs. Large past investments render establishments often inflexible and they cannot rapidly reorient their technology platforms [Ciborra et al., 2001].
Business Integration Using IT The survey data provide a glimpse of the extent to which establishments are using IT to integrate their business processes internally and with external establishments (Table 12). Internal integration is more advanced than external integration. About two-thirds of establishments have Intranets, compared to only about one-quarter with Extranets accessible by suppliers or customers. The strongest indicator of actual internal integration is the degree to which establishments make use of internal databases and information systems for that purpose: about
Communications of the Association for Information Systems (Volume 16, 2005) 559-603 575
Diffusion and Impacts of E-Commerce in the United State of America: Results from an Industry Survey by V.V. Fomin, J.L. King, K.J. Lyttinen, and S. T. McGann
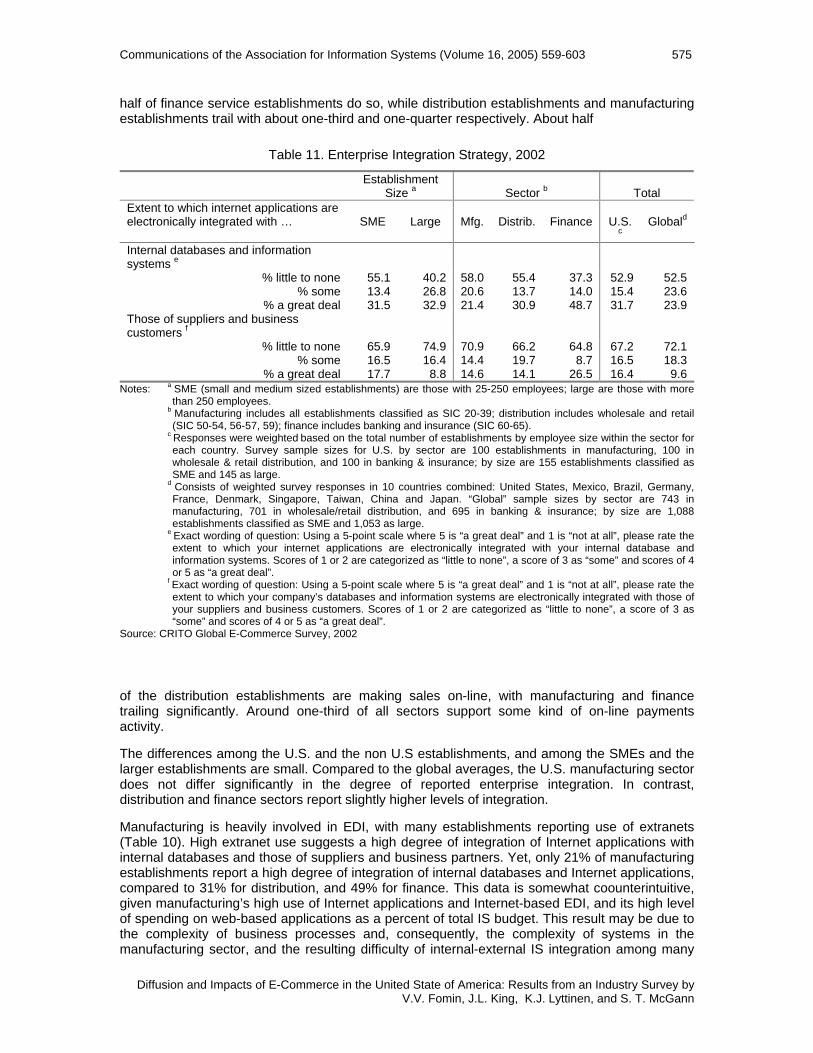
half of finance service establishments do so, while distribution establishments and manufacturing establishments trail with about one-third and one-quarter respectively. About half
Table 11. Enterprise Integration Strategy, 2002
Establishment Size a
Sector b
Total
Extent to which internet applications are electronically integrated with …
SME
Large
Mfg.
Distrib.
Finance
U.S.
c
Globald
Internal databases and information systems e
% little to none 55.1 40.2 58.0 55.4 37.3 52.9 52.5 % some 13.4 26.8 20.6 13.7 14.0 15.4 23.6
% a great deal 31.5 32.9 21.4 30.9 48.7 31.7 23.9 Those of suppliers and business customers f
% little to none 65.9 74.9 70.9 66.2 64.8 67.2 72.1 % some 16.5 16.4 14.4 19.7 8.7 16.5 18.3
% a great deal 17.7 8.8 14.6 14.1 26.5 16.4 9.6 Notes: a SME (small and medium sized establishments) are those with 25-250 employees; large are those with more
than 250 employees. b Manufacturing includes all establishments classified as SIC 20-39; distribution includes wholesale and retail
(SIC 50-54, 56-57, 59); finance includes banking and insurance (SIC 60-65). c Responses were weighted based on the total number of establishments by employee size within the sector for
each country. Survey sample sizes for U.S. by sector are 100 establishments in manufacturing, 100 in wholesale & retail distribution, and 100 in banking & insurance; by size are 155 establishments classified as SME and 145 as large.
d Consists of weighted survey responses in 10 countries combined: United States, Mexico, Brazil, Germany, France, Denmark, Singapore, Taiwan, China and Japan. “Global” sample sizes by sector are 743 in manufacturing, 701 in wholesale/retail distribution, and 695 in banking & insurance; by size are 1,088 establishments classified as SME and 1,053 as large.
e Exact wording of question: Using a 5-point scale where 5 is “a great deal” and 1 is “not at all”, please rate the extent to which your internet applications are electronically integrated with your internal database and information systems. Scores of 1 or 2 are categorized as “little to none”, a score of 3 as “some” and scores of 4 or 5 as “a great deal”.
f Exact wording of question: Using a 5-point scale where 5 is “a great deal” and 1 is “not at all”, please rate the extent to which your company’s databases and information systems are electronically integrated with those of your suppliers and business customers. Scores of 1 or 2 are categorized as “little to none”, a score of 3 as “some” and scores of 4 or 5 as “a great deal”.
Source: CRITO Global E-Commerce Survey, 2002
of the distribution establishments are making sales on-line, with manufacturing and finance trailing significantly. Around one-third of all sectors support some kind of on-line payments activity.
The differences among the U.S. and the non U.S establishments, and among the SMEs and the larger establishments are small. Compared to the global averages, the U.S. manufacturing sector does not differ significantly in the degree of reported enterprise integration. In contrast, distribution and finance sectors report slightly higher levels of integration.
Manufacturing is heavily involved in EDI, with many establishments reporting use of extranets (Table 10). High extranet use suggests a high degree of integration of Internet applications with internal databases and those of suppliers and business partners. Yet, only 21% of manufacturing establishments report a high degree of integration of internal databases and Internet applications, compared to 31% for distribution, and 49% for finance. This data is somewhat coounterintuitive, given manufacturing’s high use of Internet applications and Internet-based EDI, and its high level of spending on web-based applications as a percent of total IS budget. This result may be due to the complexity of business processes and, consequently, the complexity of systems in the manufacturing sector, and the resulting difficulty of internal-external IS integration among many

576 Communications of the Association for Information Systems (Volume 16, 2005) 559-603
Diffusion and Impacts of E-Commerce in the United State of America: Results from an Industry Survey by V.V. Fomin, J.L. King, K.J. Lyttinen, and S. T. McGann
suppliers. When we gathered our data in 2003, only the 1st tier suppliers (those that supply directly to OEMs) could achieve high levels of integration of their Internet applications with their business partners. This observation is partially reflected in the survey data, which showed that 15% of SMEs vs. 7% of large establishments reporting a great deal of integration – the only significant difference in enterprise integration in manufacturing. The security requirements in a large network of suppliers might cause a low level of enterprise integration, especially in manufacturing and finance establishments that want to prevent information from being stolen. For example, an initiative by General Motors to develop web-services that integrate organization-wide software services among its 3,000 different systems will not be extended to parts and inventory directories with GM suppliers because of security concerns [BusinessWeek Online, 2003g].
The Extent of Buying and Selling The survey data provide useful insights into on-line buying and selling behaviors (Tables 17, 19, and 21) The data show that about three-quarters of U.S. establishments understand the concept of an electronic marketplace, and about half of them participate in buying and/or selling on-line. About one-third of the money spent on supplies and equipment is transacted on-line across establishments. As shown, however, only B2B on-line sales in manufacturing come close to 20% of buying and selling (Table 1). Financial service establishments tend to be more engaged in buy-only behavior than manufacturing or distribution and do little selling on-line. Distribution establishments tend to be engaged in both buying and selling to a greater extent than manufacturing and finance, buying from manufacturers and selling to other businesses or consumers.
U.S. and the non-U.S. establishments are quite similar across the categories, although U.S. establishments show a somewhat higher level of engagement in on-line selling (buying+selling) than the non-U.S. establishments, and U.S. establishments order slightly more supplies and equipment on-line. These differences are small, however. Remember, however, that the establishments represent technology leaders in each country – not the overall country average.
Therefore, great differences would not be expected in this group. Similarly, we observed only slight differences between the SMEs and larger establishments in terms of the extent of on-line buying and selling, with the larger establishments showing slightly greater activity.
GLOBALIZATION
Earlier research shows that the level of an establishment’s globalization correlates significantly with the propensity to adopt e-commerce, and an establishment’s capability to engage in global operations is one critical capability that can affect e-commerce readiness [Gibbs et al., 2002]. Data from the survey (Table 13) offer a profile of globalization among participating establishments.
A substantial majority of both the U.S. and the non-U.S. establishments surveyed are domestic, but the non-U.S. establishments generate more international activity than the U.S. establishments. Manufacturing is the most globalized sector in the U.S., with 36% of surveyed companies having establishments abroad. Among the surveyed manufacturing companies that use the Internet, about 10% are headquartered abroad. Their total sales and procurement to/from abroad is more than 10%. One-third of companies report a high degree of foreign competition. The U.S. finance sector is the least globalized sector, the least affected by foreign competition, procures the least from abroad, and only operates one-third the number of establishments abroad compared to manufacturing. The U.S. distribution sector lies between manufacturing and finance, and with the exception of establishments abroad, is substantially below the global average.

Communications of the Association for Information Systems (Volume 16, 2005) 559-603 577
Diffusion and Impacts of E-Commerce in the United State of America: Results from an Industry Survey by V.V. Fomin, J.L. King, K.J. Lyttinen, and S. T. McGann
Table 13. Globalization Indicators, 2002
Establishment Sizea
Sectorb
Total
SME Large Mfg. Distrib. Finance U.S.c Globald Percent of companies with establishments abroad
20.0
46.4
36.1
21.4
13.2
23.4
23.9
Percent of companies with headquarters abroad
5.0
8.0
9.3
4.6
3.2
5.4
8.5
Mean percent of total sales from abroad 4.7 7.5 11.5 3.1 4.0 5.1 12.1 Mean percent of total procurement spending from abroad
8.3
7.8
12.6
8.9
0.7
8.2
20.3
Degree affected by competitors abroade Low 79.8 70.1 45.1 86.2 96.0 78.5 68.3 Moderate 9.3 13.7 20.3 7.7 3.6 9.9 15.7 High 11.0 16.1 34.6 6.2 .4 11.6 15.2
Notes: a SME (small and medium sized establishments) are those with 25-250 employees; large are those with more than 250 employees.
b Manufacturing includes all establishments classified as SIC 20-39; distribution includes wholesale and retail (SIC 50-54, 56-57, 59); finance includes banking and insurance (SIC 60-65).
c Responses were weighted based on the total number of establishments by employee size within the sector for each country. Survey sample sizes for U.S. by sector are 100 establishments in manufacturing, 100 in wholesale & retail distribution, and 100 in banking & insurance; by size are 155 establishments classified as SME and 145 as large.
d Consists of weighted survey responses in 10 countries combined: United States, Mexico, Brazil, Germany, France, Denmark, Singapore, Taiwan, China and Japan. “Global” sample sizes by sector are 743 in manufacturing, 701 in wholesale/retail distribution, and 695 in banking & insurance; by size are 1,088 establishments classified as SME and 1,053 as large.
e Exact question wording: Using a 5-point scale where 5 is significantly affected and 1 is not at all affected, please tell me how much your establishment is affected by competitors from outside your country. Scores of 1 and 2 were classified as low, a score of 3 as moderate, and scores of 4 and 5 as high.
Source: CRITO Global E-Commerce Survey, 2002
SUMMARY: READINESS FOR E-COMMERCE
U.S. establishments are ready for e-commerce, with some caveats. The U.S. is the world’s largest economy, and is highly diverse. That many establishments are ready for e-commerce does not mean all the U.S. establishments are ready. The differences in e-commerce experience between large establishments and SMEs are slight, suggesting a considerable population of
small establishments (less than 25 employees) that are less prepared for e-commerce. Routine use of e-commerce lags behind more traditional forms of commerce. Most IT uses in establishments are for communication and information sharing such as email, web sites, and file transfer. The primary challenge of readiness for e-commerce for most establishments is business integration, in knowing what needs to be integrated and how IT can help.
V. KEY DRIVERS AND BARRIERS
Ability to use the Internet is a key factor in e-commerce [Fomin et al., 2003]. Drivers and barriers to Internet use include the nature and content of internal business processes, cost issues, and political and social factors.
DRIVERS OF INTERNET USE The survey data provide a useful picture of the drivers behind adoption of Internet services (Table 14). The drivers are similar across all three sectors, including

578 Communications of the Association for Information Systems (Volume 16, 2005) 559-603
Diffusion and Impacts of E-Commerce in the United State of America: Results from an Industry Survey by V.V. Fomin, J.L. King, K.J. Lyttinen, and S. T. McGann
• expansion of markets for existing products and services (49.8%), • improvement of coordination with customers and suppliers (41.6%), • penetration of new businesses or markets (39.2%), • meeting customer demand (35.5%) • meeting competitor action (33.1%), and • cost reduction (32.6%).
Table 14. Drivers for Internet use, 2002
Establishment Sizea
Sectorb
Total
% indicating driver is a significant factor …e
SME
Large
Mfg.
Distrib.
Finance
U.S.c
Globald
To expand market for existing product or services
48.0 61.2 52.1 45.4 61.7 49.8 47.9
To improve coordination with customers and suppliers
38.3 63.0 50.5 37.8 42.8 41.6 43.7
To enter new businesses or markets 38.1 46.6 45.2 38.6 33.5 39.2 42.0 Customers demanded it 34.5 42.1 35.2 33.8 41.9 35.5 36.9 Major competitors were online 31.1 46.1 30.3 28.1 55.5 33.1 31.3 To reduce costs 31.5 39.5 36.4 30.0 36.5 32.6 35.7 Suppliers required it 18.0 23.2 21.9 18.8 14.2 18.7 22.3 Required for government procurement 9.5 6.0 13.3 8.5 4.7 9.0 15.2 Government provided incentives 3.8 1.3 4.5 3.9 0.4 3.4 8.3
Notes: a SME (small and medium sized establishments) are those with 25-250 employees; large are those with more than 250 employees.
b Manufacturing includes all establishments classified as SIC 20-39; distribution includes wholesale and retail (SIC 50-54, 56-57, 59); finance includes banking and insurance (SIC 60-65).
c Responses were weighted based on the total number of establishments by employee size within the sector for each country. Survey sample sizes for U.S. by sector are 100 establishments in manufacturing , 100 in wholesale & retail distribution, and 100 in banking & insurance; by size are 155 establishments classified as SME and 145 as large.
d Consists of weighted survey responses in 10 countries combined: United States, Mexico, Brazil, Germany, France, Denmark, Singapore, Taiwan, China and Japan. “Global” sample sizes by sector are 743 in manufacturing , 701 in wholesale/retail distribution, and 695 in banking & insurance; by size are 1,088 establishments classified as SME and 1,053 as large.
e Exact wording of question: Using a 5-point scale where 5 is “a very significant factor” and 1 is “not a factor at all,” please rate how significant each of the following was to your organization’s decision to begin using the Internet for business. A score of 4 or 5 was classified as “a significant factor”.
Source: CRITO Global E-Commerce Survey, 2002
Across all establishments, these drivers were reported by between one-third and two-thirds of establishments. Less commonly noted drivers were demands by suppliers (18.7%), and government requirements or incentives (less than 10%). Manufacturing and distribution report similar key drivers, with the distribution sector ahead on most. Finance reports greater need to expand markets for existing products and services, and greater pressure from customers and competitors to provide services. Financial service establishments might be under competitive pressure related to use of IT due to dependence on IT for all aspects of their operations, including customer service delivery. In contrast, manufacturing establishments seek to build efficient information sharing channels between a large number of their suppliers and customers.
Cost reductions were among the less significant drivers in all three sectors (30.0% in distribution, 36.5% in both manufacturing and finance). Firms appear to be well aware of the relative high costs associated with the adoption of Internet technologies to conduct e-commerce, and do not expect significant cost reductions from using new channels for their commerce. There are small differences between U.S. non-U.S. establishments with respect to drivers. U.S. establishments cite market expansion slightly more frequently, and new market penetration less so. U.S. establishments compete in domestic markets and are less aggressive in diversifying to international markets. The U.S. government offers few incentives for Internet use compared to

Communications of the Association for Information Systems (Volume 16, 2005) 559-603 579
Diffusion and Impacts of E-Commerce in the United State of America: Results from an Industry Survey by V.V. Fomin, J.L. King, K.J. Lyttinen, and S. T. McGann
governments in other countries, reflecting the view that the private sector must lead in e-commerce development. Larger establishments report substantially greater need to expand markets (61%) and improve coordination with customers and suppliers (63%) than SMEs (48% and 38% respectively). Government incentives related to procurement were more important for large establishments than for SMEs except in manufacturing, where small establishments assign greater importance to every driver except for two: demand of suppliers (18.4% vs. 36.0% for large establishments), and improvement of coordination with suppliers and customers (46.9% vs. 64.0%). This difference may be the result of many SMEs in manufacturing being suppliers to large manufacturing establishments.
BARRIERS TO INTERNET USE
Perceived barriers to Internet use are shown in Table 15. Three barriers to Internet use
• privacy, • need for face-to-face interaction, and • cost of implementing of e-commerce
Table 15. Barriers for Internet Use, 2002
Establishment Sizea
Sectorb
Total
% indicating statement is a significant obstaclee
SME
Large
Mfg.
Distrib.
Finance
U.S.c
Globald
Concern about privacy of data or security issues
47.9 42.4 48.8 40.9 66.7 47.1 44.2
Need for face-to-face customer interaction
43.2 32.1 43.3 37.8 53.5 41.7 33.8
Costs of implementing an e-commerce site
32.5 25.1 27.0 31.2 39.3 31.5 33.6
Customers do not use the technology 26.6 28.5 17.5 32.4 20.8 26.9 31.4 Finding staff with e-commerce expertise 24.5 22.0 22.8 25.5 21.1 24.1 26.5 Level of ability to use the Internet as part of business strategy
20.7 19.3 18.6 21.5 19.7 20.5 24.8
Prevalence of credit card use in the country
17.7 7.2 12.8 19.1 10.9 16.3 20.3
Taxation of internet sales 16.0 6.1 6.2 21.3 0.4 14.8 16.5 Making needed organizational changes 13.5 21.2 20.0 12.7 12.9 14.5 23.9 Inadequate legal protection for Internet purchases
12.5 7.5 11.5 11.2 14.8 11.9 34.1
Cost of internet access 12.2 1.7 4.5 12.3 14.4 10.8 15.1 Business laws do not support e-commerce
9.0 2.2 4.4 9.0 10.1 8.1 24.2
Notes: a SME (small and medium sized establishments) are those with 25-250 employees; large are those with more than 250 employees.
b Manufacturing includes all establishments classified as SIC 20-39; distribution includes wholesale and retail (SIC 50-54, 56-57, 59); finance includes banking and insurance (SIC 60-65).
c Responses were weighted based on the total number of establishments by employee size within the sector for each country. Survey sample sizes for U.S. by sector are 100 establishments in manufacturing , 100 in wholesale & retail distribution, and 100 in banking & insurance; by size are 155 establishments classified as SME and 145 as large.
d Consists of weighted survey responses in 10 countries combined: United States, Mexico, Brazil, Germany, France, Denmark, Singapore, Taiwan, China and Japan. “Global” sample sizes by sector are 743 in manufacturing , 701 in wholesale/retail distribution, and 695 in banking & insurance; by size are 1,088 establishments classified as SME and 1,053 as large.
e Exact wording of question: Using a 5-point scale where 5 is “a very significant obstacle” and 1 is “not an obstacle,” please rate how significant the following obstacles are to your establishment’s ability to do business on-line. A score of 4 or 5 was classified as “a significant obstacle”.
Source: CRITO Global E-Commerce Survey, 2002

580 Communications of the Association for Information Systems (Volume 16, 2005) 559-603
Diffusion and Impacts of E-Commerce in the United State of America: Results from an Industry Survey by V.V. Fomin, J.L. King, K.J. Lyttinen, and S. T. McGann
constitute the major concerns for both large and small establishments. SMEs raised concerns related to B2C e-commerce: prevalence of credit card use (17.7% vs. 7.2%), taxation of Internet sales (16.0% vs. 6.1%), inadequate legal protection for Internet purchases (12.5% vs. 7.5%), and cost to access the Internet (12.2% vs. 1.7%). Taxation and credit card use barriers are intuitively associated with B2C e-commerce, whereas concerns about the business laws and legal protection for Internet purchases, and cost of Internet access are generic small business barriers. Larger establishments, in contrast, were more concerned with the ease of access to communications, transportation, financial, or legal capability. U.S. establishments report fewer obstacles to Internet use than do non-U.S. establishments, with the exception of concerns about privacy of data and security (47.1% vs. 44.2%), and a need for face-to-face customer interaction (41.7% vs. 33.8%). These findings might be an artifact of the higher level of e-commerce activity in the U.S. and higher levels of transactions in open networks. Also, U.S. establishments adopt of EDI systems more, and EDI standards must be negotiated face-to-face. Finally, finance is a sensitive business demanding high levels of face-to-face interactions.
Similarities exist in barriers across the three sectors. For all sectors, privacy and security and the need for face-to-face communication form the major barriers, while costs for implementing e-commerce follow for finance and manufacturing, and a lack of customer ability to use technology in distribution. Financial service establishments show greater concern than manufacturing or distribution, possibly because financial services are inherently more sensitive than production and sale of physical products. The financial service industry also invests substantially more in IT than other sectors, which might make cost a serious concern. Distribution registers a substantially higher concern than the other sectors regarding use of credit cards in transactions and the taxation of Internet sales. These are concerns for B2C business; credit cards are the dominant form of payment in B2C e-commerce, and increased Internet taxation would affect B2C e-commerce directly. Manufacturing reports the challenge of making necessary organizational changes, possibly reflecting manufacturing’s special needs for organizational integration of e-business initiatives.
SUMMARY: DRIVERS AND BARRIERS
The sectors show some variance with respect to both drivers and barriers, consonant with the nature and structure of their industries. For example, financial service establishments deal routinely with information that customers find sensitive, privileged, or private and are particularly concerned about issues of privacy and security. Distribution establishments that interact with end consumers are understandably concerned about customer readiness for the use of e-commerce technologies and sales taxation. Nevertheless, there is significant agreement on the key drivers and barriers. The biggest driver for Internet use is market expansion, followed by a need to improve coordination with suppliers and customers in manufacturing, expansion to new markets in distribution, and competitive pressure in financial services. The biggest barrier for Internet use is the concern for privacy and data security, followed by the need for face-to-face communications and the cost of implementing an e-commerce site.
Few significant differences were found between large establishments and SMEs. Large establishments find competitive pressure to be a significant driver, and limits on customer use of technology to be a barrier. SMEs find customer demands for Internet use a driver, and the costs of implementing an e-commerce site a barrier. Large establishments tend to be somewhat more motivated by drivers and somewhat less concerned about barriers than SMEs. U.S. and the non-U.S. establishments show about the same attention to drivers, but U.S. establishments seem to be less concerned than non-U.S. establishments about barriers. This difference might be a result of the richer experience by the U.S. in e-commerce, or it could be an outcome of greater complexity facing the non-U.S. establishments due to their international scope of operations. Still, there are forces that encourage similarity in global perception of drivers and barriers to e-commerce. The business trade press is increasingly global and communicates shared views of drivers and barriers. Management consultancy on e-commerce is increasingly a global affair, and

Communications of the Association for Information Systems (Volume 16, 2005) 559-603 581
Diffusion and Impacts of E-Commerce in the United State of America: Results from an Industry Survey by V.V. Fomin, J.L. King, K.J. Lyttinen, and S. T. McGann
commerce itself is increasingly governed by global standards and practices that encourage uniformity.
VI. DIFFUSION OF E-COMMERCE
The survey provides insights about four aspects of e-commerce diffusion:
1. the use of the Internet as a distribution channel; 2. the level of on-line sales; 3. the level of on-line procurement; and 4. the use of Internet marketplaces. The data can also be used for a deeper structural
analysis of e-commerce diffusion as a function of the previously discussed drivers and barriers.
THE INTERNET AS A DISTRIBUTION CHANNEL
A comparison of the use of the Internet as a distribution channel across sectors and between the U.S. and the non-U.S. establishments is shown in Table 16. Manufacturing and distribution show similar profiles in use of the Internet as a distribution channel, with the majority of use in traditional distribution channels, followed by use that competes with or replaces traditional channels. Internet use is modest in creating entirely new channels.
Manufacturing and wholesale distribution use EDI extensively for e-commerce, and use the Internet to address traditional channels far more often than finance establishments. In addition, that distributors lead in using the Internet to replace traditional distribution channels could be related to the expansion of e-catalogues that are hoped to save the industry $21 billion by 2007 (Table 8, Section IV). Finance shows a much stronger use of the Internet to compete with existing channels. The surge among U.S. banks to introduce online banking might be one example of such a trend, and is consistent with data in Table 8, that show the U.S. finance service industry hoping to achieve $44 billion in savings as a result of reduced paperwork. Little difference was found between U.S. and the non-U.S. establishments, although, relative to U.S. establishments, the non-U.S. establishments tend to be a bit more aggressive in pursuit of new channels.
Table 16. How Establishments Use the Internet to Sell Products and Services, 2002
Establishment Sizea
Sectorb
Total
Percent indicating Internet used to …e SME Large Mfg. Distrib. Finance U.S.c Globald Address new markets only 9.6 2.2 11.6 8.2 5.2 8.5 15.3 Address traditional distribution channels only
45.5 39.2 49.9 47.3 20.3 44.6 44.1
Compete directly with traditional distribution channels
25.2
49.9
23.5
25.0
59.6
28.8
27.4
Replace traditional distribution channels 19.7 8.7 15.1 19.4 15.0 18.1 13.2 Notes: a SME (small and medium sized establishments) are those with 25-250 employees; large are those with more than
250 employees. b Manufacturing includes all establishments classified as SIC 20-39; distribution includes wholesale and retail (SIC
50-54, 56-57, 59); finance includes banking and insurance (SIC 60-65). c Responses were weighted based on the total number of establishments by employee size within the sector for each
country. Survey sample sizes for U.S. by sector are 100 establishments in manufacturing, 100 in wholesale & retail distribution, and 100 in banking & insurance; by size are 155 establishments classified as SME and 145 as large.
d Consists of weighted survey responses in 10 countries combined: United States, Mexico, Brazil, Germany, France, Denmark, Singapore, Taiwan, China and Japan. “Global” sample sizes by sector are 743 in manufacturing, 701 in wholesale/retail distribution, and 695 in banking & insurance; by size are 1,088 establishments classified as SME and 1,053 as large.
e Exact wording of question: Which of the following statements best characterizes how you are using the Internet to sell products and services.
Source: CRITO Global E-Commerce Survey, 2002
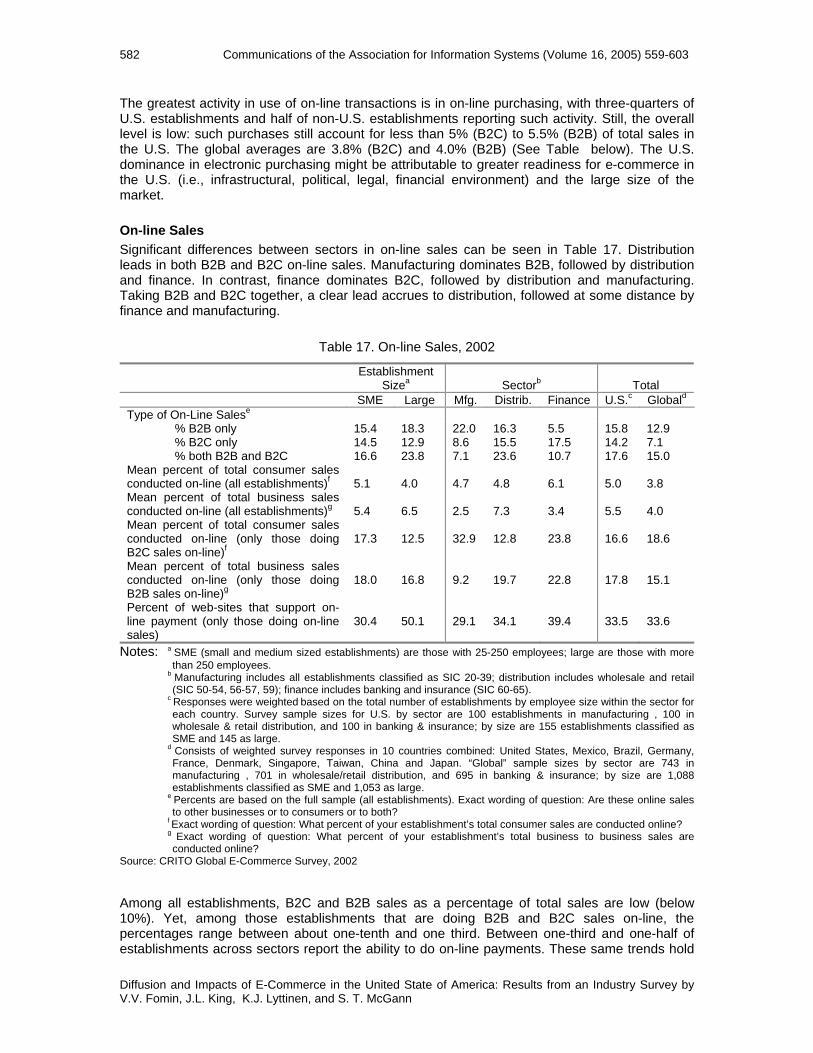
582 Communications of the Association for Information Systems (Volume 16, 2005) 559-603
Diffusion and Impacts of E-Commerce in the United State of America: Results from an Industry Survey by V.V. Fomin, J.L. King, K.J. Lyttinen, and S. T. McGann
The greatest activity in use of on-line transactions is in on-line purchasing, with three-quarters of U.S. establishments and half of non-U.S. establishments reporting such activity. Still, the overall level is low: such purchases still account for less than 5% (B2C) to 5.5% (B2B) of total sales in the U.S. The global averages are 3.8% (B2C) and 4.0% (B2B) (See Table below). The U.S. dominance in electronic purchasing might be attributable to greater readiness for e-commerce in the U.S. (i.e., infrastructural, political, legal, financial environment) and the large size of the market.
On-line Sales Significant differences between sectors in on-line sales can be seen in Table 17. Distribution leads in both B2B and B2C on-line sales. Manufacturing dominates B2B, followed by distribution and finance. In contrast, finance dominates B2C, followed by distribution and manufacturing. Taking B2B and B2C together, a clear lead accrues to distribution, followed at some distance by finance and manufacturing.
Table 17. On-line Sales, 2002
Establishment Sizea
Sectorb
Total
SME Large Mfg. Distrib. Finance U.S.c Globald Type of On-Line Salese % B2B only 15.4 18.3 22.0 16.3 5.5 15.8 12.9 % B2C only 14.5 12.9 8.6 15.5 17.5 14.2 7.1 % both B2B and B2C 16.6 23.8 7.1 23.6 10.7 17.6 15.0 Mean percent of total consumer sales conducted on-line (all establishments)f
5.1
4.0
4.7
4.8
6.1
5.0
3.8
Mean percent of total business sales conducted on-line (all establishments)g
5.4
6.5
2.5
7.3
3.4
5.5
4.0
Mean percent of total consumer sales conducted on-line (only those doing B2C sales on-line)f
17.3
12.5
32.9
12.8
23.8
16.6
18.6
Mean percent of total business sales conducted on-line (only those doing B2B sales on-line)g
18.0
16.8
9.2
19.7
22.8
17.8
15.1
Percent of web-sites that support on-line payment (only those doing on-line sales)
30.4
50.1
29.1
34.1
39.4
33.5
33.6
Notes: a SME (small and medium sized establishments) are those with 25-250 employees; large are those with more than 250 employees.
b Manufacturing includes all establishments classified as SIC 20-39; distribution includes wholesale and retail (SIC 50-54, 56-57, 59); finance includes banking and insurance (SIC 60-65).
c Responses were weighted based on the total number of establishments by employee size within the sector for each country. Survey sample sizes for U.S. by sector are 100 establishments in manufacturing , 100 in wholesale & retail distribution, and 100 in banking & insurance; by size are 155 establishments classified as SME and 145 as large.
d Consists of weighted survey responses in 10 countries combined: United States, Mexico, Brazil, Germany, France, Denmark, Singapore, Taiwan, China and Japan. “Global” sample sizes by sector are 743 in manufacturing , 701 in wholesale/retail distribution, and 695 in banking & insurance; by size are 1,088 establishments classified as SME and 1,053 as large.
e Percents are based on the full sample (all establishments). Exact wording of question: Are these online sales to other businesses or to consumers or to both?
f Exact wording of question: What percent of your establishment’s total consumer sales are conducted online? g Exact wording of question: What percent of your establishment’s total business to business sales are
conducted online? Source: CRITO Global E-Commerce Survey, 2002
Among all establishments, B2C and B2B sales as a percentage of total sales are low (below 10%). Yet, among those establishments that are doing B2B and B2C sales on-line, the percentages range between about one-tenth and one third. Between one-third and one-half of establishments across sectors report the ability to do on-line payments. These same trends hold

Communications of the Association for Information Systems (Volume 16, 2005) 559-603 583
Diffusion and Impacts of E-Commerce in the United State of America: Results from an Industry Survey by V.V. Fomin, J.L. King, K.J. Lyttinen, and S. T. McGann
in comparing U.S. and non-U.S. establishments, except for a larger difference between U.S. and non-U.S. establishments among establishments doing only B2C. Size does not appear to be a major factor in on-line sales, although some differences between large establishments and SMEs may be seen. Large establishments are more active in B2B and both B2B and B2C, and significantly more large establishments that are doing on-line sales show ability to accept payment on-line.
Table 18 shows e-commerce sales in the Americas and OECD countries in 2000. The U.S. clearly dominates in all aspects, except that Canada shows a somewhat higher percentage of e-commerce sales as a percentage of GDP than does the U.S..
Table 18. E-commerce sales in Americas, 2000
E-Commerce B2B trade in U.S.$M 2000b
B2C trade in U.S.$M 2000b
% E-Commerce Sales of GDP 2000b
Argentina $634.99 $52.58 .24 Brazil $1,720.78 $202.86 .32 Canada $12,923.30 $2,649.52 2.20 Chile $228.61 $15.86 .35 Mexico $1,753.86 $82.35 .32 United States $118,457.20 $44,084.29 1.63 Venezuela $285.44 $9.10 .24 Latin Americac $4,623.66 $362.74 .30 OECDd $268,500.30 $69,146.65 1.33
aSource: Netcraft. http://www.netcraft.com. Strong encryption is defined as having a key length greater than 40 bits (systems limited to a 40-bit key are classified as ‘weak’ since it has been shown that messages encoded using a 40-bit key with RC4 can be broken in about a week by a good computer science student using facilities available in a good computer science lab).
bSource: IDC, Internet Commerce Market Model, Version 8.1 (2002). cOnly countries included in the 44-country sample are used in the classification. Latin America consists of the following
countries: Argentina, Brazil, Chile, Mexico and Venezuela. dOnly countries included in the 44-country sample are used in the classification. OECD consists of the following countries:
Australia, Austria, Belgium, Canada, Czech Republic, Denmark, Finland, France, Germany, Greece, Hungary, Ireland, Italy, Japan, Korea, Mexico, Netherlands, New Zealand, Norway, Poland, Portugal, Spain, Sweden, Switzerland, Turkey, United Kingdom, United States
ON-LINE PROCUREMENT
Table 19 shows that two-thirds of U.S. establishments and over half of non-U.S. establishments procure on-line, accounting for between 10% and 20% of the overall volume of procurement. U.S. establishments engage in on-line procurement at a noticeably higher level than the non-U.S. establishments: about three-quarters to one-half of the U.S. establishments buy more supplies and equipment from on-line sources than do non-U.S. establishments, although U.S. establishments do less on-line procurement abroad. There is little difference between SMEs and larger establishments in engaging in on-line procurement. The differences between sectors are slight. Finance leads, possibly due to the nature of procurement in finance establishments that includes such items as office supplies and computing equipment available in on-line offers.
ON-LINE SERVICES
Engagement in on-line services is shown in Table 20 as well as in Figures 4 and 5. Data are organized by sectors to address the kind of work done in each sector. Manufacturing is heavily engaged in on-line product specification, service and order tracking (half to two-thirds of establishments), but less engaged in sharing on-line account information (less than one-third of establishments). Distribution is heavily engaged in on-line product catalogs (more than two-thirds)

584 Communications of the Association for Information Systems (Volume 16, 2005) 559-603
Diffusion and Impacts of E-Commerce in the United State of America: Results from an Industry Survey by V.V. Fomin, J.L. King, K.J. Lyttinen, and S. T. McGann
Table 19. On-Line Procurement, 2002
Establishment Sizea Sectorb Total
SME Large Mfg. Distrib. Finance U.S.c Globald
Percent of establishments doing on-line purchasing
73.5
79.8
76.6
72.8
76.5
74.3
50.8
Mean percent of money spent for direct goods for production is ordered online (all establishments)e
9.3
13.9
10.5
10.5
8.3 Mean percent money spent on goods for
resale is ordered online (all establishments)f
11.2
3.7
10.7
10.7
6.8
Mean percent of the money spent on supplies and equipment for doing business is ordered online (all establishments)g
19.2
20.1
17.0
19.1
23.0
19.3
8.3
Notes: a SME (small and medium sized establishments) are those with 25-250 employees; large are those with more than 250 employees.
b Manufacturing includes all establishments classified as SIC 20-39; distribution includes wholesale and retail (SIC 50-54, 56-57, 59); finance includes banking and insurance (SIC 60-65).
c Responses were weighted based on the total number of establishments by employee size within the sector for each country. Survey sample sizes for U.S. by sector are 100 establishments in manufacturing , 100 in wholesale & retail distribution, and 100 in banking & insurance; by size are 155 establishments classified as SME and 145 as large.
d Consists of weighted survey responses in 10 countries combined: United States, Mexico, Brazil, Germany, France, Denmark, Singapore, Taiwan, China and Japan. “Global” sample sizes by sector are 743 in manufacturing , 701 in wholesale/retail distribution, and 695 in banking & insurance; by size are 1,088 establishments classified as SME and 1,053 as large.
e Question asked only to those in the manufacturing sector; percent based on all manufacturing establishments. Exact wording of question: What percent of the money your establishment spends on direct goods for production, such as parts and components, is ordered online?
f Question asked only to those in the wholesale/retail distribution sector; percent based on all wholesale/retail establishments. Exact wording of question: What percent of the money your establishment spends on goods for resale is ordered online?
g Percent based on all establishments. Exact wording of question: What percent of the money your establishment spends on supplies and equipment for doing business is ordered online?
Source: CRITO Global E-Commerce Survey, 2002
Source: CRITO Global E-Commerce Survey, 2002
Figure 4. On Line Service 2002
35.7
11.5
36.2
4.4
20.616.8
21.7
33.8
7.510.6
10.5
36 35.8
12.6
30
05
101520253035404550
% B2B only % B2C only % both B2B and B2C
Type of On-Line Service: Mean percent of totalconsumer servicesconducted on-line
Mean percent of totalbusiness servicesconducted on-line
Mfg. Distrib. Finance U.S. Global

Communications of the Association for Information Systems (Volume 16, 2005) 559-603 585
Diffusion and Impacts of E-Commerce in the United State of America: Results from an Industry Survey by V.V. Fomin, J.L. King, K.J. Lyttinen, and S. T. McGann
Table 20. On-Line Services
Establishment Sizea
Sectorb
Total
SME Large Mfg. Distrib. Finance U.S.c Globald Type of On-Line Servicee % B2B only 18.8 29.7 35.7 16.8 10.5 20.4 23.1 % B2C only 22.6 15.3 11.5 21.7 36.0 21.5 12.9 % both B2B and B2C 33.0 44.6 36.2 33.8 35.8 34.7 33.3 Mean percent of total consumer services conducted on-linef
7.7
4.7
4.4
7.5
12.6
7.2
7.6
Mean percent of total business services conducted on-lineg
13.8
12.5
20.6
10.6
30.0
13.6
11.0
% of manufacturing web sites which support …h
Product configuration 54.1 69.2 57.8 57.8 54.7 Order tracking 38.2 73.8 48.0 48.0 21.5 Service and technical support 56.5 80.6 63.1 63.1 54.4 Product specification 72.9 91.3 77.7 77.7 79.9 Account information 24.0 36.9 27.5 27.5 17.0 % of wholesale/retail distribution web sites which support…h
Gift certificates and/or registry 20.3 50.9 25.2 25.2 20.6 Product catalogue 81.2 93.4 83.4 83.4 69.8 Product reviews 50.6 67.5 53.4 53.4 48.6 Ind. customization 49.4 66.9 52.4 52.4 21.3 Account information 55.3 50.9 54.5 54.5 21.7 % of banking and insurance web sites supporting …h
On-line services such as filing applications, filing claims, paying bills, transferring funds
52.3
83.3
58.6
58.6
53.9
Access to account information 66.2 100.0 72.8 72.8 57.3 On-line tools such as research tools, planning tools, etc.
68.2
86.4
71.8
71.8
52.0
Notes: a SME (small and medium sized establishments) are those with 25-250 employees; large are those with more than 250 employees. b Manufacturing includes all establishments classified as SIC 20-39; distribution includes wholesale and retail
(SIC 50-54, 56-57, 59); finance includes banking and insurance (SIC 60-65). c Responses were weighted based on the total number of establishments by employee size within the sector for
each country. Survey sample sizes for U.S. by sector are 100 establishments in manufacturing, 100 in wholesale & retail distribution, and 100 in banking & insurance; by size are 155 establishments classified as SME and 145 as large.
d Consists of weighted survey responses in 10 countries combined: United States, Mexico, Brazil, Germany, France, Denmark, Singapore, Taiwan, China and Japan. “Global” sample sizes by sector are 743 in manufacturing, 701 in wholesale/retail distribution, and 695 in banking & insurance; by size are 1,088 establishments classified as SME and 1,053 as large.
e Percents are based on the full sample (all establishments). Exact wording of question: Are these online services to other businesses or to consumers or to both?
f Percents are based on the full sample (all establishments). Exact wording of question: What percent of your establishment’s total services to consumers are conducted online?
g Percents are based on the full sample (all establishments). Exact wording of question: What percent of your establishment’s total services to businesses are conducted online?
h Percents are based on only those establishments which have a web-site and conduct business within the specified sector.
Source: CRITO Global E-Commerce Survey, 2002

Communications of the Association for Information Systems (Volume 16, 2005) 559-603 586
Diffusion and Impacts of E-Commerce in the United State of America: Results from an Industry Survey by V.V. Fomin, J.L. King, K.J. Lyttinen, and S. T. McGann
12.9
33.3
7.6 11
54.7
21.5
54.4
79.9
17 20.6
69.8
48.6
21.3 21.7
53.9 57.352
23.1
0
10
20
30
40
50
60
70
80
90
100
% B
2B o
nly
% B
2C o
nly
% b
oth
B2B
and
B2C
cons
umer
ser
vice
s co
nduc
ted
on-li
ne
busi
ness
ser
vice
s co
nduc
ted
on-li
ne
prod
uct c
onfig
urat
ion
orde
r tra
ckin
g
serv
ice
and
tech
nica
l sup
port
prod
uct s
peci
ficat
ion
acco
unt i
nfor
mat
ion
gift
cer
tific
ates
and
/or r
egis
try
prod
uct c
atal
ogue
prod
uct r
evie
ws
ind.
cus
tom
izat
ion
acco
unt i
nfor
mat
ion
filin
g ap
plic
atio
ns, f
iling
cla
ims,
pay
ing
bills
,tra
nsfe
rrin
g fu
nds
acce
ss to
acc
ount
info
rmat
ion
rese
arch
tool
s, p
lann
ing
tool
s, e
tc.
Type of On-Line Service: Mean percent oftotalÉ
% of manufacturing web sites which support % of wholesale/retail distribution web siteswhich support
% of banking and insuranceweb sites supporting
U.S. Global SME Large
Source: CRITO Global E-Commerce Survey, 2002
Figure 5. On-Line Services, 2000
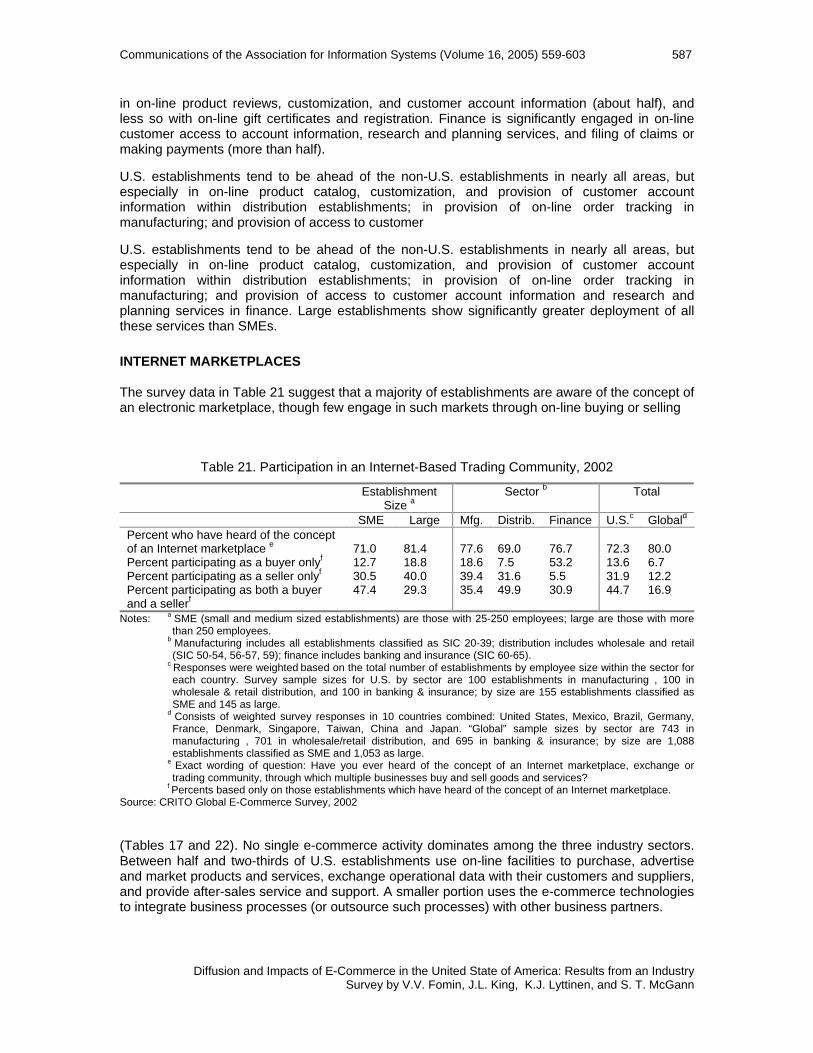
Communications of the Association for Information Systems (Volume 16, 2005) 559-603 587
Diffusion and Impacts of E-Commerce in the United State of America: Results from an Industry Survey by V.V. Fomin, J.L. King, K.J. Lyttinen, and S. T. McGann
in on-line product reviews, customization, and customer account information (about half), and less so with on-line gift certificates and registration. Finance is significantly engaged in on-line customer access to account information, research and planning services, and filing of claims or making payments (more than half).
U.S. establishments tend to be ahead of the non-U.S. establishments in nearly all areas, but especially in on-line product catalog, customization, and provision of customer account information within distribution establishments; in provision of on-line order tracking in manufacturing; and provision of access to customer
U.S. establishments tend to be ahead of the non-U.S. establishments in nearly all areas, but especially in on-line product catalog, customization, and provision of customer account information within distribution establishments; in provision of on-line order tracking in manufacturing; and provision of access to customer account information and research and planning services in finance. Large establishments show significantly greater deployment of all these services than SMEs.
INTERNET MARKETPLACES
The survey data in Table 21 suggest that a majority of establishments are aware of the concept of an electronic marketplace, though few engage in such markets through on-line buying or selling
(Tables 17 and 22). No single e-commerce activity dominates among the three industry sectors. Between half and two-thirds of U.S. establishments use on-line facilities to purchase, advertise and market products and services, exchange operational data with their customers and suppliers, and provide after-sales service and support. A smaller portion uses the e-commerce technologies to integrate business processes (or outsource such processes) with other business partners.
Table 21. Participation in an Internet-Based Trading Community, 2002
Establishment Size a
Sector b Total
SME Large Mfg. Distrib. Finance U.S.c Globald Percent who have heard of the concept of an Internet marketplace e
71.0
81.4
77.6
69.0
76.7
72.3
80.0
Percent participating as a buyer onlyf 12.7 18.8 18.6 7.5 53.2 13.6 6.7 Percent participating as a seller onlyf 30.5 40.0 39.4 31.6 5.5 31.9 12.2 Percent participating as both a buyer and a sellerf
47.4 29.3 35.4 49.9 30.9 44.7 16.9
Notes: a SME (small and medium sized establishments) are those with 25-250 employees; large are those with more than 250 employees.
b Manufacturing includes all establishments classified as SIC 20-39; distribution includes wholesale and retail (SIC 50-54, 56-57, 59); finance includes banking and insurance (SIC 60-65).
c Responses were weighted based on the total number of establishments by employee size within the sector for each country. Survey sample sizes for U.S. by sector are 100 establishments in manufacturing , 100 in wholesale & retail distribution, and 100 in banking & insurance; by size are 155 establishments classified as SME and 145 as large.
d Consists of weighted survey responses in 10 countries combined: United States, Mexico, Brazil, Germany, France, Denmark, Singapore, Taiwan, China and Japan. “Global” sample sizes by sector are 743 in manufacturing , 701 in wholesale/retail distribution, and 695 in banking & insurance; by size are 1,088 establishments classified as SME and 1,053 as large.
e Exact wording of question: Have you ever heard of the concept of an Internet marketplace, exchange or trading community, through which multiple businesses buy and sell goods and services?
f Percents based only on those establishments which have heard of the concept of an Internet marketplace. Source: CRITO Global E-Commerce Survey, 2002

588 Communications of the Association for Information Systems (Volume 16, 2005) 559-603
Diffusion and Impacts of E-Commerce in the United State of America: Results from an Industry Survey by V.V. Fomin, J.L. King, K.J. Lyttinen, and S. T. McGann
Table 22. Uses of Internet, 2002
Establishment Sizea
Sectorb Total
Percent using the Internet for: SME Large Mfg. Distrib. Finance U.S.c Globald Advertising and marketing purposes 62.3 77.7 71.3 56.6 81.4 64.3 57.6 Making sales online 41.5 54.7 27.9 52.4 31.5 43.2 29.9 After sales customer service and support 54.0 66.1 57.9 54.6 55.9 55.6 43.7 Making purchases online 72.2 79.6 76.6 70.9 76.5 73.2 46.8 Exchanging operational data with suppliers
41.1 54.8 46.0 42.2 40.9 42.8 48.1
Exchanging operational data with business customers
52.2
64.6
64.6
46.7
64.4
53.8
50.7
Formally integrating the same business processes with suppliers or other business partners
34.7
41.2
38.5
34.2
36.3
35.5
33.9
Notes: a SME (small and medium sized establishments) are those with 25-250 employees; large are those with more than 250 employees.
b Manufacturing includes all establishments classified as SIC 20-39; distribution includes wholesale and retail (SIC 50-54, 56-57, 59); finance includes banking and insurance (SIC 60-65).
c Responses were weighted based on the total number of establishments by employee size within the sector for each country. Survey sample sizes for U.S. by sector are 100 establishments in manufacturing , 100 in wholesale & retail distribution, and 100 in banking & insurance; by size are 155 establishments classified as SME and 145 as large.
d Consists of weighted survey responses in 10 countries combined: United States, Mexico, Brazil, Germany, France, Denmark, Singapore, Taiwan, China and Japan. “Global” sample sizes by sector are 743 in manufacturing , 701 in wholesale/retail distribution, and 695 in banking & insurance; by size are 1,088 establishments classified as SME and 1,053 as large.
e Exact wording of question: Does your establishment use the Internet for … Source: CRITO Global E-Commerce Survey, 2002
About two-thirds of distribution establishments make sales on-line, but fewer than half of manufacturing and finance establishments do so. The differences between U.S. and the non-U.S. establishments are small. U.S. establishments make more on-line purchases and have somewhat higher levels of on-line customer support and sales. The larger establishment’s use of the e-commerce technologies more aggressively for these purposes than do smaller establishments, though the differences are not great.
A STRUCTURAL ANALYSIS OF E-COMMERCE ADOPTION IN THE U.S.
A structural equation model of adoption (Figure 6) was performed on U.S. establishment data from the survey to detect and validate statistically significant relationships between the drivers and barriers for Internet use and the adoption of e-commerce technologies. Details of the statistical analysis and model construction are outlined in Appendix I. The analysis consisted of trials in the AMOS analytical package for separate data sets taken from the U.S. survey.
Table 23 illustrates significant regression relationships that were detected with their level of statistical significance. Results show that e-commerce adoption is path dependent (i.e., establishments follow earlier investment patterns), and that each industry’s market and institutional context play a significant role in adoption. The main findings can be summarized as follows:
1. Prior use of EC technologies (extranet, EFT, call centers) has a positive impact on B2B adoption (Internet-based data exchange w/business customers and suppliers) and B2C adoption (consumer sales and service online). Prior use of EC technologies is also positively correlated with the adoption of B2C and B2B adoption in distribution, and of B2B in large businesses

Communications of the Association for Information Systems (Volume 16, 2005) 559-603 589
Diffusion and Impacts of E-Commerce in the United State of America: Results from an Industry Survey by V.V. Fomin, J.L. King, K.J. Lyttinen, and S. T. McGann
Figure 6. E-Commerce Adoption Model
Table 23. Adoption Model and its Significant Regression Relationships
Data Set Relationship Significance ALL Use of EC Technologies/B2C Adoption*
Market Expansion/B2C Adoption* Use of EC Technologies/B2B Adoption* External Environment/B2B Adoption**
.556 -.072
.428 -.099
MFG External Environment/B2B Adoption** .138 DIST Use of EC Technologies /B2C Adoption** .755 FIN No significant relationships SME Market Expansion/B2C Adoption** -.06 Large Use of EC Technologies /B2C Adoption*
Use of EC Technologies /B2B Adoption* Market Expansion /B2B Adoption** External Environment /B2B Adoption**
.894
.869
.204 -.20
Source: Calculated * = significant at 5% level ** = significant at 1% level
2. Market Expansion (use of the Internet to expand and enter new markets) has a negative
impact on B2C adoption for SMEs, and a positive impact on B2B adoption in large businesses.
3. External Environment (suppliers and customers demand for Internet use) has a negative impact on B2B adoption in manufacturing and in large businesses.
Two broader findings are suggested by the analysis.
1. Prior use of e-commerce technologies is associated with both data exchange between business customers and suppliers (B2B Adoption) and the level of consumer sales and service online (B2C Adoption). This finding is particularly true in distribution, which has achieved a high level of e-commerce readiness and is focused on direct interactions with customers. The result is in alignment with the Chwelos et al. [2001] hypothesis that increased IT sophistication (readiness) translates into a higher level of adoption. SMEs show a stronger tendency toward this in the case of B2C adoption, and larger businesses in the case of B2B adoption. SMEs are focused on
FIN
DIST
Lg
SME
MFG
All
B2B Adoption (EDI)
B2C Adoption (SSU)
Drivers for Internet Use
(ME, GD, EE)
Barriers for Internet Use
(OI, RI)
Use of EC Technologies
(ECT)

590 Communications of the Association for Information Systems (Volume 16, 2005) 559-603
Diffusion and Impacts of E-Commerce in the United State of America: Results from an Industry Survey by V.V. Fomin, J.L. King, K.J. Lyttinen, and S. T. McGann
implementing simple B2C e-commerce solutions to establish Web presence, while larger businesses expand e-commerce activity toward complex B2B processes in pursuit of large players like Wal-Mart.
2. SMEs attempting to use the Internet to expand B2C business show a negative level of adoption, while large businesses attempting to expand B2B business show a positive level of adoption. SMEs might not be as quick to adopt new technology, while large businesses often can access superior financial and technical resources. On the other hand, the analyses also show lower adoption rates for large businesses because they face high external pressure. This is in contrast to Iacovou et al.’s [1995] finding that high external pressure leads to greater adoption. Perhaps pressures in large business environments such as the automotive industry are not in the direction of innovation, but, to the contrary, are toward staying with more traditional technologies such as EDI for conducting B2B transactions. A study by Daniel and Grimshaw [2002] found that larger establishments are less likely to adopt e-commerce technologies when existing customers and suppliers fail to see the payoffs and wish to maintain their current technologies.
SUMMARY: DIFFUSION OF E-COMMERCE
E-commerce is growing steadily when it is narrowly defined as on-line sales. It needs to go far before it overtakes traditional forms of commerce. However, if it is defined to include all the complementary components of commerce such as customer access to on-line catalogs instead of printed catalogs prior to use of the telephone or the Internet to place an order, much faster diffusion of e-commerce is apparent. The survey data show that establishments in all sectors, of all sizes and origins are using e-mail, web sites, EDI and other IT-enabled communications and information processing to advance their business. Although such uses are changing the way establishments do business, the processes take time. The development of production engineering that led to modern manufacturing principles took nearly 100 years, from the development of interchangeable parts and bench measurement standards at the Springfield Armory in the early 19th century, to Henry Ford’s creation of the integrated automobile assembly process in the early 20th century.
Many similarities in e-commerce adoption were found across sectors, between U.S. and non-U.S. establishments, and between large establishments and SMEs. Differences across sectors appear to be related mainly to the different nature of the tasks that are typical in those sectors. The only notable difference found between the U.S. and the non-U.S. establishments, is that U.S. firms make more purchases and sales on-line. This difference could be due to the ease of such transactions in the U.S. economy with its single currency11, good logistics systems, and uniform commercial practices. Large establishments tend to be ahead in the diffusion of e-commerce, but this lead is less pronounced than might be expected. Early and extensive adoption of e-commerce technologies is the best predictor for future adoption across all sectors.
VII. IMPACTS OF THE INTERNET AND E-COMMERCE
The relatively low level of penetration of e-commerce into overall commerce suggests that the impacts so far are negligible. However, as just noted above, a broader notion of e-commerce 11 In Europe the single currency Euro was introduced in January 1, 2002 by Belgium, Germany, Greece, Spain, France, Ireland, Italy, Luxembourg, the Netherlands, Austria, Portugal and Finland in hope that a common currency would produce in the "Euro Zone" many of the benefits seen in the "Dollar Zone." At the time of data collection, the Euro had not been in place long enough to register any effect on survey results, and the effects of the Euro overall (e.g., on trade) are materializing slowly [Helge et al., 2005]. In part, result it is due to European payment systems that would work across the Europe just do not exist. The Euro takes away only the currency risk and exchange fees.

Communications of the Association for Information Systems (Volume 16, 2005) 559-603 591
Diffusion and Impacts of E-Commerce in the United State of America: Results from an Industry Survey by V.V. Fomin, J.L. King, K.J. Lyttinen, and S. T. McGann
would probably reveal a broader set of impacts. The impacts of e-commerce on establishment and industry performance in the 1990’s were significant [Brynjolfsson et al., 2003]. Van Ark [2001] suggests that industries producing or using IT equipment intensively contributed between 1/2-1 percentage points to the economic growth (Table ). It is difficult to narrow such impacts to just one subset of IT-related activities such as the Internet and e- commerce but the survey data suggest that after a time lag of perhaps five to seven years, e-commerce will show major impacts on commerce as a whole, similar to the effect the 1990s boom in IT has had on the productivity growth in the 2000s [Mullaney and Coy, 2003].
The survey data suggest that establishments can benefit from e-commerce (Table 24). A significant number of establishments report positive impacts from doing business on-line, especially in areas such as internal efficiency and productivity, customer service, process efficiency, and sales performance. Many also report improved customer service, widening of sales area, improved competitive position, improved internal processes, greater coordination with suppliers, staff productivity improvements, increased sales, decreased procurement costs, international sales increases, and reduced inventory costs. These reports come from both U.S. and non-U.S. establishments, and in both large companies and SMEs.
Table 24. Contribution of Capital Deepening in IT-Related Industries to GDP Growth, 1990-98.
Contribution of IT-Related Industries Real GDP Growth Total IT-Using IT-Producing (percent per year) Canada 2.1 0.8 0.6 0.2 Denmark 1.8 0.5 0.3 0.2 Finland 1.6 0.7 0.0 0.7 France 1.3 0.5 0.2 0.3 Germany 1.1 0.5 0.4 0.1 Japan 1.4 0.8 0.5 0.3 United States 3.2 1.4 0.9 0.5
Notes: For Germany, the numbers refer to 1991-97. Source: [Haacker and Morsink, 2002], referring to [van Ark, 2001]. Some differences in experience were found across the sectors, all of which seem related to sector-specific characteristics. Distribution shows less internal process improvement than manufacturing and finance, possibly due to the consistency of activities within distribution irrespective of whether sales are made on-line. Finance shows greater improvement in staff productivity and inventory cost reduction than manufacturing and distribution, and lower effects on sales. Financial services are not engaged in sales in the same way manufacturing and distribution are, and new financial sales channels compete directly with their traditional channels.
Beyond these basic observations, e-commerce may have broader sectoral and regional impact as time goes on. The gains from technological progress, either measured by increases in domestic demand or in the consumer surplus, are mainly linked to spending on IT-related goods [International Monetary Fund, 2001, p.121]. This analysis does not take into account key differences between IT-producing and IT-consuming sectors and regions. Given the steep improvement in the price/performance ratio of IT products, and the intense competition in IT production, benefits are more likely to accrue differentially to the consumers than the producers. If so, IT using sectors and regions are likely to benefit relative to IT-producing sectors and regions due to deteriorating terms of trade for producers [International Monetary Fund, 2001, p.116]. For most G-7 economies, the contribution to GDP growth of IT-using sectors is much stronger than the contribution of the IT-producing sector [Haacker and Morsink, 2002, p.6]. Countries that are heavy consumers are likely to benefit more than those that are only producers, although countries that do both are probably in a good position. Within the U.S. as a whole, the effects might be difficult to determine (Figure 7). Only a few U.S. states are substantial producers and consumers.

592 Communications of the Association for Information Systems (Volume 16, 2005) 559-603
Diffusion and Impacts of E-Commerce in the United State of America: Results from an Industry Survey by V.V. Fomin, J.L. King, K.J. Lyttinen, and S. T. McGann
Figure 7. IT Production and Use in the United State 1881-1995
A few are major consumers, but the majority are either primarily producers or are neither producers nor consumers. Therefore, differential impacts may result from engaging in e-commerce across the U.S. states as a function of the relative production/consumption characteristics.
E-commerce impact (Table 25) could be substantial on competition and industrial organization. E-commerce is still only a small proportion of all commerce, and the most interesting effects of e-commerce are probably embedded in conventional commerce. It is therefore hard to determine whether major competitive or industry structure impacts are possible, ceteris paribus, due to e-commerce. Distribution establishments are active in on-line procurement and sales, and used EDI and other electronic or electronics-assisted (e.g., phone/fax) technologies for decades. It is not clear whether moving from one type of computerized order-entry system based on the telephone to a computerized order-entry system based on the Internet will really change things. Aggressive and disruptive experiments in new types of e-commerce that seek to create entirely new models for manufacturing, distribution, or finance are underway in all three sectors [Zhu et al., 2004]. In manufacturing, Dell Computer integrated its entire business from sourcing to end customer distribution through use of e-commerce technologies [Kraemer and Dedrick, 2001, Kraemer and Dedrick, 2002a]. Dell’s use of e-commerce technologies might signal an altogether new era in manufacturing. Dell was one of only two personal computer makers that turned a profit in 2002 and continued growth to become the world's largest maker of personal computers, overcoming HP and IBM [Jones, 2005]. Its success is clearly due to its e-commerce strategy that offers tremendous efficiencies and economies of scale and scope. Dell remains an isolated example

Communications of the Association for Information Systems (Volume 16, 2005) 559-603 593
Diffusion and Impacts of E-Commerce in the United State of America: Results from an Industry Survey by V.V. Fomin, J.L. King, K.J. Lyttinen, and S. T. McGann
among manufacturing establishments in the electronics industry, and should not be seen as an exemplar. Alternative strategies can also produce success. The other profitable personal computer company in 2002 was Apple, which embarked on an ambitious strategy of innovative product design and opened a number of flashy, physical retail outlets. Although Apple runs an on-line store, it sells the vast majority of its products through its traditional distribution channels. The survey data suggest that few companies seek or dare to overhaul their current business model using e-commerce technologies. If manufacturing is being transformed by e-commerce technologies, the transformation is seen in subtle and complicated changes in strategy, and not primarily in simple stories of cost reduction and disintermediation. Profound changes in production regimes normally accrue through accretionary processes of capacity building that take place over decades [Kraemer and Dedrick, 2002a, 2002b].
Distribution is actively engaged in both on-line buying and selling, as well as in both B2B and B2C e-commerce. Predictions of e-commerce in the mid-1990s forecast major disintermediation between manufacturers and consumers. However, distributors such as Amazon proved a number of important roles played can be played by intermediaries. Similarly, sites such as eBay and the “consolidator and comparator” web sites that provide comparison pricing and information on
Table 25. Impacts of Doing Business On-Line, 2002
Establishment Sizea Sectorb Total Percent indicating high impact e SME Large Mfg. Distrib. Finance U.S.c Globa
ld Internal processes more efficient 26.5 37.9 34.8 22.9 36.5 28.0 33.9 Staff productivity increased 30.7 32.1 29.0 29.4 38.6 30.8 27.2 Sales increased 22.5 34.3 25.6 25.8 15.6 24.1 20.5 Sales area widened 35.4 39.2 39.1 34.9 34.8 35.9 31.4 Customer service improved 39.0 48.2 40.4 39.9 41.1 40.2 34.8 International sales increased 8.8 9.9 14.4 7.0 7.8 9.0 19.5 Procurement costs decreased 12.2 14.3 18.3 8.7 17.8 12.5 17.7 Inventory costs decreased 10.3 14.2 6.4 10.6 18.4 10.8 14.0 Coordination with suppliers improved 28.4 34.7 32.9 26.6 33.4 29.2 29.8 Competitive position improved 31.7 43.5 36.9 32.3 31.7 33.3 29.8 % indicating f Number of distribution channels increased
45.9 41.6 48.7 44.4 44.1 45.4 40.2
Number of suppliers increased 34.1 35.3 48.3 28.7 34.2 34.2 29.9 Number of competitors increased 27.8 33.9 30.1 28.2 28.2 28.6 27.9 Intensity of competition increased 36.6 44.8 51.5 32.2 37.7 37.7 41.5
Notes: a SME (small and medium sized establishments) are those with 25-250 employees; large are those with more than 250 employees.
b Manufacturing includes all establishments classified as SIC 20-39; distribution includes wholesale and retail (SIC 50-54, 56-57, 59); finance includes banking and insurance (SIC 60-65).
c Responses were weighted based on the total number of establishments by employee size within the sector for each country. Survey sample sizes for U.S. by sector are 100 establishments in manufacturing , 100 in wholesale & retail distribution, and 100 in banking & insurance; by size are 155 establishments classified as SME and 145 as large.
d Consists of weighted survey responses in 10 countries combined: United States, Mexico, Brazil, Germany, France, Denmark, Singapore, Taiwan, China and Japan. “Global” sample sizes by sector are 743 in manufacturing , 701 in wholesale/retail distribution, and 695 in banking & insurance; by size are 1,088 establishments classified as SME and 1,053 as large.
e Exact wording of question: Using a 5-point scale where 5 is “a great deal” and 1 is “not at all”, please rate the degree to which your establishment has experienced the following impacts since it began using the Internet for business. A score of 4 or 5 was classified as “high impact”.
f Exact wording of question: Using a 5-point scale where 5 is “a great deal” and 1 is “not at all”, please rate the degree to which your establishment has experienced the following impacts since it began using the Internet for business. A score of 4 or 5 was classified as “high impact”.
Source: CRITO Global E-Commerce Survey, 2002
594 Communications of the Association for Information Systems (Volume 16, 2005) 559-603
Diffusion and Impacts of E-Commerce in the United State of America: Results from an Industry Survey by V.V. Fomin, J.L. King, K.J. Lyttinen, and S. T. McGann
distributor reliability (e.g., buy.com) were successful. E-commerce in distribution seems to be evolving along five directions:
1. traditional commercial distribution; 2. manufacturing-based distribution such as Dell Computer; 3. the e-only distribution model of Amazon; 4. the consolidator and comparator such as buy.com that offers customers meta-data on
shopping options; and 5. the end-consumer auction house such as eBay.
Finance is the progenitor of modern e-commerce. The Federal Reserve’s FedWire system, which carries value in excess of $500 trillion per year, began over telegraph lines in 1925. Consumer electronic funds transfer began in certain European inter-bank networks and in the deployment of Automatic Teller Machines (ATMs) before 1980. Data from the survey show finance establishments feel pressures from customers and competitors to provide e-commerce services. This pressure is to expected from a sector that did e-commerce for decades. Finance learned that customer convenience is a paramount competitive virtue. The survey shows finance to be focused on transforming existing channels, but important changes appear to be taking place in the nature of financial services. The problem is, and will probably remain for some time, that the nature and extent of the changes are going to be extremely difficult to measure.
E-COMMERCE IMPACT ANALYSIS
A structural equation model of e-commerce (shown in Figure 6 in Section VI) tested the effect of B2B and B2C adoption levels, use of EC technologies and Ecommerce-related IS spending on sales improvement and overall efficiency. This analysis was done using the AMOS package on the same data sets described above in the section adoption on e-commerce adoption.
Table 23 shows significant regression relationships. Despite relatively large sample sizes, the significant relationships are few and modest. This might be due to the early stage of adoption of e-commerce solutions and the brief time e-commerce has been in use. The analysis suggests that information systems spending on web projects is correlated with sales improvements (increased sales, customer service, competitive position) when doing business online. The results also show that B2B e-commerce adoption is negatively correlated with overall efficiency (efficient processes, productivity increase, decrease in procurement costs, improved coordination with suppliers since doing business online). This finding appears at the aggregate data level, but not at the industry, or business size level. It is consistent with findings in e-commerce studies that e-commerce has a positive impact on the establishments earning potential [Clark and Lee, 2000, Iacovou et al., 1995, Mirchandani and Motwani, 2001, Ratnasingam, 2000]. It could be that, as businesses attempt to migrate to B2B technologies, coordination with suppliers and procurement processes suffer at first due to less stable e-commerce technologies, implementation problems, and resistance within the organization and interorganizationally.
VIII. CONCLUSION
The paper set out to address three broad questions:
1. Do e-commerce experiences in terms of readiness, deployment, adoption and impact of e-commerce technologies of the U.S. establishments differ from those in other studied countries?
2. Do e-commerce experiences in the manufacturing, finance, and distribution differ from one another?
3. Do e-commerce experiences differ significantly between small and medium sized establishments versus large establishments?
Communications of the Association for Information Systems (Volume 16, 2005) 559-603 595
Diffusion and Impacts of E-Commerce in the United State of America: Results from an Industry Survey by V.V. Fomin, J.L. King, K.J. Lyttinen, and S. T. McGann
This section reviews the findings in relation to those questions, and discusses open issues awaiting further study.
Earlier work demonstrates that the U.S. is a leader in e-commerce, particularly in the Americas [Fomin et al., 2003]. Other developed countries in Europe and Asia are also aggressively developing e-commerce capability. The size and strength of the U.S. economy, the U.S. lead in technologies related to e-commerce, and the liberal economic policies of the U.S. government are all presumed to be important factors in making the U.S. an e-commerce leader.
The paper uses a survey of e-commerce by CRITO [Kraemer et al., 2003] to compare U.S. and non-U.S. establishments. Only modest differences were between U.S. and non-U.S. establishments, the most notable being that U.S. establishments appear to be more in touch with the drivers for e-commerce, and less concerned about barriers to e-commerce. That is, U.S. establishments are somewhat more positive about e-commerce.
In most cases, however, little distinguishes U.S. and non-U.S. establishments from one another in the survey data. This finding could be related to sampling bias: the only establishments participating are those already engaged in e-commerce. Thus, the data provide little information about the population characteristics of establishments in countries taken as a whole. Similarity in experience with e-commerce across national borders could be due to the global nature of discourse about e-commerce in the business trade press and among consultancies that help establishments develop e-commerce strategies. In addition, the technologies and techniques for doing e-commerce are themselves increasingly global, provided by multinational establishments that can spread their expertise quickly across their global reach. In general, we conclude that the survey finds few significant differences between U.S. and non-U.S. establishments with respect to readiness, deployment, adoption, and impact of e-commerce technologies. A survey employing a representative sample of establishments in each country, irrespective of whether the establishment is using e-commerce currently, might produce different results.
Some differences in e-commerce orientation and experience were found across the three industry sectors studied in the survey. Initial analysis suggests that these differences are related largely to the nature of the tasks done in the respective industries, and to prior industry-level investment and learning related to e-commerce. One good example of this is the manufacturing sector’s experience with EDI, which seems to presage e-commerce capability more broadly. Another example is the distribution sector, which lags somewhat behind manufacturing only on B2B e-commerce, and somewhat behind finance only on B2C e-commerce, but leads manufacturing and finance with respect to establishments doing both B2B and B2C. This finding makes sense for a sector that buys from manufacturers and sells to end consumers.
Taking all sectors together, the primary drivers for e-commerce are expansion of markets for existing products and services, improved coordination with customers and suppliers, penetration into new businesses or markets, cost reductions, and meeting customer demand and increased competition. These drivers were reported by between one-third and two thirds of the studied establishments. Less common drivers are demands by suppliers, and government requirements or incentives. These drivers do not significantly differ from those reported by establishments in other countries, and they are quite uniform across all sectors. The primary barriers to e-commerce are privacy and security, the need for face-to-face business communication, and the high costs of implementing e-commerce. In general, we conclude there are some differences between establishments in different sectors surveyed, but there are no striking differences that warrant extensive discussion. It is likely that deep, sector-specific studies will be required to determine the mechanisms of change due to e-commerce over the coming years. These sectoral studies can then be compared with one another to discover whether and in what ways systematic differences across sectors occur.
There are differences in e-commerce attitudes and experience between small/medium sized enterprises (SMEs) and large establishments. None of the findings are surprising. Large establishments have greater resources than SMEs, and devote those resources to e-commerce.

596 Communications of the Association for Information Systems (Volume 16, 2005) 559-603
Diffusion and Impacts of E-Commerce in the United State of America: Results from an Industry Survey by V.V. Fomin, J.L. King, K.J. Lyttinen, and S. T. McGann
They also have needs that SMEs do not have as a function of the scale and scope of their activities, and these help drive investments in e-commerce that show up in the findings. Again, the survey responses are only from establishments that are using e-commerce, so the establishments with little or no experience with e-commerce cannot be examined in this study. Given that the overwhelming majority of establishments in the U.S. are SMEs, and that SMEs as a whole have a much lower rate of investment in e-commerce than do large establishments [Fomin et al., 2003], it is likely that a significantly different picture of attitudes toward e-commerce would emerge if non-using SMEs were surveyed.
The survey results show that e-commerce is well established among a significant number of U.S. establishments, that U.S. establishments tend to be motivated by the drivers for e-commerce and are not particularly worried about the barriers, and that there are no obvious impediments to e-commerce adoption across sectors or between SMEs and large establishments. Given that the U.S. is a leader in e-commerce and that U.S. key indicators of readiness for e-commerce are all strong, it is reasonable to predict that growth of e-commerce in the U.S. will be robust over the coming ears. It is less clear whether the U.S. will retain its e-commerce lead over some advanced, smaller countries that innovate actively and are supported by assertive governmental policies promoting use of e-commerce.
ACKNOWLEDGEMENT
This research is a part of the Globalization and E-Commerce project of the Center for Research on Information Technology and Organizations (CRITO) at the University of California, Irvine. This material is based upon work supported by the National Science Foundation under Grant No. 0085852. Any opinions, findings, and conclusions or recommendations expressed in this material are those of the authors and do not necessarily reflect the views of the National Science Foundation.
Editor’s Note: this article was received on March 14, 2005 and published on October 6, 2005
REFERENCES
EDITOR’S NOTE: The following reference list contains the address of World Wide Web pages. Readers who have the ability to access the Web directly from their computer or are reading the paper on the Web, can gain direct access to these references. Readers are warned, however, that
1. these links existed as of the date of publication but are not guaranteed to be working thereafter. 2. the contents of Web pages may change over time. Where version information is provided in the References, different versions may not contain the information or the conclusions referenced. 3. the authors of the Web pages, not CAIS, are responsible for the accuracy of their content. 4. the authors of this article, not CAIS, is responsible for the accuracy of the URL and version information
Bayoumi, T. and M. Haacker. (2002) Its Not What You Make, Its How You Use IT: Measuring the
Welfare Benefits of the IT Revolution Across Countries. Centre for Economic Performance, LSE WP/02/117.
Brynjolfsson, E., D. Jorgenson, and A. Wyckoff. (2003) “Transforming the Economy.” First International Conference on the Economic and Social Implications of Information Technology, Washington, DC, 2003.
BusinessWeek Online (2003a) "Here Comes the Real Fun for Telecom," Jane Black, http://www.businessweek.com/technology/content/feb2003/ tc2003024_7152_tc103.htm (August 20, 2003).

Communications of the Association for Information Systems (Volume 16, 2005) 559-603 597
Diffusion and Impacts of E-Commerce in the United State of America: Results from an Industry Survey by V.V. Fomin, J.L. King, K.J. Lyttinen, and S. T. McGann
BusinessWeek Online (2003b) "How Telecom Can Turn Itself Around," Jane Black, http://www.businessweek.com/technology/content/jan2003/ tc2003012_8750.htm (August 20, 2003).
BusinessWeek Online (2003c) "Online Extra: Telecom Execs Talk Wi-Fi," Roger O. Crockett, http://www.businessweek.com/cgi-bin/register/archive.cgi?c=&y=03&w=17&h= b3830614 .htm (August 20, 2003).
BusinessWeek Online (2003d) "Special Report: Will Web Services Click?" Business Week, http://www.businessweek.com/technology/tc_special/ 03web.htm (June 24, 2003).
BusinessWeek Online (2003e) "Tech Keeps Riding a Rising Tide," Tom Smith, CFA, http://www.businessweek.com/investor/content/aug2003/ pi20030820_2144_pi041.htm (August 20, 2003).
BusinessWeek Online (2003f) "Venture Capital Catches a Smaller Wave," Linda Himelstein, http://www.businessweek.com/magazine/content/03_09/b3822092_mz020.htm? c=bwinsiderfeb21&n=link3&t=email (Feb. 21, 2003).
BusinessWeek Online (2003g) “Where Web Services Meet the Road,” vol. 2003: David Welch. BusinessWeek Online (2003h) "Wrong Numbers for Telecom-Gear Markets," Olga Kharif,
http://www.businessweek.com/technology/content/feb2003/tc2003023_1680.htm (August 20, 2003).
Chwelos, P., I. Benbasat, and A. S. Dexter (2001) "Research Report: Empirical Test of an EDI Adoption Model," Info. Sys. Research (12) 3, pp. 304-321.
Ciborra, C. U., K. Braa, A. Cordella, B. Dahlbom et al. (eds.) (2001) From Control to Drift. The Dynamics of Corporate Information Infrastructures, New York: Oxford University Press.
Clark, T. H. and H. G. Lee (2000) "Performance, interdependence and coordination in business-to-business electronic commerce and supply chain management," Information Technology and Mangement (1) 1-2, pp. 85-105.
Daniel, E. M. and D. J. Grimshaw (2002) "An exploratory comparison of electronic commerce in large and small enterprises," Journal of Information Technology (17) 3, pp. 133-147.
Daveri, F. and A. Mascotto. (2002) The I.T. revolution across the U.S. states. IGIER (Innocenzo Gasparini Institute for Economic Research), Bocconi University Working Paper #226.
DeCarlo, L. T. (1997) "On the meaning and use of kurtosis," Psychological Methods (2pp. 292-307.
Fomin, V. V., J. L. King, K. Lyytinen, and S. McGann (2003) "Globalization and E-Commerce VII: Environment and Policy in the U.S.," Communications of the Association for Information Systems (CAIS) (10) November, pp. 276-325.
Gibbs, J., K. L. Kraemer, and J. Dedrick (2002) "Environment and Policy Factors Shaping E-commerce Diffusion: A Cross-Country Comparison," Center for Research on Information Technology and Organizations,http://repositories.cdlib.org/crito/globalization/311 (Feb.18, 2004).
Haacker, M. and J. Morsink. (2002) You Say You Want a Revolution: Information Technology and Growth. International Monetary Fund WP/02/70.
Helge, B., N. Volker, and C. E. W. P. No. (2005) Zooming Out: The Trade Effect of the Euro in Historical Perspective. CESifo GmbH.
Hof, R. D. (2003) “Why Techn Will Bloom Again,” in BusinessWeek, vol. August 25, pp. 64-70. Iacovou, C. L., I. Benbasat, and A. S. Dexter (1995) "Electronic data interchange and small
organizations: adoption and impact of technology," MIS Quarterly (19) 4, pp. 465-485. International Monetary Fund. (2001) World Economic Outlook. Chapter III: The Information
Technology Revolution. International Monetary Fund. Jones, T. Y. (2005) “HP Beats Estimates, Is Upbeat on Outlook,” in Los Angeles Times, Home
Edition edition, pp. 1. Los Angeles.

598 Communications of the Association for Information Systems (Volume 16, 2005) 559-603
Diffusion and Impacts of E-Commerce in the United State of America: Results from an Industry Survey by V.V. Fomin, J.L. King, K.J. Lyttinen, and S. T. McGann
Kling, R., K. L. Kraemer, and J. Dedrick (2003) "Letter from the editors," Information Society (19) 1, pp. 1-3.
Kraemer, K. L. and J. Dedrick. (2001) Dell Computer: Using E-commerce To Support the Virtual Company. Center for Research on Information Technology and Organizations.
Kraemer, K. L. and J. Dedrick. (2002a) Dell Computer: Organization of a Global Production Networ. Center for Research on Information Technology and Organizations.
Kraemer, K. L. and J. Dedrick. (2002b) Strategic use of the Internet and e-commerce: Cisco Systems. Center for Research on Information Technology and Organizations.
Kraemer, K. L., J. Dedrick, and D. Dunkle (2002) "E-Commerce: A Mile Wide and an Inch Deep," Center for Research on Information Technology and Organizations, http://repositories.cdlib.org/crito/globalization/289 (Feb.18, 2004).
Kraemer, K. L., J. Dedrick, and J. Gibbs (2003) "Introduction to the Special Volume on Globalization and e-Commerce," Communications of the AIS (11pp. 1-3.
Kraemer, K. L. and J. L. King (1996) "Order Without Design: NII in the United States," Information Infrastructure and Policy.
Mesenbourg, T. L. (2001) "Measuring Electronic Commerce," U.S. Bureau of the Census, http://www.census.gov/eos/www/papers/ebusasa.pdf (August 17, 2003).
Mirchandani, D. A. and J. Motwani (2001) "Understanding Small Business Ecommerce Adoption: An empirical analysis," Journal of Computer Information Systems (41) 3, pp. 70-83.
Mullaney, T. J. and P. Coy (2003) “This Gift Just Keeps on Giving,” in BusinessWeek, vol. August 25, pp. 72-73
National Retail Federation (2000) "VeriFone and Russell Reynolds Associates. Top 100 Internet Retailers: Comprehensive study tracks the nation's biggest on-line retailers," Stores Online. NRF Enterprises, Inc., http://www.stores.org/archives/sept00cover.asp (Feb. 21, 2003).
NCTA. (2004) Balancing Responsibilities and Rights: A Regulatory Model for Facilities-based VoIP Competition. National Cable & Telecommunications Association.
OECD. (2002) OECD Information Technology Outlook. Organisation for Economic Co-operation and Development.
Ratnasingam, P. (2000) "The influence of power on trading partner trust in electronic commerce," Internet Research: Electronic Networking Applications and Policy (10) 1, pp. 56-63.
Solomon, H. and S. Simon (2001) XML- ecommerce solutions for business and IT managers: McGraw Hill.
TechWeb.com (2004) "Report: Enterprise-Telephony Market Slow, But IP PBX Shipments Fast," TechWeb.com, http://www.techweb.com/wire/ebiz/ 54201468 (July 15, 2005).
Tekrati.com (2004) "Forrester Research Puts 2005 IT Spending Outlook in Macro-trends Context," Forrester Research, http://www.tekrati.com/T2/Analyst_Research/Research AnnouncementsDetails.asp?Newsid=3485 (July 15, 2005).
Tekrati.com (2005a) "Carrier VoIP Investments Picking Up Momentum, Says Infonetics Research," Infonetics Research, http://www.tekrati.com/T2/Analyst_Research/ Research AnnouncementsDetails.asp?Newsid=5445 (July 15, 2005).
Tekrati.com (2005b) "IDC Forecasts U.S. Telecommunications Services by Vertical Market," ForresterResearch,http://www.tekrati.com/T2/Analyst_Research/Research AnnouncementsDetails.asp?Newsid=5483 (July 20, 2005).
Tekrati.com (2005c) "JupiterResearch Estimates Municipal Wi-Fi Project Costs at $150,000 per Square Mile," JupiterResearch, http://www.tekrati.com/T2/Analyst_Research/Research AnnouncementsDetails.asp?Newsid=5423 (July 15, 2005).
U.S. Census Bureau (2003) "E-Stats 2002. United States Department of Commerce," Economics and Statistics Administration, http://www.census. gov/estats (August 17, 2003).

Communications of the Association for Information Systems (Volume 16, 2005) 559-603 599
Diffusion and Impacts of E-Commerce in the United State of America: Results from an Industry Survey by V.V. Fomin, J.L. King, K.J. Lyttinen, and S. T. McGann
van Ark, B. (2001) The Renewal Of The Old Economy: An International Comparative Perspective. OECD, Directorate For Science, Technology And Industry DSTI/DOC(2001)5.
Vogelstein, F. (2003) “Mighty Amazon,” in Fortune, vol. 147, pp. 60-4, 68, 70, 74. Zhu, K., K. L. Kraemer, S. Xu, and J. Dedrick. (2004) Information Technology Payoff in E-
Business Environments: An International Perspective on Value Creation of E-Business in the Financial Services Industry. Center for Research on Information Technology and Organizations.
APPENDIX I. RESEARCH METHODOLOGY AND GOALS FOR THE STATISTICAL ANALYSIS OF E-COMMERCE ADOPTION AND IMPACTS IN THE U.S.
The purpose of this appendix is to explain how the U.S. e-commerce data set was used in carrying out both exploratory and confirmatory analyses of adoption and impacts. Our goal in this process was to establish a consistent and rigorous model to explain the adoption and impact of e-commerce, which could be used for e-commerce diffusion analyses across countries. To do so, required stringent validation of the validity and reliability of the survey instrument. To this end we conducted exploratory factor analyses for survey data to establish factors for structural equation modeling (SEM). Thereafter we constructed structural models in AMOS to causally explain observed e-commerce adoption and impact.
The proposed measurement model specifies eleven first order independent factors, which fall into five categories associated with e-commerce diffusion (Table A1). These factors were identified through exploratory factor analysis of 31 survey items (Table A2).
The entire data set was first tested for multivariate normality and model goodness of fit using standard tests. Test for normality was conducted separately on the five factor groupings listed above using the macro ‘Normtest.sps’ [DeCarlo, 1997], an SPSS program which tests for univariate and multivariate skew and kurtosis, as well as outliers. Skew and kurtosis levels were sufficient (greater than 3), and therefore the distribution of data set was assumed to be normal.
Table A1. Factor Model for SEM modeling
Survey Category Factors Model Key
Survey Item Numbers
Prior Use of EC Technologies
EC Technologies ECT 17,18,22,23
Internet Data Exchange Use (B2B)
IDE 24e, 24f
Use of Internet for Ecommerce (Adoption) Sales and Service Use (B2C) SSU 24b, 24c
Market Expansion ME 28e, 28f Governmental Drivers GD 28h, 28i
Drivers for Internet Use
External Environment EE 28a, 28c, 28g Organizational Issues OI 29d, 29g Barriers for Internet Use Institutional/Regulatory Issues RI 29e, 30a, 30c,
30d Sales Improvements SIM 31c, 31d, 31e,
31j Impacts of doing Business Online Overall Efficiency/Productivity EFF 31a, 31b, 31g,
31i IS Spending 2001 IS Budget/Total Revenue, 2001 Web-
based Spending/Is Budget SP isrange,
webrange

600 Communications of the Association for Information Systems (Volume 16, 2005) 559-603
Diffusion and Impacts of E-Commerce in the United State of America: Results from an Industry Survey by V.V. Fomin, J.L. King, K.J. Lyttinen, and S. T. McGann
Table A2. The Item List Selected for Factor Analysis For Each Factor
Use of EC Technologies q17 Establishment's Use of an Intranet q18 Establishment's Use of an Extranet q22 Establishment's Use of EFT q23 Establishment's Use of a Call Center
Use of Internet
q24b Use - Making Sales Online q24c Use - After Sales Customer Service and Support q24e Use - Exchanging Operational Data with Suppliers q24f Use - Exchanging Operational Data with Business Customers Drivers for Internet Use
q28a Driver - Customers Demanded It q28c Driver - Suppliers Required It q28g Driver – To Improve Coordination with Suppliers q28e Driver - To Expand Market for Existing Products/Services q28f Driver - To Enter New Businesses or Markets q28h Driver - Required for Government Procurement q28i Driver - Government Provided Incentives
Barriers for Internet Use q29d Barrier - Finding Staff with eCommerce Expertise q29g Barrier - Making Needed Organizational Changes q29e Barrier - Prevalence of Credit Card Use in this Country q30a Barrier - Cost of Internet Access q30c Barrier - Taxation of Internet Sales q30d Barrier - Inadequate Legal Protection for Internet Purchases Impacts of doing Business Online q31a Impact - Internal Processes More Efficient q31b Impact - Staff Productivity Increased q31g Impact - Procurement Costs Decreased q31i Impact - Coordination with Suppliers Improved q31c Impact - Sales Increased q31d Impact - Sales Area Widened q31e Impact - Customer Service Improved q31j Impact - Our Competitive Position Improved IS Spending isrange 2001 IS Operating Budget as a % of Revenue webrange 2001 Web-based Spending as a % of IS Operating Budget

Communications of the Association for Information Systems (Volume 16, 2005) 559-603 601
Diffusion and Impacts of E-Commerce in the United State of America: Results from an Industry Survey by V.V. Fomin, J.L. King, K.J. Lyttinen, and S. T. McGann
After testing for normality, the data set was examined for outliers, which may disproportionately influence the results, using Mahalanobis distances. Observations with extreme distances (20% greater than the next closest point) from the mean were removed from the data set. The scatter plots of ordered distances resulted in the decision to eliminate five observations (154, 63, 243, 139, 148) from the data set. After establishing normality, items in each area of the questionnaire were grouped and subjected to EFA. The parameters for this analysis were as follows:
• Specified minimum Eigenvalues of 1. • Ran each analysis twice with PAF and ML extraction methods applied to confirm results. • Promax Rotation applied to all factors. • Need at least 2 items to load in order to be considered a factor.
After the data set was tested, the diffusion factors were examined through exploratory and confirmatory factor analysis to discover relations between factors and measures in an effort to eliminate inappropriate items while creating new factors. The models constructed and tested were primarily derived from prior EDI adoption and impact models first proposed by Iacovou et al., [1995], and later refined by Chwelos et al., [2001]. In this model, adoption is explained by three factors: perceived benefits, external pressure and readiness. The generalization of this model to the e-commerce context has been described as follows: “this model has general applicability to other forms of inter-organizational systems, particularly B2B ecommerce. While this extension may require re-operationalization, we hypothesize that the relationships predicted in our model will continue to hold” [Chwelos et al., 2001]. The two factors in the adoption and impact models developed in our analysis of the survey data that were similar to the EDI model adoption model are: 1) the factors “Drivers for Internet Use” compares to their “External Pressures” factor, and 2) the factors “Use of EC Technologies” is similar to their “Readiness” factor. We expanded this model by adding an additional a factor called “Barriers for Internet Use”. Moreover, we did not examine the impact of these factors only in general but instead conducted the analysis both at the overall economy level, industry level, and based on the size of the business. Our concept of adoption follows the notion adopted in Kraemer et al. [2002], which looked at level of adoption and impacts in the B2B and B2C contexts for specific industries. The factors were grouped into categories consistent with the survey model as shown in Table A1.
All these factors were then placed in a single structural equation model to test the quality of the overall measurement model. Individual models were then constructed by using AMOS to test relationships between factors, which relate both to adoption and impacts of e-commerce. Each of the factors was then placed in a single SEM in order to test the overall data fit to measurement model. All factors were allowed to co-vary in order to test multi-collinearity and factor and discriminant validity. The fit analyses and correlation matrix were then examined. The results, which confirmed the fit of the measurement model, were as follows:
• Data was determined to fit factor model using AMOS fit analysis (NFI>.9, CFI>.9, RMSEA<.5).
• Multi-collinearity occurred only between factors that were expected to correlate.
Thereafter the data set was grouped by industry sector (manufacturing, distribution and finance), and business size (SME and large) in order to provide more detailed analysis to control for the impact of industry or business size. Each model was tested using the aggregate data set, and then by industry sector and business size. Significant regression relationships in these models provided the basis for analysis and conclusions.

602 Communications of the Association for Information Systems (Volume 16, 2005) 559-603
Diffusion and Impacts of E-Commerce in the United State of America: Results from an Industry Survey by V.V. Fomin, J.L. King, K.J. Lyttinen, and S. T. McGann
LIST OF ABBREVIATIONS AMOS Structural equation modeling (SEM) software ANSI American National Standards Institute ANSI X12 Also known as "ASC X12." A protocol from the American National Standards Institute (ANSI)
for electronic data interchange (EDI) ATM Automatic Teller Machine B2B Business-to-Business (B2B) electronic commerce B2C Business-to-Consumer (B2B) electronic commerce CFI Comparative Fit Index CRITO Center for Research on Information Technology and Organizations at the University of
California, Irvine EbXML Electronic Business using eXtensible Markup Language EC Electronic Commerce EDI Electronic Data Interchange EFA Exploratory Factor Analysis EFT Electronic Funds Transfer GDP Gross Domestic Product GEC Global Electronic Commerce GNP Gross National Product ICT Information and Communication Technology IP Intellectual Property IP Internet Protocol IT Information Technology ML Maximum Likelihood NAICS North American Industry Classification System NFI Normed Fit Index NSF National Science Foundation OASIS Organization for the Advancement of Structured Information Standards OECD Organization for Economic Co-operation and Development OEM Original Equipment Manufacturer PAF Principal Axis Factoring PBX Private branch exchange (private telephone exchange) PC Personal Computer RMSEA Root Mean Square Error of Approximation SEM Structural Equation Modeling SME Small and Medium Sized (Company) SOAP Simple Object Access Protocol SPSS Statistical (Software) Package for the Social Sciences UDDI Universal Description, Discovery and Integration VAN Value-Added Network VC Venture Capital W3C World Wide Web Consortium WSDL Web Service Description Language XML eXtensible Markup Language
ABOUT THE AUTHORS
Vladislav V. Fomin is Assistant Professor of Informatics at the Copenhagen Business School. Prior to coming to Denmark he was Visiting Assistant Professor at the School of Information at the University of Michigan. Current research interests include standard making process in the field of information and communication technologies (ICT) and studies of ICT infrastructure development, including these of global e-commerce. He received his Dipl.Eng.Econ and MSc.BA degrees from the University of Latvia in 1995 and 1997 respectively. He holds Lic.Ph.Econ and Dr.Ph.Econ from the University of Jyväskylä, Finland.
John Leslie King is Dean and Professor in the School of Information at the University of Michigan. His research concerns the development of high-level requirements for information systems design and implementation in institutionalized production sectors such as common

Communications of the Association for Information Systems (Volume 16, 2005) 559-603 603
Diffusion and Impacts of E-Commerce in the United State of America: Results from an Industry Survey by V.V. Fomin, J.L. King, K.J. Lyttinen, and S. T. McGann
carrier communications, logistics and transport, health care, criminal courts, electric power, and electronic commerce. He is on the Advisory Committee for the Directorate for Computer and Information Science and Engineering of the National Science Foundation and the board of the Computing Research Association, and served as Editor-in-Chief of the INFORMS journal Information Systems Research from 1993-1998. Prior to coming to Michigan he was Professor of Information and Computer Science and Management at UC Irvine, as well as Marvin Bower Fellow and Visiting Professor at the Harvard Business School in 1990. He holds a Ph.D. from the University of California, Irvine.
Kalle Lyytinen is Iris S. Wolstein professor at Case Western Reserve University in Information Systems and an adjunct professor at the University of Jyväskylä, Finland. He currently serves on the editorial boards of several leading IS journals including being the Editor-in-chief for Journal of the Association for Information Systems, Journal of Strategic Information Systems, Information & Organization, Requirements Engineering Journal, and Information Systems Journal. He is the author of over 150 scientific articles and conference papers and has edited or written ten books on topics related to system design, method engineering, implementation, software risk assessment, computer supported cooperative work, standardization, and ubiquitous computing. He is currently involved in research projects that examine IT-induced innovation in the software development, architecture, and construction industries, and is developing a high-level requirements model for large-scale systems. His research interests include information system theories, computer aided system design, method engineering, system failures and risk assessment, computer supported cooperative work, nomadic computing, the innovation and diffusion of complex technologies, and the role of institutions in such processes.
Sean T. McGann is Assistant Professor of Information Systems at Ohio University. His research interests include IS pedagogy and curriculum, IS user Improvisation, inter-organizational systems and supply chain systems. He currently teaches systems development, systems analysis and design, and database courses. He also serves as faculty Advisor to Ohio University’s chapter of the Association for Information Technology Professionals. He received teaching awards such as MIS Professor of the Year and The Senior Student Recognition Award. Sean earned a Ph.D. in information systems from Case Western Reserve University, an MBA from Ohio University and a B.S. in Electronics Engineering from Bowling Green State University. He spent 5 years in Andersen’s Business Consulting Practice, 2 years as CEO of Pogonet Internet Solutions, Inc., and continues to operate an independent systems consulting company.
Copyright © 2005 by the Association for Information Systems. Permission to make digital or hard copies of all or part of this work for personal or classroom use is granted without fee provided that copies are not made or distributed for profit or commercial advantage and that copies bear this notice and full citation on the first page. Copyright for components of this work owned by others than the Association for Information Systems must be honored. Abstracting with credit is permitted. To copy otherwise, to republish, to post on servers, or to redistribute to lists requires prior specific permission and/or fee. Request permission to publish from: AIS Administrative Office, P.O. Box 2712 Atlanta, GA, 30301-2712 Attn: Reprints or via e-mail from [email protected].

ISSN: 1529-3181 EDITOR-IN-CHIEF
Paul Gray Claremont Graduate University
AIS SENIOR EDITORIAL BOARD Jane Webster Vice President Publications Queen’s University
Paul Gray Editor, CAIS Claremont Graduate University
Kalle Lyytinen Editor, JAIS Case Western Reserve University
Edward A. Stohr Editor-at-Large Stevens Inst. of Technology
Blake Ives Editor, Electronic Publications University of Houston
Reagan Ramsower Editor, ISWorld Net Baylor University
CAIS ADVISORY BOARD Gordon Davis University of Minnesota
Ken Kraemer Univ. of Calif. at Irvine
M.Lynne Markus Bentley College
Richard Mason Southern Methodist Univ.
Jay Nunamaker University of Arizona
Henk Sol Delft University
Ralph Sprague University of Hawaii
Hugh J. Watson University of Georgia
CAIS SENIOR EDITORS Steve Alter U. of San Francisco
Chris Holland Manchester Bus. School
Jaak Jurison Fordham University
Jerry Luftman Stevens Inst.of Technology
CAIS EDITORIAL BOARD Tung Bui University of Hawaii
Fred Davis U.ofArkansas, Fayetteville
Candace Deans University of Richmond
Donna Dufner U.of Nebraska -Omaha
Omar El Sawy Univ. of Southern Calif.
Ali Farhoomand University of Hong Kong
Jane Fedorowicz Bentley College
Brent Gallupe Queens University
Robert L. Glass Computing Trends
Sy Goodman Ga. Inst. of Technology
Joze Gricar University of Maribor
Ake Gronlund University of Umea,
Ruth Guthrie California State Univ.
Alan Hevner Univ. of South Florida
Juhani Iivari Univ. of Oulu
Claudia Loebbecke University of Cologne
Michel Kalika U. of Paris Dauphine
Munir Mandviwalla Temple University
Sal March Vanderbilt University
Don McCubbrey University of Denver
Michael Myers University of Auckland
Seev Neumann Tel Aviv University
Dan Power University of No. Iowa
Ram Ramesh SUNY-Buffalo
Kelley Rainer Auburn University
Paul Tallon Boston College
Thompson Teo Natl. U. of Singapore
Doug Vogel City Univ. of Hong Kong
Rolf Wigand U. of Arkansas,LittleRock
Upkar Varshney Georgia State Univ.
Vance Wilson U.of Wisconsin,Milwaukee
Peter Wolcott U. of Nebraska-Omaha
Ping Zhang Syracuse University
DEPARTMENTS Global Diffusion of the Internet. Editors: Peter Wolcott and Sy Goodman
Information Technology and Systems. Editors: Alan Hevner and Sal March
Papers in French Editor: Michel Kalika
Information Systems and Healthcare Editor: Vance Wilson
ADMINISTRATIVE PERSONNEL Eph McLean AIS, Executive Director Georgia State University
Reagan Ramsower Publisher, CAIS Baylor University