diffusion and functional mri of the spinal cord …jcohen/ftp/talk_hbm11_symposium_dmri… ·...
TRANSCRIPT
Diffusion and Functional MRI of the Spinal CordMethods and Clinical Applications
Susceptibility artifacts in DTI of the spinal cord J. Cohen-Adad
Q-space imaging and axon diameter measurements C. Wheeler-Kingshott
Functional MRI Potential for Clinical Assessment of the Injured Human Spinal Cord
P. Stroman
TSE / GE-EPI spinal cord fMRI and angiography of spinal vasculature
W. Backes
Physiological noise modelling in spinal cord fMRI J. Brooks
Susceptibility artifacts in DTI of the spinal cord
J. Cohen-Adad, PhD
A.A. Martinos Center for Biomedical ImagingMGH, Harvard Medical School
Charlestown, MA
12
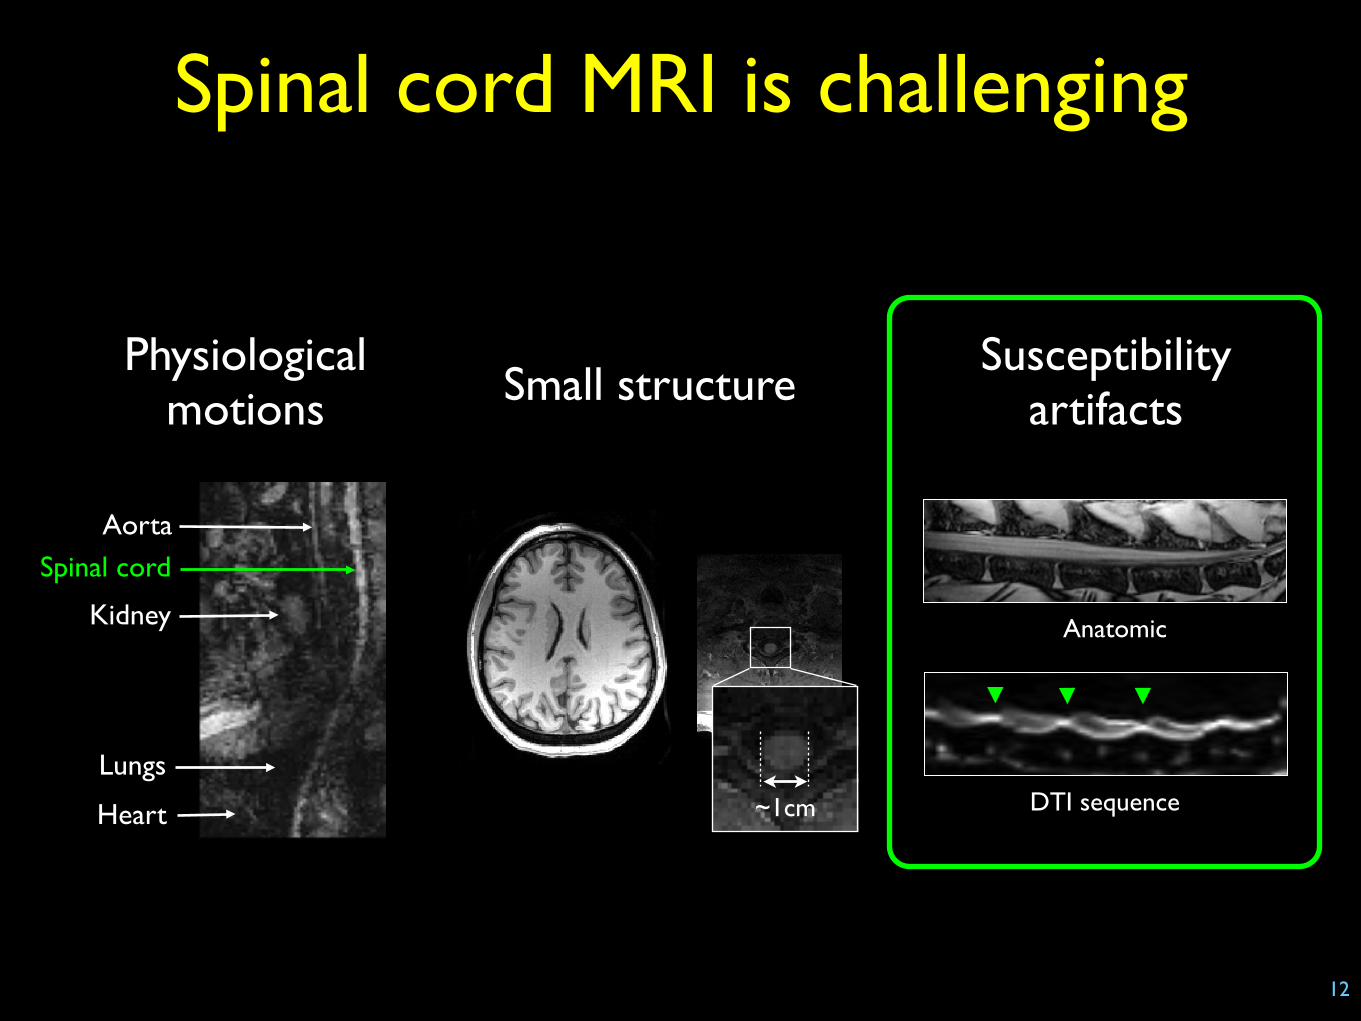
Spinal cord MRI is challenging
Lungs
Aorta
Kidney
Heart
Spinal cord
Physiological motions Small structure
Anatomic
DTI sequence
Susceptibility artifacts
~1cm
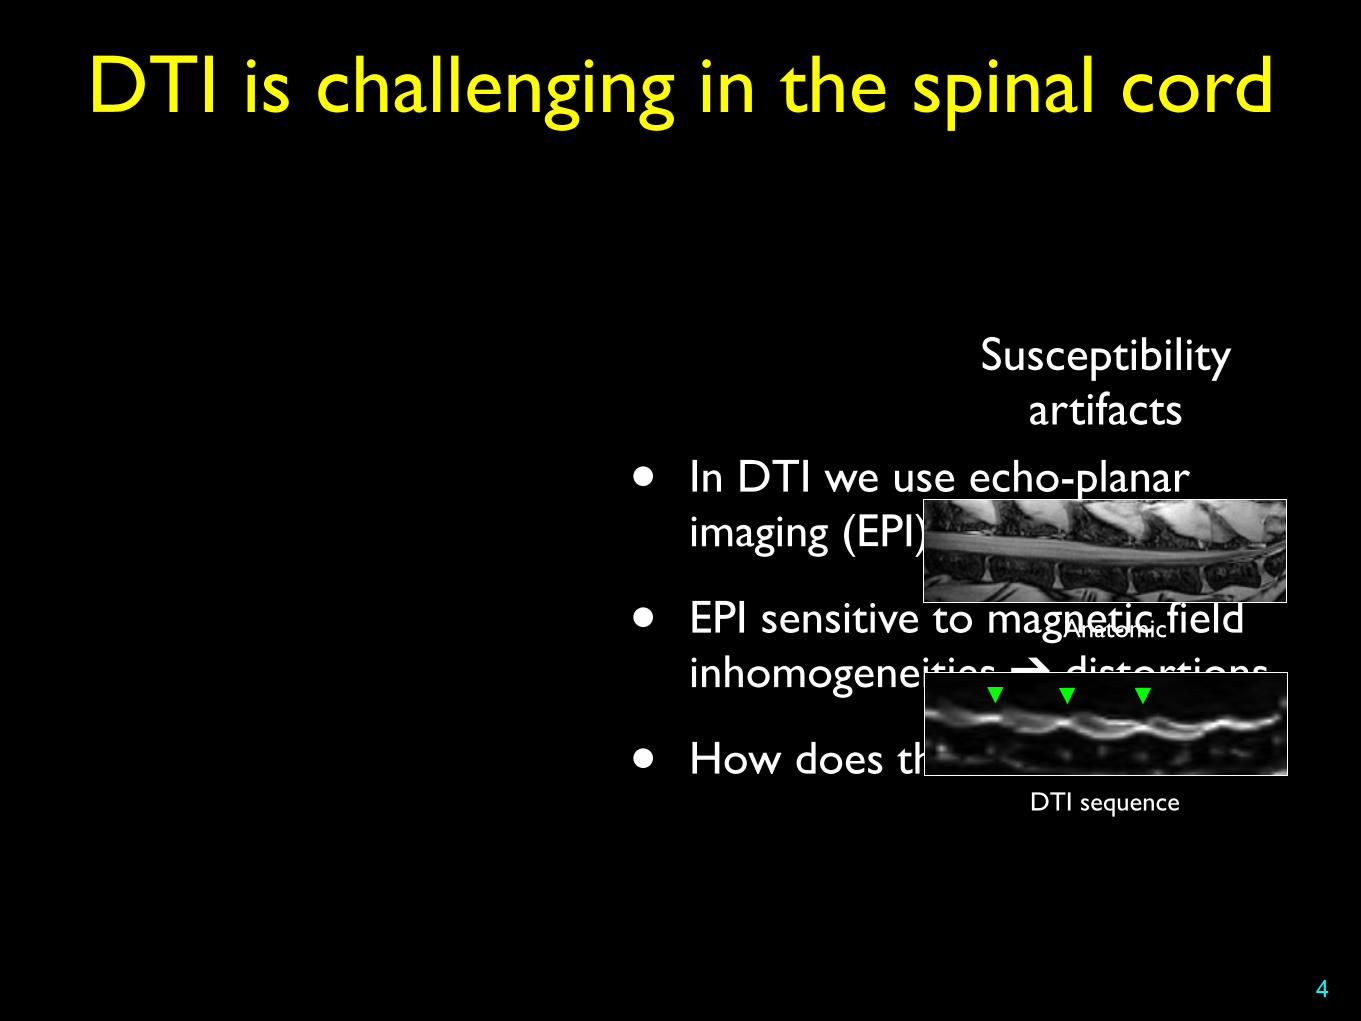
DTI is challenging in the spinal cord
4
• In DTI we use echo-planar imaging (EPI) readout
• EPI sensitive to magnetic field inhomogeneities ➔ distortions
• How does this work?
Anatomic
DTI sequence
Susceptibility artifacts
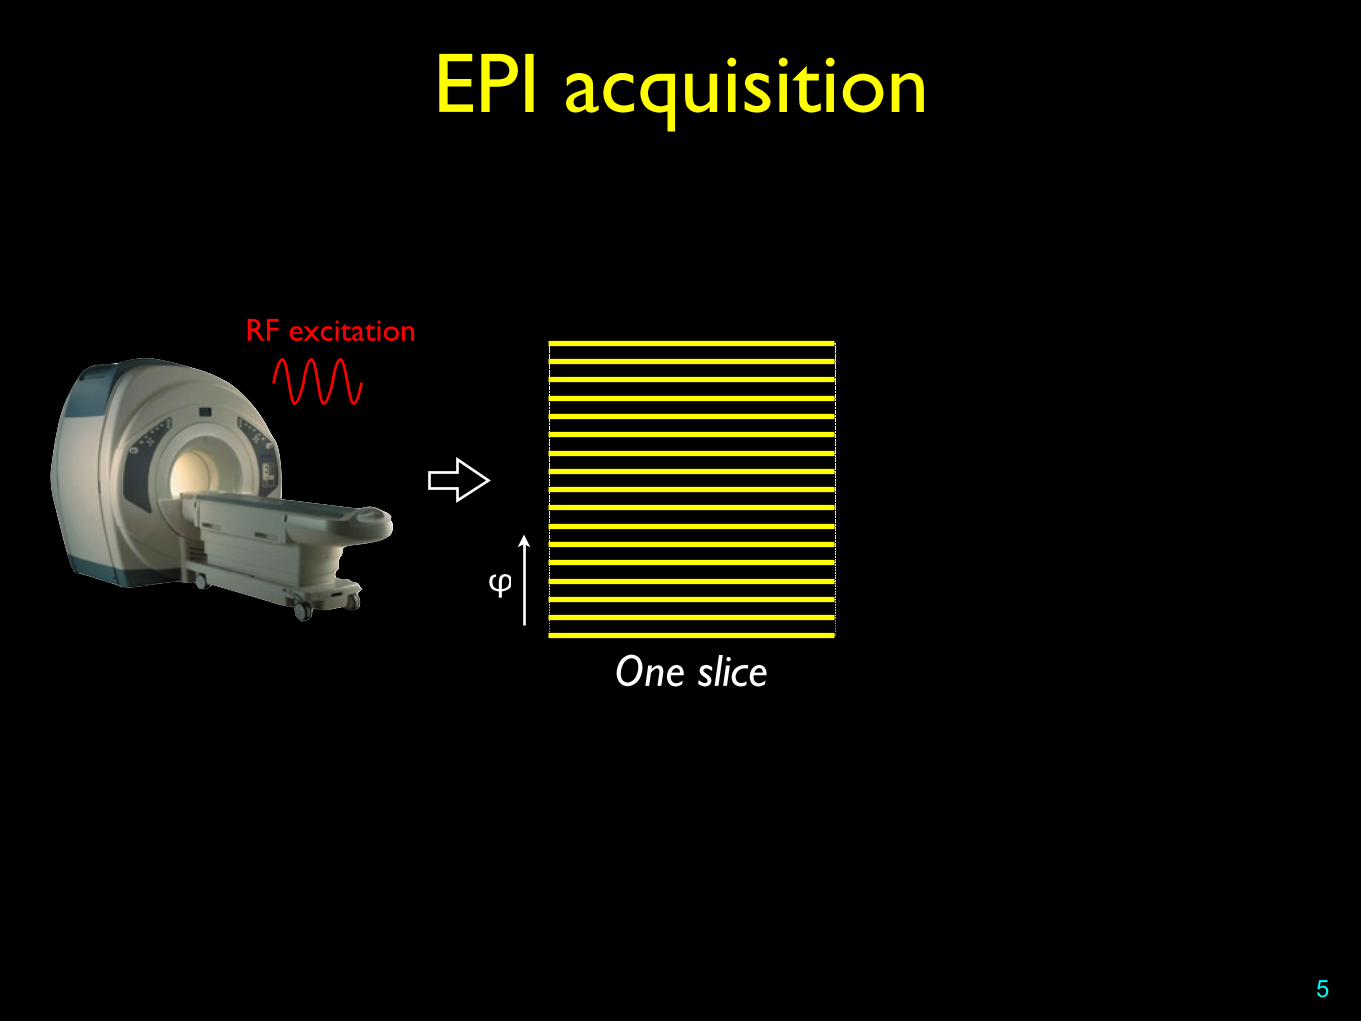
EPI acquisition
5
φ
One slice
RF excitation
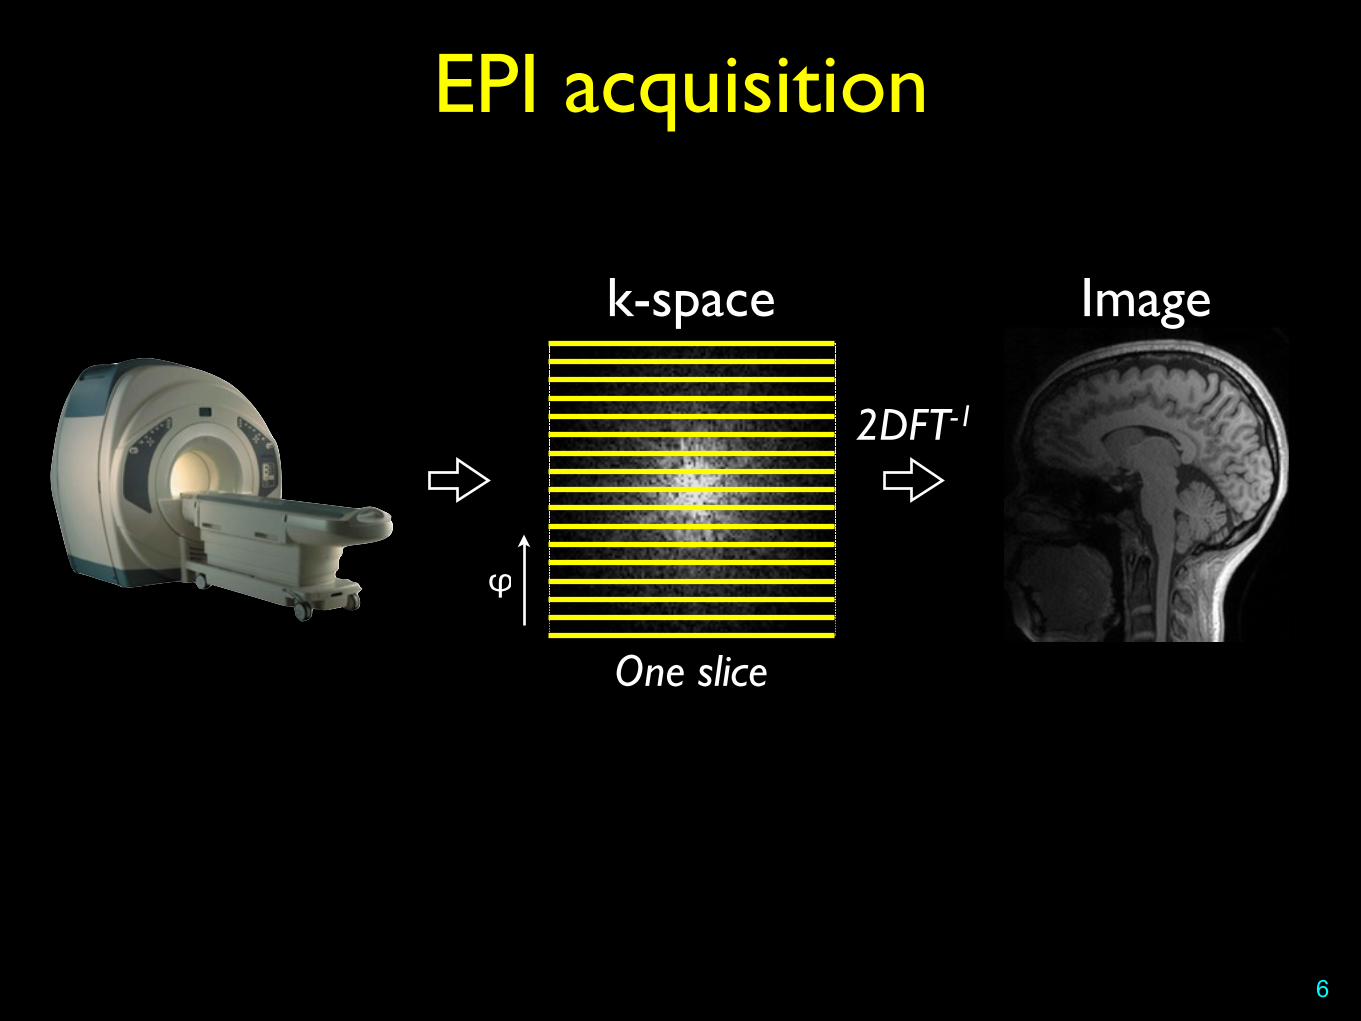
EPI acquisition
6
φ
k-space
One slice
Image
2DFT-1

Susceptibility artifacts
7
• Linear gradients are applied to spatially encode spin location
• If magnetic inhomogeneities are present, the linearity is corrupted
• in EPI, error accumulates in the X and Y directions
• Error proportional to the time spent filling the k-spacewhat we think we record
k-space
what we actually record
φ
Susceptibility artifacts
8
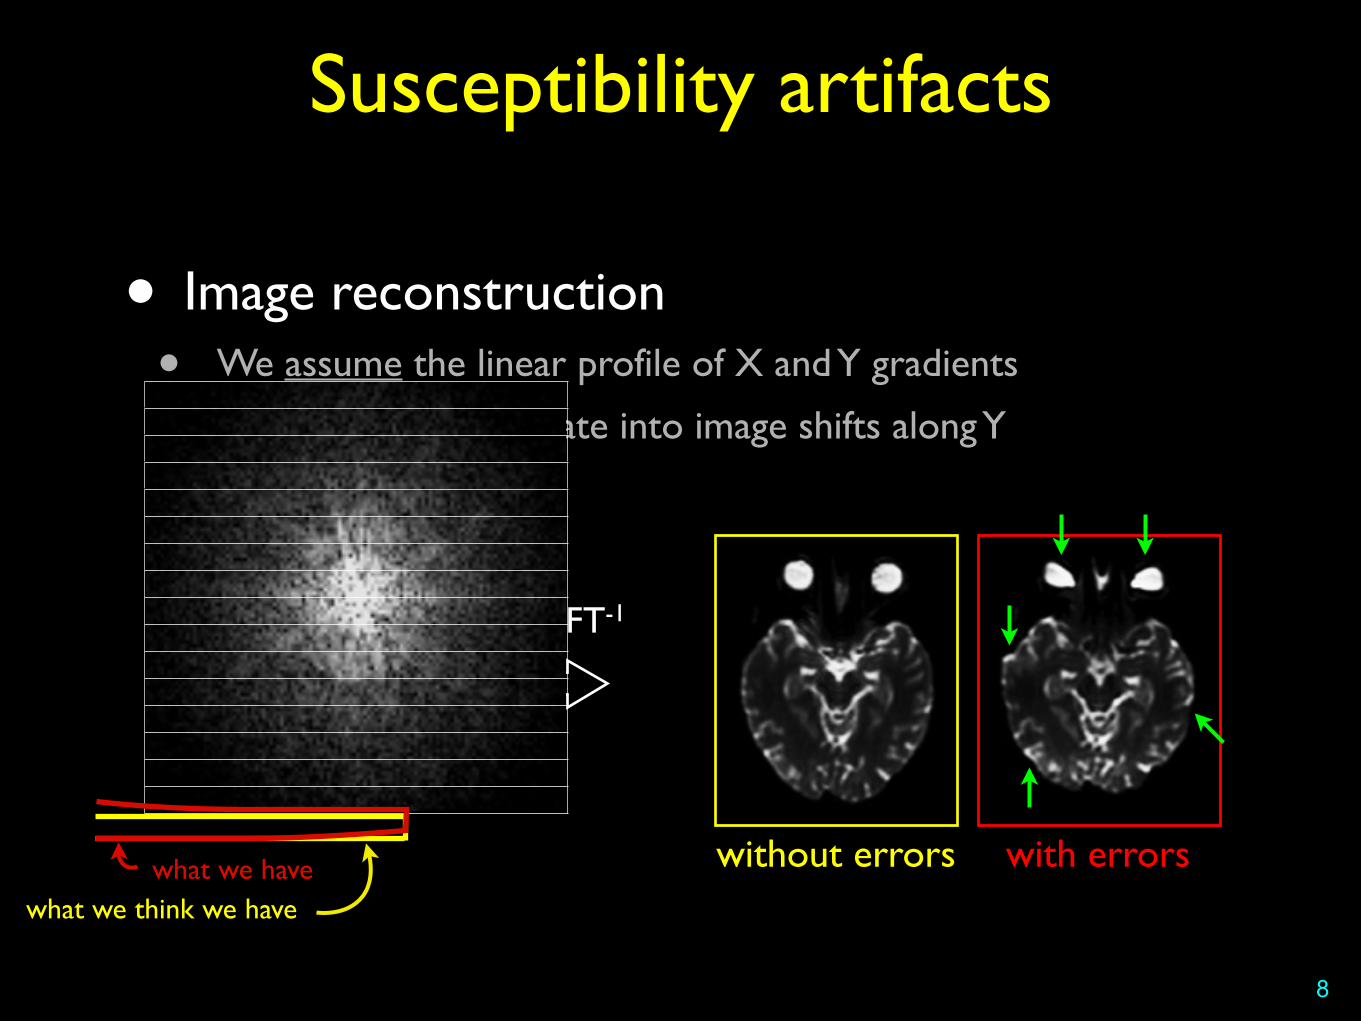
• Image reconstruction• We assume the linear profile of X and Y gradients
• Errors along ky translate into image shifts along Y
2DFT-1
without errors with errorswhat we havewhat we think we have
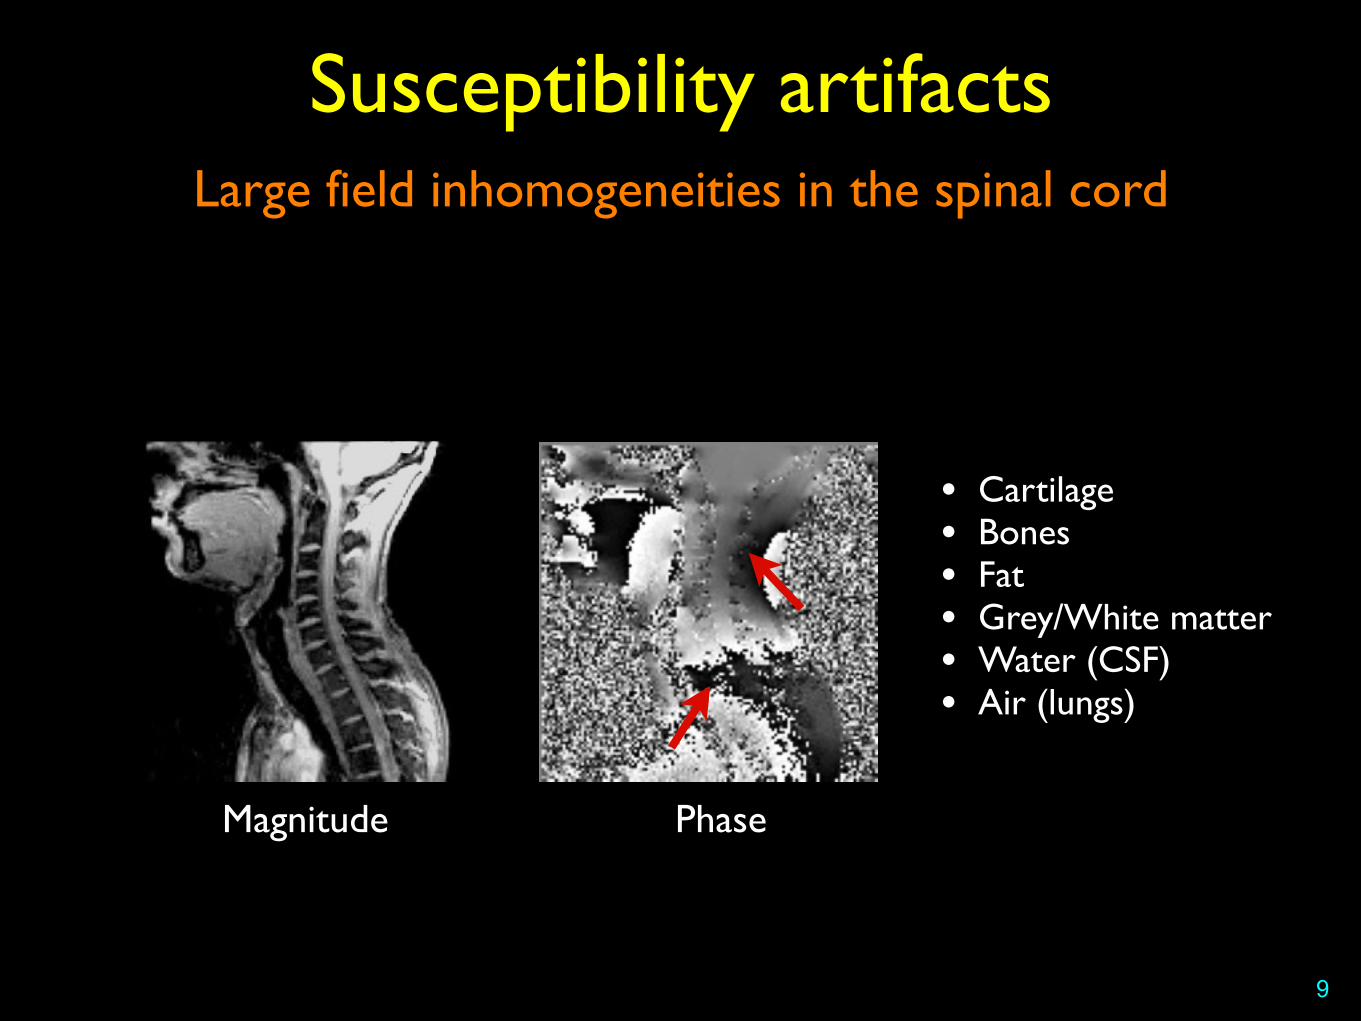
Large field inhomogeneities in the spinal cord
Susceptibility artifacts
9
• Cartilage• Bones• Fat• Grey/White matter• Water (CSF)• Air (lungs)
Magnitude Phase

Solutions?
• Better shim
10

Pfeuffer et al. “Zoomed EPI using 2D RF Excitation Pulses” (Siemens WIP #508A)
Importance of shimming
11
GE-EPI, TE=36ms, matrix=128x40, voxel size=2x2x2mm3, R=1
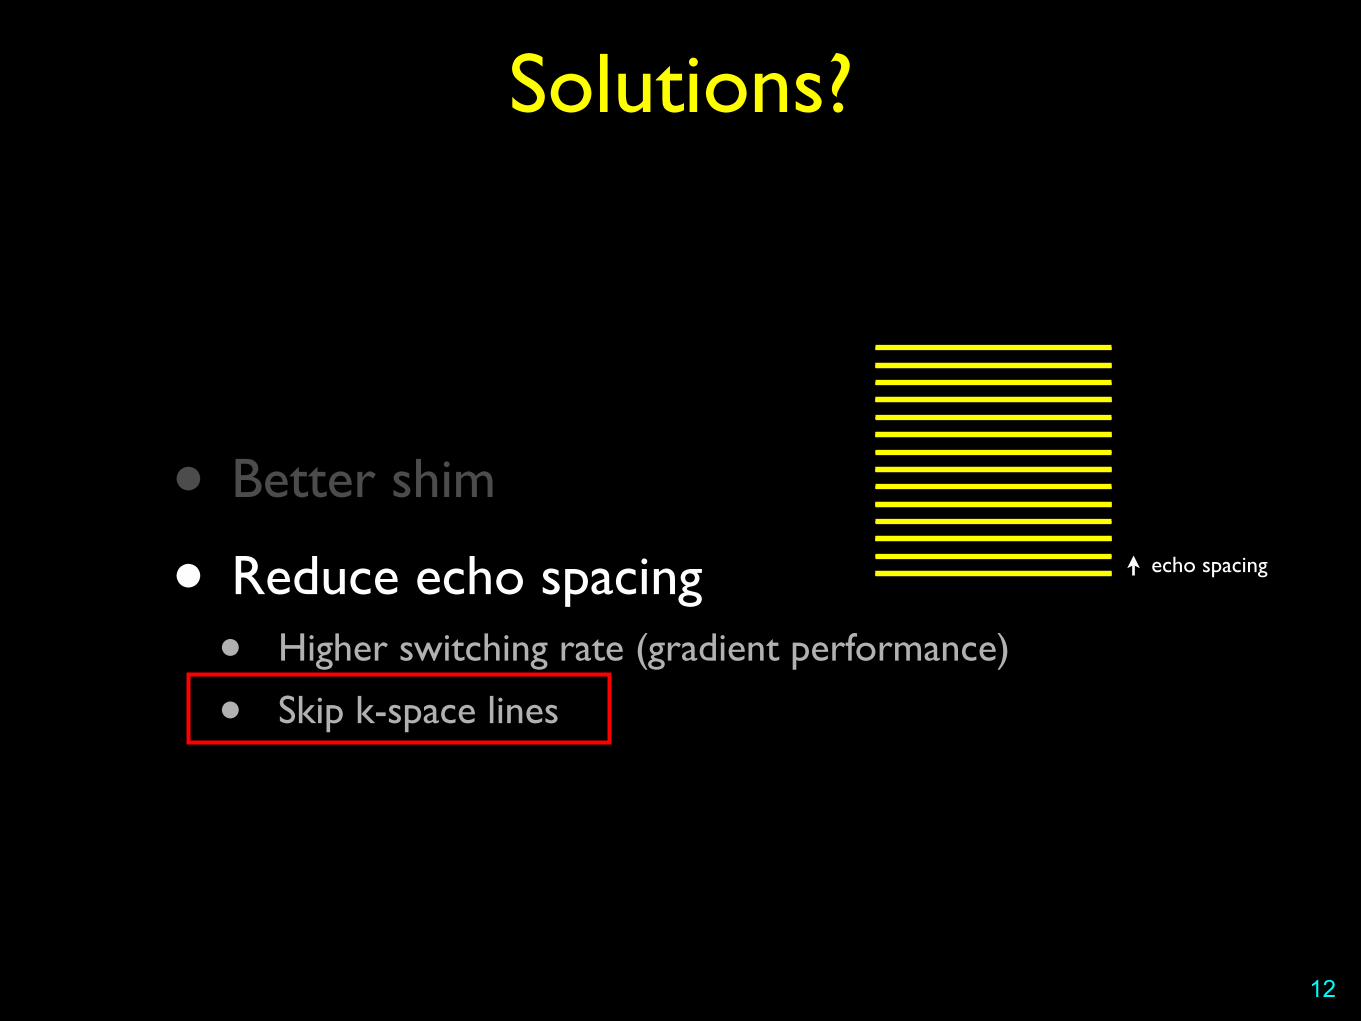
Solutions?
• Better shim
• Reduce echo spacing• Higher switching rate (gradient performance)
• Skip k-space lines
12
echo spacing

Multi-shot acquisition
Susceptibility artifacts
13
φ
First shot
Image space k-space
Second shot
FOV

Multi-shot acquisition
D. Porter et al. “RESOLVE Multi-Shot Diffusion” (Siemens WIP #544A)
Susceptibility artifacts
14
• EPI-based (Fast, high SNR)
• Longer than single shot
• Phase errors induced by physiological motion ➔ navigator echoes
TR~2800ms (cardiac gated), TE=74ms, matrix=124x138 (3 shots), resolution=1.7x1.7x1.7 mm3, R=2, b=800 s/mm2, 30 dir.
b=0 mean DWI FA colormap

Reduced FOV
Susceptibility artifacts
15
φ
Image space
FOV
FOVreduce effective
echo spacing
k-space
ky = 1/FOVy
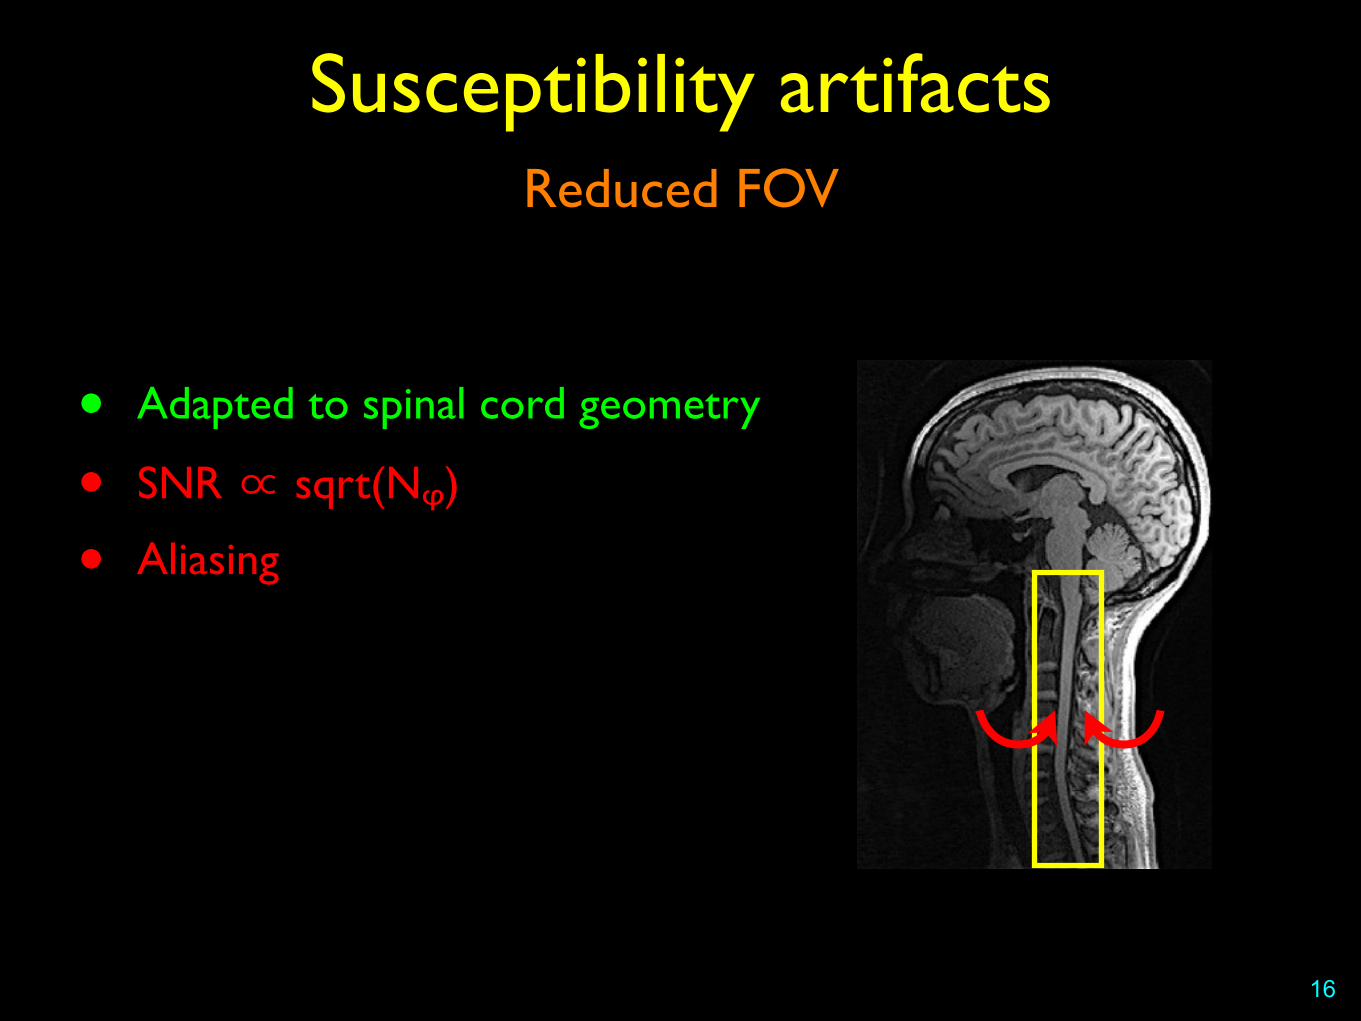
Reduced FOV
Susceptibility artifacts
16
• Adapted to spinal cord geometry
• SNR ∝ sqrt(Nᵩ)
• Aliasing
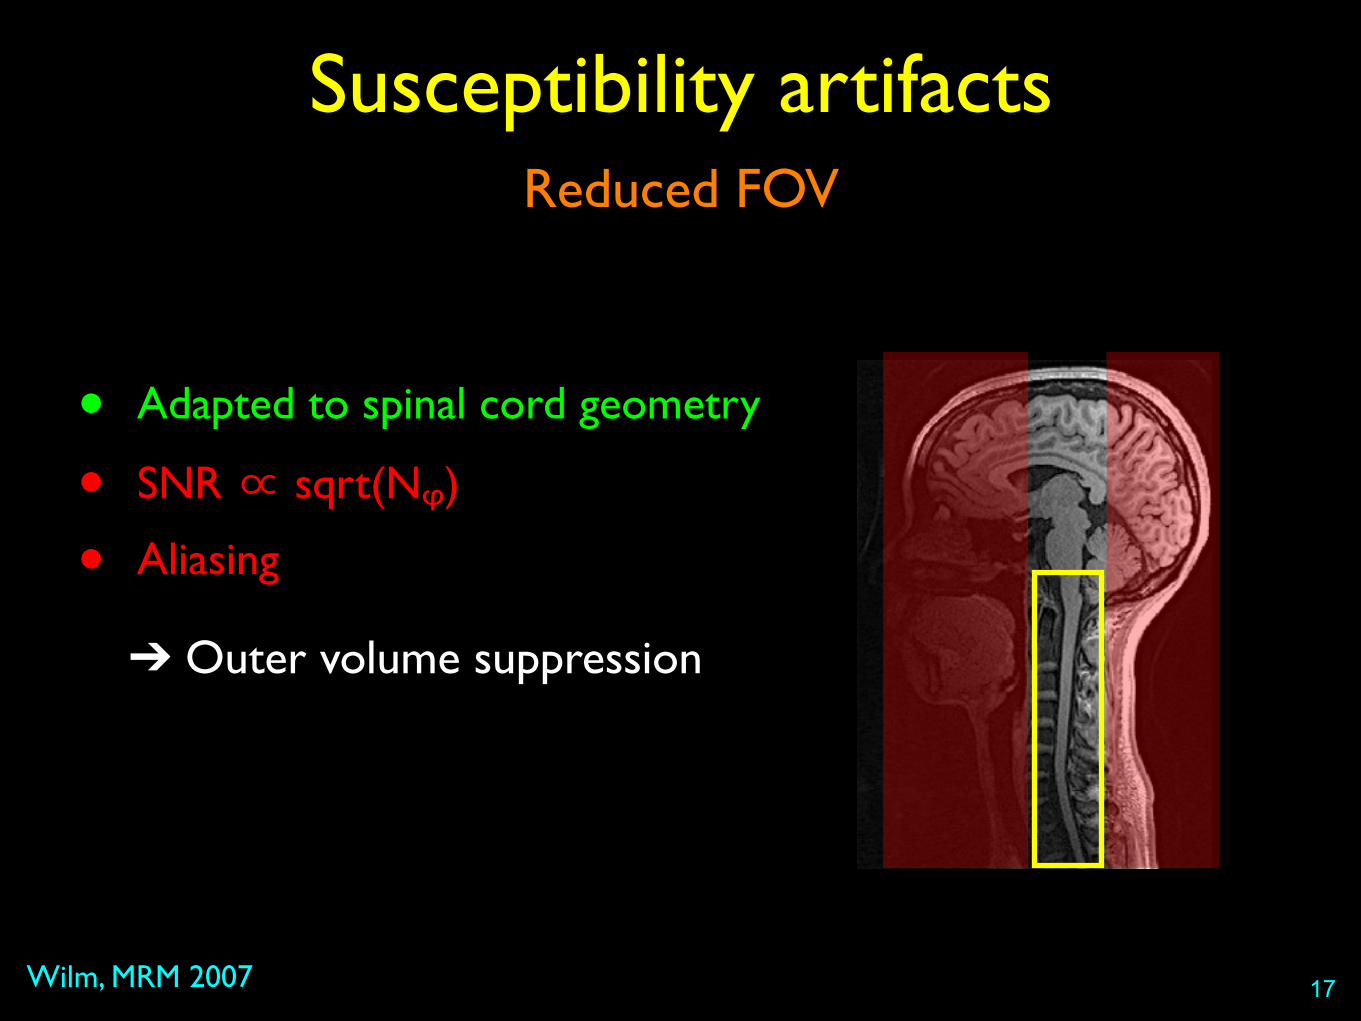
Reduced FOV
Wilm, MRM 2007
Susceptibility artifacts
17
• Adapted to spinal cord geometry
• SNR ∝ sqrt(Nᵩ)
• Aliasing
➔ Outer volume suppression

Reduced FOV
Saritas, MRM 2007 ; Finsterbusch JMRI 2009 ; Dowell, JMRI 2009
Susceptibility artifacts
18
• Adapted to spinal cord geometry
• SNR ∝ sqrt(Nᵩ)
• Aliasing
➔ Outer volume suppression➔ Spatially selective excitation
Reduced FOV
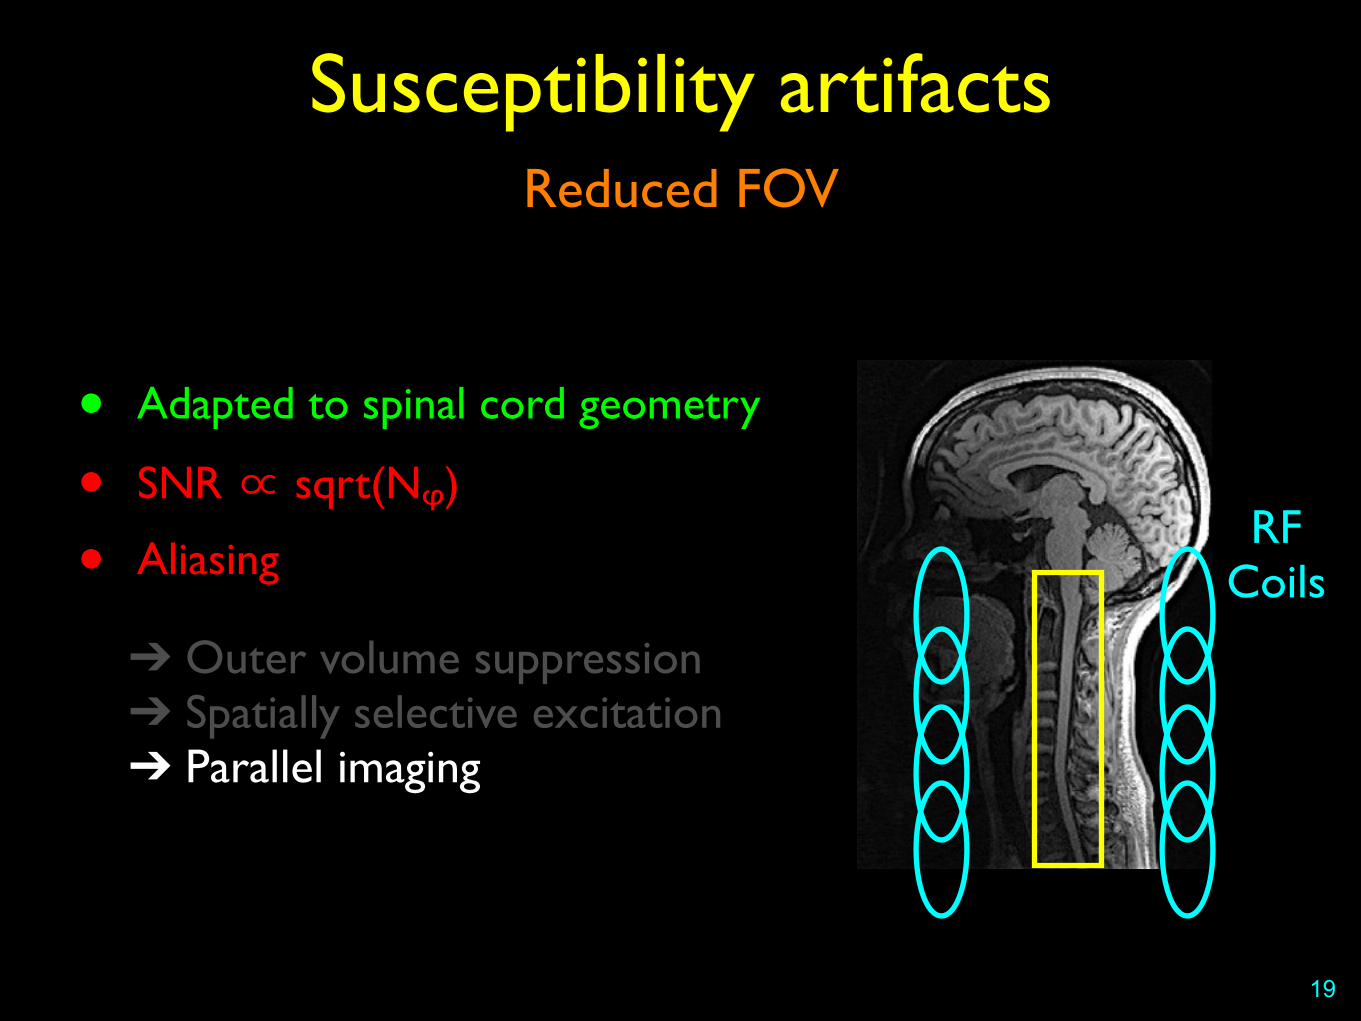
Susceptibility artifacts
19
• Adapted to spinal cord geometry
• SNR ∝ sqrt(Nᵩ)
• Aliasing
➔ Outer volume suppression➔ Spatially selective excitation➔ Parallel imaging
RF Coils

Parallel imaging
Griswold, MRM 2002 ; Pruessman, MRM 1999
Susceptibility artifacts
20
FOV
ReceiveCoils
Parallel imaging
Susceptibility artifacts
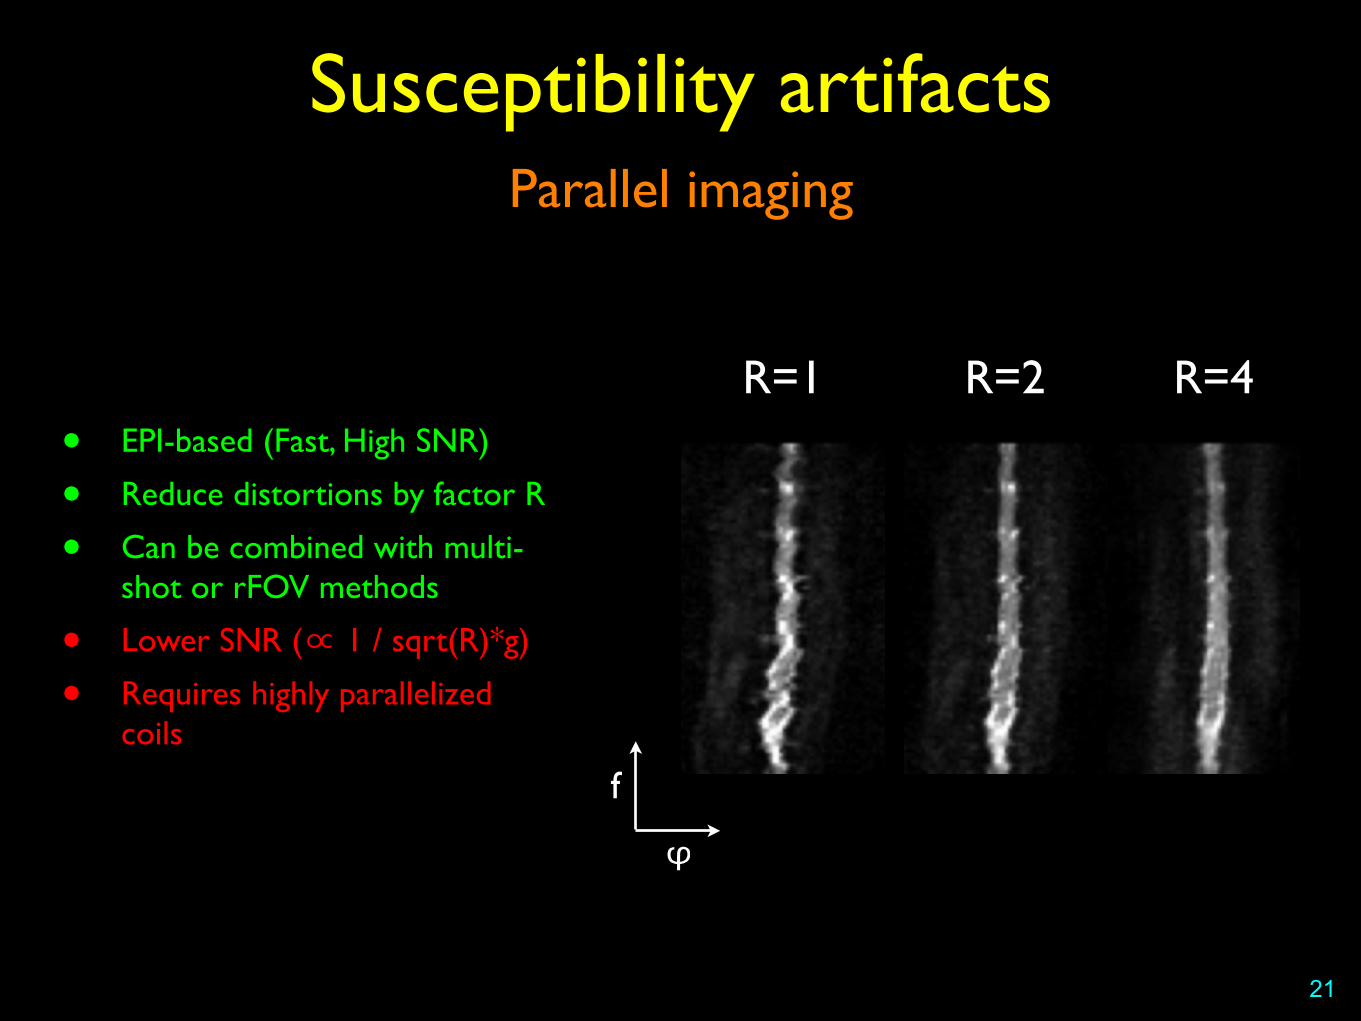
21
R=1 R=2 R=4
f
φ
• EPI-based (Fast, High SNR)
• Reduce distortions by factor R
• Can be combined with multi-shot or rFOV methods
• Lower SNR (∝ 1 / sqrt(R)*g)
• Requires highly parallelized coils
Roemer, MRM 1990
• Benefits of multiple array coils• Parallel imaging ➔ Less susceptibility artifacts
• Smaller coil elements ➔ Higher SNR
22
Array coils
23
SENSE Optimized Sixteen Element Receive Array for Cervical Spinal Cord Imaging at 3T
J. Bodurka1, P. Ledden2, and P. Bandettini1,3 1Functional MRI Facility, National Institute of Mental Health, NIH, Bethesda, MD, United States, 2Nova Medical Inc., Wilmington, MA, United States, 3Section on
Functional Imaging Method, National Institute of Mental Health, NIH, Bethesda, MD, United States
Introduction: High quality and high resolution anatomical and functional imaging of the human spinal cord remains a significant challenge in MRI [1,2]. The benefits of parallel imaging with surface coil arrays have been clearly shown particularly in the brain imaging for both anatomical and fMRI studies [3,4]. Here we demonstrate a custom design and build of a sixteen element receive-only surface coil array for spinal cord MRI imaging at 3 Tesla. Material and Methods: The spinal array has been develop and built with help of Nova Medical Inc. (Wakefield, MA USA). The array consisted of a 4x4 arrangement of coils placed upon a rigid curved former (Fig 1a). Each of the four columns comprised four elements overlapped in z. In order to improve axial Sensitivity Encoding (SENSE) g factors, gaps were placed between adjacent columns with a gap to element width ratio of 30%. Each coil element comprised an oval 8x6cm copper trace on flexible PC board and was tuned to 127.8 MHz with distributed capacitors. A lumped element balun matched the coil impedance to 50 ohm coaxial cable and in conjunction with a PIN diode functioned as an active detuning trap. Each element also had one passive detuning trap. The cables from each coil were routed to ultra low impedance preamplifiers (input impedance <1.2 ohm) through two sets of baluns to minimize any common mode cable currents. The preamplifier outputs were then fed to the 3Tesla General Electric HDx system connectors through two shielded cable bundles with integral triaxial baluns. MRI Imaging: Phantom: Gradient Echo with FOV/sl=300/4mm, matrix 256x256, TR/TE=34/1.2ms, flip=20deg, BW=31.25kHz. Human: Fast Spin Echo Sequence with flow compensation and fat suppression was used with: FOV/sl/gap=300/2/0.5 mm, matrix 512x512, TR/TE=2800/90ms, NEX=4, etl=16, BW=50kHz, 16 sagittal slices. Single shot EPI with SENSE (reduction factor=2 in the phase direction) was used with: FOV/sl/gap=120/4/0.5 mm, matrix 192x144, TR/TE=2000/30 ms, BW=250kHz, 10 axial slices.
Results: Phantom results are shown on Figures 1c-1e. The sagittal reference image (Fig 1c, display level displev=0-1000) shows coronal imaging plane (red line) used for the array evaluation as well as individual coronal coils images (Fig 1d, displev=0-300) and resulting the combine image (Fig 1e, square root of sum of squares, displev=0-500) are shown. Individual images show an excellent isolation between coils. An example of T2-weighted FSE anatomical image (SNR image: displev=0-70) and of high-resolution SENSE EPI axial images (displev=0-2000) are shown on Figures 2a and 2b respectively. Discussion and Conclusion: The new 16-element spinal array offers excellent image quality for both anatomical and functional studies. The imaging coverage spans from brain visual cortex down to about the tenth cervical vertebra. The coil optimized parallel imaging design allowing high resolution SENSE EPI for functional studies – which may be critical for more meaningful fMRI results to be obtained from the spinal cord. With regard to anatomical imaging, the good SNR over a large range of the spine can open up a wide array of potential clinical applications. References: 1) Stroman Clin Med Res. 3;146, 2005; 2)Maieron et al. J. Neurosci. 27:4182, 2007; 3) Heidemann Neuroimaging Clin N Am. 16:311, 2006; 4) Bodurka et al. MRM, 51:165, 2004.
C-spine former
1a. Elements layout 1b. Coil picture 1c. Ref. Sagittal scan 1d. Individual coil images 1e. Combine image
1a
1c
1d
1e
I L
1b Figure 1
2b
R SENSE EPI
0-
2a FSE Figure 2
Proc. Intl. Soc. Mag. Reson. Med. 16 (2008) 1078
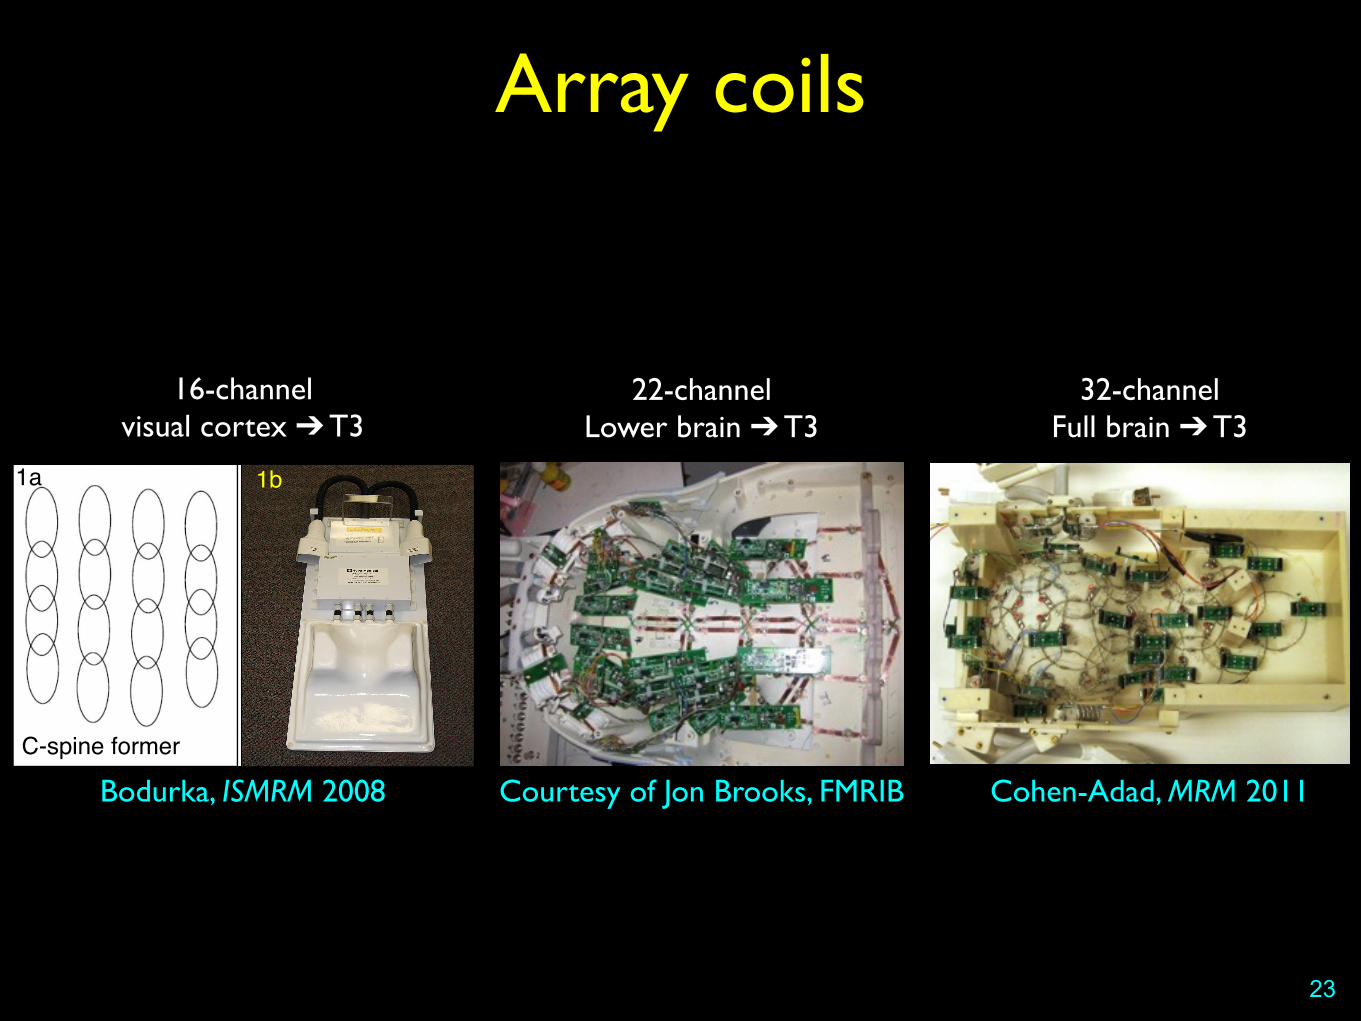
Bodurka, ISMRM 2008
16-channelvisual cortex ➔ T3
Courtesy of Jon Brooks, FMRIB
22-channelLower brain ➔ T3
Cohen-Adad, MRM 2011
32-channelFull brain ➔ T3
Array coils
SNR
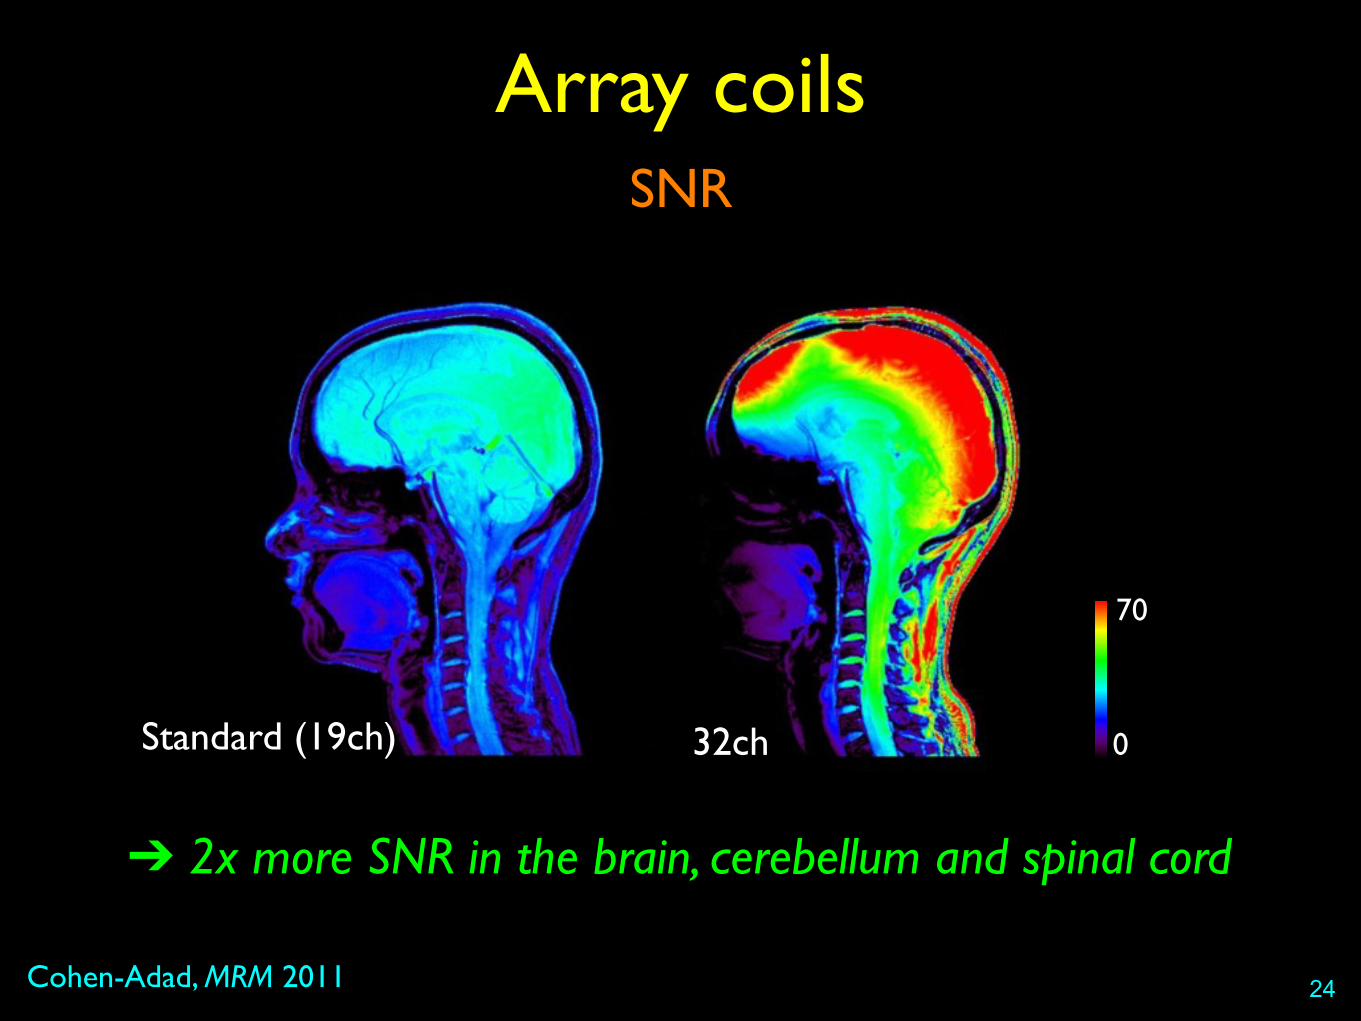
Cohen-Adad, MRM 2011
Array coils
24
32chStandard (19ch) 0
70
➔ 2x more SNR in the brain, cerebellum and spinal cord
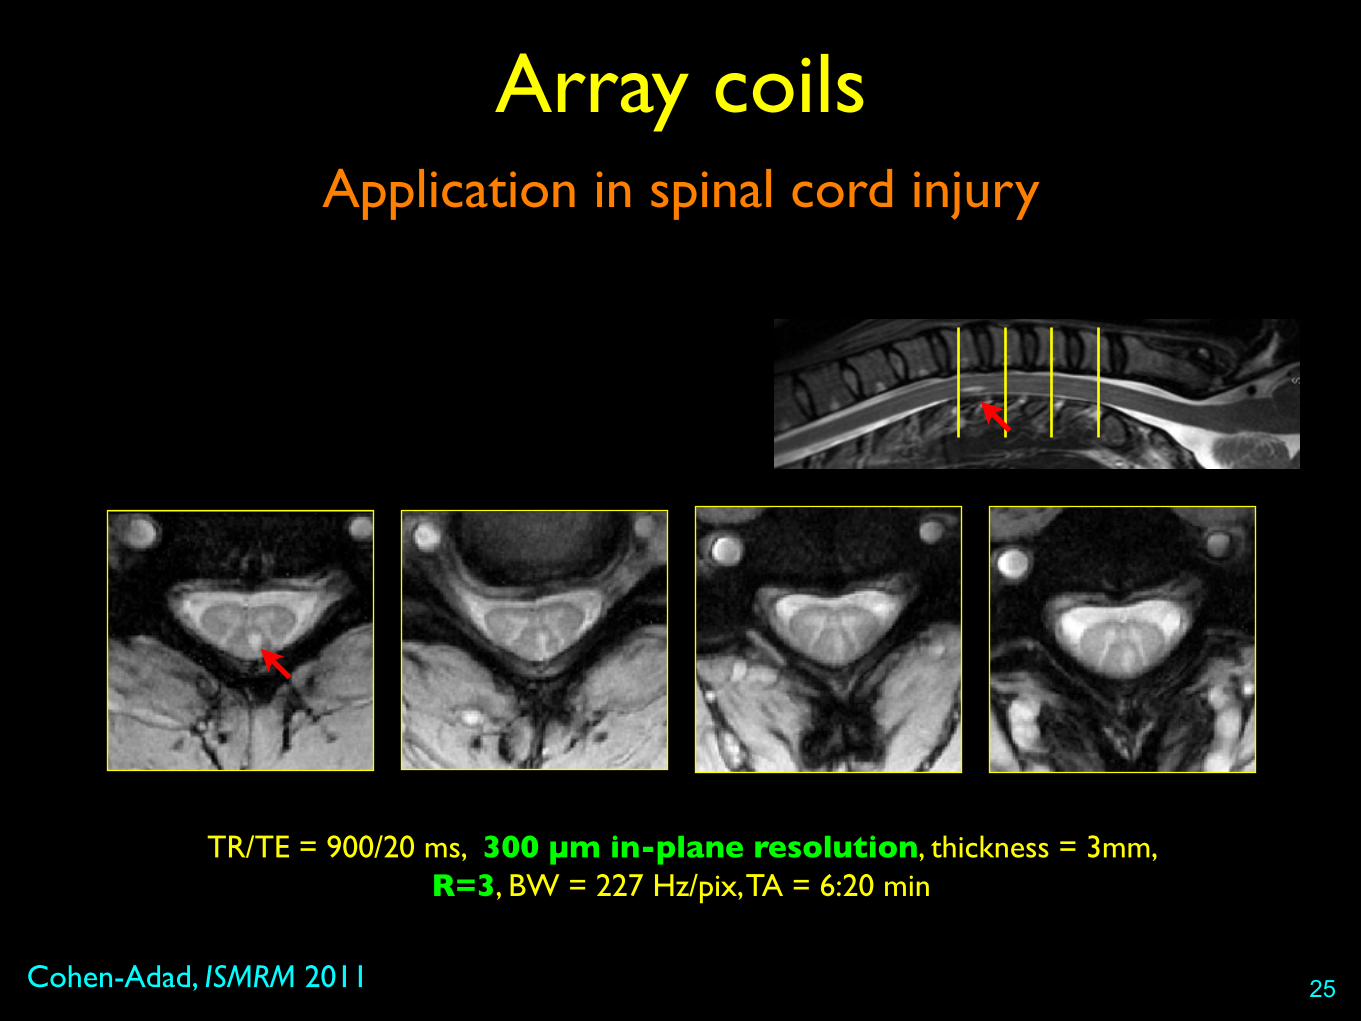
Application in spinal cord injury
Cohen-Adad, ISMRM 2011
Array coils
25
TR/TE = 900/20 ms, 300 µm in-plane resolution, thickness = 3mm, R=3, BW = 227 Hz/pix, TA = 6:20 min

Array coils
26
TR=14280 ms, TE=80 ms, resolution = 1.7x1.7x1.7 mm3, nbDir=30, b-value=800 s/mm2
R=1 R=2 R=3 R=4 Tractography
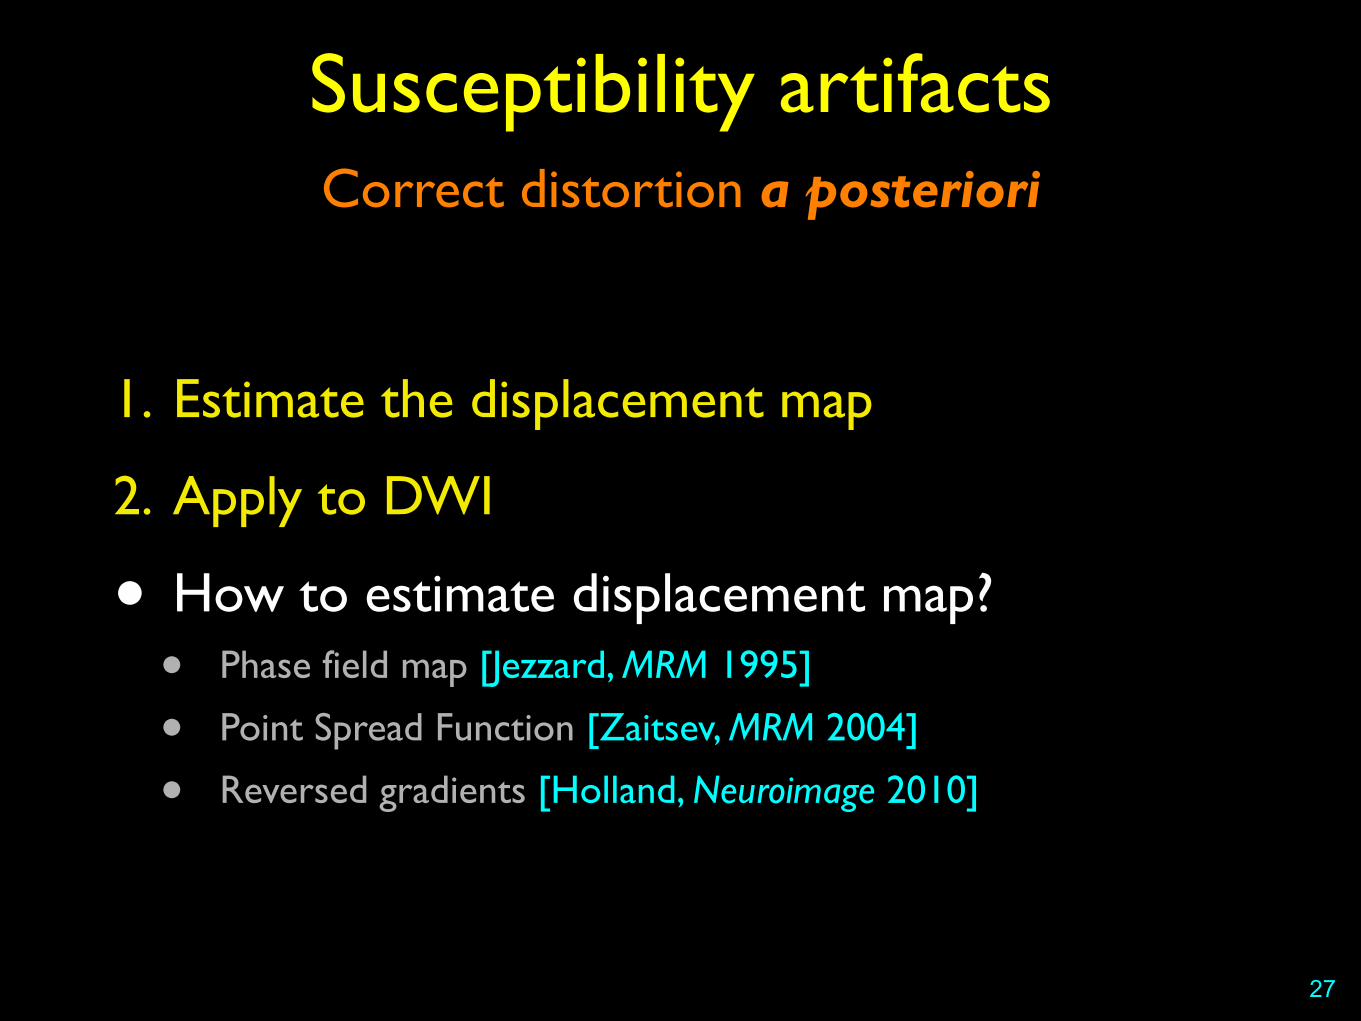
Correct distortion a posteriori
Susceptibility artifacts
27
1. Estimate the displacement map
2. Apply to DWI
• How to estimate displacement map?• Phase field map [Jezzard, MRM 1995]
• Point Spread Function [Zaitsev, MRM 2004]
• Reversed gradients [Holland, Neuroimage 2010]

Correct distortion a posteriori
Cohen-Adad, Neuroimage 2011
Susceptibility artifacts
28
TSEEPI+ EPI-
+
EPI+corr

Correct distortion a posteriori
Cohen-Adad, ISMRM’09
Susceptibility artifacts
29
Human spinal cord tractography (brainstem-seeded)
Application in SCI
Cohen-Adad, Neuroimage 2011
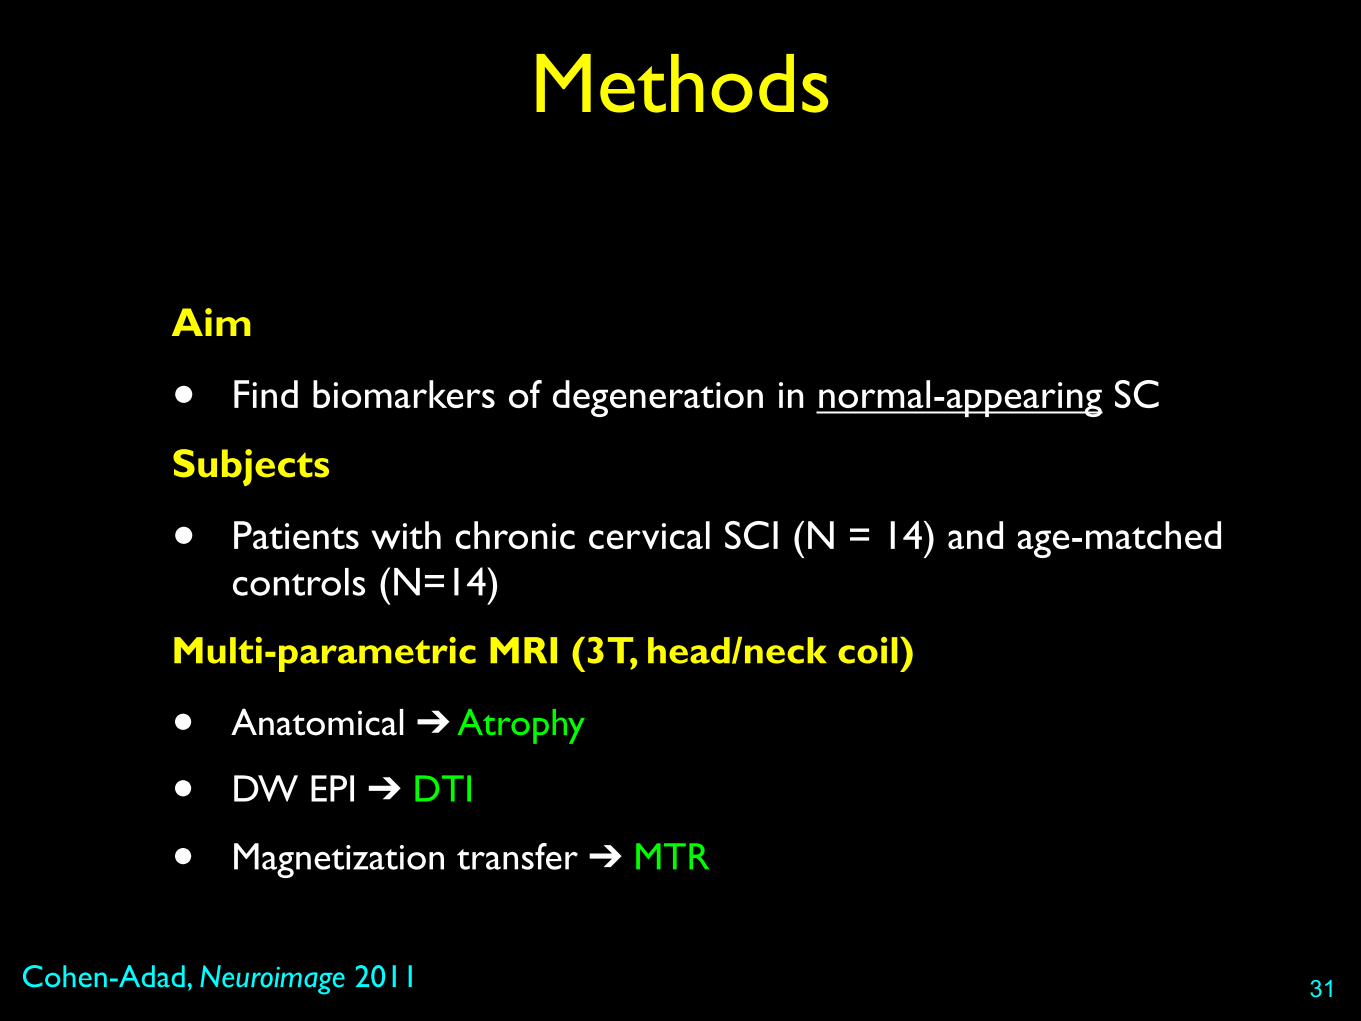
Methods
Aim
• Find biomarkers of degeneration in normal-appearing SC
Subjects
• Patients with chronic cervical SCI (N = 14) and age-matched controls (N=14)
Multi-parametric MRI (3T, head/neck coil)
• Anatomical ➔ Atrophy
• DW EPI ➔ DTI
• Magnetization transfer ➔ MTR
31
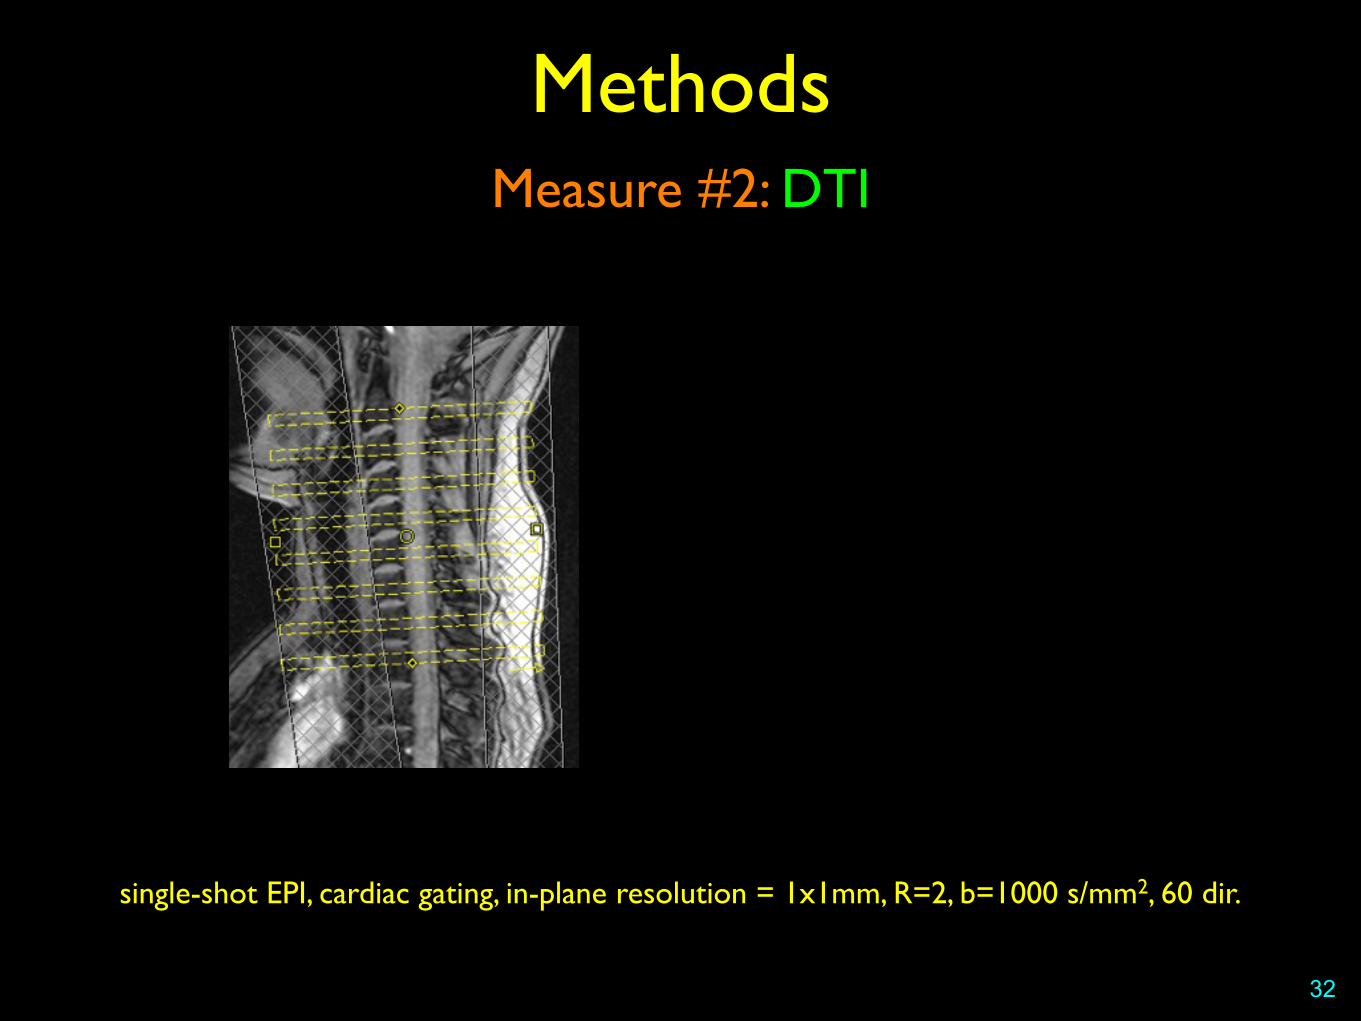
Measure #2: DTI
32
Methods
single-shot EPI, cardiac gating, in-plane resolution = 1x1mm, R=2, b=1000 s/mm2, 60 dir.
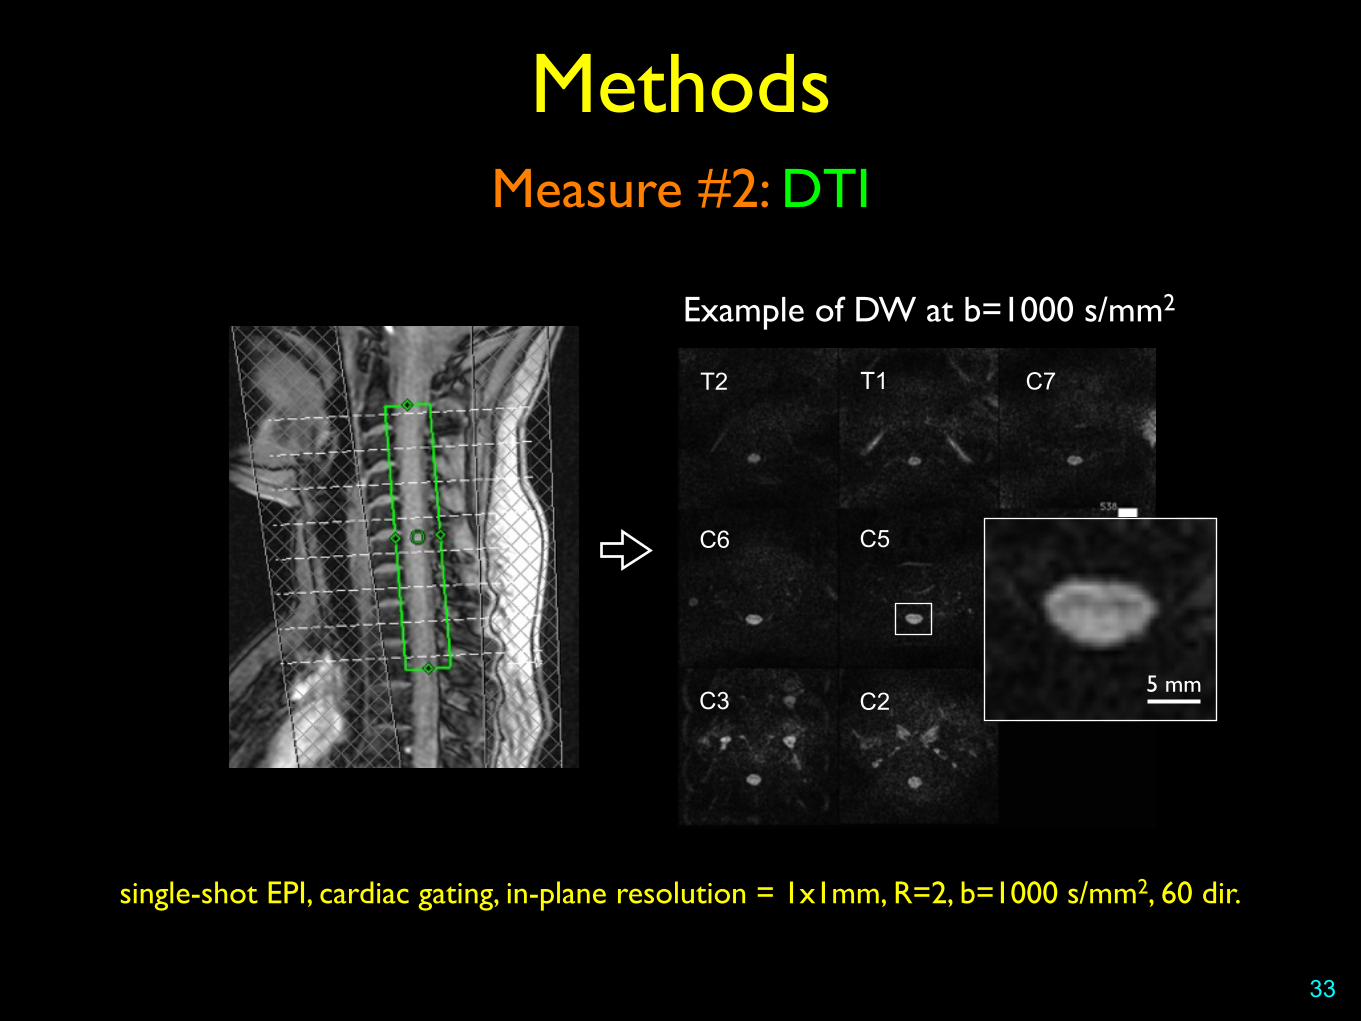
Measure #2: DTI
33
Methods
Example of DW at b=1000 s/mm2
C2C3
T2 T1 C7
C6 C5 C4
5 mm
single-shot EPI, cardiac gating, in-plane resolution = 1x1mm, R=2, b=1000 s/mm2, 60 dir.

Statistics
Methods
Manually-defined ROI in normal appearing tissue
34
Sensory pathwaysMotor pathways
Mean DWI T1-weighted
L R
D
V
Cohen-Adad, Neuroimage 2011
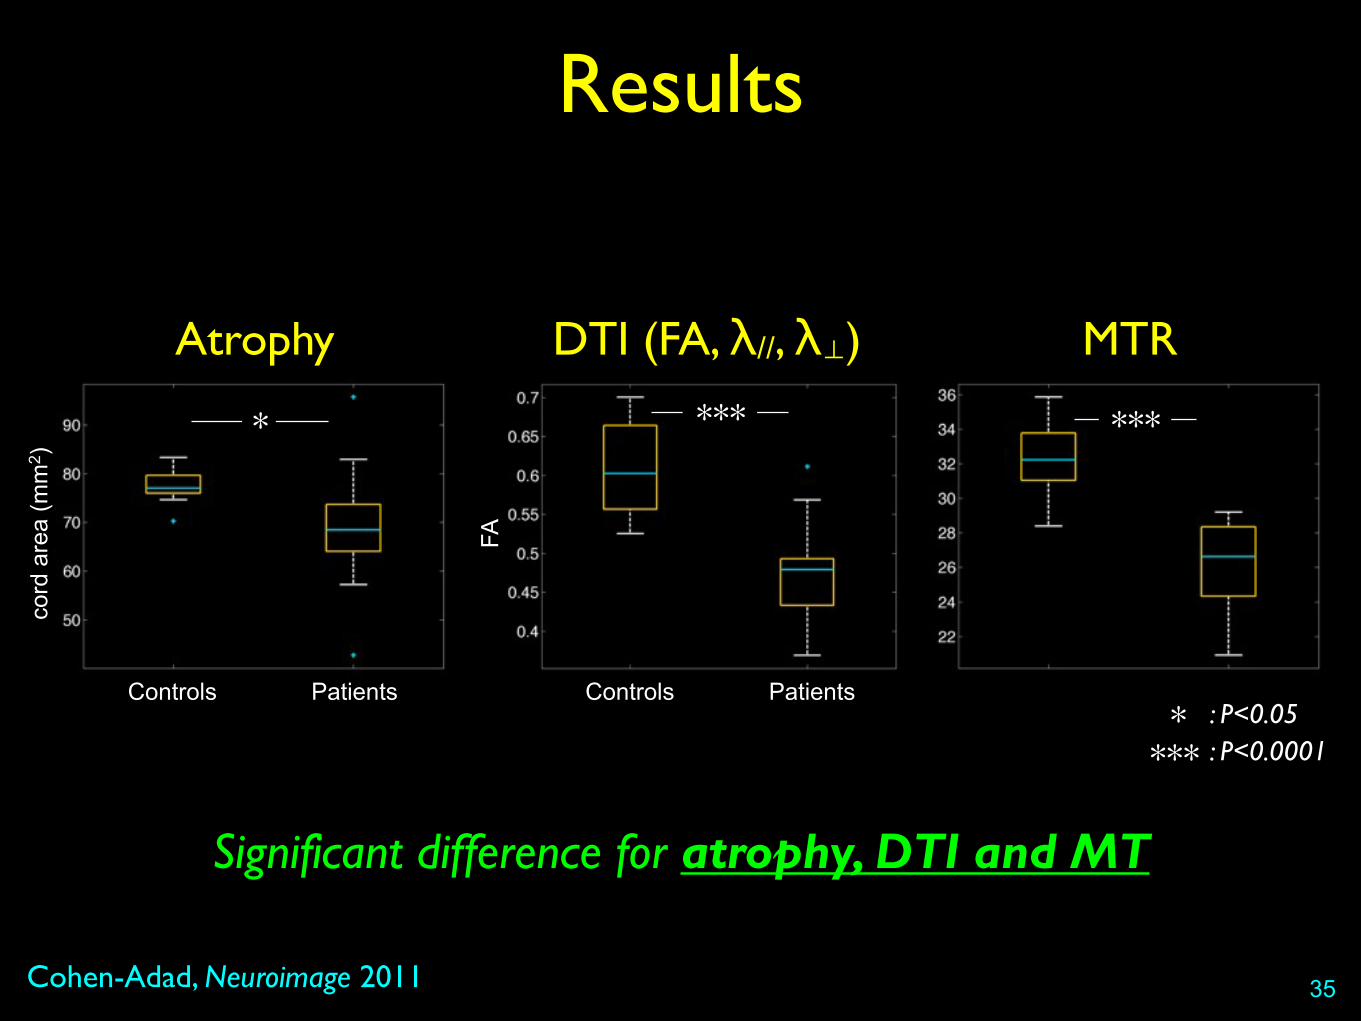
Results
35
Significant difference for atrophy, DTI and MT
*
Atrophy
***
MTR
: P<0.05*: P<0.0001***
Controls Patients
cord
are
a (m
m2 )
***
DTI (FA, λ//, λ⊥)
Controls Patients
FA
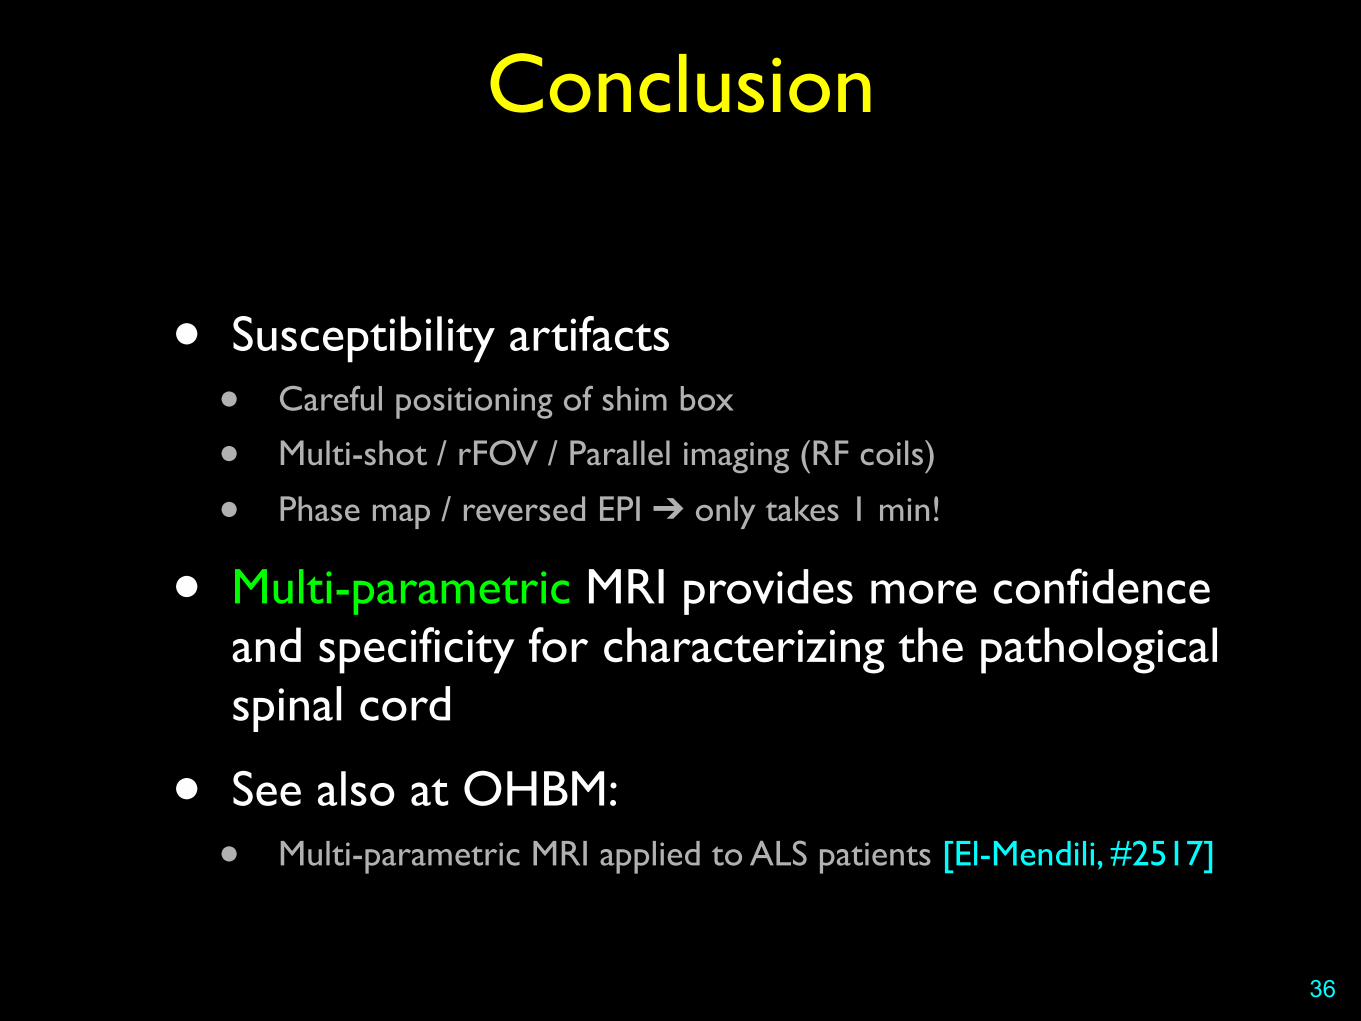
Conclusion
• Susceptibility artifacts• Careful positioning of shim box
• Multi-shot / rFOV / Parallel imaging (RF coils)
• Phase map / reversed EPI ➔ only takes 1 min!
• Multi-parametric MRI provides more confidence and specificity for characterizing the pathological spinal cord
• See also at OHBM:• Multi-parametric MRI applied to ALS patients [El-Mendili, #2517]
36

contact: [email protected]
Acknowledgments
Larry Wald
Jonathan Polimeni
Kawin Setsompop
Himanshu Bhat
Keith Heberlein
Habib Benali
Mounir El-Mendili
Pierre-François Pradat
Serge Rossignol
37
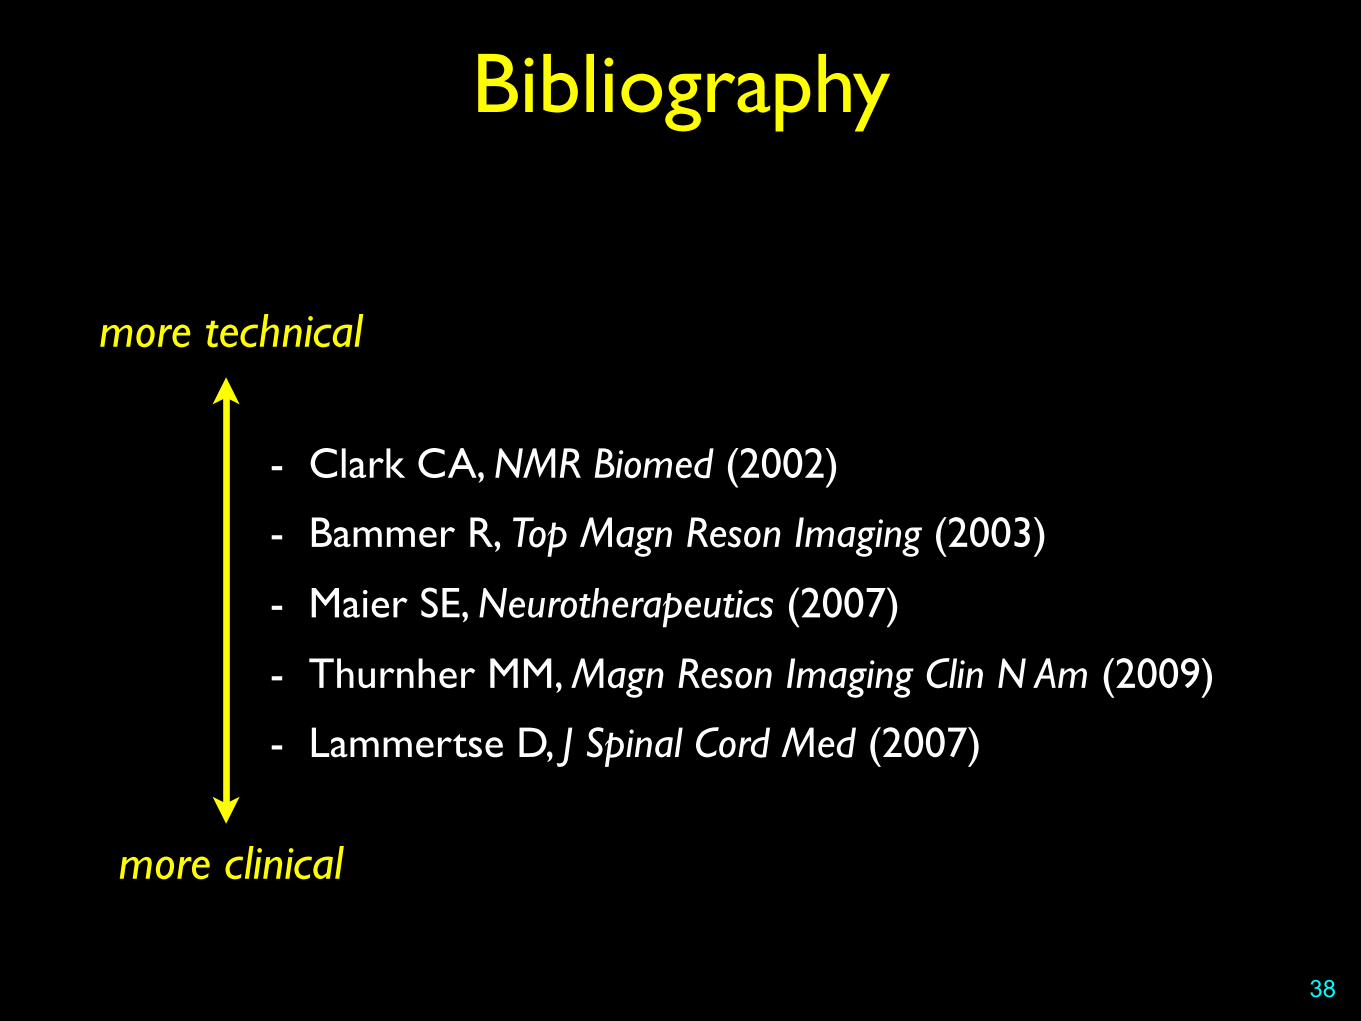
Bibliography
- Clark CA, NMR Biomed (2002)
- Bammer R, Top Magn Reson Imaging (2003)
- Maier SE, Neurotherapeutics (2007)
- Thurnher MM, Magn Reson Imaging Clin N Am (2009)
- Lammertse D, J Spinal Cord Med (2007)
38
more clinical
more technical