diffraction-limited polarimetry from the infrared imaging
TRANSCRIPT

838
Publications of the Astronomical Society of the Pacific, 118: 838–844, 2006 June� 2006. The Astronomical Society of the Pacific. All rights reserved. Printed in U.S.A.
Diffraction-limited Polarimetry from the Infrared Imaging Magnetographat Big Bear Solar Observatory
Wenda Cao,1,2 Ju Jing,1,2 Jun Ma,1 Yan Xu,1 Haimin Wang,1,2 and Philip R. Goode1,2
Received 2005 November 28; accepted 2006 April 26; published 2006 June 14
ABSTRACT. The Infrared Imaging Magnetograph (IRIM) system developed by Big Bear Solar Observatory(BBSO) has been put into preliminary operation. It is one of the first imaging spectropolarimeters working at1565 nm and is used for the observations of the Sun at its opacity minimum, exposing the deepest photosphericlayers. The tandem system, which includes a 4.2 nm interference filter, a unique 0.25 nm birefringent Lyot filter,and a Fabry-Pe´rot etalon, is capable of providing a bandpass as low as 0.01 nm in a telecentric configuration.A fixed quarter-wave plate and a nematic liquid crystal variable retarder are employed for analyzing the circularpolarization of the Zeeman components. The longitudinal magnetic field is measured for the highly Zeeman-sensitive Fei line at 1564.85 nm (Lande´ factor ). The polarimetric data were taken through a field of viewg p 3of ∼ and were recorded by a pixel, 14 bit HgCdTe CMOS focal plane array camera.′′ ′′145 # 145 1024# 1024Benefiting from the correlation tracking system and a newly developed adaptive optics system, the first imagingpolarimetric observations at 1565 nm were made at the diffraction limit on 2005 July 1 using BBSO’s 65 cmtelescope. After comparing the magnetograms from IRIM with those taken by the Michelson Doppler Imager onboardSOHO, it was found that all the magnetic features matched very well in both sets of magnetograms. Inaddition, StokesV profiles obtained from the Fabry-Pe´rot etalon scan data provide access to both the true magneticfield strength and the filling factor of the small-scale magnetic flux elements. In this paper, we present the design,fabrication, and calibration of IRIM, as well as the results of the first scientific observations.
1. INTRODUCTION
It has been widely accepted that the small-scale magneticfield concentrations rooted in the deepest layers of solar pho-tosphere play a crucial role in the physical processes drivingsolar activity and variability. Typical magnetic flux elementsare believed to exist in kilogauss-strength magnetic concentra-tions with a characteristic size of≤100 km at the base ofphotosphere (Rimmele 2004). The dynamic studies of theseflux concentrations require two-dimensional polarimetry withhigh magnetic sensitivity as well as high spatial and temporalresolution. As a result, two categories of spectropolarimetershave been developed and widely utilized for decades in theobservations of the visible wavelengths. The classical spectro-graph-based systems are capable of providing high spectralresolution. Since two-dimensional polarimetry is realized byscanning the image across the entrance slit of the spectrograph,these instruments are severely limited in spatial and temporalresolution. Filter-based systems typically offer better spatialresolution, while the moderate spectral resolution is the draw-back. However, due to recent advances in Fabry-Pe´rot inter-ferometer technologies, the spectral resolution of suchl/Dl
1 Center for Solar-Terrestrial Research, New Jersey Institute of Technology,323 Martin Luther King Boulevard, Newark, NJ 07102; [email protected].
2 Big Bear Solar Observatory, 40386 North Shore Lane, Big Bear City, CA92314.
tunable systems can also reach up to∼105–106. In the lastdecade, many Fabry-Pe´rot–based filter spectropolarimeters op-erating in the visible wavelength range (Mickey et al. 1996;Bonaccini & Stauffer 1990; Bendlin & Volkmer 1995; Kos-chinsky et al. 2001; von der Lu¨he 2000) have demonstratedtheir importance and bright future. Even so, it is relativelyunusual to acquire diffraction-limited observations of small-scale features with subarcsecond spatial resolution and highpolarization accuracy (Keller & von der Lu¨he 1992; Rimmele2004).
The near-infrared (NIR) provides a promising tool to probesmall-scale solar magnetic features, for the following reasons:(1) The Fried parameter, isoplanatic angle, and Greenwoodtime delay are all proportional to . The angular seeing at6/5l
1565 nm is at least 3 times better than in the visible, under thesame observational conditions. (2) Zeeman splitting is a func-tion of . Even a moderate magnetic field can cause full2gl Bline splitting in the NIR, allowing high-sensitivity measure-ments of the magnetic field. Meanwhile, the cross talk betweenthe StokesV and StokesQ or U components induced by obliquereflections on mirrors in the optical path are considerably sup-pressed in the NIR. (3) The opacity due to H� absorptionreaches its minimum at 1.6mm. Therefore, the deepest layersof photosphere can be probed by virtue of this opacity mini-mum. (4) The scattered light from both the atmosphere and thetelescope are extremely reduced in the NIR. The Near-Infrared
DIFFRACTION-LIMITED POLARIMETRY AT BBSO 839
2006 PASP,118:838–844
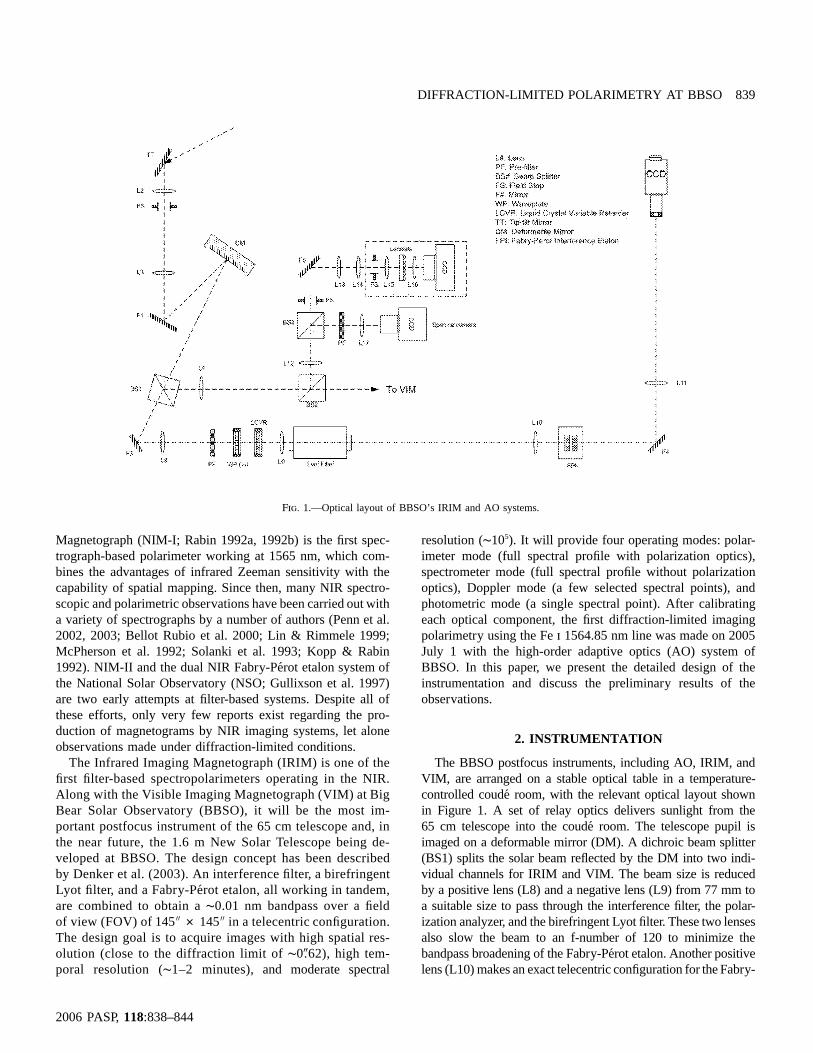
Fig. 1.—Optical layout of BBSO’s IRIM and AO systems.
Magnetograph (NIM-I; Rabin 1992a, 1992b) is the first spec-trograph-based polarimeter working at 1565 nm, which com-bines the advantages of infrared Zeeman sensitivity with thecapability of spatial mapping. Since then, many NIR spectro-scopic and polarimetric observations have been carried out witha variety of spectrographs by a number of authors (Penn et al.2002, 2003; Bellot Rubio et al. 2000; Lin & Rimmele 1999;McPherson et al. 1992; Solanki et al. 1993; Kopp & Rabin1992). NIM-II and the dual NIR Fabry-Pe´rot etalon system ofthe National Solar Observatory (NSO; Gullixson et al. 1997)are two early attempts at filter-based systems. Despite all ofthese efforts, only very few reports exist regarding the pro-duction of magnetograms by NIR imaging systems, let aloneobservations made under diffraction-limited conditions.
The Infrared Imaging Magnetograph (IRIM) is one of thefirst filter-based spectropolarimeters operating in the NIR.Along with the Visible Imaging Magnetograph (VIM) at BigBear Solar Observatory (BBSO), it will be the most im-portant postfocus instrument of the 65 cm telescope and, inthe near future, the 1.6 m New Solar Telescope being de-veloped at BBSO. The design concept has been describedby Denker et al. (2003). An interference filter, a birefringentLyot filter, and a Fabry-Pe´rot etalon, all working in tandem,are combined to obtain a∼0.01 nm bandpass over a fieldof view (FOV) of in a telecentric configuration.′′ ′′145 # 145The design goal is to acquire images with high spatial res-olution (close to the diffraction limit of∼0�.62), high tem-poral resolution (∼1–2 minutes), and moderate spectral
resolution (∼105). It will provide four operating modes: polar-imeter mode (full spectral profile with polarization optics),spectrometer mode (full spectral profile without polarizationoptics), Doppler mode (a few selected spectral points), andphotometric mode (a single spectral point). After calibratingeach optical component, the first diffraction-limited imagingpolarimetry using the Fei 1564.85 nm line was made on 2005July 1 with the high-order adaptive optics (AO) system ofBBSO. In this paper, we present the detailed design of theinstrumentation and discuss the preliminary results of theobservations.
2. INSTRUMENTATION
The BBSO postfocus instruments, including AO, IRIM, andVIM, are arranged on a stable optical table in a temperature-controlled coude´ room, with the relevant optical layout shownin Figure 1. A set of relay optics delivers sunlight from the65 cm telescope into the coude´ room. The telescope pupil isimaged on a deformable mirror (DM). A dichroic beam splitter(BS1) splits the solar beam reflected by the DM into two indi-vidual channels for IRIM and VIM. The beam size is reducedby a positive lens (L8) and a negative lens (L9) from 77 mm toa suitable size to pass through the interference filter, the polar-ization analyzer, and the birefringent Lyot filter. These two lensesalso slow the beam to an f-number of 120 to minimize thebandpass broadening of the Fabry-Pe´rot etalon. Another positivelens (L10) makes an exact telecentric configuration for the Fabry-

840 CAO ET AL.
2006 PASP,118:838–844
TABLE 1Characteristic Parameters of the
IRIM Fabry-Perot Etalon at 1565 nm
Parameter Value
Etalon Properties
Diameter . . . . . . . . . . . . . . . 70 mmRough spacing. . . . . . . . . 2226mmScanning range. . . . . . . . . 4.1mmReflection . . . . . . . . . . . . . . 95.3%Absorption . . . . . . . . . . . . . 0.27%Peak transmission. . . . . . 88.8%
Etalon Parameters
FSR . . . . . . . . . . . . . . . . . . . . . 0.55 nmBandpass. . . . . . . . . . . . . . . 8.8 pmFinesse . . . . . . . . . . . . . . . . . 62.8Flatness. . . . . . . . . . . . . . . . . l/127Roughness. . . . . . . . . . . . . . l/763Step scale. . . . . . . . . . . . . . 0.29 pm step�1
Perot etalon. An image with a FOV of is reimaged′′ ′′145 # 145onto the focal plane array (FPA) by lens L11.
The NIR detector is a HgCdTe CMOS FPA camera with aTCM8600 image sensor chip manufactured by Rockwell Scien-tific. The FPA is based on a liquid-nitrogen cooling system andhas pixels, a 100% filling factor, and a quantum1024# 1024efficiency≥50% in the NIR. Eight readout channels ensure a hightransfer speed. The characteristic evaluation shows that the max-imum transfer rate can reach up to 30 frames s�1 (Cao et al. 2005).The output signal is digitized into 14 bits, with a dynamic rangebetter than 70 dB. The pixel size is 18mm # 18 mm.
A 70 mm aperture ET70FS-1041 series II Fabry-Pe´rot etalonmanufactured by Queensgate Instruments, Ltd., is operated bya CS-100 controller (SN 8105) to acquire narrow bandpasstransmission and wavelength tunability. To eliminate the impactof fluctuations of ambient pressure, humidity, and temperature,as well as contamination by dust particles, the etalon is mountedin a sealed cell with two antireflection-coated windows. A glassreference capacitor is employed to improve stability in con-trolling the cavity spacing and etalon parallelism. Accordingto the manufacturer’s specifications, the cavity scanning rangeis larger than 4100 nm, and the reflectivity is over 94% inthe wavelength range from 1000 to 1600 nm. Some importantperformance parameters at 1565 nm have been evaluated andmeasured by using a He-Ne laser and a horizontal spectro-graph, respectively (Cao et al. 2004). The relevant charac-teristic parameters of IRIM Fabry-Pe´rot etalon are summa-rized in Table 1.
As shown in Table 1, the free spectral range (FSR) of theFabry-Pe´rot etalon (i.e., the distance between consecutive trans-mission peaks) is about 0.55 nm at 1565 nm. The birefringentLyot filter (Wang et al. 2000) was designed to be the order-sorting filter for the Fabry-Pe´rot etalon. Four stacks of calcitemodules sandwiched between linear polarizers are combinedto acquire a∼0.25 nm bandpass with a diameter of 37 mm.The wide-field configuration used in design tolerates up to a2� incidence angle. The nematic liquid crystal variable retarders(LCVRs) are attached to each stack and tune the bandpass ina range of�10 nm. To avoid a drift of the central bandpassdue to variation in the ambient temperature, the whole systemis enclosed in a thermal controller. The temperature is main-tained at 32�C, with a stability�0.1�C. The calibration andcharacteristic evaluations were performed by Cao et al. (2006)using the horizontal spectrograph at the NSO Evans Facilityat Sacramento Peak. The working voltages of four LCVRs foreach stack were determined at 1564.85 nm. The measuredFWHM and FSR are 0.246 and 3.975 nm, respectively. Themeasured transmission is about 15.9% for the unpolarizedbeam.
A NIR interference prefilter is used to isolate the transmis-sions from the sidelobe peaks of the birefringent Lyot filter.The transmission profile was measured with the main spectro-graph of the NSO McMath-Pierce Telescope at Kitt Peak. Theresult showed that this three-cavity interference filter provides
a bandpass with a FWHM of 4.22 nm, which is able to reducethe sidelobe contamination to a very low level (!1%).
A fixed l/4 wave plate, a LCVR, and a NIR linear polarizerconstitute the polarization analyzer for measuring the longi-tudinal magnetic field by using the high Zeeman sensitivity ofthe Fei 1564.85 nm line. Because the transmission axis of thefive NIR polarizers inside the birefringent Lyot filter are parallelto each other, the filter itself is also a linear polarizer. The fastaxis of the fixedl/4 wave plate and the LCVR are oriented at45� to the polarization axis of the birefringent Lyot filter. Theleft and right circular Zeeman components are converted toorthogonal states of linear polarization by the initial fixedl/4wave plate. The modulator uses a LCVR from MeadowlarkOptics, which is electrically switched between 0 andl/2. Oneof the components is blocked by the succeeding linear polarizer,allowing the selected image corresponding to orI � V I � Vin the emerging beam. The instrumental polarization of thetelescope and other reflecting surfaces has not been modeled;therefore, observations of StokesQ andU are not possible atthis time.
3. OBSERVATIONS
The correlation tracking (CT) system and high-order AOsystem developed jointly by NSO and BBSO have been putinto routine observation (Didkovsky et al. 2003; Rimmele2000; Rimmele et al. 2003). The CT system uses a 45 mmdiameter two-axis tip-tilt mirror with a resonance frequency ofaround 3.3 kHz and a tilt range of 25�. The AO system consistsof a 77 mm diameter DM with 97 actuators and a Shack-Hartmann wave-front sensor with 76 subapertures. Because ofatmospheric stability in the NIR, diffraction-limited polarim-etry is often achieved at BBSO over IRIM’s FOV in the NIR,while the effect of seeing-induced cross talk is significantlysuppressed.
On 2005 July 1, imaging polarimetric observations of NOAA

DIFFRACTION-LIMITED POLARIMETRY AT BBSO 841
2006 PASP,118:838–844
Fig. 2.—Left: Magnetogram of NOAA AR 10781 obtained with the BBSO IRIM at 16:02 UT on 2005 July 1. The FOV was .Right: Corresponding′′ ′′145 # 145image of active region NOAA 10781 taken at the same time. The bandpass is 0.01 nm at 1565 nm.
Active Region 10781 were first made with IRIM, using a com-bination of the CT and AO systems. The image scale was 0�.142pixel�1. The data were oversampled by a factor of 2.18 of thediffraction limit at 1565 nm for the BBSO’s 65 cm solar tele-scope. The alternating frames of left- and right-circularly po-larized images were acquired by switching the modulator from0 to l/2. These images were stored in separate memory buffersof the image acquisition system. A number of images wereadded in the respective buffers in order to achieve a sufficientlyhigh signal-to-noise ratio. Because of the high Zeeman sen-sitivity of the Fei line at 1564.85 nm, as little as a 40 frameintegration is capable of providing a polarization level of∼10�4.Each image is formed by differencing the above-mentionedcomponent pairs and dividing by their sum. The exposure timeis 200 ms for an individual frame. Therefore, each 40 frameintegrated StokesV image at each specific wavelength takesabout 20 s. Figure 2 shows a sample magnetogram and thecorresponding StokesI image of NOAA AR 10781 taken at16:02 UT.
Due to the different Zeeman splitting in distinct solar mag-netic features (such as sunspot umbrae, networks, or intra-networks), the corresponding magnetograms reveal differentsensitivities at different wavelengths in the same spectral line.It is necessary to search for the most sensitive wavelengthregion in the blue wing of the spectral line for different targets.Like the old BBSO videomagnetograph, the IRIM bandpasscan be fixed at the most sensitive wavelength for tracking rapidchanges of these magnetic features. On the other hand, StokesV profiles can be obtained by scanning magnetograms acrossthe line. These profiles provide the information needed to cal-culate the true magnetic field strength and the filling factor ofthe small-scale magnetic features. Hence, IRIM provides two
operating modes for acquiring magnetograms: the single-band-pass mode to monitor rapid magnetic changes, and the scanningmode to obtain the true field strengths.
4. RESULTS
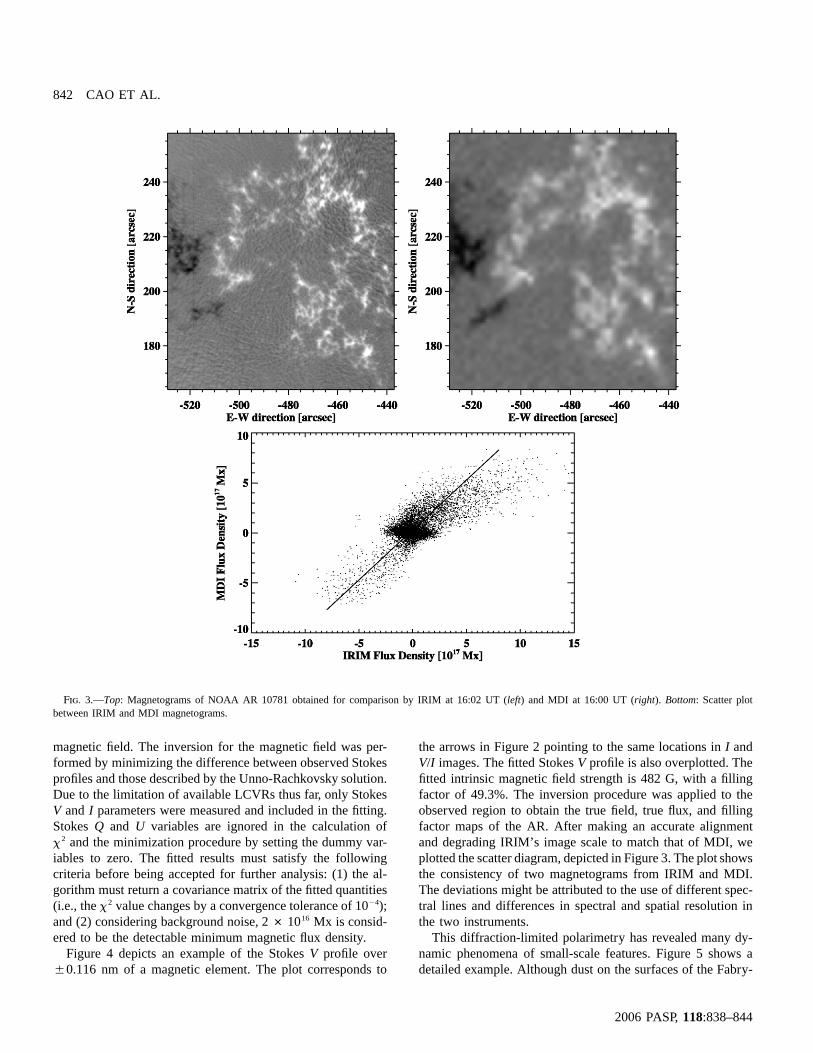
Spectropolarimetric observations of the aforementioned ac-tive region were carried out by tuning the Fabry-Pe´rot etalonfrom �0.116 nm (blue wing) to�0.116 nm (red wing) fromthe line center, in 5.8 pm steps. The most sensitive responsefor the network magnetic fields is found when the passband isblueshifted away from the Fei line center by 0.046 nm. Inorder to demonstrate the validity of the measurement, we com-pared our results with the correspondingSOHO MichelsonDoppler Imager (MDI) magnetograms. Figure 3 shows the MDImagnetogram of NOAA AR 10781 obtained at around the sametime. It is very clear that all the magnetic features matchedvery well in both of the magnetograms. Moreover, the mag-netogram from IRIM reveals the small-scale features with sub-arcsecond resolution.
After accurate alignment for each magnetogram at differentwavelengths, the StokesV profile for each resolution elementcan be constructed. This profile provides an input to measurethe true field strength and the filling factor. The inversion ofStokesV profiles for each magnetic element is based on theUnno-Rachkovsky theory. The analytic solution of the transferequation for polarized radiation for Stokes parameters in aMilne-Eddington atmosphere was first given by Unno (1956)and later by Rachkovsky, who added magneto-optical effects.We used an Unno fitting code in the SolarSoftWare package(stokesfit.pro, written by T. R. Metcalf), based on aniterative nonlinear least-squares algorithm to recover the input
842 CAO ET AL.
2006 PASP,118:838–844
Fig. 3.—Top: Magnetograms of NOAA AR 10781 obtained for comparison by IRIM at 16:02 UT (left) and MDI at 16:00 UT (right). Bottom: Scatter plotbetween IRIM and MDI magnetograms.
magnetic field. The inversion for the magnetic field was per-formed by minimizing the difference between observed Stokesprofiles and those described by the Unno-Rachkovsky solution.Due to the limitation of available LCVRs thus far, only StokesV and I parameters were measured and included in the fitting.StokesQ and U variables are ignored in the calculation of
and the minimization procedure by setting the dummy var-2x
iables to zero. The fitted results must satisfy the followingcriteria before being accepted for further analysis: (1) the al-gorithm must return a covariance matrix of the fitted quantities(i.e., the value changes by a convergence tolerance of 10�4);2x
and (2) considering background noise, Mx is consid-162 # 10ered to be the detectable minimum magnetic flux density.
Figure 4 depicts an example of the StokesV profile over�0.116 nm of a magnetic element. The plot corresponds to
the arrows in Figure 2 pointing to the same locations inI andimages. The fitted StokesV profile is also overplotted. TheV/I
fitted intrinsic magnetic field strength is 482 G, with a fillingfactor of 49.3%. The inversion procedure was applied to theobserved region to obtain the true field, true flux, and fillingfactor maps of the AR. After making an accurate alignmentand degrading IRIM’s image scale to match that of MDI, weplotted the scatter diagram, depicted in Figure 3. The plot showsthe consistency of two magnetograms from IRIM and MDI.The deviations might be attributed to the use of different spec-tral lines and differences in spectral and spatial resolution inthe two instruments.
This diffraction-limited polarimetry has revealed many dy-namic phenomena of small-scale features. Figure 5 shows adetailed example. Although dust on the surfaces of the Fabry-

DIFFRACTION-LIMITED POLARIMETRY AT BBSO 843
2006 PASP,118:838–844
Fig. 4.—StokesV profile of a small-scale feature indicated by arrows inFig. 2. The fitted intrinsic field strength is 482 G, with a filling factor of 49.3%,and the corresponding true magnetic flux is Mx.172.04# 10
Fig. 5.—Detailed views of small-scale features identified in Fig. 2.Left:StokesI image with a 0.01 nm bandpass at 1565 nm. The dust on the surfacesof the Fabry-Pe´rot etalon were not cleaned by the dark and flat-field corrections,because of the telecentric configuration.Right: Magnetogram taken at the sametime. The FOV is . Small pores (marked by p), magnetic knots (k),′′ ′′18 # 18magnetic elements without correspondence (u), and elongated magnetic struc-tures (e) are seen clearly, which demonstrates the polarimetry close to thediffraction limit of 65 cm telescope at 1565 nm.Perot etalon are difficult to clean using dark and flat-field cor-
rections because of the telecentric configuration, some small-scale magnetic features, such as small pores (marked p),magnetic knots (k), etc., are clearly identified in the StokesIand images in Figure 5. We also found two regions withV/Istrong magnetic fields (marked u), yet none corresponding tospecific features were discovered in theI image. This discrep-ancy was also observed by Keller (1995) and Wang et al.(1998). In addition, there is a type of small-scale magneticstructure of special interest (marked e). These features exist ina form of elongated magnetic structure along the dark inter-granular lanes, with a characteristic size of∼0�.5 # 2� and amagnetic field of∼150–300 G. We will explore the dynamicsof these features in more detail in subsequent observations.
5. SUMMARY
An imaging spectropolarimeter based on the Fabry-Pe´rotetalon has been designed, calibrated, and put into routine ob-servation of StokesV profiles at the 65 cm telescope at BBSO.This is the first working filter-based magnetograph system inthe NIR. The diffraction-limited polarimetry was achieved withthe assistance of CT and AO systems using the highly Zeeman-sensitive Fei line at 1564.85 nm. The comparison of IRIMmagnetograms with MDI data illustrates a good consistencybetween the two. The StokesV profile from rapid scanningacross the spectral line provides the ability to measure the true
field strength and filling factor using the Stokes inversionmethod. The preliminary data analysis demonstrates the ca-pability of IRIM to acquire high spatial and temporal resolu-tions and high Zeeman sensitivity data, which can be used toprobe the small-scale dynamic phenomena of the deepest ob-servable levels of the photosphere.
BBSO is building the 1.6 m off-axis New Solar Telescope(NST) to replace the existing telescope, which has a 65 cmaperture. The optical design to upgrade the IRIM to NST isunder way. Moreover, a new polarization analyzer system isbeing fabricated to measure StokesI, Q, U, andV. In the nearfuture, with the assistance of the NST and AO, the IRIM willoffer higher quality polarimetric data with a diffraction-limitedresolution (∼0�.25), high cadence (∼1 minute), and full Stokescomponents.
We acknowledge the contributions of C. Denker, J. Wang,K. Hartkorn, T. Spirock, and J. Nenow of BBSO/NJIT. Wewould also like to thank T. Rimmele at Sacramento Peak/NSOand W. Livingston at Kitt Peak/NSO for their help in the in-strument calibration. The authors are grateful to the referee forproviding valuable comments. Our work is supported by theNSF under grant ATM 03-42560 and NASA under grant NAS5-12782.
REFERENCES
Bellot Rubio, L. R., Collados, M., Ruiz Cobo, B., & Rodrı´guez Hi-dalgo, I. 2000, ApJ, 534, 989
Bendlin, C., & Volkmer, R. 1995, A&AS, 112, 371Bonaccini, D., & Stauffer, F. 1990, A&A, 229, 272Cao, W., Denker, C., Wang, H., Ma, J., Qu, M., Wang, J., & Goode,
P. R. 2004, Proc. SPIE, 5171, 307Cao, W., Xu, Y., Denker, C., & Wang, H. 2005, Proc. SPIE, 5881,
245Cao, W., Hartkorn, K., Ma, J., Xu, Y., Spirock, T., Wang, H., & Goode,
P. R. 2006, Sol. Phys., in press
Denker, C., Ma, J., Wang, J., Didkovsky, L., Varsik, J., Wang, H., &Goode, P. R. 2003, Proc. SPIE, 4853, 223
Didkovsky, L. V., et al. 2003, Proc. SPIE, 4853, 630Gullixson, C., Balasubramaniam, K. S., & Keil, S. 1997, BAAS, 29,
897Keller, C. U. 1995, Rev. Mod. Astron., 8, 27Keller, C. U., & von der Lu¨he, O. 1992, A&A, 261, 321Kopp, G. & Rabin, D. 1992, Sol. Phys., 141, 253Koschinsky, M., Kneer, F., & Hirzberger, J. 2001, A&A, 365, 588

844 CAO ET AL.
2006 PASP,118:838–844
Lin, H., & Rimmele, T. R. 1999, ApJ, 514, 448McPherson, M. R., Lin, H., & Kohn, J. R. 1992, Sol. Phys., 139, 255Mickey, D. L., Canfield, R. C., LaBonte, B. J., Leka, K. D., Waterson,
M. F., & Weber, H. M. 196, Sol. Phys., 168, 229Penn, M. J., Cao, W. D., Walton, S. R., Chapman, G. A., & Livingston,
W. 2003, Sol. Phys., 215, 87Penn, M. J., Ceja, J. A., Bell, E., Frye, G., & Linck, R. 2002, Sol.
Phys., 205, 53Rabin, D. 1992a, ApJ, 390, L103———. 1992b, ApJ, 391, 832
Rimmele, T. R. 2000, Proc. SPIE, 4007, 218———. 2004, ApJ, 604, 906Rimmele, T. R., et al. 2003, Proc. SPIE, 4839, 635Solanki, S. K., Walther, U., & Livingston, W. 1993, A&A, 277, 639Unno, W. 1956, PASJ, 8, 108von der Luhe, O., & Kentischer, T. J. 2000, A&AS, 146, 499Wang, J., Wang, H., Spirock, T. J., Lee, C. Y., Ravindra, N. M., Ma,
J., Goode, P. R., & Denker, C. 2000, Opt. Eng., 40, 1016Wang, H., et al. 1998, Sol. Phys., 183, 1