diffraction anomalous fine structure : . . a new technique ... · diffraction anomalous fine...
TRANSCRIPT

I :
- . . s-e
-
SLAC-PUB 6082 SLAC/SSRL 0017 -
MARCH 1993 (SSRL-M)
Diffraction Anomalous Fine Structure : . . A new technique for probing local atomic environment
Ingrid- J. Pickering’, Michael Sansone2, James Marsch2 and Graham N. George’ .
1. Stanford Linear Accelarator Center, Stanford Synchrotron Radiation Laboratory,
Stanford University, Stanford, CA 94309, USA
2. Exxon Research and Engineering Company, Route 22 East, Annandale, NJ 08801
(Submitted to the Journal of the American Chemical Society)
. -- G-- --
Work supported in part by the Department of Energy, Office of Health and Enviromental
Research, and the Department of Energy under Contract DE-ACO3-76SF00515

I
- Abstract: Diffraction anomalous fine structure (DAFS) is the fine structure in the inten-
- sity of an X-ray diffraction peak in the vicinity of an absorption edge. DAFS is measured by
monitoring the intensity of a diffraction peak as a function of the incident X-ray energy as it is
scanned through an absorption edge. It combines the short range structural sensitivity of X-ray
absorption spectroscopy with the long range periodicity of X-ray diffraction, and can provide
structural information which is not available from these techniques alone, or in combination.
We demonstrate the technique for several different dilute, polycrystalline samples, and present
an it&%ive data analysis method which allows the extraction of a specific X-ray absorbance
spectrum from the DAFS spectrum. We demonstrate the ability of DAFS to distinguish between
.” the local environments in each component of a physical mixture of two phases, and to separate
‘the contributions to the X-ray absorption spectrum of the tetrahedral and octahedral cobalt sites
in the spine1 Co304. Finally, we have used DAFS to study the polarized X-ray absorption spec-
tra from polycrystalline K2Ni(CN),.
2

I
-
- .- I-.-
-
- Intro&&ion
X-ray diffraction and X-ray absorption fine structure (XAFS) spectroscopy are both
well-established techniques for structural investigations of samples in the solid state. The XAFS
- can be divided into two components, the absorption edge-spectrum, also referred to as near-
edge X-ray absorption fine structure (NEXAFS), or X-ray absorption near-edge fine structure
(XANES), and the extended X-ray absorption fine structure (EXAFS). The edge spectra result
from-&ray induced transitions of the core-electron (e.g. a Is electron for a K-edge) to unoccu-
pied levels, and are thus very sensitive to electronic structure. The EXAFS results from scatter-
. . ing of an ejected core-electron by neighboring atoms, and is used to probe the local structure
-within a material. X-ray diffraction results from the coherent scattering of X-rays by an array of
atoms with longer range order. When the X-ray energy, E, is near an absorption edge of a con-
stituent atom, then the atomic scattering factor for X-rays, f, is comprised of a Thompson scat-
tering term, fo, plus an energy-dependent “anomalous” contribution; f = fo+f’(E)+if”(E). The _.- -
energy tunability of synchrotron radiation sources affords a convenient method of selectively
changing the scattering from component atoms, and this has been exploited in numerous crys- . . tallographic studies for crystal structure phasing e.g. the multiple wavelength anomalous disper-
sion (MAD) technique for phasing protein crystal structures [l]. The imaginary part of the
anomalous scattering factor f”(E) is simply proportional to the product of the X-ray absorption
cross-section and the X-ray energy, and f”(E) and f’(E) are interrelated by their mutual
Kramers-Kronig dispersion integrals (see below). It follows that the anomalous scattering is ex-
pected to contain structure analogous to the EXAFS and edge spectra, and this has been ob-
served experimentally in numerous studies [cf. 2,3]. X-ray absorption edges are highly sensitive
to oxidation state and electronic environment with corresponding changes in the X-ray anoma-
lous scattering. This has been used to study the valence distributions in several mixed-valence
materials e.g. Eu,O, [4], GaCl, [5], YB~$u~O~+~ [6], and Y3Fe501i and Y3Ga5012 [7]
_ (note that anomalous diffraction is also called resonant X-ray diffraction [3,6b]).
In the present work we investigate the detailed energy dependence of the fine struc- . -- ture o&lie anomalous diffraction for a number of powder materials. There have been numerous
early observations of such fine structure [e.g. 2,3,6,7,8], and the same physical phenomenon has
been given a variety of different appellations, including DIFFRAXAFS (diffraction-XAFS; by
Pickering et al. 9]), and BREFS (Bragg seflectivity extended fine structure, by Arcon et al. [3]).
3

I
-
- .- I-.-
- In an attemit to establish a common nomenclature, we have now adopted the nomenclature of
Stragier et al., who have suggested DAFS (diffraction _anomalous cme structure) [lo]. Arcon et - al. observed DAFS from a single crystal of copper sulfate, and showed that it contains structure
which is phase-shifted by 90” with respect to the EXAFS (ie. cosine instead of sine terms in the
EXAFS equation) [3]. Attfield has used DAFS of the (001) and (111) Bragg peaks to obtain site
resolved Cu K-edge X-ray absorption spectra of the high temperature superconductor
YBa2Cu306.27, although at rather limited energy resolution with only 14 data points in each
spec@um [7b]. Very recently, in an elegant study, Stragier et al. [lo] have reported a quantita-
tive theory, together with the DAFS of copper metal using the (111) and (222) reflections of a
. . 20008, thick Cu( 111) epitaxial film. Their theory confirms and extends the finding of Arcon et al. [3] that the DAFS is comprised of a sum of sine and cosine contributions, corresponding to
the fine structure of the f’(E) and f’(E) components, respectively. Stragier et al. [lo] have also
developed procedures for quantitative analysis of the DAFS oscillations, although a fore-
- -- knowledge of the crystal structure is required in order to determine the relative contributions of . _.. f”‘(E) and f’(E) to the fine structure. Additionally, a direct comparison of DAFS edge spectra
= - with X-ray’absorption edge spectra becomes quite problematic. The DAFS in the edge region
generally has a negative cusp shaped structure, with edge structure present as derivative-like
features, contrasting with the absorption spectrum, which has peaks corresponding to transitions
to bound states, and a step at the threshold energy.
There are several areas in which DAFS has important potential applications, and
these include (i) the separation of the XAFS from mixtures of crystalline compounds of un-
- known structure, (ii) site specific XAFS spectra from a single phase with more than one type of
a-given atom, and (iii) obtaining~polarized XAFS from powder samples. The goal of the present
work is to assess the utility of DAFS as a structural tool. To this end we have performed DAFS
studies of dilute powder samples for each of the three application areas outlined above (it is im-
portant to note that powder DAFS is experimentally somewhat more difficult than single crystal
DAFS, due to the much lower count rates in the powder case). We present an analysis method
which allows extraction of XAFS from the DAFS which does not depend upon a detailed . .- knowl%&e ofithe crystal structure. Finally, we will discuss potential applications of DAFS in
structural chemistry, materials science, and in biophysics.
4

I
-
- .- I-.-
. Expehmental
Sample Preparation. Unless otherwise stated, all materials were obtained from
the Aldrich Chemical Co. at the highest purity available, and were used without further purifi-
cation. Typical sample preparation involved grinding in an agate ball mill for 20 minutes, fol-
lowed by further grinding with a diluent compound for approximately 5 minutes. Around lOO-
200 mg of the resulting mixture was then pressed under approximately 10 tons pressure into a
20 mkrdiarneter disk, with a final thickness of about 0.4 mm. Ideal candidates for the diluent
material-combine a low X-ray absorption coefficient with good pressing characteristics. Various . . solids were tested, and two, the polymer polyvinylpolypyrrolidone (PVPP, Sigma) and lithium
carbonate, were used in the experiments described in this paper. Li,CO, forms somewhat frag-
ile disks, and although its sharp diffraction peaks can be used as a control for analysis methods
(see below), these may overlap a peak of interest. Away from its diffraction peaks, Li,CO, has
a very low scattered background. PVPP forms very robust disks of excellent quality, and has no _.- - sharp diffraction peaks, but does have a scattered background level which tends to add noise to
measurements of the lowest intensity peaks. A sample of K,Ni(CN), was synthesized accord-
ing to published procedures [ 111.
Data collection. DAFS data collection was carried out on beamline XlOC at the
National Synchrotron Light Source [12,13]. Either Si( 111) or Si(220) double crystal monochro-
mators were used, together with a downstream focusing mirror positioned to reject higher order
- reflections from the monochromator. Figure 1 shows a schematic diagram of the equipment,
- which involves elements of both powder X-ray diffraction and XAFS experiments. The relevant
experimental components in the path of the X-ray beam were as follows. Collimating slits set at
5mm were used to horizontally define the X-ray beam, followed by a beam position monitor
and vertical collimating slits set at ca. 0.5 mm. The beam position monitor.(a position sensitive
_ ion chamber) was coupled via a feed-back loop to a piezoelectric transducer controlling the tilt
angle of an upstream focusing mirror [14] so as to remove small X-ray beam movements, and
-maintain a constant position of the beam entering the experiment. This was followed by an __’ .A
evacuakd flight path, and then a further set of horizontal and vertical collimating slits to reject
scattered radiation. An incident beam (lo) monitor (either a sodium iodide scintillation detector
or an ion chamber) was placed immediately following the scatter slits. Samples were mounted

I
- - . . n-a
Y -
- on a flat -aluminum plate having a central hole to allow passage of the transmitted X-ray beam,
- and were aligned at the center of the 8 circle of a Z-circle diffractometer. A 12” nitrogen-filled
ion chamber was placed after the sample to detect the beam intensity transmitted by the sample
(1,) as in a conventional transmittance XAFS experiment. Linearities of the lo and II detectors
- were measured by scanning the X-ray energy over the range of interest, before insertion of the
sample, and appropriate corrections applied so as to obtain the true sample absorbance. An en-
ergy dispersive SiLi detector (EC&G Ortec) was mounted on the 28 arm of the diffractometer
to measure the scattered intensity Id, and the fluorescent intensity If. The light incident on this
detector -was apertured by two sets of slits (see Figure l), typically set at 0.5n-m vertical and
. . 6mm horizontal. The distance from the sample to the SiLi detector was about 39cm. The output
of the SiLi detector was fed via a Gaussian shaping amplifier to single channel analyzers which
-were used to select counts of photons in the desired energy range. The linearity of the energy
dispersive detector was checked by scanning the offset of one of the monochromator crystals so
--as to provide a variation in incident beam intensity, and the detector was found in all cases to be . ̂ operating in the pseudo-linear regime, with insignificant losses due to electronic dead times.
- . _
Data collection was carried out on a Digital Equipment Corporation micro-VAX Il
computer using specially developed software. Data reduction and analysis were carried out
either on the beamline computer, a VAX 8350 computer at Exxon Research and Engineering, or
on VAXstation 4000 computers at SSRL. Figure 2A illustrates the data collection procedure for
a 5wt.% sample of KMnO, in lithium carbonate. At each energy point a small 0-28 scan was
- carried out to collect the diffraction peak profile, with the midpoint of the scan defined by the
- X-ray energy and the d-spacing of the Bragg peak of interest. The X-ray energy was incre-
mented as for a typical XAFS scan, with the O-28 diffractometer position tracking the peak cen-
troid. In general, sufficient data points were collected to obtain a diffraction peak profile (cu.
15-21 points, see Figure 2A). The voltage range of single channel analyzer -used to monitor the
elastic scatter signal from the energy dispersive detector was controlled by the computer so as
to follow the motions of the monochromator (and thus the energy of the elastically scattered ra-
diation) during data collection. Good detector energy resolution was found to be important in . -- order t&&ject’the bulk of the X-ray fluorescence, and an amplifier shaping time of 2 psec was
used. The integrated intensity of the diffraction peak was obtained by fitting each individual 8-
28 scan with a pseudo-Voigt peak-shape, together with a low order polynomial to remove back-
6

-
- .- I- .-
- g r o u n d s ignal . T h e latter w a s p r e d o m i n a n tly K P flu o r e s c e n c e a d m i tte d to th e s ing le c h a n n e l
ana lyzer elast ic scatter w i n d o w d u e to th e e n e r g y reso lu t ion o f th e d e tector.
A n g u lar a n d abso rp tio n correct ions o f d iffrac te d intensity. T h e scat tered
intensi ty Id , norma l i zed by th e inc ident b e a m intensi ty IO , m u s t first b e cor rec ted fo r th e bu lk
a b s o r p tio n e ffects, wh ich a re dist inct f rom th e D A F S osci l la t ions [9 ]. T h e a b s o r b a n c e A o f a
s a m p l e o f pe rpend icu la r th ickness t a t a n g l e 8 is g i ven by A = log( l~J1)= l . tMne w h e r e p , is th e
bu lk -absorp t ion c o e fficient. T h e a b s o r p tio n a tte n u a tio n o f a di f f racted b e a m d u e to a th in p la te _
o f s a m p l e in th e 8 - 2 8 g e o m e try is s imply p ropor t iona l to D=( l -e -2A) /As ine , w h e r e A is th e ab -
s o r b a n c e o f th e p la te s imu l taneous ly m e a s u r e d as desc r ibed a b o v e [9 ]. It w a s fo u n d expe r imen- . . ta l ly th a t o p tim u m s igna l to no i se w a s o b ta i n e d w h e n th e s a m p l e a b s o r b a n c e a t ene rg ies just
a b o v e th e X -ray a b s o r p tio n e d g e w a s o f th e o rde r o f unity. Thus, th e o p tim u m s a m p l e p a th
. l e n g th fo r t ransmi t tance X A S [cJ 1 5 1 is a lso o p tim a l fo r D A F S .
_ .~ The- intensi ty o f th e di f f racted b e a m wil l a l so b e a ffec ted by th e L o r e n tz factor,
L = 2 s i n < B c o & ; th e b e a m is c lose to 1 0 0 % p l a n e po la r i zed in th e hor izonta l p l a n e a n d th e r e fore, - wi th u & v a t-d ref lect ing g e o m e try, n o po lar iza t ion cor rect ion is requ i red . T h u s th e di f f racted in-
tensi ty c a n b e conver ted to o b ta in a q u a n tity p ropor t iona l to th e s q u a r e o f th e structure factor by
m u l tip ly ing by L ID. F igure 2 B s h o w s th e uncor rec ted D A F S spect rum, to g e the r wi th th e
L o r e n tz -absorbance cor rec ted D A F S spec t rum ( s u b s e q u e n tly re fer red to as th e “raw” D A F S
spec t rum) a n d th e a b s o r b a n c e fo r th e 5 w t.% K M n O , s a m p l e o f F igure 2 A .
Theo ry a n d d a ta a n a lysis
D A F S theory . W h e n a n X -ray p h o to n interacts wi th a n a to m , o n e o f severa l
th ings c a n h a p p e n ; th e p h o to n c a n b e elast ical ly scat tered ( T h o m p s o n scatter ing), o r it c a n b e
inelast ical ly scat tered (e.g. C o m p to n scat ter ing, R a m a n scatter ing). If th e e n e r g y o f th e inc ident
. X -ray is in th e vicini ty o f a n a b s o r p tio n e d g e , th e n th e p h o to n c a n a d d i tiona l l y b e a b s o r b e d , o r
c a n u n d e r g o o the r inelast ic scat ter ing p rocesses such as r e s o n a n t R a m a n X -ray scat ter ing [1 6 ].
- In th is work w e a re c o n c e r n e d on ly wi th th e c o h e r e n t elast ic scat ter ing, wh ich is k n o w n as .--- _ B r a g g - g a tte r m g . A s m e n tio n e d a b o v e , th e e n e r g y d e p e n d e n t par t o f th e c o h e r e n t elast ic scatter-
i ng is g i ven by th e so-ca l led a n o m a l o u s correct ion.
T h e D A F S spec t rum inc ludes c o n tr ibut ions f rom b o th f’(E) a n d f”(E) in vary ing
7

I
- proportions depending upon both the crystal structure, and the specific diffraction peak meas-
ured. There are therefore difficulties in a detailed interpretation of spectral features without fur- -
ther analysis. In order to conveniently obtain quantitative information from the spectrum, we
have developed computer software to extract the pure f’(E) contribution from the DAFS spec-
- trum which can be converted into any’(E) function, and thence into a site-specific absorbance.
The method requires no a priori knowledge of the crystal structure, and therefore can be ap-
plied to a wide variety of problems.
The intensity of a diffraction peak is proportional to IFI2 where F is the structure
factor of the diffraction peak, which is given, assuming site occupancies to be unity, by: . .
(1)
-- where +r is the phase factor. [17] of an individual atom for the specific diffraction peak,f, is the _.- atomic scattering factor for atom r, and the summation is over all atoms in the unit cell. If we
- - neglect temperature factors for brevity [18], the atomic scattering factor can be expressed as:
f(E) = fo + f ‘(E) + v”(E) (2)
where f’(E) and f”(E) are the real and imaginary contributions to the anomalous scattering of
the atom, which becomes significant in the vicinity of an absorption edge of the atom. The
imaginary part of the anomalous scattering factor,r’cE), is proportional to the X-ray absorption
cross section o(E) multiplied by the photon energy, E, andf’(E) andf”(E) are related by their
mutual Kramers-Kronig relationships:
f% > =
f’(E,) = ; s
“.ea (J &-E2)
(3)
(4)

f “(Q =-3 s O3 f’cE) dE ,, C&E’)
(5) -
Here, m is the rest mass of the electron and c, e and h have their usual meanings. It can be
shown that the diffracted peak intensity is simply proportional to:
with:
_. B = Cfo;rSh (b@r) ..~ - r
(6)
a = C cos (2Z@,) m
B = C Sin (&#rn) m
- where Ar -is the sum over all anomalous atoms in the unit cell. A and B are the real and irnagi-
nary components of the structure factor in the absence of anomalous effects and are energy-
independent. a and p, also energy-independent, are simply the sums of the sine and cosines of
the phases of the anomalous atoms, respectively [19].
In the case of a centrosymmetric unit cell, sine terms cancel throughout and B and p
are zero. Equation-6 therefore reduces to an equation with only two coefficients: .-
IFI2 = A2 + -2aAf, ‘(E) + a2 ‘(Q2 + fm “@J2
Equation 7 is general for several distinct anomalous atoms in a centrosymmetric cell. In this
general case, fm ‘(0 = $xaifi I(E) and f,“(E) = kxaifi”(E), where a = C ai and the i i i .-
sum is over each distinct type of anomalous atom. Thus for more than one type of anomalous
. atom [email protected], the final fm ‘(E) (and hence absorbance) is a mean value weighted according
to the phases of the constituent atoms. This weighting varies between diffraction peaks, and
also is different from the weighting of components for the bulk absorbance, and therefore a
combination of observations may be used to deconvolute the contributions from different at-
9

- .- *-.-
- oms. In the case that there is only one crystahographically distinct atom contributing to a par-
ticular Bragg peak, then the final fm “(E) is for that atom alone and the final absorbance ex- -
tracted is for that single component.
A set of predictive computer programs were written, based on the theory described
above, and using theoretical [20] or XAFS-derived model compound values forf’(E) andf”(E).
These allow prediction of the size of the DAFS, and the contribution from discrete sites, for any
- known-structure, and hence assist in the choice of the diffraction peak for study. The predicted
effects agreed excellently with the experimental measurements (below), confirming that the
programs were performing accurately. The size of the predicted DAFS varies considerably from
reflection to reflection, and both cusp-shaped (positive peak) or, more commonly, inverted
cusp-shaped curves can occur. Often small, seemingly insignificant, diffraction peaks have very
large DAFS, making them the best candidates for study.
- ..~ - Extraction of XAFS from the DAFS spectrum. In all the systems studied
in this paper, centrosymmetric unit cells have been used, and we will now restrict our discus- f sions to this-case. Equation 7 is solved iteratively to obtain the functions f,‘(E) andfm “(E), in the following way. Initial estimates for fm ‘(15) and fm ‘(E) are obtained from Cromer-Liberman
theory [20], and are used to estimate the ratio WA plus a linear scaling function by fitting equa-
tion 7 to the ends of the data, excluding the highly structured region near the absorption edge,
using non-linear regression techniques. Note that the absolute values of A and a are not ob-
_ tained by this method. Equation 7 is then solved for the function f,‘(E), from which fm”(E) is = _ readily obtained by Kramers-Kronig transformation. These new estimates for fm ‘(E) and fm “(E)
are then used to obtain new estimates for A and a, and the procedure repeated until the residual
between calculated (from Equation 7) and experimental curves approaches a minimum. The
function f,,, “(E) can easily be converted into absorption coefficient using Equation 3. The cycle
described above can also be carried out by solving for f,“(E) and transforming to obtain a new
- f,‘(E). The XAFS spectrum obtained using this method can then be analyzed using all the fa-
miliar tools and programs that are available for XAFS analysis. The results of this procedure are
* alust%& in Figure 3 for the -0, sample of Figure 2. Figure 3A shows the f’(E) and f”(E) I functions as extracted using the iterative procedure, and Figure 3B the corresponding DAFS-
extracted XAFS, together with the XAFS. A value for the ratio alA of 0.04 was estimated from
the extraction procedure for the KMnO, (211) DAFS, which agrees well with the value of 0.03
10

I :
I estimated from the crystal structure. The excellent correspondence of the two spectra in Figure
3B demonstrate that the procedure is working correctly. This method can readily be extended to -
non-centrosymmetric structures by using a greater number of refinable coefficients (see 19).
It should be noted that the effectiveness of this procedure pivots upon having a fast
and accurate procedure for performing Kramers-Kronig integrals. We adopted the method of
Templeton and Templeton [21] in which the smooth theoretical curve [20] (appropriately con-
voluted with a broadening function) for f”(E) (or f’(E)) is subtracted from the data to obtain a ; -- fine structure function 6$“(E). 6f”(E) tends to zero outside the range of the data and therefore
the integral in Equation 4 (and 5) needs only to be evaluated over the limits of the data. For
most calculations we used a fast Fourier transform method [22] to evaluate the Kramers-Kronig
integral (Equations 4, 5) (note that an accurate scale factor is important for this method to be
effective). The resulting scattering factor fine structure 6f’(E) can then be combined with the
theory f’(E) to calculate the total value. In earlier analyses, we extrapolated the experimental
data with theory to span a total range from 10eV to 200,00OeV, and evaluated the Kramers-
Kronig inte.gral over this range. No significant difference, other than speed of computation, be-
tween the two methods was found. The later routine was tested by repeatedly transforming a
test data set (calculated from an XAFS spectrum of KMnO,) betweenf’andf, and comparing
the end result with the original. Only a marginal broadening of sharp spectral features was ob-
served after fifty cycles of Kramers-Kronig transforms.
Polarization in DAFS. The plane-polarized nature of a synchrotron X-ray beam .- _ is now frequently exploited in XAFS to probe directionality within a single crystal. Typically,
the angle between the X-ray electric field vector, or e-vector, and a unique molecular direction
within the crystal is varied, and the responses of various spectral features are determined. Al-
though powders which have been oriented by dint of a preferred crystallite morphology or other
phenomenon may also yield directional information through XAFS, a randomly oriented pow-
. der cannot, by definition, give directional information in XAFS, since the crystallites have a
random spatial distribution with respect to the e-vector. However, in a random powder sample
. diffrac@-g an incident, plane-polarized X-ray beam, those crystallites which are in the correct
orientation for diffraction do have a spatial relationship with the e-vector of the incident beam.
In the case of upward-reflecting geometry the e-vector is always normal to the plane containing
the incident X-ray beam, the diffracted beam and the normal to the hkl plane, i.e. the e-vector
11

-
- .- I- .-
- wi l l a lways Iie wi th in th e hkl p l a n e o f th e B r a g g ref lect ion. For a g i ven ref lect ion, c o n tr ibut ions
to th e D A F S wil l th e r e fo re b e a n a v e r a g e o f a l l poss ib le or ienta t ions o f th e e-vector wi th in th e
hkl p l a n e , b u t wi th n o c o n tr ibut ion f rom or ienta t ions o f th e e-vector a w a y f rom th e p l a n e . For
th e d ipo le -a l l owed t ransi t ions wh ich c o n tr ibute th e ma jo r fe a tu res o f X -ray a b s o r p tio n K - e d g e
- spectra, th e t ransi t ion intensi ty Iv is p ropor t iona l to th e s q u a r e o f th e d ipo le m a trix e l e m e n t
Ijf O c I ‘w ,l e * r I v i> I 2 = c o s 2 0 I “v,I r lw i> 1 2 , w h e r e 0 is th e a n g l e b e tween th e e-vector a n d
th e t ransi t ion d ipo le vector r (e.g. th e th e ax is o f ap-orb i ta l fo r a ls+ n p t ransi t ion) . E x p r e s s e d
-re lat i~to th e p o w d e r intensity, th e t ransi t ion intensi ty is s imply g i ven by 3 c o s 2 0 ( the a v e r a g e
o f 3 c o s 2 0 over a s p h e r e is unity). S imi lar ly, fo r K - e d g e E X A F S in th e p l a n e w a v e app rox ima-
. . tio n , th e or ienta t ion d e p e n d e n c e o f backscat ter ing amp l i t ude is a lso g i ven by 3 ~ 0 ~ ~ 0 , a n d in
th is case 0 is th e a n g l e b e tween th e e-vector a n d th e absorber -backscat te rer (a-b) vector. In
b o th cases th e p o w d e r a v e r a g e d amp l i t ude is unity. For po la r i zed D A F S o f K - e d g e spect ra it is
s imp le to s h o w th a t th e amp l i t ude is p ropor t iona l to (3s in2Q/2, w h e r e 5 is th e a n g l e b e tween th e
- - t ransi t ion d ipo le vector (or a lb vector) a n d th e n o r m a l to th e hkl p l a n e . Thus, th e m a x i m u m en - ^ _ .~ - h a n c e m e n t o f a t ransi t ion re lat ive to th e p o w d e r case is 3 /2 a n d occurs wi th th e t ransi t ion vector
in th e hk i -p lane, ie. c=90° , a n d l ikewise th e m a x i m u m suppress ion is ze ro w h e n < = O ’. If th e r e is
m o r e th a n o n e t ransi t ion vector or ienta t ion in a uni t cel l , o r w h e n th e m u l tipl ici ty o f th e p o w d e r
di f f ract ion p e a k is g r e a te r th a n uni ty ( see Resul ts sect ion, be low) , th e n th e to ta l or ienta t ion de -
p e n d e n c e wil l s imply b e th e a v e r a g e o f th e d e p e n d e n c i e s fo r th e ind iv idua l vectors. A n e x a m p l e
o f th e fo r m e r w o u l d b e fo r di f ferent ly o r ien ted mo lecu les wi th in th e uni t cel l .
.- E X A F S a n a lysis. T h e E X A F S osci l la t ions x(k) w e r e a n a l y z e d us ing th e ap -
-p rox imate e q u a tio n :
x(k) C L n N fqkR 4 c i= l
m 2 ’ exp(~)exp(-Zo:k : )s~[2kRi+m(k.Ri ) ] (8)
H e r e , k is th e p h o toe lec t ron w a v e n u m b e r , Rj, ozi a n d Nj a re th e absorber -backscat te rer d is-
ta n c e , m e a n s q u a r e dev ia t ion in Rj (no te th a t th is is dist inct f rom th e a b s o r p tio n cross-sect ion
d(E ) ) a n & c o o r d i n a tio n n u m b e r fo r a to m i, respect ively. A j(k, Rj), @ (k, Ri) a n d vk, Rj) a re th e
cu rved -wave to ta l ampl i tude , to ta l phase-shi f t , a n d p h o toe lec t ron m e a n f ree p a th , respect ively.
T h e la t ter -were ca lcu la ted us ing th e p r o g r a m fe ffo f R e h r a n d co-workers [2 3 ].
1 2

-
- .- I- .-
In ou r p re l im inary D A F S e x p e r i m e n ts w e set o u t to d e te r m i n e th e feasibi l i ty o f per -
fo r m i n g D A F S o n d i lu te p o w d e r samples . T h e diff iculty o f th e s e e x p e r i m e n ts is c o m p o u n d e d
- by th e fact th a t th e di f f racted intensi ty f rom a p o w d e r s a m p l e is very m u c h less th a n fo r a s ing le
crystal. W e wil l first desc r ibe th e resul ts o f e x p e r i m e n ts d e s i g n e d to test th e abi l i ty o f th e tech -
n i q u e to s e p a r a te X A F S o f m ixtures a n d o f sites, a n d th e n p r o c e e d to desc r ibe a po la r i zed p o w -
- de r D A F S s tudy o f th e c o m p o u n d K ,Ni(CN),.
S e p a r a tio n o f A b s o r p tio n e d g e s o f m ixtu res . It is a c o m m o n p r o b l e m in
structural sc ience to h a v e a phys ica l m ixture o f polycrysta l l ine p h a s e s o f u n k n o w n , o r on ly par -
tia l ly k n o w n i d e n tity. In th is case, D A F S c a n b e u s e d in a s imp le m a n n e r to o b ta in e d g e a n d
. E X A F S spect ra o f th e di f ferent p h a s e s , w h e r e a s X A F S y ie lds on ly th e a v e r a g e o f c o n tr ibut ions
f rom al l th e p h a s e s . In pr inc ip le, a n y di f f ract ion p e a k f rom a p h a s e c a n g ive in format ion con-
c e m i n g th e loca l s t ructure o f a const i tuent a to m , g i ven th a t th e r e a re n o spec ia l ext inct ions fo r
th e a to m o f interest. Us ing ou r m e th o d o f d e c o n v o l u tio n , it is n o t necessary to k n o w th e crystal
s t ructure to b e a b l e to extract th e c o n tr ibut ion f rom a par t icu lar p h a s e ; it is suff ic ient to s imply
ass ign th e p e a k s to a speci f ic p h a s e . A s imi lar m e th o d c a n a lso b e app l i ed to s e p a r a tin g c o n tri-
b u tio n s f rom a m ixture o f crystal l ine a n d a m o r p h o u s p h a s e s . In th is case, th e sha rp B r a g g p e a k s
o f th e crystal l ine p h a s e wil l y ie ld th e D A F S f rom th a t c o m p o n e n t, wi th th e b r o a d a m o r p h o u s
c o m p o n e n t b e i n g r e m o v e d by b a c k g r o u n d s u b tract ion.
In o rde r to test th e abi l i ty o f D A F S to s e p a r a te th e fin e structure d u e to a n o m a l o u s
c o m p o n e n ts f rom two di f ferent p h a s e s , w e e x a m i n e d a d i lu te m ixture o f c h r o m i u m (III) ox ide
(2 w t.% ) a n d s o d i u m c h r o m a te (2 w t.% ) in P V P P . T w o a d j a c e n t b u t we l l - reso lved p e a k s w e r e
c h o s e n fo r th e m e a s u r e m e n ts: th e (031) B r a g g p e a k o f N a 2 C r 0 4 (d = 2 .7 3 3 A ) a n d th e (104)
p e a k o f Cr,O , (d = 2 .6 6 6 & , a n d w e r e reco rded s imul taneous ly . T h e resul t ing D A F S - e x tracted
. X A F S spect ra o f th e two c o m p o n e n ts o f th e m ixture a re s h o w n in F igure 4 , to g e the r wi th th e
bu lk X A F S o f th e m ixture. T h e d o tte d l ines s h o w th e X A F S spect ra o f th e ind iv idua l c o m p o -
’ n e n ts r2corde .d s e p a r a tely. T h e Cr,O , D A F S spec t rum f rom th e m ixture s h o w s exce l lent cor re- . s p o n d e n c e wi th th e X A F S o f th e p u r e c o m p o n e n t. T h e fe a tu res o f th e e d g e , inc lud ing th e
weak ly q u a d r u p o l e - a l l o w e d l s + 3 d t ransi t ion a t a b o u t 5 9 9 2 e V , a re very wel l r e p r o d u c e d . T h e
s igna l to no i se o f th is spec t rum is g o o d , a n d exce l lent s e p a r a tio n o f th is c o m p o n e n t f rom th e
1 3

I
F -
_ mixture has been achieved. The intensity of the (031) Bragg peak of Na&rO, is approximately
50% of that of the (104) peak of Cr,O,, and also shows a smaller anomalous effect, and there- -
fore somewhat poorer statistics are obtained for the N%CrO, (031) DAFS. Additionally, a
small amount of contamination of the (031) N%Cr04 signal with that from the neighboring
- Cr,03 (104) peak may be suggested by the peak at around 6010eV, which corresponds to the
strongest feature of the Cr,O, spectrum. Although noisier, it is evident that the XAFS extracted
from the DAFS spectrum reproduces the edge spectrum well, and in particular, the ls+3d tran-
sition a+ 5992.8 eV, which gains dipole-allowed intensity from mixing with oxygen p-orbitals
[24], is well reproduced both in form and in intensity.
Separation of spectra from two distinct anomalous atoms in one phase. The oxide Co,O, has the normal spine1 structure, in which a cubic close-packed array of oxy-
. gens incorporates formally low-spin Co(III) cations at octahedral interstices, and formally high-
-~ spin Co(I1) cations at tetrahedral interstices. The structure thus contains one tetrahedral cobalt
for every two octahedral cobalt sites. Co304 crystallizes in the cubic space group F&r No.
227 [25]. From refinement of powder diffraction data we find a value for the unit cell a0 = - _ 8.085 l(2)& which agrees well with literature values [26]. The two different cobalt sites occur
on high symmetry positions within the unit cell, yielding extra conditions for reflection above
the basic spacegroup conditions (i.e. h,k,Z either all odd or all even). The tetrahedral cobalt sites
(8b) have the additional conditions (h=2n+I or h,k,Z=4n+2 or h,k,l=ln) and the octahedral co-
balt sites (16~) the conditions (h=2n+I or h+k+Z=4n). Hence, there is a small subset of peaks
forwhich only the octahedral cobalt contributes, and another for which only the tetrahedral co-
balt contributes. We selected the (222) diffraction peak (d = 2.334A) to study the pure octahe-
dral component, and the (422) diffraction peak (d = 1.650A) for the tetrahedral component. The
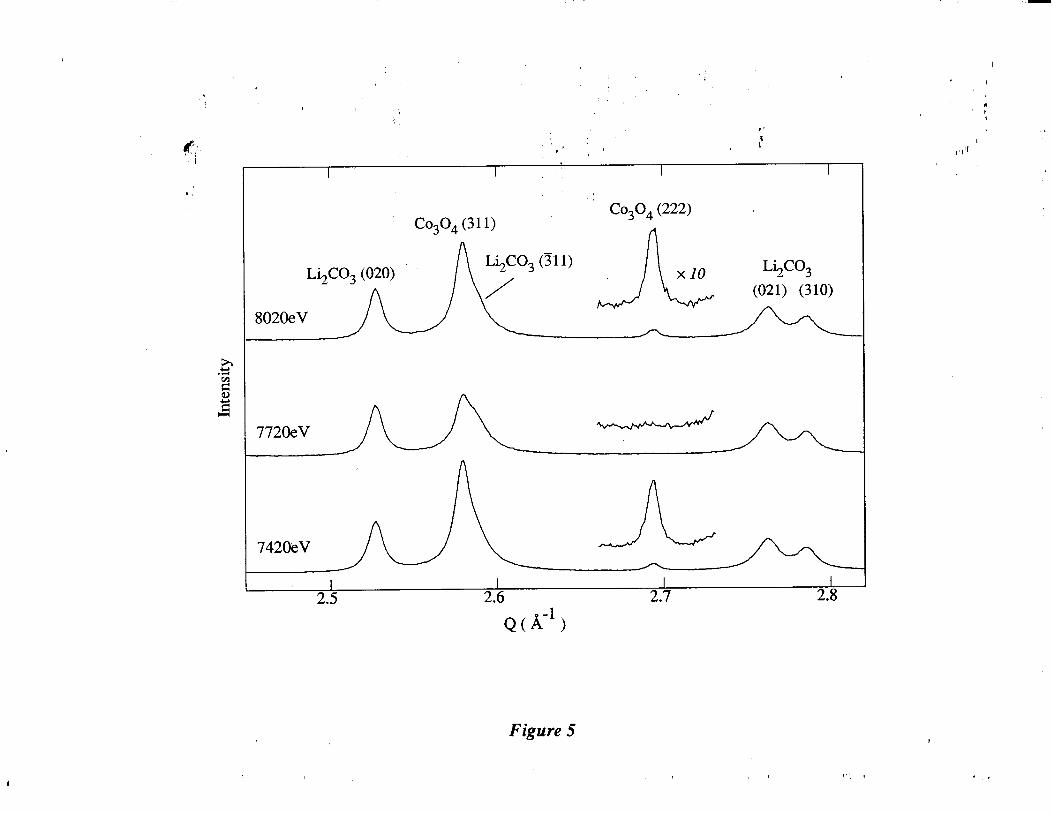
Co304 (222) diffraction peak exhibits a particularly large anomalous effect, which is illustrated
in Figure 5. The peak has almost zero intensity at 7720 eV, which is close to the absorption
_ edge.
Figure 6 shows the raw DAFS spectra for Co304 (422) and (222) diffraction peaks, _ ..~ togeth&&vith ithe raw cobalt K-edge DAFS spectrum for the (i12) peak of Li,CO,. The
L$CO, spectrum was collected as a control for the absorption correction and intensity extrac-
tion procedures and, as expected, shows no structure over the cobalt absorption edge. The
14

I
- DAFS-extracted site specific cobalt K-edge X-ray absorption spectra are shown in Figure 7A,
together with a composite spectrum compared with the experimental total absorbance. The dif- -
ference between the first inflection energies of the octahedral and tetrahedral sites is approxi-
mately 2eV. Figure 7B shows the composite DAFS-extracted EXAFS oscillations, compared
with the EXAFS from the absorbance. Examination of the site specific edge data shown in Fig-
ure 7A allows us to assign individual features of the total X-ray absorption edge spectrum to
tetrahedral and octahedral sites, and this is shown in Figure 8. Figure 9 shows the DAFS-
extracted EXAFS and corresponding Fourier transforms for the two different cobalt sites, com-
pared with calculations based on the crystal structure [26]. Taken together, these data provide
. . compelling evidence that DAFS can readily provide site specific X-ray absorption spectra.
The site specific Co,O, cobalt K-edge spectra provide some interesting insights.
Lenglet er al. [28] have examined the Co K-edge X-ray absorption spectra for a number of
. spinels and inverse spinels,.and Sano [29], and later Briois et al. [30], have examined a wide
range of Co(I1 j *and Co@) compounds with different coordination environments. For an octa-
hedral cobalt site we expect the spectrum to be dominated by a pronounced ls+4p transition at
about 7730eV [30], which is intense because of the degeneracy of the 4p levels in an octahedral
environment. The Is+3d transition at about 7711eV should be very weak as in 0, symmetry
no mixing of the metal 4p levels is expected, and the transition is thus dipole forbidden. The
transition gains small (but significant) intensity from being quadrupole allowed and possibly
dipole-allowed intensity from 3d-4p mixing due to vibronic interactions [31]. In agreement with
this, the spectrum in Figure 7 shows a pronounced peak at 7730eV, and no detectable ls-+3d
pre-edge peak. For tetrahedral cobalt, on the other hand, we expect a more pronounced Is+3d
t&,&tion as mixing of metal 4p with the t2 d-orbitals is expected [cfi 241, and this was observed
by Briois et al. [30]. Unfortunately the signal to noise of the DAFS-extracted XAFS, combined
with the resolution of the Si( 111) monochromator used for this experiment, prevents us from
definitively observing this feature, although there may be a small peak at 7710eV (Figure 7).
For tetrahedral cobalt, no pronounced ls+4p transition, such as that observed for the octahe-
I dm.l sites, is expected because of the mixing with metal 3d orbitals [30]. We observe three fea-
tures Ikche i&ahedral spectrum, at X-ray energies 7719.6 eV, 7724.3 eV and 7737.7 eV.
Lenglet et al. [28] have examined the Co K-edge spectra of the spine1 CoRh,O,, which con-
tains only tetrahedral cobalt, and observe a more pronounced ls+3d transition than for octahe-
15

- dral com$exes, and three features in the edge which correspond closely with those observed for
the tetrahedral site of Co,O,.
In the case of a spine1 structure such as Co304 we have advantageous spacegroup
absences for the two cations, so that the contributions can be separated completely by choosing
just two peaks. The more general case is that all anomalous atoms would contribute to all Bragg
peaks [32], and therefore a direct separation of this nature does not occur since the f,‘(E) and
- fm”(,Ek2f Equation 7 are weighted mean values of all the atoms. However, different anomalous
.atom types will contribute to the peaks with varying proportions, and therefore, with a knowl-
edge of the crystal structure, indirect separation will be possible with careful combination of the . . data from n-l (or more) diffraction peaks, and absorbance, where n equals the number of dis-
tinct anomalous atoms.
Polarized Diffraction Anomalous Fine Structure of K,Ni(CN)& A vah-
able route to assigning features in an X-ray absorption edge spectrum, and therefore to inter-
preting them in terms of the electronic structure, is to obtain polarized XAFS spectra. A polar- - ized X-ray absorption edge study of a single crystal of K,Ni(CN),.H,O has been reported by
Kosugi et al. [33]. Unfortunately, no crystal structure data has been reported for this compound,
and, the interpretation of the spectroscopic results was based on speculation that planar
[Ni(CN)J2- anions are oriented perpendicular to a particular (unspecified) crystal cleavage
plane. The crystal structure of the anhydrous form, K,Ni(CN),, however, has been determined
_ us~mg a combination of powder and single crystal X-ray diffraction [34]. Because of this, and
_ because of the tendency of K,Ni(CN),sH,O to lose water of crystallization, we chose to study
the polarized DAFS of K,Ni(CN),. The space group of K,Ni(CN), is P2,lc, and the structure
consists of two sets of isolated square-planar (Ddh y s mmetry) [Ni(CN),12- anions with planes
inclined at 18.55” to each other, and at 80.73” to the (010) plane [34]. Figure 10 shows the Ni
K-edge spectrum of K,Ni(CN),,. together with the crystal structure (inset) viewed down the
crystallographic u-axis. We also recorded the powder XAFS spectrum of K,Ni(CN),.H,O (not
illustrated), and found that both the Ni K-edge EXAFS and the edge spectrum were essentially
- ident&&to that of K2Ni(CN)4. Very similar powder Ni K-edge spectra were obtained for
K2Ni(CN),.H,0 by Kosugi et al. [33], and we conclude that the local environment of the nickel
in these compounds is identical. In polarized single crystal measurements, Kosugi et al. [33] found that the prominent pre-edge features A at 8335.3eV and B at 8343.5eV (see Figure 10)
16

-- - are strongly -anisotropic, being most intense for the e-vector orientation assumed to be normal to
the- mi(CN),12- plane. The broad feature C was found to be less anisotropic, with opposite -
sense [33].
We were able to collect several diffraction peaks of interest for polarized DAFS of
K,Ni(CN), in the same energy scan since they lie within a small range of d-spacings. Figure 11
shows the Bragg scan for a single energy point in a DAFS scan which includes five prominent
diffraction peaks, together with the minimized pseudo-Voigt function which was used to extract -” e4 the integrated intensities. As was noted above, we expect a dipole allowed transition in powder
DAFS to have an intensity, I, relative to the powder, given by 1=(3sin2&2, where c is the angle
.” between the transition dipole vector and the normal to the hkl plane (in other words the angle
between the Bragg plane and the [Ni(CN),12- plane). The DAFS-extracted Ni K-edge X-ray ab-
sorption edge spectra for the (020), (loo), (1 li), (013), (102) and (102) Bragg reflections are
- --shown in Figure 12. It car-be seen that the intensity of both the pre-edge feature A and the
shoulder B vary as the reflection is changed, with the broad feature C showing a more subtle
variation. The area of the pre-edge peak A was measured by fitting the spectra to an edge jump
function l&s a sum of pseudo-Voigt peaks to approximate the spectral structure [27]. In Figure
13, the peak areas thus obtained are plotted against the calculated value of (3sin2c)/2 averaged
over the two [Ni(CN),12- orientations in the unit cell, assuming a transition dipole vector ori-
ented normal to the mi(CN),12- plane. The points clearly describe a straight line, and, in agree-
ment with the conclusions of Kosugi et al. [33] we find that the intensity of the peak A is maxi-
mal.. when- the e-vector is perpendicular to the [Ni(CN),12- plane. Also in agreement with
- Kosugi et al. [33], it can be seen from Figure 12 that a similar polarization dependence is ob-
served for the peak B, while the broader feature C shows a much smaller angular dependence,
of opposite sign.
The [Ni(CN)J2- anion is often used as an example of a typical square planar Ni2+
- complex [e.g. 351, and its electronic structure has been the subject of some investigation [e.g.
36,371. The resonance C is perhaps the most readily assigned, a very similar structure being ob-
..servedlGor[Co!CN)6]3- [29], for [Fe(CN)d3- and [Fe(CN)J4- [38] and for [Fe(CN),NO12- [39].
In the case of [Co(CN)J3- [29] molecular orbital calculations have been used to assign a
Is-+tI, (Co 4p - CN- 60) transition, and it can be alternatively rationalized as a 6* type shape-
resonance set up by the cage of CN- [38]. For wi(CN)4]2- a G* shape-resonance would be ex-
17

-
- .- , -A
- p e tte d to ’b e -have m a x i m a l intensi ty w h e n th e e-vector is in th e [Ni (CN),12- p l a n e , a n d th is is
i n d e e d th e case fo r p e a k C (see F igure 10) . T h e t ransi t ions A a n d B , o n th e o the r h a n d , a re n o t
o b s e r v e d in oc tahedra l cyan ide complexes , a n d th e s e p rove ra ther m o r e p r o b l e m a tic to ass ign.
In s q u a r e p lana r complexes , Nr * 2 + is low-sp in 3 d 8 ( S = O ) , a n d th e p lana r l i gand fie ld causes th e
s ing le u n o c c u p i e d 3 d 2 m y 2 orbi ta l to b e h ighes t in e n e r g y . Th is orbi ta l res ides in th e
[Ni (CN),12- p l a n e , a n d w e e x p e c t th e lowest e n e r g y t ransi t ion to b e a weak ly q u a d r u p o l e a l -
l o w e d l s + 3 $ + 2 - ,2 p e a k a t a b o u t 8 3 3 3 e V [4 0 ], wh ich s h o u l d b e m o s t in tense w h e n th e e -
vector 4s in th e [Ni (CN),12- p l a n e . T h e p e a k A a t 8 3 3 5 .3 e V is very c lose to th e e x p e c te d pos i -
tio n fo r th e Is+ 3 d p e a k , a l t hough it is fa r to o in tense, a n d o f incorrect po lar iza t ion to b e th e
. . e x p e c te d q u a d r u p o l e - a l l o w e d l s + 3 d p e a k . K o s u g i e t al. [3 3 ] h a v e s u g g e s te d th a t A a n d B a re d u e to t ransi t ions to m e ta l 4pn* orbi ta ls wi th la rge m ix ing wi th CN- 20* c o m p o n e n ts; h o w e v e r
A is to o c lose to th e l s + 3 d to b e d u e to t ransi t ions to th e p r e d o m i n a n tly m e ta l b a s e d 4 p , or-
bital. O n e possibi l i ty wh ich m u s t b e cons ide red is th a t x b a c k - b o n d i n g f rom th e f i l led m e ta l 3d -
- + .orbi ta ls to CN- b a s e d 27c* orbi ta ls a l lows us to obse rve a l s + 3 d n* t ransi t ion. H o w e v e r , th e . ̂ cyan ide ion is genera l l y cons ide red to b e a g o o d 0 e lec t ron d o n o r a n d a p o o r n : e lec t ron accep-
to r [3 5 ];‘- a n d ? in a g r e e m e n t wi th this, mo lecu la r orb i ta l ca lcu la t ions s u g g e s t th a t th e r e is little
l i gand n b a c k - b o n d i n g [3 6 ,3 7 ]. S q u a r e p lana r C u 2 + c o m p l e x e s h a v e b e e n m u c h s tudied, a n d
a lso possess p r o n o u n c e d z -po la r ized low e n e r g y transi t ions, a l t hough a t a h ighe r e n e r g y re lat ive
to th e ls+ 3 d t ransi t ion ( -8eV, c o m p a r e d to -2 .5eV fo r p e a k A o f K ,Ni(CN),). T h e s e t ransi-
tio n s a re th o u g h t to b e ls+ 4 p , + l i gand to m e ta l c h a r g e t ransfer s h a k e - d o w n t ransi t ions [41 -
4 4 ]. It is poss ib le th a t th e p e a k s A a n d B in th e p i (CN), lL- e d g e spect ra a re d u e to s imi lar mu l -
tie lec t ron s h a k e - d o w n e v e n ts; h o w e v e r , a fina l conc lus ion m u s t awai t th e resul ts o f a m o r e de -
ta i led th e o r e tical analys is .
D iscuss ion
T h e resul ts p r e s e n te d in th is p a p e r d e m o n s trate th a t D A F S is a fu n d a m e n tal ly v iab le
- techn ique fo r p r o b i n g th e structure o f a var iety o f samples . In fo r m a tio n c a n b e o b ta i n e d wh ich
is n o t ava i lab le us ing X A F S a n d X -ray di f f ract ion s e p a r a tely. A ll o f th e resul ts p r e s e n te d a re o f . -- .d i lu te & d e r m a ter ials, a n d a c c e p ta b l e qual i ty d a ta w a s o b ta i n e d , desp i te th e very m u c h lower
di f f racted intensi ty in p o w d e r s c o m p a r e d wi th th e co r respond ing s ing le crystal case.
W e h a v e d e m o n s trated in th is p a p e r a n iterat ive m e th o d fo r deconvo lv ing th e rea l
1 8

Y -
- a n d imag-% & y c o m p o n e n ts o f th e a n o m a l o u s scat ter ing factor f rom th e D A F S s ignal . T h e r e a re
two ma jo r a d v a n ta g e s o f ou r p r o c e d u r e fo r D A F S d a ta reduct ion. T h e first is th a t th e m e th o d -
c a n b e app l i ed to o b ta in loca l structural in format ion fo r a n y crystal l ine m a ter ia l wi thout a pr ior i k n o w l e d g e o f its structure. A coro l lary o f th e m e th o d is th a t in so lv ing fo r th e var ious constants
- w e a lso o b ta in p h a s e in format ion fo r th e a n o m a l o u s a to m u n d e r invest igat ion (e.g. va lues o f
a /A ) wh ich cou ld assist in fu l l crystal s t ructure d e te r m i n a tio n fo r a n u n k n o w n . A s e c o n d ad -
v a n ta g e o f ou r m e th o d o l o g y is th a t th e fina l resul t o f th e ana lys is p r o c e d u r e is a n a b s o r b a n c e
spect rum. Direct c o m p a r i s o n b e tween D A F S spect ra o r o f a D A F S spec t rum wi th a n X A F S
spec t rum m a y b e u n i n fo r m a tive, d u e to vary ing (poss ib ly u n k n o w n ) p ropor t ions o f f’(E),f”(E)
. . a n d the i r respect ive s q u a r e d terms, d e p e n d i n g o n th e structure factor o f th e par t icu lar ref lect ion.
In th e case o f th e D A F S - e x tracted X A F S th e s e compar i sons c a n i n d e e d b e m a d e , in b o th th e
.E X A F S a n d th e e d g e spectra. In th e case o f th e E X A F S , a n impor tant a d v a n ta g e is th a t th e
spec t rum c a n th e n b e a n a l y z e d by t radi t ional curve-f i t t ing m e th o d s , us ing w ide ly ava i lab le
-~ E X A F S p h a s e a n d amp l i t ude fu n c tio n s [e .g . 2 3 1 .
’ - .A s s tated a b o v e , a l l o f th e e x p e r i m e n ts desc r ibed he re in a re o f p o w d e r s . P o w d e r -
dif f ract ion h a s recent ly g a i n e d inc reased impor tance d u e to its app l ica t ion to crystal s t ructure
d e te r m i n a tio n o f m a ter ia ls fo r wh ich s ing le crystals a re unava i l ab le [e .g . 4 5 a n d refs. there in ,
4 6 1 . Polycrysta l l ine p o w d e r s a m p l e s o f th is type represen t a very substant ia l g r o u p o f m a ter ials,
m a n y o f wh ich a re o f g r e a t impor tance. In a d d i tio n to th e local , si te specif ic, st ructural X A F S
in format ion d iscussed a b o v e , D A F S p rov ides substant ia l p h a s e in format ion wh ich cou ld assist
- in-st ructure d e te r m i n a tio n . In d e e d , in th e fu tu re it m a y p rove poss ib le to co- re f ine di f f ract ion
- in tensi t ies a n d th e D A F S osci l lat ions, wh ich w o u l d explo i t th e (of ten) h ighe r reso lu t ion a f-
fo r d e d by E X A F S . T h e u s e o f D A F S to charac ter ize c o m p o n e n ts o f m ixtures h a s app l ica t ions
in m a n y d isc ip l ines inc lud ing h e te r o g e n e o u s catalysis a n d m inera logy , w h e r e D A F S cou ld h e l p
to locate a n e l e m e n t in a par t icu lar c o m p o n e n t, a n d d e d u c e its respect ive. . local structure. Fur-
th e r m o r e , us ing D A F S , po la r i zed X A F S c a n b e o b ta i n e d f rom p o w d e r s , as h a s b e e n d e m o n -
st rated by ou r s tudy o f K ,Ni(CN),, a n d h a s th e abi l i ty to g ive s imi lar in format ion to s ing le
c-ystal X A F S .
-G-- - -; A n o the r fu tu re app l ica t ion o f D A F S is wi th s ing le crystal di f fract ion. F r o m th e
p o i n t .o f -v iew o f s igna l to no ise, s ing le crystal D A F S is e x p e r i m e n tal ly eas ie r th a n fo r p o w d e r s
[cf lo]. Di f ferent di f f ract ion p e a k s c a n b e u s e d to select ively p r o b e th e po la r i zed X A F S o f crys-
1 9

-
- . . X - C
- ta l lograph ica l ly dist inct occur rences o f th e s a m e e l e m e n t. Th is cou ld b e o f impor tance, fo r ex-
a m p l e , in th e d e te r m i n a tio n o f act ive si tes in s ing le crystals o f m e ta l loprote ins. In th is case, th e -
locat ion o f a par t icu lar m e ta l m a y b e crys ta l lography loca ted to l ow resolut ion, a t b e s t to te n ths
o f a n A n g s trom. T h e prec ise si te coord inat ion , a n d h e n c e ox ida t ion state, wh ich is o f cri t ical
impor tance fo r e luc ida t ing th e n a tu re o f th e act ive site, c a n n o t a lways b e d e te r m i n e d f rom th e
crys ta l lography a l o n e . Bu l k X A F S , simi lar ly, c a n on ly g ive a n a v e r a g e over al l occur rences o f
th e e l e m e n t in th e structure. In c o n trast, D A F S h a s th e p o te n tia l to select ively p r o b e th e coord i -
n a tio a % e o m e try o f ind iv idua l sites, a n d m o r e o v e r , exp lo i t ing th e po la r i zed n a tu re o f synchro-
t ron radiat ion, cou ld b e u s e d to d e d u c e th e s p a tia l or ienta t ion o f ind iv idua l si tes wi th in th e crys-
. . tal.
A c k n o w l e d g m e n ts. W e th a n k Dr. G rayson H . V ia fo r h e l p fu l d iscuss ions a n d
e n c o u r a g e m e n t th r o u g h o u t th e cou rse o f th is work, a n d P rof. D .C. C r e a g h fo r adv is ing us con-
- -- c e m i n g correct ions to th e th e o r e tical va lues forf a n d f’. W e a lso th a n k Dr. Char les E . B o u l d i n . . _ .- - a n d Dr. Lar ry B . S o r e n s e n fo r b r ing ing th e Fast Four ie r t ransform m e th o d fo r ca lcu la t ing
K ramers -&on ig in tegra ls to ou r n o tice, a n d fo r c o m m u n i c a tin g th e resul ts o f the i r e x p e r i m e n ts . . p r ior to publ icat ion.
2 0

- Refe&-ices:
(1)
; -- (2)
. .
(-3)
(5) --
(6)
- (3..
(8)
_ (9)
, ..- (10) L<:’
(a) Lye, R.C.; Phillips, J.C.; Kaplan, D.; Doniach, S.; Hodgson, K.O. Proc. N&Z. Acad. Sci. U.S.A. 1980, 77, 5884-5888. (b) GUSS, J.M.; Merritt, E.A.; Phizackerley,
R.P.; Hedman, B.; Murata, M.; Hodgson, K.O.; Freeman, H.C. Science, 1988,241, 806-811. (c) Karle, J. Physics Today, 1989, 22-29. (d) Hendrickson, W.A. Science 1991,254,51-58.
(a) Bonse, U.; Hartman-Lotsch, I. Nucl. Instrum. Meth. 1984, 222, 185-188. (b)
Templeton, D.H.; Templeton, L.K. Acta. Cryst. 1982, A38, 62-67. (c) Arcon, I.;
Kodre, A.; Hribar, M. in X-ray Absorption Fine Structure (Hasnain, S.S. Ed., Pub- lisher: Ellis Horwood) 1991 726-728.
Arcon, I.; Kodre, A.; Glavic, D.; Hribar, M. J. de Physique 1987, C9, 1105-l 108.
Aufield, J.P. Nature, 1990,343,46-49.
Wilkinson, A.P.; Cox, D.E.; Cheetham, A.K. Actu. Cryst. 1991, B47, 155-161.
(a) Kwei, G.H.; Von Dreel, R.B.; Williams, A.; Goldstone, J.A.; Lawson II, A.C.;
Warburton, W.K. J. Mol. Struct. 1990, 223, 383-406. (b) Attfield, J.P. J. Phys. Chem. Solids 1991,52, 1243-1249.
Wilkinson, A.P.; Cox, D.E.; Cheetham, A.K. J. Phys. Chem. Solids 1991,52, 1257-
1266.
(a) Ponomarev, Yu.V.; Turutin, Yu.A. Sov. Phys. Tech. Phys. 1983, 28, 1474. (b)
Ponomarev, Yu.V.; Turutin, Yu.A. Sov. Phys. Tech. Phys. 1984,29,232-234.
Pickering, I.J.; Sansone, M.; Marsch, J.; and George, G.N. Japan J. Appl. Phys. 1992 (in the press)
Stragier, H.; Cross, J. 0.; Rehr, J. J.; Sorensen, L. B.; Bouldin, C. E.; Woicik, J. C.
Phys. Rev. Lett. 1992,69,3064-3067.
(11) Fernelius, W. C. and Burbage, J. J. 1946, Inorganic Syntheses Vol. II (McGraw-Hill
21

%- - - . Book Company, N.Y.), p.227.
(4 The National Synchrotron Light Source is funded by the Division of Materials Sci-
ences, U.S. Department of Energy, under contract DE-AC02-76CH-0016.
(13) Sansone, M.; Via, G.; George, G.N.; Meitzner, G.; Hewitt, R. in X-ray Absorption Fine Structure (Hasnain, S.S. Ed., Publiser: Ellis Horwood) 1991 656-658.
- (14) z.P- Sansone, M. in National Synchrotron Light Source Annual Report 1991,1,96.
- (15) Goulon, J.; Goulon-Ginet, C.; Cortes, R.; Dubois, J.M. J. Physique 1982, 43, 539- . .
548.
(16) Sparks, C.J. Jr. Phys. Rev. Lett. 1974,33,262-265.
- -- (.17) _ $r = hxr + kyr -or Zz,, where h, k, I are the Miller indices of the diffraction peak and . ̂
..- xr, y,. and z, are the fractional unit cell coordinates of the atom r.
(18) ‘-- The scattering factor& incorporating the temperature factor B may be expressed as
&,. = f,exp(-Bsin201h2), where h is the wavelength of the incident X-rays, and
B = 8~~2, where 2 is the mean square displacement of the atom. The function
sin20/h2 is a constant for a given diffraction peak scanned in the manner described,
and therefore if isotropic thermal motion can be assumed, the temperature factor re-
duces to a constant.
(19) Since (A2 + B2)(a2 + p2) = (Aa + Bp)2 + (Ba - Ap)2, there are only 3 independent
coefficients in Equation 6.
(iO> (a) Cromer, D.T.; Liberman, D. Acta Cryst. 1981 A37, 267-268. (b) Cromer, D. J. Appl. Cryst. 1983,16; 437. (Note: The program of Cromer was modified as recom-
mended by D.C.Creagh, to correct errors in the original)
* (21) :<+ Templeton, L.K.; Templeton, D.H. J. Appl. Cryst. 1988,2I, 558-561.
(22) (a) Peterson, C.W.; Knight, B.W. J. Opt. Sot. Amer. 1973, 63, 1238-1242. (b)
Johnson, D.W. J. Phys. A: Math. Gen., 1975,8,490-495.
22

F - (23) ’ (a) Rehr, J.J.; Mustre de Leon, J.; Zabinsky, S.I.; Albers, R.C. J. Amer. Chem. Sot.
1991, 113, 5135-5140. (b) Mustre de Leon, J.; Rehr, J.J.; Zabinsky, S.I.; Albers, -
R.C. Phys. Rev. B, 1991,44,4146-4156.
(24) Kutzler, F.W.; Natoli, C.R.; Misemer, D.K.; Doniach, S.; Hodgson, K.O. J. Chem. Phys. 1980,73,3274-3288.
(25) International Tables for X-ray Crystallography, 1989, Volume A, (Ed. Theo Hahn, z -- Kluwer Academic Publishers)
. . (26) Knop, 0.; Reid, K.I.G. Can. J. Chem. 1968,46,3463-3476.
i27) Edge spectra were fitted to a sum of pseudo-Voigt peaks, plus a function designed
to approximate the edge step (cc St&r, J. NEXAFS Spectroscopy, Springer Verlag
1992, Chapter 7. ) . The powder data were first fitted, and the positions of all peaks
_.- - were then held fixed while fitting the DAFS-extracted XAFS data.
(28) ‘-.-’ Lenglet, M.; D’Huysser, A.; Diirr, J. Ann. Chim. Fr. 1988,13,505-515.
WV Sano, M. Inorg. Chem. 1988,27,4249-4253.
(30)
.-
Briois, V.; Cartier, C.; Momenteau, M.; Maillard, Ph.; Zarembowitch, J.; Dartyge,
E.; Fontaine, A.; Tourillon, G.; Thuery, P.; Verdaguer, M. J. de Chimie Phys. 1989,
86,1623-1634.
(31) Hahn, J.E.; Scott, R.A.; Hodgson, K.O.; Doniach, S.; Desjardins, S.R.; Solomon,
E.I. Chem. Phys. Lett. 1982,88,595-598.
(32) Such a case has recently been investigated by Stragier, Sorenson, Bouldin and co-
workers (personal communication), who have performed a detailed study of the
DAFS of an epitaxial thin film of YB~&u,O,-~.
-(33) -iIL- Kosugi, N.; Yokoyama, T.; Kuroda, H. Chem. Phys. 1986,104,449-453. -
(34) Vannerberg, N.-G. Acta Chem. Stand. 1964,18,2385-2391.
(35) Cotton, A.F.; Wilkinson, G. Advanced Inorganic Chemistry, John Wiley & Sons,
23

(36)
(37)
(38)
(39)
X40)
- -- (41)
(42)
(43)
(46)
i988, Fifth Edition, pp 743-747:
Hillier, I.H.; Saunders, V.R. Mol. Phys. 1972,23,449-456.
Demuynck, J.; Veillard, A. Theoret. Chim. Acta (Berl.) 1973,28,241-265.
Bianconi, A.; Dell’Ariccia, M.; Durham, P.J.; Pendry, J.B. Phys. Rev. B 1982, 26,
6502-6508.
Gadeke, W.; Koch. E.E.; DrPger, G.; Frahm, R.; Saile, V. Chem. Phys. 1988,124,
113-119.
We estimate an expected Is+3d energy of 8333eV from the average value of
nickel K-edge spectra from a large number of Ni2+ compounds.
Bair, R.A.; Goddard, W.A. Phys. Rev. B 1980,22,2767-2776.
Kosugi, N.; Yokohama, T.; Asakura, K.; Kuroda, H. Chem. Phys. 1984, 91, 249- 256.
Smith, T.A.; Penner-Hahn, J.E.; Berding, M.A.; Doniach, S.; Hodgson, K.O. J. Amer. Chem. Sot. 1985,107,5945-5955.
Yokoyama, T.; Kosugi, N.; Kuroda, H. Chem. Phys. 1986,103,101-109.
Cheetham, A.K.; Wilkinson, A.P. J. Phys. Chem. Solids 1991,52, 1199-1208.
Morris, R.E.; Harrison, W.T.A.; Nicol, J.M.; Wilkinson, A.P.; Cheetham, A.K. Na- ture 1992,359,519-522.
24

- FigurG. captions:
Figure 1. Diagram of the experimental setup for a DAFS experiment.
Figure 2. Example of experimental output of a single DAFS scan of a sample of 5wt. %
KMnO, in Li,CO,.
A. The KMnO, (211) diffraction peak scanned with different incident X-ray ener-
gies in the vicinity of the manganese X-ray absorption K-edge. The intensity vari- ; --
. .
ation in the peak intensity, from which the DAFS signal is extracted, can be clearly
seen. In addition, structure from the small amount of X-ray fluorescence (mainly
Mn KP) included in the scatter single channel analyzer window, can be seen as in-
creased background.
B. a. The raw (2 11) DAFS spectrum of KMnO,. li. The raw DAFS spectrum (as in
a. but with bulk absorption and Lorentz corrections applied). c. The XAFS of
KMnO, (for comparison), measured by conventional transmittance simultaneously : _~ with the DAFS scan. -
- _
Figure 3. Example of the results of applying the iterative method of data analysis to extract a
XAFS spectrum from a raw DAFS spectrum of 5wt. % KMnO, in Li,CO,.
A. f”(E) (a) andf’(E) (b) functions for KMnO, . The solid lines show the functions
as extracted from the DAFS data. The broken lines show the starting functions used
in the data analysis which correspond to the Cromer Liberman theory curves, con-
voluted with a pseudo-Voigt function and shifted by an appropriate energy. The in-
set in A shows an Argand diagram of the anomalous correction. Note the large
epicyclic feature which corresponds to the ls+3d transition at 6543.2eV.
B. A comparison of the normalized absorbance extracted from the KMn04 (211)
DAFS (b) with the XAFS spectrum (a).
. Figuqe.4. Separation of DAFS from a mixture of phases. The sample is 2 wt.% each of Cr,O, .-- _ -i; and Na&rO, in PVPP. For this experiment, the diffracted beam vertical collimating
slits were opened to 3mm and five data points per energy step were collected, one at
the maximum intensity of each of two Bragg peaks and three background points.
25

- . . ,-.- %- - .
Data is from a single scan of CU. 31/4 hours. (a) The absorbance of the mixture. (b)
and (d) show the DAFS-extracted XAFS of Na&rO, (031) and Cr,O, (104), re-
spectively. (c) and (e) are the XAFS spectra of pure Na$rO, and Cr,O,, respec-
tively, recorded independently of the DAFS experiment.
Figure 5. Powder diffraction patterns recorded for a mixture of Co304 in Li2C03 at three dif-
ferent energies as shown. The patterns are plotted as a function of Q = 2x/d =
-” -- 47rsinWh. A large anomalous effect is seen for the Co304 (222) diffraction peak,
which has close to zero intensity at the absorption edge of cobalt.
.- Figure 6. Raw DAFS spectra for 5 wt.% Co,O, in Li,CO,, shown after removal of bulk ab-
sorption and angular contributions. Spectra are shown for the (422) and (222) dif-
fraction peaks of Co,O,, corresponding to the tetrahedral and octahedral cobalt, re-
spectively, and the (i12) peak of Li,CO,, which was measured as a control (see
_.- text),
Figure- 5 -A. Cobalt K-edge X-ray absorption spectra for Co,O,. The bottom traces show the . . individual DAFS-extracted XAFS for the octahedral and tetrahedral cobalt sites.
The top traces show the weighted sum (2/3 octahedral + ‘/3 tetrahedral) of the
DAFS-extracted XAFS (broken line) compared with the bulk absorbance (solid
line).
.- B. The- g-weighted cobalt K-edge EXAFS from the absorbance (solid line) com-
pared with the weighted sum of the DAFS-extracted EXAFS (broken line) for the
two sites in Co,O,.
Figure 8. Co30, cobalt K-edge spectrum (points), together with the results of a curve-fitting
analysis (solid line) A, and the corresponding second derivatives, B. The results of
the curve-fitting are summarized by the stick diagram in A, and show the assign-
ment of transitions to the tetrahedral (TJ and octahedral (Oh) cobalt sites. The . -- curve-fitting [27] yielded peak positions of 7709.9eV, 7713.7eV, 7719.6eV,
-c- -; 7724.3eV, 7730.0eV, 7737.7eV, 7744.4eV. The threshold (7733.3eV) was approxi-
mated by a single inflection, and was floated freely in the fit; because of the uncer-
tainty concerning the actual position, we consider the amplitudes obtained to be ap-
26

%- - .
.proximate, especially for the 7737.7eV and 7744.4eV peaks.
Figure 9. Cobalt K-absorption edge DAFS-extracted EXAFS (A) and EXAFS Fourier trans-
forms (I?) for Co,O,. The solid lines show the DAFS-extracted EXAFS data for the
(222) and the (422) diffraction peaks (octahedral and tetrahedral, respectively). The
broken lines were calculated from the crystal structure for the individual sites.
Figure 10. The nickel K-absorption edge spectrum of powdered K,Ni(CN),, together with the -” .--
. .
crystal structure viewed along the crystallographic a-axis (omitting the potassium
ions for clarity). The columns of square planar [Ni(CN),]‘- anions can be clearly
seen.
Figure 11. A Bragg scan corresponding to a single energy point (8150eV) of the total DAFS
scan for K,Ni(CN), (in this case each DAFS scan was comprised of more than lo4
individual intensity measurements). The plot shows the experimental data as points, . ̂ ..-
with the refined pseudo-Voigt profile which was used to extract the integrated in- : - - .- tensity of the Bragg peaks. The mixing parameter of all pseudo-Voigt peaks was re- . _
fined as a single common parameter, peak-widths, intensities and d-spacings were
floated individually in the refinement, and the background was approximated using
a low order polynomial. The lower solid line shows the residual of the fit.
Figure 12. DAFS-extracted Ni K-edge X-ray absorption spectra of K,Ni(CN), for the different
= .- diffraction peaks measured. From top to bottom, the (020), (102), (013), (ill),
(100) and (102) signals, in order of decreasing value of sin2&
Figure 13. The intensity of the 8335.3eV pre-edge peak A (see Figure 10) plotted against the
mean value of 3(sin2< )/2, for the two [Ni(CN),12- orientations in the unit cell, cal-
culated from the crystal structure. 5 is the angle between the normal to the
[Ni(CN),]‘- square plane and the normal to the hkl diffraction plane. The average is
over the two molecular orientation in the unit cell (normals to the molecular planes . --
e-l -i; reJated by uvw and utiw ). An equivalent average is over the two sets of Bragg
peaks which contribute intensity at a particular d-spacing. For this spacegroup, the
reflections hkl and hkl generally have identical structure factors, but the presence
27

of anisotropy in the anomalous‘ dispersion breaks this equivalence, and the com-
puted average is over these two sets of reflections.
- .
28

- -
. . x-.-
-. -
%- - -
.
. . - -.
. .- .--
_ -i;

- -
. **- r
r
c, I’ ‘!
I ’

-
- .
I-’
- -
. .
L
I
I I
F4 +
XNItX&IO
Sq~ pG
3Z~~tXU
lON
-

- -
. s-e
- -
. *-- r
. .

- -
. s-.-
r - - .
. .

-
- .
*-.-
Y - -
.,.’ ..’
. . . . . ..-* * ,: . . -.... 5
! N

- -
. . x--
- -
. .
*sqv *hrxaa puz

-
- .
I-’
. .

-
- .
*-’
Y
-” --
. .
-
aXIt?q.IOSqv
PX
IlleulrON
. .,- -<:-
-;

- -
. *--
. .
t \ !

-
- .
I-.-
r

- -
. *-.-
r - -
. .
d d 0
l
\ t-l d