differentials in child morbidity and … · differentials in child morbidity and utilization of...
TRANSCRIPT

DIFFERENTIALS IN CHILD MORBIDITYAND UTILIZATION OF HEALTH FACILTIES
IN RURAL ETHIOPIA
By
AYNALEM G •YOHANNE S
A sub-thesis submittedas a partial requirement for the degree of Master of Arts
in Demography at the Australian National University,Canberra
February 1988

I would like to dedicate this thesis
to my late father G. YOHANNES ANDOM

DECLARATION
Excep t
thiswhere otherwise indicated
thesis is my own work.
AYNALEM G .YOHANNE S
February 1988

iii
ACKNOWLEDGEMENTS
I am very grateful to Dr. P.K. Streatfield, ray supervisor and Dr. D. Lucas, my advisor for all their guidance, supports and invaluable suggestions in the successful completion of this thesis. I am also indebted to Ms Marian May and Ms Chris McMurray who edited this thesis and who were always ready to help during my study.
I would like to thank Dr. A. Gray and Dr. L.T. Ruzicka for their advice, and Mr. Habtemariam Tesfaghiorgis for his encouragement and help. Thanks are also due to all the staff of the National Centre for Development Studies for their assistance.
I wish to express my gratitude to my office Central Statistical Office for permitting me to study and use the 1 983 Rural Health Survey data. I also wish to thank AIDAB for offering me a scholarship.
Finally, I would like to thank all the members of my family for their moral support and love.

iv
ABSTRACT
This study examines factors which are associated with child morbidity and utilization of health facilities in rural areas of Ethiopia. The study is based on childrenunder the age of six in the 1983 Rural Health Survey.
The levels and patterns of child morbidity by age and sex are discussed. Child morbidity appears to varyaccording to age, with children of age one having the highest rates. Generally, there are no significant sex differentials either in child morbidity or in utilization of health facilities. However, female children seem to have higher rates than males in the case of diarrhoeal andgastro-enteric diseases, which are the most prevalent diseases among children. The strong effect of sanitary facilities on child health status was also observed.
The relationship between some socio-demographiccharacteristics of mothers and child morbidity as well as utilization of health facilities are discussed. Religionand ethnicity of mother are observed to have a stronginfluence on child morbidity and utilization o f me dic alfacilities. Children of Oromo Chris tians and Am ha r aChristians were found to have the highest morbidity levels. Furthermore, maternal health status appears to have a positive association with child morbidity. On the other hand, literacy status of mother shows an adverse relationship with child health status.

V
TABLE OF CONTENTS
DECLARATION iiACKNOWLEDGEMENTS iiiABSTRACT iv1. INTRODUCTION 1
1.1 OBJECTIVES OF THE STUDY 11.2 GEOGRAPHICAL FEATURES 31.3 CURRENT DEMOGRAPHIC PROFILE 41.4 BACKGROUND CHARACTERISTICS 6
1.4.1 Mortality Levels 61.4.2 Health Status and Health Facilities 91.4.3 Nutritional Status 14
1.5 CONCEPTUAL FRAMEWORK 171.6 ORGANIZATION OF THE STUDY 20
2. METHODOLOGY AND PROBLEMS OF THE SURVEY 212.1 SOURCE OF DATA 212.2 SAMPLING METHODOLOGY 232.3 LIMITATIONS OF DATA 252.4 PROBLEMS OCCURRING IN THE SURVEY 27
2.4.1 Awareness of Illness 272.4.2 Memory Recall 282.4.3 Severity of Illness 30
3. CHILD MORBIDITY AND UTILIZATION OF HEALTH FACILITIES 32IN RELATION TO CHILD'S DEMOGRAPHIC CHARACTERISTICS3.1 AGE-SEX DIFFERENTIALS IN CHILD MOBIDITY 323.2 REGIONAL DIFFERENTIALS IN CHILD MORBIDITY 403.3 EFFECT OF SANITARY FACILITIES 443.4 AGE-SEX DIFFERENTIALS IN UTILIZATION OF HEALTH 48
FACILITIES4. MATERNAL CHARACTERISTICS AND CHILD MORBIDITY, 53
UTILIZATION OF HEALTH FACILITIES4.1 MATERNAL CHARACTERISTICS AND CHILD MORBIDITY 53
4.1.1 Literacy Status of Mother 534.1.2 Religion And Ethnic Group of Mother 574.1.3 Age of Mother 614.1.4 Maternal Health Status 63
4.2 MATERNAL CHARACTERISTICS AND CHILD'S USE OF 64HEALTH FACILITIES4.2.1 Maternal Literacy Status 654.2.2 Religion and Ethnicity of Mother 68
4.3 LOGIT LINEAR MODEL ANALYSIS 715. SUMMARY AND CONCLUSION 76REFERENCES 80

Appendix A.
Appendix B.
Appendix C .
v i
Logit Linear Main Effects Model For the 87Effects of Child's Age, Sex, and Maternal Age, Literacy and Ethno-religion on Child Morbidity
An Example of the Computation of Indirect 88 Standardization by Literacy Status Used in Table 3-6 (column (c) panel two)
1983 Rural Health Survey Questionnaire 89

vii
LIST OF FIGURES
Figure 1-1:
Figure 2- 1 :
Relationship Between Child Morbidity, 19Socio-economic Determinants, and Proximate Determinants: A Conceptual FrameworkMap of Ethiopia 24
viii
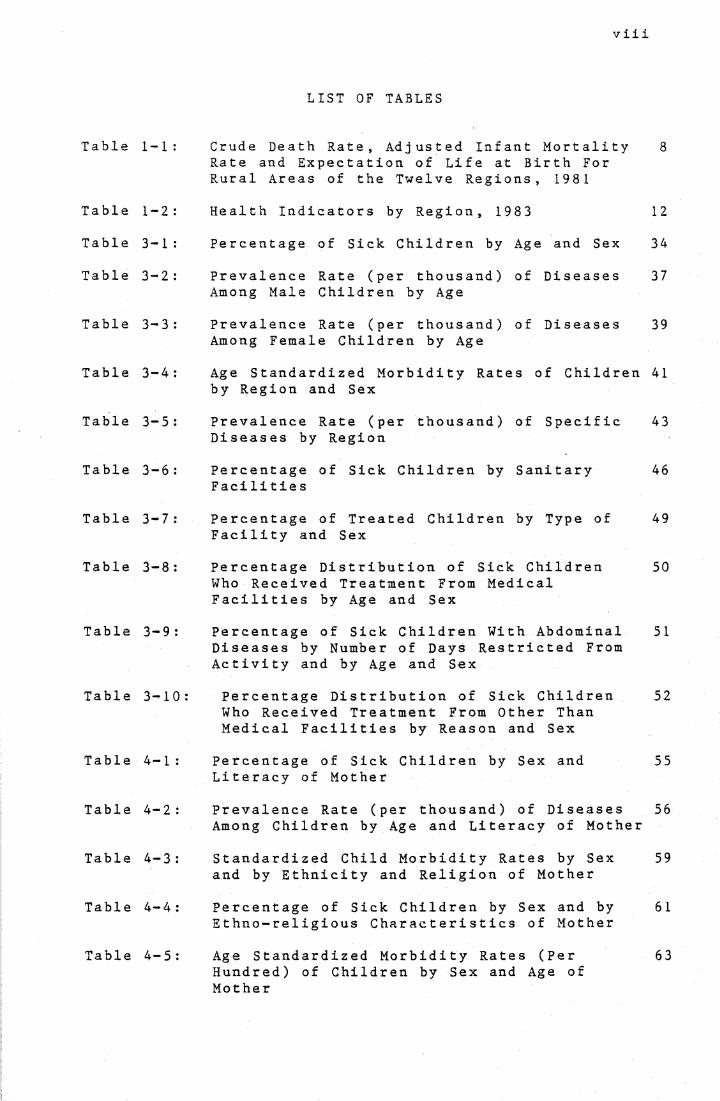
LIST OF TABLES
Table 1-1 : Crude Death Rate, Adjusted Infant Mortality Rate and Expectation of Life at Birth For Rural Areas of the Twelve Regions, 1981
8
Table 1-2 : Health Indicators by Region, 1983 12Table 3-1 : Percentage of Sick Children by Age and Sex 34Table 3-2 : Prevalence Rate (per thousand) of Diseases
Among Male Children by Age37
Table 3-3 : Prevalence Rate (per thousand) of Diseases Among Female Children by Age
39
Table 3-4 : Age Standardized Morbidity Rates of Children by Region and Sex
41
Table 3-5 : Prevalence Rate (per thousand) of Specific Diseases by Region
43
Table 3-6 : Percentage of Sick Children by Sanitary Facilitie s
46
Table 3-7 : Percentage of Treated Children by Type of Facility and Sex
49
Table 3-8 : Percentage Distribution of Sick Children Who Received Treatment From Medical Facilities by Age and Sex
50
Table 3-9 : Percentage of Sick Children With Abdominal Diseases by Number of Days Restricted From Activity and by Age and Sex
51
Table 3-10 : Percentage Distribution of Sick Children Who Received Treatment From Other Than Medical Facilities by Reason and Sex
52
Table 4-1 : Percentage of Sick Children by Sex and Literacy of Mother
55
Table 4-2 : Prevalence Rate (per thousand) of Diseases Among Children by Age and Literacy of Mother
56
Table 4-3 : Standardized Child Morbidity Rates by Sex and by Ethnicity and Religion of Mother
59
Table 4-4 : Percentage of Sick Children by Sex and by Ethno-religious Characteristics of Mother
61
Table 4-5 : Age Standardized Morbidity Rates (Per Hundred) of Children by Sex and Age of Mother
63

ix
Table 4-6: Percentage of Sick Children by Mother's 64Health Status and Age
Table 4-7: Percentage of Sick Children Who Received 66Treatment by Type of Facility and Literacy Status of Mother
Table 4-8: Percentage Distribution of Children Who 67Received Treatment From Other Than Medical Facilities by Reason and Literacy Status of Mother
Table 4-9: Percentage of Treated Children by Type of 70Facility and Ethno-religious Group of Mother
Table 4-10: Percentage Distribution of Children Who 70Received Treatment From Other Than Medical Facilities by Reason and Ethno-religious Group of Mother
Table 4-11: Logit Linear Main Effects Model For the 74Effects of Child's Age and Ethno-religion of Mother on Child Morbidity

1
CHAPTER 1
INTRODUCTION
1.1 OBJECTIVES OF THE STUDY
Levels of infant and child mortality have been used as indicators of the health and development of a population. Recently the study of morbidity has also been used in assessing community health in both developed and developing countries. On the other hand, the incidence and prevalence of various diseases have been taken as important determinants of mortality in a population (U.N., 1982:141). Schell (1986:322) has mentioned that morbidity and mortality are the primary indicators of community health.
A number of studies have investigated the relationship between socio-economic and demographic variables and child morbidity; and education has been observed as an important factor in explaining the morbidity differentials (Bhuiya et al., 1986; Chojnacka and Adegbole, 1984). Education exerts a strong effect on morbidity through parental attitudes and beliefs about health (Ware, 1984:200). Mother's education particulary can have an influence on her choices and skills in the practice of health care (Mosley and Chen, 1984:35).
Recently a new conceptual framework for studying child survival in developing countries was proposed by Mosley and Chen (1984). This framework suggests that all socioeconomic factors should operate through a set of proximate determinants: 'maternal factors', 'personal illness control factors', 'environmental contamination factors', 'injury'

2
and 'nutritional deficiency'. Of these, the first three factors are taken into account in this study because information on 'injury' and 'nutritional deficiency' is not available in the survey.
In Ethiopia, the limited information usually contained in hospital records greatly restricts the analysis which can be carried out using morbidity data. Yet very little is known about the pattern of morbidity and the associated factors. Thus, this may create difficulties for planners in formulating health policy, especially concerning children's health care and welfare.
The present study aims to examine differentials in child morbidity in rural areas, in order to identify factors that are associated with child morbidity, and which will be useful to health planners. The major objectives of this study are:
1. To find out the pattern of child morbidity by age and sex.
2. To examine regional differentials in child morbidity.
3. To assess the effect of sanitary facilities, which is one of the 'environmental contamination' proximate determinants, on child health status; and
4. To examine variations in child morbidity in relation to maternal socio-demographic characteristics. The relationship between the mother's characteristics and the mother's behaviour in taking care of the child through the use of health facilities will also be assessed.

3
1.2 GEOGRAPHICAL FEATURES
Based on the wide range of altitudes which result in different temperate conditions, Ethiopia is categorized into three climatic zones: the temperate plateau, the intermediate frost-free zones and the hot lowlands (Last, 1983:343). As well as the division based on climatic conditions between the regions and within the regions, Ethiopia is divided into four major physiographic regions according to geological process: the Northwestern Highlands and Associated Lowlands, the Southeastern Highlands and Associated Lowlands, the Rift Valley, and the Afar Block Mountains (Mesifin, 1972).
The Northwestern Highlands and Associated Lowlands is the largest physiographic region which covers about 43 per cent of the total area of the country. This region comprises six administrative regions, Gojam, Gonder, Kefa, Illubabor, Shewa and Wellega, and parts of Gamo-Gofa, Eritrea, Tigrai and Wollo. About 60 per cent of the population, as well as the most densely populated areas, is found in this region. The second physiographic region includes four regions: Arssi, Bale, Harage and Sidamo . With the exception of the Hararge plateau and some highland parts of Arssi and Bale, the region is inhabited by nomadic and semi-nomadic pastoralists . The third region, the Ethiopian Rift Valley, is a funnel-shaped depression which separates the two physiographic regions. This Rift Valley is part of the longest Rift Valley in the world that starts from Syria

4
and extend to Mozambique. The fourth region comprises a mountainous area found between the southern Coastal Plains and the Afar Depression. This region has very little rain, therefore vegetation, animals and human life are limited (Mesifin, 1972).
In general, rural settlements are located on the tops or slopes of hills and upper sheltered terraces of river valleys. It is very rare that people live directly on river banks and lake shores, because malaria is wide-spread near rivers. Dispersed settlements are the most typical; that is, farmsteads including from two to six separate families with adjacent plots. This type of settlement is partially due to the spread of some local principal food crops the cultivation of which does not permit the building of compact villages .
Ethiopia is a country with a wide variety of natural conditions, and a population composed of many ethnic groups which are distinguished by separate cultures and languages. Oromos and Amharas are the two dominant ethnic groups. The Oromos are found in all the regions of the country except Tigrai and Eritrea regions, whereas, the Amharas are concentrated in Gonder, Gojam and Shewa, highland regions, and are predominantly Christians (Lipsky, 1962:34).
1.3 CURRENT DEMOGRAPHIC PROFILE
In Ethiopia, the first Population and Housing Census was conducted in 1984. According to the results, Ethiopians population is growing fast at a rate of 2.9 per cent per

5
annum (Central Statistical Office, 1985a:3). With an area of 1,221,900 square kilometers, Ethiopia had a population size of 42.2 million in 1 984 giving an average population density of 33.6 persons per square kilometer. However, the population density varies between regions from as high as 95.1 persons per square kilometer in Shewa to as low as 7.9 persons per square kilometer in Bale region.
Like other developing countries, Ethiopia has a young age distribution. Children under 15 years make up 47 per cent of the total population, while only 4 per cent of the total population is above 65 years. Thus, the dependency ratio is very high. The census results show that the median age of the population was about 17 years in 1984 (Central Statistical Office, 1985a).
Ethiopia is one of the least urbanized countries. Based on the Central Statistical Office (CSO) definition of urban used in the census, only 10.6 per cent of the total population resided in urban areas in 1984, compared to 32 per cent for the whole of Africa. Even though the degree of urbanization is very low, there has been rapid urban growth during the last two decades. Between 1 966 and 1970 , thee stimated urban growth rate was 6.6 per cent per annum,whi c h wa s very fast. But in the recent past, during theperiod 1970-84, it has declined to 4.2 per cent pe r annum.There has also been observed a highly uneven spatialdistribution of urbanization between the regions. The most urbanized regions appear to be Eritrea and Tigrai with levels of urbanization of 14.4 and 10 per cent respectively.

6
Shewa and Hararge regions follow with 8.3 and 7.4 per cent respectively, whereas, the least urbanized regions were Gamo-Gof a , Wellega, Kef a and Illubabor with less than 5.5 per cent (Habtemariam , 1986 ).
1.4 BACKGROUND CHARACTERISTICS
This section discusses the health-related characteristics of the population. It presents some health indicators such as mortality levels, health status, accessibility of health services and nutritional status of the population.
1.4.1 Mortality Levels
Data on mortality levels in Ethiopia are very limited. Mostly they have been estimated from several sample surveys, beginning in the 1960s, which were conducted by the CSO. However, these estimates were subject to error because of the data quality (reporting errors and non-responses).
Estimates of infant and child mortality are found to be very high in Ethiopia. Based on the second round National Sample Survey, the adjusted infant mortality rate for rural areas was estimated to be 155 per thousand live births, in the period 1968-71, declining to 144 per thousand live births in 1981, which is still high compared to other developing countries (CSO, 1984). For the same year, child mortality was also found to be as high as 247 per thousand (Ministry of Health, 1980). However, according to U.N. (1984) estimates, the infant mortality rate decreased from

7
167 per thousand live births in the period 1965-70 to 155 per thousand live births in 1975-80. These inconsistencies occur because of the unreliablity of data and the improvement of the accuracy of estimates. Even though the amount of the decline could not be determined, the evidence shows that mortality is declining.
Most of these surveys show consistent results with demographic findings for other countries on mortality differentials between urban and rural areas; that is, a lower mortality level in urban than rural areas. For 1969, Habtemariam (1979) found an infant mortality rate of 151 and 141 per thousand live births for the rural and urban areas respectively. For the same year, a substantial regional variation in mortality was seen from as low as 123 in Shewa to as high as 193 in Gamo-Gofa. The reason given by Habtemariam is that the concentration of health facilities in Shewa administrative region might lead to this regionhaving the lowest mortality rate. On the other hand , in
1981 infant mortality wa s es timated by the CSO, to be as
low as 117 in Wei1ega and as high as 171 in Ke f a , as shown
in Table 1.1 (CSO , 1 9 84:76 ).
In regard to age-sex differences in mortality, the rural male population has a higher mortality rate than rural females for the age group 0-14 and above 50 years of age. However, during the childbearing ages, 15-49 years, the female mortality rate is seen to be higher than the male
(CSO, 1984).

8
Table 1-1: Crude Death Rate, Adjusted Infant MortalityRate and Expectation of Life at Birth for Rural
Areas of the Twelve Regions, 1981
AdministrativeRegion
CrudeDeath Rate
InfantMortality Rate
LifeExpec tancy
Ar s s i 19 . 4 149 45 . 1Bale 22 . 2 170 41.9Gamo Gofa 19.8 154 44.4Go j am 20.4 158 43.7Gonder 15.3 120 50.0Hararge 21.5 166 42.4Illubabor 18.9 145 45.8Ke f a 21 .7 171 41.9S hewa 16.7 131 48 .2S.idamo 17.7 136 47.3Wei1ega 15.1 117 50.7Wollo 18.9 145 45.8
Total 18.4 144 46.0
Source: The Demographic Survey 1980/81.
In a detailed study of Arssi administrative region, based on the 1981 Demographic Survey, Kebede observed no significant mortality differentials by sex, but differentials by some other characteristics were seen. Infant and child mortality was observed to be higher among Moslems than Christians; this was explained by the literacy differences between these two religions (Kebede, 1986). Similarly Genet (1987) found no significant sex

9
differentials for the two regions, Gonder and Hararge. They both observed that Amhara Christian women have lower infant and child mortality than Oromo Moslem women.
Levels and trends of the maternal mortality rate (MMR) have not been studied in Ethiopia. However, recently, in 1982/83 a community level study, has been carried out in the capital city, Addis Ababa, by Kwast et al . ( 1984 ). They found a maternal mortality rate of 5.66 per thousand live births which includes deaths from abortion.
Considering the high level of mortality, the government has formulated some•targets in the ten-year perspective plan (1985-1994). The main objective is to reduce infant mortality and child and maternal mortality by 60 and 50 per cent respectively by 1990. It also attempts to give special attention to the quality of maternal-child health services (U,N. , 1984 : 4-5 ) .
1.4.2 Health Status and Health Facilities
Ethiopia is one of the countries which suffer from unreliability and scarcity of data on morbidity and mortality. This creates a major obstacle to efficient and comprehensive health planning. Hospital and health institution records have been used as an indicator of general morbidity as well as a measure of the country's health status (Ministry of Health, 1980).
Generally, it is accepted that malnutrition and communicable diseases are widespread in the country. From

hospitals records, it has been observed that about 4 percent of the total number of in-patients died in 19 7 5 . Of these hospital deaths, malnutrition and tuberculosis accounted for 6.9 and 6.6 per cent respectively. In 1982/83, the Ministry of Health (MOH) found that tuberculosis and pneumonia were the two major causes of hospital deaths with about 12 and 9 per cent respectively. In the same year, dysentries and gastro-enteritis , Helminthiasis (worms), and eye disease were the three leading causes of out-patients morbidity with 8.9, 7.7 and 5.3 per cent respectively (MOH, 1986:xi). A study carried out by the MOH (1980:20) indicated that about 70 percent of the total deaths were among children under the age of 5. Based on the first Morbidity Survey in 1982, the CSO (1985b:40) found that abdominal diseases which include diarrhoea, gastroenteritis, parasites and pain in stomach, have been the most serious health problems with prevalence rates of 108 per thousand among children (under age 5) whoreported an illness.
Health services are relatively poor in Ethiopia. The MOH (1980:20) report indicates that only 15 per cent of the Ethiopian rural population have access to modern healthservices. In these areas, about 5 per cent of thepopulation use the facilities. Thus, the impact of these facilities is very limited. This could be because almost 80 per cent of the rural population prefer to use traditional medicine. The communication and accessibility problem could also be another reason for the number of users of thesefacilities being low. Over 85 per cent of the population

lives 30 km. or more from an all-weather road, where most people travel on horseback, mule or foot (Solomon, 1 985: 868). According to the MOH report (1980:20), the highest utilization rate of health services observed was for the population aged over 45 years, followed by children below age 5. The lowest utilization rate was seen among the age group 5-14, which probably has the lowest morbidity levels.
A census of health facilities carried out by the MOH in1983/84 revealed that there are 83 hospitals , 141 healthcent res and 1949 health stations all over the country, no tincluding facilities run by police and armed forces. There are considerable variations in the distribution of health facilties by regions. Excluding Addis Ababa; for example, the number of hospitals varies from 15 in Eritrea to one each in Bale, Kefa and Asseb. It has also been seen that the number of services is increasing, since the government has formulated a plan to improve the facilities. For instance, the number of hospitals and health centres increased from 54 and 41 respectively in 1961, to 83 and 141 by 1983 . Even though there has been some improvement in these facilities, since these increments are slow considering the population growth, the ratio of physicians to the population is still low, ranging from about 1:18,000 in Asseb and 1:49,000 in Eritrea to 1:312,000 in Gamo-Gofa (see Table 1-2).
Health interventions have played an important role in child survival, especially in preventable diseases through

Table 1-2: Health Indicators by Region, 1983
AdministrativeRegion
Numbe r s of Hospitals
Population per Medical doctor
Population per Nurse
Ar s s i 2 127864 3865 7Bale 1 167749 28757Eritrea 15 52294 13139Gamo Gofa 3 312008 27131Go j am 3 216325 40060Gonder 3 60857 32822Hararge 10 99075 37829Illubabor 2 120494 28352Ke f a 1 163358 3025 1S hewa 10 212910 4086 1Sid amo 5 164808 34460Tigrai 4 185362 30503Wei1ega 4 117966 245 27Wollo 5 165546 47 299Asseb 1 1 78 60 372 1Addis Ababa 14 57 89 2167
Total 83 57867 21523
Source: Compiled from Ministry of Health, ComprehensiveHealth Services Directory,1986: 10-12,Tables B and D.
immunization, improved sanitation and access to health services (U.N., 1982). However, immunization services are not widely spread and ante- and post-natal services are not adequate. Thus, infant mortality is still high and most infant deaths are preventable (Solomon , 1 985 ;

Mammo , 1 983 ) . The UNICEF ( 1 986 ) report which gives thepercentage of immunized children for 1983 shows that only about 9, 16 and 9 per cent of one-year old children werefully immunized against DPT, Measles and Polio,respectively. Compared with other developing countries, these are the lowest levels of immunization coverage.
On the other hand, traditional practitioners are widely used and usually practise not only curative but also preventive medicine. Usually pregnant and lactating mothers are restricted to certain foods, which differ according to different ethnic groups. Burning the skin over the diseased part of the body is used as one of the traditional curativepractices. Bone setting and massage to loosen up muscles and stiff joints are greatly practised by the wo ge s ha (healer). However, there are also some harmful practices like removal of tonsils by means of a nail, cutting the uvula, and pulling out healthy children's teeth (MOH,1 980: 15-1 6 ) .
Considering the high prevalence of malaria, which was the major problem before 1958, the government implemented a development plan to reduce the rate through an eradication campaign beginning in 1959. This campaign was carried out by the malaria eradication project which is now called the Malaria Control Programme. Even though this campaign wassuccessful, that is, blood parasite rates were below 5 per cent which was the target in 1 980 , there are still some areas where this disease is widely seen (MOH, 1980).

14
Despite these efforts in the past the health problem remains great. Recently the government has launched a 10- Year Perspective Plan (1985-1994) which has a Health Plan as an integral part. The major objective of the health plan is to reduce the morbidity and mortality rate of the country through the primary health care strategy. This approach includes immunization against communicable diseases, the improvement of sanitation, the provision of clean water and improvement in nutritional levels. The target of this plan is to improve the health infrastructure and to increase health care services coverage to 85 per cent of the rural population by the year 1990. Furthermore, an effort is being made to expand health training institutions. Programmes like malaria control and family planning are also being emphasized (U.N., 1984:4-5). Until now family planningin Ethiopia, which is mounted by a voluntary organization called the Family Guidance Association of Ethiopia (FGAE), has had little impact on the country's level of fertility. This is because the services cover only the urban areas where hospitals and health centers are located (FGAE, 1983:8-9). Thus, the family planning services reach only about 1-2 per cent of women of reproductive age (CSO, 1 984: 105 ) .
1.4.3 Nutritional Status
Nutrition is necessary for growth and survival of children. Problems of nutrition directly affect people's health. In the, first stage of life, a baby's survival depends on the nutritional and health status of its mother

during pregnancy. It has been observed, in both developed and developing countries, that neonatal mortality is higher among infants whose birth-weights were 2.5 kilograms or less (Puffer and Serrano, 1973). According to the UNICEF (1986) report, during the period 1979-83, 13 per cent of Ethiopian infants had low birth-weight.
In the next stage of life, the nutritional status of infants depends on feeding practices, including breastfeeding. In Ethiopia, a high percentage, 97 and 95 per cent, of mothers were breastfeeding their children for 6 and 12 months respectively (UNICEF, 1986). However,according to the World Health Organization (1981:131)report, about 15 percent of these children age 12 monthswere still being breastfed with no other supplementary food given. From other studies, such as in India, it has been observed that late introduction of supplementary food may lead to a lower rate of growth and other health problems (World Health Organization, 1981:131). Similarly in Ethiopia, breastfeeding without introduction of solid foods for longer periods is found to reduce the nutritional status of the child. The older mothers reported breastfeeding without supplementation for longer periods than young mothers (Ethiopian Nutition Institute, 1986). Generally, during the period 1 975-8 3 , about 10 and 60 per cent of children under five were suffering from severe and mild/moderate malnutrition respectively (UNICEF, 1986).
The nutritional status of children is usually measured by use of anthropometric measurements such as weight for

age, height for age and arm circumference. Thus, based on this kind of measurement, in May and June 1984, a survey was carried out by the Ethiopian Nutrition Institute (ENI). This study covered a total of 5330 children under age five from one awraja (sub-region) , Sidama. The study mainly focused on differentials in nutritional status among urban and rural children. The data showed significant differences in anthropometric status between urban and rural children. The average weight for age was found to be 80.5 per cent of reference median value for rural children, and 85.8 per cent of reference median value for urban children. Up to 12 months of age, the mean weights and the mean heights of all children were found to be similar to the standard. But following this age the yearly growth observed is less than the standard. .Looking at both sexes separately, the data show a similar pattern for male and female children.
The other important anthropometric measurement, height of children, was observed in the ENI study in relation to maternal characteristics. The result shows no differentials in the heights of children either for those who belong to mothers from various religious groups or for those who belong to older versus younger mothers. However, literacy status of mothers shows a different result from the above discussed maternal characteristics. It has been seen that the heights of children are better for those whose mothers are literate than those whose mothers are illiterate. Similarly both weight for height and weight for age show the mother's literacy status to be important in determining nutritional status (ENI, 1986).

17
1.5 CONCEPTUAL FRAMEWORK
In this study, an attempt was made to follow the Mosley and Chen analytical framework. This framework shows the relationship of socio-economic variables and the dependent variables, mortality or morbidity, through proximate determinants (Mosley and Chen, 1984). In this section, some modification has been made in relation to some available predictors to this structural study of child morbidity. Figure 1-1 shows only part of the relationship between the socio-economic determinants, the proximate determinants and the child morbidity which this study covers.
Morbidity is influenced by the socio-economic determinants. In this case it is influenced by two predictors: educational status and cultural determinants, which include religion and ethnic group. Educational status has an impact in the choice of effective treatment facilities and the use of better sanitary facilities. On the other hand, education has an effect on morbidity through cultural determinants by changing the attitudes towards traditional beliefs. Here, educational status will be measured as a dichotomy between illiterate and literate. The literature has noted that education, especially maternal education, operates directly on many proximate determinants by influencing mother's choice and increasing her skills in child care practices (Cochrane et al.,1980; Ware, 1 984 ;Caldwell,1979)

18
Mosley and Chen ( 1 984 ) noted that one of the proximate determinants is "personal illness control" which has an effect on morbidity. This includes prevention and treatment which influence the rate of illness, and rate of recovery, respectively. However, the empirical analyses only consider the effect of socio-demographic factors on utilizing health facilities for treatment because of the limitations of the data; that is, preventive measures are not available. Considering the other proximate determinants, the available variable which has been assumed here to have an effect on child health status is maternal age. It has also been argued that children's exposure to diseases, particularly in developing countries, is conditioned by environmental sanitation, among other things.
Here, it has been assumed that religion and ethnicity have some effect on beliefs that are related to causation of disease, since religion plays a big role in Ethiopia (Scwamb, 1985:92). Thus, choosing or practising the types of treatment, traditional or modern treatment, depends on these variables. Cultural determinants could also have an impact on morbidity through sanitary practices and feeding habits of children. Studies show that different food restrictions or food taboos are practised by traditional societies as a result of different culturalbeliefs (Odebiyi, 1977).

19
Proxima Ce De terminanes
Age of Mother
Socio-economic De t e rminan t s
Educational SanitaryFacilitiesStatus
Cultura1 De te rminan t s i.e. religion and ethnicity
HealthFacilities
>
V
Morbidity
l \
Figure 1-1: Relationship Between Child Morbidity,Socio-economic Determinants, and Proximate Determinants: a conceptual framework (derivedfrom Mosley and Chen proximate determinants f ramewo rk )
Notes: 1. The term sanitary facilities refer to the useof driniking water supply, place of defaecation and availability of garbage bin in the household.
2. Health facilities indicates treatment received from either modern health services such as hospital and health station or traditional practitioners .

20
1.6 ORGANIZATION OF THE STUDY
The study is organized into five chapters. In Chapter 2 the data source and methodology are presented. Chapter 3 deals with differentials in child morbidity and the utilization of health services in relation to the child's demographic characteristics. Regional differentials and the effect of sanitary facilities on children's health status are also assessed in this chapter. Chapter 4 examines the relationship between the child's morbidity and maternal characteristics. In addition, multivariate analysis is carried out in this chapter. Finally, Chapter 5 presents the findings and conclusion of the study.

21
CHAPTER 2
METHODOLOGY AND PROBLEMS OF THE SURVEY
This chapter deals with the source of data, sampling methodology, limitations of data and, finally, discusses problems that occurred in the survey and which may introduce some bias into the results of this study.
2.1 SOURCE OF DATA
The study uses data from the Rural Health Survey of Ethiopia that was undertaken during late January 1983. This survey was one of two rounds of health surveys, which were conducted during 1982-83 by the Central Statistical Office as part of a Rural Integrated Household Survey Programme (RIHSP) (see section 2.2 for sampling framework).
In this survey, all members of the selected households who were present during the interview (except children) were asked by enumerators (non-medical persons) to give information on some socio-demographic characteristics, perceived morbidity, injury, and source of treatment in the 14 days prior to the survey date. The morbidity information was obtained by asking whether or not the respondent was ill during the reference period. If the respondents reported they were ill, then a further question was asked about the types of disease they suffered from. To make sure that the reported disease classification was right, enumerators were told to ask the symptoms and compare them with their supplied list of symptoms and their diseases category. For

22
members of the selected households who were not present during the interviewing time, proxy reporting by a member of the family was accepted. In the case of children, the mother or any adult who was a member of the family was interviewed. For each selected household, information was also gathered on sanitary conditions.
There were 12,858 children under the age of six covered by the survey. However, for this study a subset was made and only 1 1 , 962 children (93 per cent of the total) of the head of the household under age six have been selected. Along with each child's data, some information on the child's mother and the household sanitary conditions was included for the analysis, to examine the relationship between maternal characteristics and the child's morbidity. The selected maternal variables include information. on socio-demographic characteristics (eg. age, literacy, religion, ethnic group) and morbidity of the mother; while the household sanitary variables include information on availability of pit-latrine and refuse disposal (garbage bin); drinking water supply; and whether or not domestic animals stay the night in the same housing unit as the members of the household. This question arises because, in rural Ethiopia, particularly in poor households, domestic animals have been seen to stay the night in the housing unit. Even if people make some partition, it is just a cover for the animals in the corner of the room.
The remaining 7 per cent of the children whose parentswere not heads of the households but where the children are

23
relatives of heads of the families were excluded. This is because in the case of an extended family, it is difficult to merge the actual mother's information and the child's record. For example, in a household where two or more women who have children are living together, there is no way of identifying the actual mother of the child using the available codes, since in this survey codes used for grandchildren, cousins and aunts are the same.
2.2 SAMPLING METHODOLOGY
The 1983 Rural Health Survey was based on a two-stage stratified sample design. This survey covered the rural sedentary population of only twelve of the fourteen administrative regions of Ethiopia, excluding Eritrea and Tigrai regions (see Figure 2-1). Stratification was carried out for each of the twelve regions at sub-regional level. The sub-regions (awraj as) were adopted as the first level of stratification, and thus 77 units were formed. Within each unit the Farmers' Associations (FAs), used as the primary sampling unit (PSU), were selected with probability proportional to the size of the administrative regions. In total, this yielded a sample of 500 FAs to be selected from the twelve regions. However, because of inaccessibility and other reasons the survey actually covered only 476 FAs.
A complete listing of all households in each of the selected PSUs was prepared. Using simple random sampling, 25 agricultural and 1 to 5 non-agricultural households were selected from the list of each PSU. All members of theselected households were eligible for interview Thus, the

24
LEGENDBOUNDARIESINTERNATIONALREGIONAL
LAKESRegions not covered by the Survey
ERITREA'
SUDAN TIGRALGULFOFADEN
GONDER
WOLLO
GO JAM
SOMALIAU SHEWA
HARARGE{ ARSSIILLUBABOR...-'
KEFABALE
i GAMOGOFA /
SIDAMO
SOMALIA
KENYA
Source: Adapted From Central Statistical Office (1984)Reproduced in Kebede (1986:4).

25
total population covered by the survey was 58,615 (Central Statistical Office, 1985b:7-9).
2.3 LIMITATIONS OF DATA
The survey was designed to study the types of illnesses experienced by the people, to identify the pattern of illness, and the types of treatment used. However, there are various limitations in the data.
The ma j o r limitation of the Rural Health Survey isthat it lacks one of the important socio-economicdeterminants, household income or other variables which could be used as a proxy for income, such as household property or husband's occupation, which could have been used in studying the morbidity differentials and usage of health services among the different economic groups.
Another limitation is that the data are for a particular period, the middle of the dry season, and thus it is impossible to study the seasonal peaks of certain diseases, such as malaria and diarrhoea. This also affects the findings of this study in terms of total morbidity rates, the utilization rates of treatment, and the patterns of illnesses.
It has been suggested by Mosley and Chen (1984) that respiratory diseases, which are an important cause of morbidity in many developing countries, can be inferred from the intensity of household crowding (number of persons per

room). However, lack of this information limits this study from assessing the relationship between communicable diseases, which are the major cause of infant deaths in Ethiopia, and the intensity of household crowding.
This study covers a special group of children, that is, only children of the head of the household. Thus, this prevents assessment of differences in morbidity between children of the head of the household and children of other relatives living in the same household.
Even though a symptom list relevant to rural conditions was prepared, the list did not include a category for traditional diseases which are recognized by the local people, such as 'evil eye'. When such diseases were reported, enumerators were told to ask the symptoms and record the disease in the classification which matched the reported symptoms. This might lead interviewers to mis- classify illnesses, and therefore, could cause bias in examining types of illnesses.
Furthermore, due to some proxy reporting by mothers, fathers or relatives, information about the children's illness may be misreported. As in many developing countries, there is age misreporting , in this case of mothers and children, which also affects the quality of the data. Age heaping on preferred digits 0 and 5 is seen. Especially in the case of children, there appear to be

reporting errors, particularly under-reporting at age one for male children and at age four for female children.
2.4 PROBLEMS OCCURRING IN THE SURVEY
There are considerable problems that affect the reporting of morbidity data. The next sub-sections discuss the three factors which influence the reporting of illness: awareness of illness, memory recall and severity of illness.
2.4.1 Awareness of Illness
Between different societies, there are differentials in perception of illness. It is observed that some societies do not consider even diseases that are major causes of death as illness. For example, in Mexican-American society, a disease like diarrhoea is not considered as an illness or abnormal condition (Clark,1 959 , cited in Greenley , 1 980 : 178 ) . Similarly, in societies of rural Egypt, it is believed that illness should be associated with pain or discomfort. Hence, diseases like bilharziasis and other parasitic diseases are not considered as illness because they do not cause pain (Read, 1966:24-37). Among individuals who have different socio-economic status the perception of illness also varies. Robinson (1971, cited in Greenley, 1 980 : 1 78 ) stated that chronic conditions are not reported by some individuals, especially among illiterates, because they are not seen as unusual.
In societies, where mild ill health is accepted as a normal part of life, people are usually treated by home
28
remedies for symptoms like mild fever and cough. The possible explanation given by Read is that this is due to cultural differences which bring about different responses to illness and the type of treatment required.
In this survey, an attempt was made to reduce enumerator bias by providing a list of symptoms of different diseases for the question on sickness in the last 14 days. Even though this list of symptoms was available, the individual's perception of illness has still a substantial effect on the level of morbidity as well as on utilization of health services. Since in rural areas people mostly hold traditional beliefs, the awareness of Illness could vary according to the different cultures prevailing in the country. Thus, these differences may affect the level ofmorbidity among regions and among different religious and e thnic groups .
It should also be mentioned that, even with a higher degree of training and with a list of symptoms, the chances of mis-c1assification of disease can never be eliminated. This may also cause some of the problems in the analysis in Chapter 3.
2.4.2 Memory Recall
Another problem which is likely to affect the quality of data is the mis-reporting of illness due to 'memory lapse'. The length of reference period is important incollecting retrospective data. Ross and Vaughan (1984:17- 18) suggested that errors due to memory lapse can bias the

29
results whatever the recall period chosen. However, theyr ec omme nd ed the use of either two weeks, or at most fourweeks, as reasonable recall period for morbidity andmortality variables.
Since this survey uses the two week recall period for questions on morbidity and treatment, the incidence of minor diseases or mild ill-health can be excluded from reporting because these can easily be forgotten. On the other hand, over-reporting can occur in the case where serious illness actually took place prior to the reference period.
In both developed and developing countries, respondents forget to report events because of ''memory lapse' . But this can vary from country to country with level of education in the society. To assess the magnitude of bias due to memory decline, Ross and Vaughan ( 1984 : 17— L8) suggested that a comparative study should be made between the daily interview and the longer recall period interview. But they also suggested that this could only apply to small sample surveys, since it is expensive to carry out for large sample surveys. For example, in the Addis Ababa morbidity survey, Freij and Wall ( 1 97 7 , cited in Ross and Vaughan , 1 9 84 ) , applyed the suggested comparison method and found that recent illness was over-reported in fortnightly interviews while previous illness was under-reported relative to the findings of the daily interview. Ross and Vaughan have suggested that the mis-reporting may have been due to either memory decline, omission of illness that took place during the reference period, or memory transfer of illness which

30
took place prior to the recall period. These kinds of mis- reporting might appear in this survey too, and could cause some problems in the findings of the study.
2.4.3 Severity of Illness
Severity of illness is also another variable which affects the quality of the health survey data. Most health interview surveys attempt to assess the severity of illness. Different kinds of questions have been used in various health surveys, like 'days unable to work' or 'days unable to carry out normal activities' but none of them are ideal. They all suffer from being dependent on personal situation (Ross and Vaughan, 1984: 23-24).
This health survey attempted to examine the severity of illness by asking 'days of restricted activity' for the symptom or condition reported. But like the above variables, this also depends on the nature of normal activities as well as on personal and cultural characteristics. For example, people with different ages or occupations, younger and older people or unemployed and employed, can have different levels of restriction with the same severity of illness (Ross and Vaughan , 1 984 : 23-24 ).
The level of seriousness of illness may also motivate individuals, in this case the mother of the child, to mention the perceived illness. This also leads individuals to use different health services for children with differentdegrees of illness severity Thus, this affects the attempt

to assess the level of use of different health facilities inChapters 3 and 4 .
These kinds of problems arise in most health surveys. But this varies according to education level and the role of cultural beliefs about illness in a society. In this survey the list of symptoms supplied to the enumerators is believed to reduce the problem.

32
CHAPTER 3
CHILD MORBIDITY AND UTILIZATION OF HEALTH FACILITIES IN RELATION TO CHILD'S DEMOGRAPHIC CHARACTERISTICS
The fatality rates of various diseases are influenced
by environmental (including sanitation and hygiene), social
and economic factors of the population (U.N.,1982: 141). In
addition, it is observed that incidence and prevalence rates
of various diseases differ according to variation in
demographic characteristics of the population.
This chapter deals with children's health status in
relation to their demographic characteristics: age and sex.
The distribution pattern of diseases that are categorized
into 11 major diseases, according to age and sex of the
child, is examined in detail. The effect of sanitary
facilities on children's health is also assessed.
Furthermore, sex differentials in taking care of children
are analysed through their use of health facilities.
3.1 AGE-SEX DIFFERENTIALS IN CHILD MORBIDITY
Sex differentials in morbidity have been examined in a
number of studies. However, the findings do not show
consistent differences in relation to sex. Verbrugge (1976)
conducted a study in the United States that covered all age
groups of the population and showed- the differentials and
trends of morbidity during the period 1958-72. . She observed
that there is excess female morbidity for most acute
conditions, and excess male morbidity for six chronic

diseases (diseases of the heart, other respiratory diseases including influenza and pneumonia, peptic ulcer, cerebrovascular, bronchitis and impairments) which cause high mortality. But overall chronic conditions were found to be more prevalent among females than males. Moreover, it was found that a higher percentage of males were unable to carry out their major activities, where major activities were defined according to different age groups. In contrast, Chen et al. (1981) found the reverse situation while analysing sex differentials in child morbidity, particularly in infectious diseases, using data on Bangladeshi children under age 5. The results revealed that incidence rates of infection were higher among males than females. However, the difference was found to be small and statistically insignificant. For instance, diarrhoeal attack rates were noted as 4.2 and 3.8 episodes per child per year for male and female children respectively; while respiratory diseases rates were 7.4 and 7.0 for males and females respectively.
A study done in Nigeria by Chojnacka and Adegbola (1984) assessed the age-sex morbidity differentials, but no clear pattern was observed. However, at infancy it was found that infectious diseases, which are the major diseases, affect more boys than girls with 21.1 and 14.9 per cent respectively.
In the present study, it was found that about 29 per cent of the 11,962 children covered in this subset had at least one illness during the reference period, 14 days prior

34
to the survey date. Of these, 25 per cent reported only one illness while the rest (4 per cent) reported two illnesses. However, in cases of multiple illnesses the respondent was asked to report the most important disease as the first type of illness. The pattern of the second illness was also found to be similar to that of the first illness, thus forsimplicity only the first- this study.
Table 3-1: Percentage of
■mentioned illness is
Sick Children by Age
analysed
and Sex
Age in Differences in PercentageYears Mai e Female Maie-Female
0 34.1 (1088) 31 .8 (1061) 2.31 34.7 ( 969 ) 36.2 (1061) -1 . 52 31.9 (1013) 29.9 (1014) 2.03 27 . 5 (1060) 24.6 (1010 ) 2.94 22.3 ( 972 ) 25 . 3 ( 891) -3.05 22 . 1 ( 935 ) 23.5 ( 930 ) -1 .4
Total 28.9 ( 6037 ) 28.7 ( 5925 ) 0.2
Note: Number s in brackets are the base numbers for thepercentages .
Source: Analysis of the 1983 Rural Health Survey subset.
Table 3-1 shows the age-sex specific morbidity rates of children; the sex differentials fluctuate from age to age and no clear pattern is observed. For children aged 1, 4 and 5 years, morbidity rates are found to be higher among females than males. But overall, the difference is seen to

be small, about 0.2 per cent, and statistically insignificant. This conforms to findings of other Ethiopian studies of mortality, completed in three regions, which show no significant sex differentials (Genet,1987; Kebede,1986). For both males and females, the morbidity rate reaches its peak at age 1, with a level of 35 per cent for males and 36 per cent for females, and then decreases as the children grow up. This observed differential could be due to exogenous factors (which will be discussed later in this study) or due to the immune system, that is, infants and toddlers are more likely to have less immunity (Johansson and Mosk, 1987:213).
The pattern of sickness in relation to age may differ according to various types of disease. Therefore, the prevalence rate of children at risk for specific diseases, the selected 11 major diseases and the residual group (other diseases), are shown in Table 3-2 and 3-3 for males and females respectively. Among all ill children, these tables show that diarrhoea and gastro-enteritis are the most prevalent. This conforms with observations all over the world, where diarrhoea is found to be the most prevalent childhood disease (Black et al . , 1983 : 141 ).
Table 3-2 indicates that about 73 per thousand male children were ill with diarrhoea and gastro-enteritis . It appears from this table that male children under age 2 experience this disease more than those who are older. This can be explained by contaminated supplementary food introduced at weaning age (Black et al., 1982:259-264).

36
For children above age 2, the prevalence of this disease declines with age. This finding seems to agree with the study in Bangladesh that reveals incidence of diarrhoeal disease to be high in the first two years of life (Black et al., 1983:80-83). In addition, a significant shift in the leading cause of illness from diarrhoea to 'other respiratory' is observed after the first two years of life.
The next most prevalent disease, with a rate of 55.3 per thousand male children, is 'other respiratory'. This category includes a very small percentage of tuberculosis, (about 0.3 per cent) and a large percentage of coughs and colds. The rates for this specific type of illness fluctuate from age to age and seem to reach their lowest level at age 4.
Benenson (1985:385-389) asserts that tetanus is one of the major causes of infant deaths. In the world, the case fatality rate of neonatal tetanus is higher than 80 per cent. However, in this study it is found that only 1 per thousand children suffer from tetanus at age one. One of the reasons could be because of the disease behaviour, it is an acute fatal disease from which children die quickly. Hence, their appearance is more likely in mortality studies than in this kind of survey. The other reason might be underreporting of the disease because mothers might not recognize i t .
Surprisingly, the level of malnutrition is found to be very low, about 7 per thousand (Table 3-2), compared to the findings of other reports in Ethiopia. According to the

Table 3-2: Prevalence Rate (per thousand) of DiseasesAmong Male Children by Age
Type of Age in YearsIllness 0 1 2 3 4 5 Total( A ) .Diarrhoea & Gastro-Enteritis 95.6 132.1 90.8 49 . 1 36.0 29 . 9 72.7Parasitic 7.4 20.6 22.7 28.3 19.5 26.7 20.7(B) .Whooping Cough 20.2 16.5 9 . 9 8.5 8.2 6.4 11.8Pneumonia 4.6 5.2 3.0 2.8 4 . 1 0.0 3.3Other Respiratory 68.9 48 . 5 6 6.1 58.5 37 .0 50.3 55.3(C) .Eye Infection 39.5 19.6 20.7 26.4 9 . 3 16.0 22.4Skin Infection 28.5 35.1 23.7 24.5 30.8 32 . 1 29.0Malnut rition 2.8 9 . 3 11.8 6.6 9.3 1 . 1 6.8Malaria 2.8 3. 1 4.9 2.8 4 . 1 3.2 3 . 5Measle s 5.5 6.2 3.9 5.7 8.2 7.5 6.1Tetanus 0.0 1.0 0.0 0.0 0.0 0.0 0.2Other Diseases 65.3 49 . 5 61.2 60.4 5 6.6 47 . 1 57.0
Total 341.0 346.7 318.9 27 3.6 223 .3 220.3 288.7Number of Cases 1088 969 1013 1060 972 935 6037Note: (A) - is the group of abdominal diseases.
(B) - is the group of respiratory diseases.(C) - is the group of diseases other than in groups
A and B.Source: As in Table 3-1.
UNICEF (1987) report, in 1980 about 10 per cent of children in Ethiopia were severely malnourished. Chen et al . (1981) asserted that malnutrition and infections have a bidirectional causal relationship. They also noted that the capacity of defending oneself against infections is partly

38
determined by the nutritional status of the person. Thus, the low level of malnutrition found by this study, could be because this condition mostly induces diseases such as infection, hence respondents might have reported the consequential disease as important rather than malnutrition (the underlying cause). However, the pattern seems as expected, that is, lower at infancy when mothers' milk is nutritionally adequate, and higher during childhood.
The prevalence rates of the selected diseases for females are given in Table 3-3. The distribution pattern (regardless of age) of these diseases is found to be similar to that for males except for malaria, measles and malnutrition. For instance, prevalence of diarrhoea and g as r o-e n t e r i t i s is the highest, as in the case of males, with 80 per thousand. Moreover, for children less than 2 years of age, the diarrhoeal morbidity pattern of males also holds for females. However, in general, the age-specific morbidity rates do not show as consistent a pattern as that for males. Even though the morbidity rates for most diseases are higher for females than males, the differences observed are minimal except for diarrhoea and gastroenteritis .
The residual 'other diseases' category has also shown high rates for both males and females. But this category is classified broadly, including diseases such as fever, typhus, meningitis, infectious jaundice, goitre, throat and ear infections, and teeth and gum problems.

39
Table 3-3: Prevalence Rate (per thousand) of DiseasesAmong Fema1e Children by Age
Type of Age in YearsIllness 0 1 2 3 4 5 To tal
(A) .Diarroea & Gastro-Enteritis 105.6 135.4 80.9 49 . 5 59 . 5 44.1 80.3
Parasitic 9.4 19.6 21.7 27.7 24.7 26 . 9 21.4
( B) .Whooping Cough 15.1 16.7 8.9 12.9 6.7 6 . 5 11.3
Pneumonia 3.8 3.9 1.0 4.0 2.2 1 . 1 2.7
Other Respiratory 53.7 60.8 67 . 1 54.5 53.9 58 . 1 58 . 1
(C) .Eye Infection 45.2 32.4 18.7 12.9 16.8 16.1 24 . 1
Skin Infection 31.1 25 . 5 24.7 24.8 23.6 28.0 26 . 3
Malnutrition 3.8 7.9 3.0 5.9 6 . 7 2.2 4.9
Malaria 1 . 9 2.9 4.9 5.9 9.0 6.5 5 . 1
Measle s 8.5 8.8 8.9 3.0 5.6 4.3 6.6
Other Diseases 39 . 6 41 .2 58.2 44.6 41.5 39 .8 44.9
Total 317.6 360.2 29 7.8 245.5 250.3 233.3 285.7
Number of Cases 106 1 1019 1014 1010 89 1 930 59 25
Note: (A) - is the group of abdominal diseases.(B) - is the group of respiratory diseases.(C) - is the group of diseases other than group
A and B.Source: As in Table 3-1.

40
3.2 REGIONAL DIFFERENTIALS IN CHILD MORBIDITY
The rate of sickness may differ according to different geographical areas; this is attributed to variation in climate, environmental setting and socio-economic factors. Table 3-4 displays the age standardized morbidity rates by sex of children for each of the twelve regions. Most of the rates are above 20 per cent. In four regions, Gonder, Illubabor, Wellega and Kefa, the morbidity rates exceed that of the country as a whole, which is about 29 per cent. The first three regions are found to have the highest morbidity rates with 59, 46 and 42 per cent respectively. Except in Shewa, which has a significantly lower rate, the rest vary from 21 to 29 per cent. It appears from this table that there is no significant sex differential in most of the regions. The largest gap is found in Gojam and Hararge with about 5 per cent of excess female morbidity.
Table 3-5 reveals the prevalence of different types of disease according to these regions. The age standardized rates in Table 3-4 are found to have a similar pattern to the unstandardized ones. This shows that the age composition does not vary much between these regions. Therefore, standardization was not carried out for Table 3- 5. It has been observed from this table that the prevalence of diarrhoea accounts for the highest level of morbidity found in Gonder. The Central Statistical Office (1985b) report confirms that in 1983 when the survey was carried out, an epidemic of diarrhoeal disease occurred in this region. Moreover, it is also seen that malnutrition is

Table 3-4: Age Standardized Morbidity Rates of Children By Region and Sex
Region Male Female To t al
Ar s s i 24.9 23 . 5 24 . 1 ( 1086 )Bale 21.3 22 . 9 21.8 ( 851)Gamo-Go f a 22.9 21.5 21 .9 ( 733 )Go j am 20.2 24.7 22 . 2 ( 949 )Go nd e r 57 . 7 60.7 59.3 ( 980 )Har arge 18.9 23.6 21.5 ( 897 )Illubabor 42.4 41.0 41 .9 ( 711)Ke f a 30.9 27 . 3 29 . 1 ( 814)S hewa 19.5 18.4 18.9 (2181)Sidamo 22.0 21.2 21.6 ( 783 )Wellega 46.3 45.6 45.7 (1303)Wollo 20.2 21.0 20.5 ( 674)
Total 28 . 9 28.7 28.8 (11962)
Note: Direct standardization is used; that is, thepopulation of the whole country is taken as standard.
Source: As in Table 3-1.

42
highest in this region. As discussed in the previous section, the deficiency of food intake has an association with diseases such as infections; thus, this could be one of the explanations for most of the diseases occurring more in this region than the others. Similarly, in Wellega, the level of malnutrition is found to be high. Hence, this poor nutrition may contribute to some extent to the observed high morbidity in Wellega region. However, in Illubabor, 'other respiratory' and 'parasitic' are the two extremely high prevalence diseases, which account for the observed high morbidity level. On the other hand, in Shewa, the high concentration of health services could be the reason for the observed lowest child morbidity rate. People in this region are more likely than people in other regions to be aware and seek modern health services because they are closer to the capital city, which has the highest number of health practitioners.

4 3
_on ax ax CD cm. ao o CD lO
3 urico LT1 CO n co ax04 S5 co co 55 MD
raaa r~. n CM xO sr ax n CO cz> CO 3*33
OX unn
ax nr co axn
unn
CO CD uo n
Oca in ax xO <o co CM vJD vJD n
r-i n- r>! 04 s n ax o* CO
sd) MD n n n xO xr ax CO -<r CD 53o3 s n cm 04 CN| uO o ico CM
(TJt ̂ -) vO CD uO _ <OS ao CD uO aoQJ CO •x> ax co unuO xO unCM r̂ . O co co
S-«.2 un uD 3 M" un n un CO 03 uO xH
COax CO S ao axCM -sr <oun <—
g• i—4
•■H x-h
04)CB
<1)ao MT ■rH -H COS x© ax n un CD co uD 3
> sJD SCMcn 3 cd CM ~<r CD ao
c a<U(T3QJca
Gon
dei
148.
0
37.8
12.2
3.1
78.6
76.5
89.8
15.3
23.5
uri
104.
1
980
a
1SS ao mt n CM xO C* CD n 3 n a ;
O s ao a >cr n co(N
ax un 3 u j 3CO' o— o ca r - I. •x un CD CO o un CM un MT na2
3 oCD CD COun
-<f ax <=> uo un un ad uri 3o
_0J -sr c m co o ^T CO xD -xr <os ^H uOn
a <a03 udun
co 3 VOCO
un 55 CM CD CO ao
O)
as 2 o sr MD CO co CO 3 CO co o uOCO
o •«2 S? m- un 55 2 unCM <3 CM H uO<r
3
a3
5cH
CO-M JO
>o
a C/3 s
Tab
le 3
-5:
c*-i caO 4)
caca a V a) cL ca
<xl <U ca aI fJO ot-. ufc. -UJca ca
o
COrafc-
32
a■rHa .o
nog■
£•rHCLcaa>ast_
|
o•H
8cm
r—<a>
o•rH
a>
►—1 a
a•rH■rH
Ü
<a
f3
caai
l a03
2<T320 k.1
COra
0
*o
1a
>» '«H 6— O
•f* flQO <̂D
roa*
JO3 £ >%
w 03 Ü s £ o az
n<u
5I—.s-S
ÖJEI

44
3.3 EFFECT OF SANITARY FACILITIES
This section focusses attention on sanitary facilities that are assumed to reduce infant and child mortality as well as morbidity. It is believed that there is a linkage between unsanitary environmental conditions and high rates of morbidity, especially among children. In developing countries faeco-oral transmission of diarrhoea-causing agents and enderaicity are high because environmental hygiene is poor.
Several studies have revealed the association between environmental sanitation and health status. In Keneba , Gambia, Rowland (1983:94-95) observed the association between poor sanitation and seasonal peaks in diarrhoea through high levels of food contamination. He found diarrhoeal disease to be prevalent during rainy seasons because of weaning foods being prepared from well water; since small children commonly defaecate within the compound of the house and the wells are not enclosed. Kune(1980:118) suggested that better hygienic conditions in child sleeping rooms appeared to influence child survival positively. Hobcraft et al . ( 1 98 2 , cited inCornia , 1 984 : 1 9 1 ) assessed the clear relationship between access to toilet facilities and child survival in Sri Lanka and Mexico. On the other hand, Feachem et al.,(1983) revealed that having good sanitation in individual homes will not protect members of families unless the overall community environmental sanitation and faecal contamination

is low. They studied the relationship between parasiticdisease and excreta disposal facilities in three urban areas of Africa: Botswana, Ghana and Zambia. They found no evidence of differences in parasitic disease among those who use different types of toilet facilities. Okediji (1975:293) also suggested that unhygienic neighbourhoods or environments can lead to epidemics of diarrhoeal diseases.
Since rural settlements in Ethiopia are widely scattered, household sanitary facilities are assumed to have a strong effect on health status. Table 3-6 shows the negative relationship between child morbidity rates and the five variables that are indicators of sanitary facilities. Standardization by literacy of mother is carried out (see Appendix B for the computation of indirect standardization) but it seems that literacy does not affect the presence of these facilities. A higher percentage of children in households which obtain their water from rivers and springs are found to be sick than in households which use piped water. This is the expected situation since piped water is mostly believed not to be contaminated and households with piped water are more likely to be wealthier, where income could contribute to some extent. The Chi-Square value and the corresponding low p values (all significant at the 1 per cent level) indicate the strong association between child morbidity and source of water supply.
In regard to toil-et facilities, the information on availability of a latrine in the house is a crude measure since children might not use it even if it is available.

Table 3-6 : Percentage of Sick Children By Sanitary Facilities
(a)Sanit ary Facilities
(b)Sick
Children(%)(c)
Standardized
(d)Diarrhoea & Gastro- Enteritis
(e)Other
Illness
Water Supply Pipe 12.7 ( 166) 12.7 3.6 9 . 1Lake 21.0 ( 347 ) 21.1 4.1 16.9Well 25.7 ( 826 ) 25 . 7 6.4 19.3Spring 29.8 (6087) 29.8 8. 1 21.7River 30.0 (4152) 30.2 8.0 22.0Other 20.2 ( 356 ) 20.0 5 . 1 15. 1
Chi-square = 53.81 , d . f . =5, p=0. 00
LatrineYes 22 . 2 (1044) 22.3 5.8 16.4No 29 .4 (10868) 29.4 7.8 21.6
Chi-square=23.42, d . f . = 1, p=0.00
Usually Defecate In the latrine 17.0 ( 488) 17.3 5 . 1 11.9Far from houses 23.6 (2225) 23.4 5.3 18.3In the back yard 30.6 (8274) 30.7 8 . 1 22.5Other 33.4 ( 854) 33.5 11.0 22.4
Chi-square=84.22, d.f.=3 , p=0.00
Garbage Bin Yes 17.1 ( 380) 17.2 5 . 3 11.8No 29 . 2 (11531) 29.2 7 . 7 21.5
Chi-square=25.58, d . f . = 1, p=0.00
Domestic Animals Yes 28 . 2 ( 9465 ) 28 . 3 7.4 20.8No 31.0 (2449) 30.9 8.7 22 . 3
Chi-square=6.89, d . f . = 1 , p = 0.0 1Notes: 1. The number of cases did not add up to 11962 due to
some non-response on sanitary facility questions.2. numbers in the brackets are base number for the
percentage.3. (b ) = (d) + (e)4. Indirect standardization is used for column (c)
(see Appendix B for an example of the computation).
Source: As in Table 3-1.

But the variable 'usually defaecate' is a better measure since it is a question about what children actually use. Here both variables are examined. The morbidity rate is seen to be lower among children who have a latrine in their house than children who have not. On the other hand, when looking at the variable 'usually defaecate' , children who defaecate in a toilet have the lowest morbidity rate followed by children who usually defaecate far from houses. Defaecating in the toilet is seen to be more likely to decrease the diarrhoea and gastro-enteritis rate than defaecating far from houses. This conforms to the findings of the Gambian study, where diarrhoea reaches its peak through faecal contamination (Rowland, 1983).
Regarding refuse disposal, the morbidity rate is lower among children who live in a house where there is a garbage bin than among those who do not. But surprisingly, children who have domestic animals in their sleeping room have a lower morbidity rate than those who have not. The difference is small, but based on Chi-square test this variable shows some association with child morbidity. Similarly, a significant association appears between all the other variables and child morbidity, based on the Chi-square test (see Table 3-6). It is interesting to note that poor sanitary facilities measured by these 5 variables attributed more to other diseases than diarrhoeal and gastro-enteric diseases. This could be because diseases like parasites and communicable diseases can also be spread through poor sanitation by vectors such as insects and flies.

48
3.4 AGE-SEX DIFFERENTIALS IN UTILIZATION OF HEALTH FACILITIES
Utilizing health facilities is considered as 'personal illness control', one of the proximate determinants of child survival (Mosley and Chen, 1984). On one hand this variable has an impact on health status; that is, if there are variations in utilizing health services particularly in use of preventive care, there will be health heterogenity (Rosenzweig and Schultz, 1983:743). On the other hand, studies show that using different health facilities could be affected by access and socio-economic factors of the individual or the household.
In Matlab, Bangladesh, utilization levels have been analysed among males and females for all age groups. There was found to be a marked difference in utilization rates between males and females, with average diarrhoeal treatment rates being 135.6 and 81.9 per thousand among sick male and female children under age five respectively (Chen et al., 1 98 1 : 6 4-6 5 ) .
In this study a different pattern of utilizing facilities was observed among male and female children. Among all sick children about 33 and 34 per cent of males and females, respectively, received treatment from one of the facilities (Table not shown). Of these children who received treatment, most were taken to medical facilities, which include hospitals, health stations and health centers (see Table 3-7). There is little sex difference in usageof medical facilities. 'Traditional healer' is the next

Table 3-7: Percentage of Treated Children by Type of Facility and Sex
Type of Facility Male F emale
Medical Facilities 40.2 41 .4Pharmacy 15.1 15.5Traditional Healer 20.7 18.6Lay Treatment 17.9 15.5Self Treatment 4.9 6. 1Unqualified Person 3.7 5.2Number of Cases ( 575 ) ( 575 )
Note: 1. The number of cases is the total number of childrenwho received treatment from one of the facilities.
2. Respondents could mention more than one facility.3. Medical facilities include hospitals, health
centers and health institutions.Source: As in Table 3-1.
most frequent facility among both male and female children. 'Self treatment' and 'Unqualified person' are found to be the least used. It also appears that female children areslightly more frequent users of modern services (in this study these include medical facilities and pharmacies) than males .
Since utilization of different treatments depends onthe type of disease, i t is plausible to look a t theutilization rate of those who were sick with commondiseases . Therefore , the utilization rates are shown forthe two groups of disease that are most prevalent. Table 3-8 presents the percentage of children who were sick with

50
Table 3-8: Percentage Distribution of Sick Children WhoReceived Treatment from Medical Facilities
by Age and Sex
Type of Disease &Age in Years Male Female
Abdominal Diseases0 22.3 (112) 18.0 (122)
1-2 16.3 ( 263 ) 21 .0 ( 262 )3-5 7.9 (189) 8.7 (219)
Respiratory Diseases0 15.7 (102) 16.9 ( 77)
1-2 10.8 (148) 15.5 ( 161 )3-5 8.6 ( 175 ) 3.2 (189)
Note: Abdominal Diseases include diarrhoea, gastroenteritis and parasitic diseases.
Source: As in Table 3-1.
abdominal diseases and respiratory diseases and who received treatment from medical facilities. For children who were exposed to abdominal diseases and respiratory diseases the medical facilities utilization rate decreases as age increases. Male children who suffer from abdominal diseases at infancy are more likely to be users of medical facilities than females. This can be due to severity of illness rather than sex discrimination in using a medical facility. Table 3-9 shows that more male children who suffered from these diseases were unable to carry out their usual activities for longer than 8 days compared to females in the same category. For the above finding, a plausible explanation could be that because male infants were more severely sick than females then the degree of seeking treatment was also found to be higher. This severity ofillness could be due to the biological factors, in
infancy boys may be more easily affected by inf ec tious

Table 3-9: Percentage of Sick Children with AbdominalDiseases by Number of Days Restricted
From Activity and by Age and Sex
Age In YearsNumber of Days
0 1-2 3-5Male F emale Male Female Male Female
0 34.8 38.5 35.7 31.3 55.0 50.21-7 40 . 1 45.9 48.3 52.3 35.5 39.38 + 25.0 15.6 16.0 16.4 9.5 10.5
Source: As in Table 3-1.
diseases, or variation in the immune systems of individuals (Waldron, 1983; Johansson and Mosk,1987). The inverse situation occurs for children aged 1-5.
In Ethiopia, it is believed that the impact of physicians is very little, since people usually use traditional medicine, and even people who are said to have a better attitude towards modern treatment usually buy tabletsfrom pharmacie s without a physician's prescription. Thus, int he 1983 Rural Health Survey, reasons were asked for thosewho did not seek medical facilities but received onlytreatment from other facilities, including those whoreceived treatment from a pharmacy. Table 3-10 displays the percentage distribution of male and female children by the reason they received treatment from only other than medical facilities. The most frequent reason found among both males and females is economic. However, this reason isreported more for females than for male s . But cultural

reasons, such as using traditional medicine, or not believing that medical treatment can help, are reported more frequently for male than female children.
Table 3-10: Percentage Distribution of Sick ChildrenWho Received Treatment From Other Than Medical Facilities by Reason and Sex
Reason Male Fema1e
Too Expensive 25.0 27 .6Used Traditional
Medicine 15.1 10.6Not Believe It Helps 9.0 7 . 1Disease Will Stop
by Itself 21 .4 27.0Too Far 12.3 11.5Long Waiting Time 3.9 3 . 7Couldn't Get Required
Medicine 3.3 4.3Other 9 . 9 8 . 1
Numbe r of Cases ( 332 ) ( 322 )Note: The number of cases is the number of sick children who
received treatment from other than medical facilities. Source: As in Table 3-1.
In summary, differentials in overall child morbidity according to age are observed, it is higher for infants and toddlers than children of older ages. Similarly, levels of morbidity were observed to vary between different regions. However, no sex differences are found either in morbidity or in health care practices. A strong effect of sanitary facilities on child morbidity was also observed.

53
CHAPTER 4MATERNAL CHARACTERISTICS AND CHILD MORBIDITY, UTILIZATION OF
HEALTH FACILITIES
This chapter deals with child morbidity in relation to
the characteristics o f the children' s mothers , such as
socio-demographic factors . The impact of these factors on
child care practices i s also assessed through the use o f
health facilities. In this chap ter, only information on
children whose mothers are still alive is taken into
account; thus, the total number of children is 11,826.
4.1 MATERNAL CHARACTERISTICS AND CHILD MORBIDITY
4.1.1 Literacy Status of Mother
Education is one of the socio-economic determinants
that has a strong effect on child survival. A number of
studies in developing countries indicate a relationship
between parental education, measured either by literacy
status or level of education, and infant and child
mortality. Data from Africa (Caldwell , 1 979 ; Farah and
Pres ton , 1 98 2 ; Kune,1 980 ), Asia (Martin et al., 1 983 ; Cochrane
et al.,1980) and Latin America (Cochrane et al.,1980) show
the negative effect of maternal education on the level of
child mortality, although the level of education required to
produce a significant reduction in child mortality varies
between countries. In the Philippines and Pakistan, studies
show that six or more years of schooling for either parent
is needed to lead to a substantial reduction in child

54
mortality (Martin et a1 ., 1 983 : 425 ) . However, some studies show the importance of the mother's schooling rather than the father's. Farah and Preston (1982:378) observed in the Sudan that additional years of schooling of the father had a smaller effect on the health status of the child than additional years of schooling of the mother. Similarly, it has been observed that the level of child morbidity is inversely related to the educational level of the parent, especially of the mother. In Nigeria the risk of contracting diseases of hygienic and nutritional origin was three times higher among children whose mothers were illiterate or had primary education than among those whose mothers had secondary education (Chojnacka and Adegbola, 1984 : 805-806 ). The explanation given was that education probably brings improvements in hygienic conditions and changes in those traditional customs which are unhealthy practices. Caldwell (1979) also argued that education makes mothers more capable of manipulating the modern world, that is, knowing where the facilities are and becoming more likely to use them.
In rural Ethiopia, women with formal education are very few. Thus, this section focusses on the relationship between child morbidity and literacy status of their mothers, as presented in Table 4-1. From this table, it can be observed that children whose mothers are literate have higher morbidity than children of illiterate mothers. The largest differential is seen among males. The same observations, that morbidity is higher among children of mothers with some schooling than those whose mothers have no schooling, were made by Ramlah ( 1 986 ) and Bhuiya et al . ( 1 986 ). However,

Table 4-1 : Percentage of Sick Children by Sex andLiteracy of Mother
Literacy Status Male Female Total
Literate 32.6 ( 399 ) 27.8 ( 432 ) 30.1 ( 831)Illiterate 28.7 (5554) 28.9 ( 5420 ) 28.8 (10975)
Note: Figures in Brackets do not add up to 11826 due to some non response on characteristics of mothers.
Source: Analysis of the 1983 Rural Health Survey subset.
regarding access to sanitary facilities, rather better conditions exist among children of literate mothers than among those of illiterate mothers. For example, 10 per cent of the children of literate mothers have access to a latrine compared to 4 per cent of children of illiterate mothers. Therefore, sanitary conditions alone would not be responsible for the observed variations between children of literate and illiterate mothers. Johansson and Mosk (1987) asserted that the degree of reduction in morbidity is high at a public level where most diseases depend on community sanitation conditions. Thus, literacy could only have a limited impact on child morbidity, since its effect is seen at household level. Hence, these differentials could be due to under-reporting of diseases by illiterate mothers either because of differences in perception of illness (as discussed in Chapter 2) or because of their beliefs about disease reporting. Caldwell (1983) observed failure to report disease in traditional Indian society, due to a belief that reporting diseases that are categorized under "supernatural power" is not good or safe.

56
The types of disease present among the different groups of children according to their mother's literacy status is shown in Table 4-2. It appears that diarrhoea and gastroenteritis is more prevalent among children of illiterate mothers than those of literate mothers. Among children of young mothers (< 2 5 years of age), most of the diseasesare found to be more prevalent among the children whose mothers are illiterate. However, skin infection is reported more commonly among literate (younger) mothers, and this
Table 4-2: Prevalence Rate (per thousand) of DiseasesAmong Children by Age and Literacy of Mother
Age Group of MotherTypes of disease <25 25-29 J>30
Lit Illit Lit Illit Lit IllitDiarrhoea & Gastro-Enteritis 78.7 87 . 4 54.3 79 . 1 65.8 71.3Parasitic 9.8 21.0 27 . 1 20.4 26 . 3 21.1Whooping Cough 6.6 13.1 31 .7 13.6 3.3 9 . 9Pneumonia 0.0 3.5 4.5 3 . 2 0.0 2.9Other Respiratory 42.6 59 . 0 76.9 55 . 9 62 . 5 55.9Eye Infection 29.5 31 .5 36.2 19.7 19 . 7 21.0Skin Infection 42 . 6 27 . 1 45.2 24.7 23.0 28 . 7Malnutrition 3.3 5.2 0.0 6 . 1 6 . 6 6.5Malaria 16.4 2 . 6 4.5 3.6 6.6 4 . 1Measles 6 . 6 7.4 0.0 6.4 6.6 6. 1Other Diseases 65.6 52.9 49 . 8 56.9 52 . 6 47 .4Number of Cases ( 305 ) (2289) ( 221 ) (2793) ( 304 ) (5863)Notes: 1. As in Table 4-1.
2. 'Lit' is literate and 'Illit' is illiterate. Source: As in Table 4-1.

57
may be due to different perceptions. Malnutrition is generally more prevalent among those whose mothers are illiterate (about 6 per thousand) than those whose mothers are literate (about 4 per thousand). This supports the argument that education could bring a change in feeding practices and nutritional level (Smith et al.,1983: 104-106 ) . It also seems to agree with studies in Colombia ,India and Jordan , that showed a positive relationshipbetween female literacy and nutritional status (Cochrane et al.,1980). However, malaria seems to be prevalent among children of literate mothers consistently over all age groups, while the rest of the diseases do not show a clear pattern.
4.1.2 Religion and Ethnic Group of Mother
Cultural beliefs influence many aspects of health and disease. Religion and ethnicity are the more important cultural factors in differentiating human actions and behaviour towards diseases. In Africa these factors were seen to have a strong impact on health status, particularly o f chidren.
Different thoughts and beliefs are observed for common diseases among various regions with different cultural heritages and ethnic diversity. In a village in Kenya, Maina-Ahlberg (1984:324-326) observed that diseases like measles and diarrhoea are classified as God's diseases which even the herbalist has no supernatural power to cure. In this society, though, these conditions are thought to be part of the child's development. It is also believed that

58
these diseases cause stomach ulcers. Thus, mothers practise withholding foods and fluids like milk, meat and fats from children with measles, which actually leads to a nutrient deficiency. Whereas, in Ghanda society, in Uganda, Namboze (1983:2041-42) observed that diarrhoeal disease is believed to be due to teething, or breastfeeding the child while the mother is pregnant. The latter belief leads the mother to send the child away, usually to its grandmother, at the time of weaning. Similarly, in Ethiopia particularly among the Amhara ethnic group, diarrhoea is thought to be due to teething. Thus, gum cutting and pulling of back teeth of infants is practised as a remedy (Brintanak et al.,1974 cited in Ofosu-Aamah, 1 980 ) . In regard to tonsillitis, Baasher et al . (1983) also observed different cultural beliefs. For example, in the Sudan tonsillitis is believed to be due to spitting in urine, while in Oman it is thought to be due to taking a bath in the full moon. They also mentioned that the major factor that influences culture in the Eastern Mediterranian Region, which includes the Sudan and Oman, is Islamic religion (Baasher et al., 1983:65-67).
In demographic literature, the ethnicity and religion of mothers have rarely been included as explanatory factors in analysis of child morbidity. Using Malaysian data, Rami a h ( 1 986 ) studied morbidity differentials across ethnic groups. She found lower morbidity levels among children of Indian mothers than among other ethnic groups. One of the explanations offered is under-reporting of diseases by the
Indian mothers.

59
Table 4-3: Standardized Child Morbidity Rates by Sexand by Ethnicity and Religion of Mother
Ethnicity and Religion of Mother Male Female Total N
Religion :Christian 30.7 29 . 9 30.4 ( 7260 )Moslem 25.8 27 . 7 26.8 (3576)Traditional 27 . 3 23.4 25 . 3 ( 898 )
Ethnic Group:Or omo 28.5 29.4 29 . 1 ( 566 3 )Am ha r a 28.9 29 . 1 29 . 1 (3264)Other 29.5 26.9 28.2 ( 2825 )
Notes: 1. As in Table 4-1.2. Indirect standardization by literacy of mother
is used: total morbidity rates of literate andilliterate are taken as standard.
Source: As in Table 4-1.
In this study, religion and ethnic group are taken as the two indicators of cultural factors. A marked difference in morbidity is observed between religious groups. As can be seen in Table 4-3, morbidity is higher, with 30.4 per cent among children whose mothers belong to the Christian religion compared with lower rates for other religions. Even when this is standardized by literacy of mothers, the pattern remains the same. The Christians' religious beliefs about diseases and their being more conservative towards modern medical treatment could contribute to some extent to the observed differential. Lipsky (1962:100) stated that "Islam has exhibited much greater flexibility than Christianity vis-a-vis the earlier beliefs and customs of its adherents". Thus, because of the influence of the church, Christians show more preference for use of traditional treatment such as spritual treatment, frequently

60
practised by the d a b t a r a who is most popular and has a significant role in the service of the church.
In regard to maternal ethnicity, Table 4-3 reveals the standardized rates by literacy of mother. Only minor variations are evident across ethnic groups. The morbidity appears to be the same for both children of Amhara and Oromo mothers, but slightly higher than children of mothers who belong to the 'other' ethnic group. It has been argued that the differentials are due to other factors, including cultural and environmental factors, rather than ethnicity and religion per se (Huzayyin,1982; Morin et al.,1984). One of these factors is geographical variations. As mentioned in Chapter 1, the Amharas live mainly in plateau regions. Because high altitudes are highly associated with communicable diseases in Ethiopia (Lipsky, 1962), this ecological disadvantage may be at least partially responsible for the observed high child morbidity. Nutrition could also contribute to some extent to the observed differential, since the drought mostly affects these areas .
It is useful to look at the ethno-religious characteristics of the mother, since it has been asserted that there is a strong association between ethnicity and religion in Ethiopia (Lipsky, 1962). Therefore, Table 4-4 indicates the relationship between both ethnicity and religion and child morbidity. Contrary to the infant and child mortality results found in Arssi, Hararge and Gonder (Seleshi , 1 986 ; Genet, 1 987 ) children of Oromo Christian and

Amhara Christian mothers have the highest morbidity, with significant differences from other ethno-religious groups. It seems that children of Amhara Christians and Oromo Christians were affected by their mothers' religion rather than ethnicity. This is apparent when it is observed that the morbidity level for children of Oromo Christians is much closer to that of Amhara Christians than that of Oromo Moslems.
Table 4-4: Percentage of Sick Children by Sex and byEthno-religious Characteristics of Mother
Ethno-religious Group of Mother Male Female Total
Oromo Christian 31.5 (1439) 30.9 (1416 ) 31.2 ( 285 5 )Amhara Christian 30.5 ( 1422 ) 30.6 ( 1406 ) 30.5 (2828)Oromo Moslem 25.9 (1380) 28.4 (1302) 27 . 1 (2682)Amhara Moslem 20 . 1 ( 204 ) 22.4 ( 219) 21.3 ( 423 )Other 29.0 (1516 ) 26.4 ( 1 522 ) 27 . 7 (3038)
Notes: 1. As in Table 4-1.2. The category 'Other' includes children of mothers
who belong to any religion and to the 'Other' ethnic group; and children of mothers who belong to any ethnic group and to traditional religion.
Source: As in Table 4-1.
4.1.3 Age of Mother
Studies in some countries have established a number of relationships of infant and child mortality with demographic factors, including age of mother. According to the recently developed child survival framework, . this factor is categorized under one of the five proximate determinants

'Maternal Factors' through which socio-economic factors
affect child survival (Mosley and Chen, 1984).
In most countries investigated by the World Fertility
Survey (WFS), the U-shaped relationship with age of mother
was strongly evident for infant mortality, and less strong
for child mortality. For example, in Kenya, infant
mortality was found to be high for infants borne to teenage
mothers, to decline for mothers aged 20-39 and increase for
older mothers. Whereas child mortality (2-4 years old) was
high for mothers aged less than 20 and 30-39 and lower for
mothers aged 20-29 and above 40 (WFS, 1 983 : 27 ) . Similarly,
from Bangladesh data, Al-Kabir (1984:14) observed that
infant mortality has a U-shaped curve, while child mortality
decreased with age of mother. However, there is a lack of
literature on this variable in relation to morbidity.
The relationship between age of mother and child
morbidity is shown in Table 4-5. Since age of mother is
related to age o f child and , as noted in the above review,
mortality has a different pattern between infants and
children, Table 4-5 shows the standardized morbidity rates
by age of the child. The unstandardized rates show that
morbidity is higher for children whose mothers are young,
and then declines, with fluctuating rates as the mothers get
older. However, the standardized rates show that morbidity
rates decline for children of younger mothers and similarly
they then fluctuate, with the highest being for children
with mothers in the age group 35-39. The pattern observed
is quite puzzling.

Table 4-5: Age Standardized Morbidity Rates (PerHundred) of Children by Sex and Age of Mother
Age Group Numberof Mother Male Female Total of Cases
15-19 31.2 26.9 29.4 ( 498 )2 0-24 30.5 29.2 29 . 8 (2096)25-29 29.9 28 . 5 29 . 2 (3021)30-34 27 . 1 28 . 3 27 .8 ( 2497 )35-39 29 . 5 31.2 30.3 (2089)40-44 23.0 26 . 3 24.8 ( 912)45 + 29 . 8 25.4 27 . 3 ( 678 )
Notes: 1 .2 .
As in Table 4-1.Direct standardization is used: population
Source: Asage of child in Table 4-
is taken1 .
as st andard .
4.1.4 Maternal Health Status
Table 4-6 shows the relationship between mothers' health status and children's health status. The correlation is substantial. It appears that more than 40 per cent of children whose mothers were sick were also sick themselves, but only 21 per cent of children whose mothers were not sick, or about half of the above group, were sick. This applies to children of mothers of all ages. Thisassociation between children's health and maternal health could be for two reasons. One reason could be the same environmental exposure. Since this chapter focusses on children who are living with their mothers, it is apparent

64
Chat they would have the same sanitary facilities, such as water supply and environmental sanitation. The other reason is that there might be less care and attention given to the child while the mother is sick. It is more likely that asick mo t he r has less time to spend with her child; thiscould affect the child 's health. Personal contact of themother with the child may also be another reason for theobserved finding. In the case of a sick mother, the child has a higher risk of contracting the diseases due to constant personal contact while feeding, cleaning or breastfeeding particularly infants.
Table 4-6: Percentage of Sick Children by Mother'sHealth Status and Age
Age Group Maternal Health StatusMother 111 No t 111
<25 47 .0 ( 827 ) 23.4 (1767)
25-29 44.0 ( 1 046 ) 21.5 (1969)
>30 43.0 (4372) 20.5 ( 7447 )
Note: As in Table 4-1.Source: As in Table 4-1.
4.2 MATERNAL CHARACTERISTICS AND CHILD'S USE OF HEALTH FACILITIES
The differential use of various treatment facilities depends on a number of socio-economic factors, including cultural beliefs of the people, access to the facilities and knowledge and attitude towards modern medicine.

65
4.2.1 Maternal Literacy Status
Several studies assert that there is an association between maternal education and a child's use of medical facilities. Osborn and Ameen (1975) observed in urban Pakistan that education and income are important determinants of use of maternal-child health facilities. Caldwell (1983) observed that education helps mothers to bring their children to modern health facilities even before practising other traditional medicine. From their study in Tamil Nadu, India, Rao and Richard (1984) suggest that education helps* people to seek the right source of medical services.
Due to the small cell sizes when variables are crosstabulated, the relationship between the use of treatment facilites and maternal characteristics according to common types of disease is difficult to analyse in the present study. Thus, this section only focusses on the use of treatment facilities for the total morbidity experienced by the children. Among all sick children, about 37 per cent whose mothers were literate received treatment from one of the facilities, compared to 33 per cent of those whose mothers were illiterate (Table not shown). This is obtained from a direct question: 'Did you receive treatment during the last 14 days ?'.
Table 4-7 shows the percentage distribution of all children who received treatment, by different types of facilities in relation to their maternal literacy status,

Table 4-7: Percentage of Sick Children Who ReceivedTreatment by Type of Facility and Literacy
Status of Mother
Trea tment Facilties Li t
<25Illit
25 Li t
-29Illit Lit
>30Illit
Medical facilities 52.3 38 . 1 57 . 1 40.5 40.0 39 . 7Pharmacy 13.6 18.3 14.3 16.8 15.0 13.0Traditional Healer 25.0 21.6 14.3 20.3 25 . 0 17.9Lay Treatment 9 . 1 18.0 3.6 16.2 5.0 18.5Self Treatment 0.0 4.3 3.6 3.8 10.0 7. 1Unqualified person 2.3 1 . 8 7. 1 4.8 5.0 5.9Numbe r of Cases (44) ( 278 ) (28) (291 ) (20) (47)Note: 'Lit' is literate and 'Illit' is illiterate.Source: As in Table 4-1.
while age of mothers is controlled. This shows a marked difference in usage of medical facilities between children of literate and illiterate mothers. Children of literate mothers have high usage of medical facilities. This is probably because literate mothers are more aware and have better knowledge of modern medicine than illiterate mothers. In contrast, among children whose mothers belong to the old age group, there was little difference in use of medical facilities between those of literate and illiterate mothers. Thus the effect of literacy on utilization of medical facilities is stronger for children of younger mothers than older mothers. As expected, lay and self treatment are more used by children whose mothers are illiterate. An interesting pattern is that traditional medicine is still

more preferred by literate mothers who are less than 25 and above 29 years of age than by illiterate mothers.
Table 4-8: Percentage Distribution of Children WhoReceived Treatment From Other Than Medical Facilities by Reason and Literacy Status
of Mother
Reason Literate Illiterate Total
Too Expensive 20.9 26.8 26.4Disease Will Stop By Itself 20.9 24.5 24.2
Used Traditional Medicine 14.0 12.6 12.7
Too Far 14.0 11.8 12.0Not Believe it Helps 4.7 8 . 2 8.0Long Waiting Time 0.0 4 . 1 3.8Thought Couldn't Get Required Medicine
the2.3 3.9 3.8
Other 23.3 8.0 9.0Number of Cases (43 ) ( 609 ) ( 652 )Source: As in Table 4-1.
For children who received treatment from other thanmedical facilities, economic reasons were the most commonreason, as shown in Table 4-8. It appears that for childrenwhose mothers are literate, "other' is the most frequent reason, reported followed by "too expensive" and "disease will stop by itself". However, the latter two reasons are reported more frequently for children of illiterate mothers than literate mothers. Unlike findings in other developing countries, distance or access to health services does not seem a typical problem, either for literate or illiterate

68
mothers. However, other cultural and economic barriers seem to be resposible for them not seeking medical facilities.
4.2.2 Religion and Ethnicity of Mother
Some studies observed cultural barriers to seeking modern services. Ethnicity and religion are associated with different sets of child care practices in which they act as proxy for cultural factors. In Malaysia, Chen (1976) studied the cultural beliefs in different ethnic groups. He found that traditional medicine was the most commonly used facility by all ethnic groups. Their use of treatment facilities differred according to social factors, such as attitudes towards medical services, occurring in the ethnic groups. In Nigeria, Orubuloye and Caldwell (1975) examined the effect of religion on the use of health services. It showed marked differences in use of public health facilities. People who belong to traditional religions or West African Protestant sects are less likely to use public health facilities than those who belong to other religions that originated in Europe. However, among those who belong to the latter group, such as Moslems and Catholics, it appears there are no significant differentials in utilizing public health facilties (Orubuloye and Caldwell, 1 97 5 ) .
In the present study, among all children who received treatment, the use of different facilities by mother Is religion and ethnicity is shown in Table 4-9. Among all those who were sick, a higher percentage of children whose mothers belong to 'other' ethno-religious groups received

treatment at least from one of the facilities, about 41 per cent, followed by children of Oromo Christian mothers, 37 per cent (Table not shown). But, even if children of mothers who belong to the "other" ethno-religious group have a high treatment rate, lay treatment seems more frequently utilized among this group of children than among others. On the other hand, the highest utilization rate of a medical facility is seen among those whose mothers are Oromo Moslem and Amhara Moslem. The observed high utilization of a medical facility among children of the latter group could be due to the small number of cases. However, children of the Oromo Christian mothers, who have a high morbidity rate (see the previous section), are found to be the most frequent users of the pharmacy. This shows the impact of religion on the utilization rate of the pharmacy. This can be explained by cultural, social and economic barriers between people and physicians which probably result in more use of pharmacies, drug stores and prescriptions from less qualified retailers than hospitals (Kloos et al . , 1986:654 ). Moreover, traditional medicine is observed to be frequently used by children of Amhara Moslems and Amhara Christians.
For those treated in other than medical facilities, economic reasons and "diseases will stop by itself" are the most frequent reasons reported, as shown in Table 4-10. Amhara Christians, who are the lowest users of modern facilities, are twice as likely to find it too expensive than Amhara Moslems, and also much more likely to believe modern medicine won't help.

Table 4-9: Percentage of Treated Children by Type of Facility and Ethno-religiousGroup of Mother
70
Types of Treatient Facilities
AiharaChristian
OroioChristian
OroioMosle*
AiharaMoslea Other
Medical Facility 38.7 39.6 43.7 41.2 39.0Phariacy 6.2 23.5 12.9 11.8 15.0Traditional Healer 27.3 18.6 19.0 29.4 15.6Lay Treatient 15.5 16.2 13.7 11.3 21.5Self Treatient 7.7 4.0 6.5 0.0 4.6Unqualified Person 6.2 3.4 5.3 5.9 3.7Number of Cases (194) (328) (263) ( 17) (326)Note: Figures in brackets are nuiber of children who only have received treataent.
But the total nuiber of treated children do not add up to 1140 due to soie non-response on lothers' information.Respondents could «ention lore than one facility.
Source: As in Table 4-1.
Table 4-10: Percentage Distribution of Children Who Received Treataent Froi OtherThan Medical Facilities by Reason and Ethno-religious Group of Mother
ReasonAiharaChristian
OroioChristian
OroioMoslei
AiharaMoslei Other
Too Expensive 31.6 19.5 27.4 16.7 29.9Used Traditional
Medicine 16.2 10.3 15.6 16.7 11.2Not Believe it Helps 11.1 7.7 5.2 0.0 9.1Diseases Will Stop
by Itself 27.4 24.6 24.4 33.3 21.3Too Far 7.7 9.7 7.4 16.7 19.3Long Waiting Tiie 0.9 7.2 3.0 0.0 3.0Thought Couldn’t Get Required Medicine 2.6 5.6 5.2 16.7 1.5Other 2.6 15.4 11.9 0.0 4.6Nuiber of Cases (117) (195) (135) ( 6) (197)
Source: As in Table 4-1.

4.3 LOGIT LINEAR MODEL ANALYSIS
This section discusses the relative influence of some socio-demographic factors on the health status of children under the age of six. In previous sections, the association of these variables with child morbidity has been shown using cross-tabulation analysis. This shows the gross effect of each variable. However, multivariate analysis is used to evaluate the net effects of each explanatory variable on the dependent variable. The appropriate multivariate technique used is the log-linear model, specifically the logit linear model. This kind of model works quite well when independent variables are categorical and the dependent variable is dichotomous. Also, in this approach, the exposures in each cell are taken into account, so that the analysis is not oversensitive in the case of small exposures (Hobcraft et a l ., 1984 : 209-2 1 0 ) .
For the purpose of this analysis, the health status of a child, that is, ill or healthy, is taken as the dependent variable. On the other side, six independent sociodemographic variables were selected. The selection was based on two categorizations: the child's characteristics, age and sex; and the maternal characteristics, age, ethnicity, religion and literacy status. Since ethnicity and religion show a significantly strong interaction, for simplicity they are combined and taken as one variable. Hence, the actual number of independent variables used isreduced to five because of the combination.

72
Two models are employed; the second model is considered
the best fit. The first model employed shows (see Appendix
A) that, as in the univariate analysis, sex has no
significant importance in determining child morbidity.
Female children have one per cent lower risk than male
children of exposure to diseases when the other four
variables are taken into consideration. Similarly in the
case of age of mother, the difference is negligible between
morbidity of children of young and of old mothers.
Moreover, the wide range of morbidity risk of children for
different age groups of mothers is reduced in the
multivariate context. Contrary to the usual findings,
literacy of mother did not show any significant effect on
children's health status.
Fur t he rrao re, the likelihood Chi-square value and the
corresponding value of p shows that only two variables, age
o f the child and the combined variable of ethnicity and
religion of the mother are important in determining the
child morbidity. The analysis suggests that, once controls
for age of child and the combination of ethnicity and
religion of mother are int roduced , no significant variation
in child morbidity i s caused by any of the other three
factors considered i n this section. Thus , the apparent
relationship with age of mother i s largely due to the
association between maternal age and age of the child. This
conforms with the univariate finding in this Chapter,
Section 4.1.3. The unstandardized morbidity rates show a
significant variation between age groups of mothers while

the standardized rates, by age of child, reduce the variation .
Hence, based on the best fitting model, the net effects of these two factors are shown in Table 4-11. Each odds ratio or net effect estimate in the Table indicates the relative risk of being ill during childhood due to the membership of the child of a particular category of a variable. An odds ratio of 1.00 implies no greater or less exposure to morbidity risk. Thus, children less than age 2 are highly exposed to disease while the rest of the children are less exposed. In addition, the net effect estimate, compared to infants' exposure implies that there is a decrease in morbidity risk for increasing age except at age one. For example, 2-year-old children experienced a 5 per cent lower morbidity risk and 3-year-old children experienced a 15 per cent lower morbidity risk than infants.
Children of Oromo Moslems and Amhara Moslems are seen to have a lower morbidity risk. Compared to children of Amhara Christian mothers, children of Oromo Christian mothers experienced a 2 per cent higher morbidity risk. This shows that between the Amhara and Oromo ethnic groups, children of Moslem mothers experienced a lower morbidity risk than children of Christian mothers, even when the age of the child is taken into consideration. This might be due to ecological reasons (see Section 4.2) or under-reporting of diseases because of differences in perception of illness between the two religious groups.

All possible interactions in the model, which consists
of five variables, were examined. However, this analysis
suggests that none of the interaction effects were
significant except for literacy status of Amhara Christians.
The multiplicative difference between literate Amhara
Christians and illiterate Amhara Christians is about 18 per
cent and significant, with children of literate mothers
having the higher morbidity risk.
Table 4-11: Logit Linear Main Effects Model for The Effects of Child's Age and Ethno-religion of Mother on Child Morbidity
Variable Net Effect Net Effect LikelihoodRatio
Chi-squareDegrees of p Freedom (d.f.)
Age of Child: (Compared to age 0) 123.71 5 <.0050 1.11 1.001 1.17 1.052 1.06 0.953 0.95 0.854 0.88 0.795 0.87 0.78
Ethnicity and (Compared to AmharaReligion of Mother: Christian) 29.86 4 <.005
Oroio Christian 1.10 1.02Oromo Moslem 0.99 0.92Amhara Christian 1.08 1.00Amhara Moslem 0.84 0.79Other 1.01 0.94
Overall effect or grand mean = 0.6079Likelihood ratio Chi-square for the model=27.75 with 20 d.f., and p= 0.11. Source: As in Table 4-1.
It can be concluded from the earlier part of this
chapter (univariate analysis) that, some of the maternal
characteristics show a clear relationship with child
morbidity. "Ethnicity and religion of mothers" exerts some
influence on child morbidity and on the utilization of

health services. Similarly, a positive relationship is
observed between health status of mothers and health status
of children. However, age of mother does not show a clear
relationship. Although literacy of mothers indicates an
adverse relationship with child health status, which could
be explained by under-reporting of diseases by illiterate
mothers, literacy is found to increase the level of
utilizing medical facilities among children. In the
multivariate analysis, the effect of age of the child and
the combined effect of ethnicity and religion of mothers are
found to be statistically significant when controls for sex
of the child, and age and literacy of the mother are
introduced .

CHAPTER 5SUMMARY AND CONCLUSION
This study examines the impact of various sociodemographic variables on the health status of children, indicated by morbidity during the 14 days prior to the survey date, as well as the impact on their utilization of health services.
In general , the level of child morbidity observed isquite high; at age one the exposure to disease seems to bet he highest. Among the different types of diseases,diarrhoea and gastro-enteritis are the most prevalent. Even though there are small differences in the health status of children of each sex at different ages, this does not indicate a significant sex differential for either child morbidity or utilization of modern health services. The level of seeking treatment is relatively low. Among children who sought out one of the treatment facilities, more than half of them received treatment from other than medical facilities. Furthermore, for common diseases, infants and toddlers (aged 1-2) are seen to be higher users of medical facilities than children of the older ages.
Sanitary facilities show a strong association with child morbidity. Children who live in better sanitary conditions are more likely to have a lower morbidity level. Usage of piped water shows a very low sickness rate, about half the morbidity rate of children who use river or spring

water sources. The same is the case with toilet facilties: usage of pit-latrines reduces the morbidity to almost half the rate of those who defaecate in the back yard. However, it is believed that the access to these facilities are not independent of each other; that is, people who use piped water, for example, are more likely to have pit-latrines or in general better sanitation than those who do not.
Some relationships are found between the maternal characteristics and child health status. However, age of mother does not show a clear association with child health status. Literacy shows some differences in the morbidity rate, but statistically it is insignificant. Children of literate mothers are more likely to be reported sick than children of illiterate mothers, although a positive relationship is found between literacy status of mother and use of medical facilities. Ethno-religious characteristics of mothers also show substantial differences in child morbidity. Children of Oromo Christian and Amhara Christian mothers appear to be the most disadvantaged. On the other hand, Oromo Moslems are observed to be the higher users of medical facilities for their children. The major reason reported for not seeking medical facility is an economic reason, that is 'too expensive". It is also found that maternal health status has a positive relationship with the child"s health status. Children whose mothers are not sick are also less likely to be sick themselves. The multivariate analysis suggests that age of child, and ethnicity and religion of mother have a significant effect on child

morbidity, when controls for other variables such as literacy, age of mother and sex of the child are introduced.
For more detailed studies on the cultural determinants of health status, it would be necessary to carry out further research on the feeding practices of the family or community. This could help in explaining the morbidity differential obtained by various ethno-religious groups.
Policy Implications
Although ethnicity and religion play an important role in influencing child morbidity, it is clear that cultural and environmental differences are. the factors which are reflected by these two indicators. On the other hand, literacy exerts little impact on child care practices, that is, seeking medical facilties. Therefore, adequate education on basic knowledge of common ailments and on the advantages of modern health services is needed for mothers, so that it can help them to have a better idea about the cause of illness and to adopt effective health treatment.
The government should give special attention to the efficiency of the Primary Health Care programme carried out by the Community Health Services, which starts to give health education and to improve sanitation. It would be useful if the government were to make efforts to improve the coverage of the programme nationwide, so that it can reach the remote areas. In addition, since diarrhoea is the most prevalent disease, mothers should be familiar with the simple prepared treatment, Oral Rehydration Salts (ORS), as

well as having some knowledge about "personal hygiene" especially in preparing supplementary food for children. This study also suggests that better sanitary conditions reduce the morbidity rate; thus, the government plan for the provision of sanitary facilities should be given emphasis.
For a large proportion of children who receivetreatment from other facilities, economic and cultural reasons were reported frequently. This suggests that, even though the government has introduced a policy to expand health services in rural areas, the focus should be on the cost of treatment and medicines; that is, the government should offer free treatment and make efforts to reduce the cost of medicines along with promoting the child healtheducation programme.

80
AL-KABIR, 1 984
BAASHER, 1983
BENENSON, 1985
BHUIYA, A 1986
BLACK, R. 1982
BLACK, R. 1983
CALDWELL, 1979
CALDWELL, 1 983
CHEN, P.C 1976
REFERENCES
A."Effects of Community Factors on Infant and Child Mortality in Rural Bangladesh", World Fertility Survey Scientific Reports, No.56,(July). London: WFS.., T. BAASHER and R. COOK"Traditional Practices For Women and Young Children in the Eastern Mediterranian Region: Recent Developments", in Advances in International Maternal and Child Health, Vol.3, eds.D.B. Jelliffe and E.F.P. Jelliffe, pp . 63-89 . Oxford: Oxford University Press.A. S .Control of Communicable Diseases in Man ,Washington DC: The American Public HealthAssociation ., S. ZIMICKI and S. D'SOUZA"Socioeconomic Differentials in Child Nutrition and Morbidity in a Rural Area of Bangladesh", Journal of Pediatrics, Vol.32, (February), pp.17-23.., K.H. BROWN, S. BECKER, A.R.M.A. ALIM andM. H. MERSON"Contamination of Weaning Foods and Transmission of Entrotoxigenic Escherichia Coli Diarrhoea in Children in Rural Bangladesh", Transactions of Royal Society of Tropical Medicine and Hygiene,Vo 1 .76, pp. 259-264 .:., M.H. MERSON and K.H. BROWN"Epidemiological Aspects of Diarrhea Associated With Known Enteropathogens in Rural Bangladesh", in Diarrhea and Malnutrition, eds. L.C. Chen andN. S. Scrimshaw, pp. 73-86. New York: Plenum Press.J . C ."Education as a Factor in Mortality Decline: An Examination of Nigerian Data", Population Studies, Vo 1.3 3, No.3, pp. 395-4 1 3 .J.C., P.H. REDDY and P. CALDWELL"The Social Component of Mortality Decline: AnInvestigation in South India Employing Alternative Methodology", Population Studies, Vol.37, No.2, (July), pp.185-205.
. Y ."Medical Systems in Malaysia: Cultural Bases andDifferential Use", Social Science and Medicine,Vo1 .9 , No .3, pp. 171-179.

CHEN, L.C., E. HU Q and D'SOUZA1981 "Sex Bias in the Family Allocation of Food and
Health Care in Rural Bangladesh", Population and Development Review, Vol.7, No . 1 , pp. 5 5-70 .
CHOJNACKA, H. and 0. ADEGBOLA1984 "The Determinants of Infant and Child Morbidity in
Lagos, Nigeria", Social Science and Medicice,Vo 1 . 19 , No .8, pp. 7 99-8 1 0 .
COCHRANE, S.H., D.J. O'HARA and J. LESLIE1980 "The Effects of Education on Health", World Bank
Staff Working Paper, No.405, (July). Washington DC: World 3 ank.
CENTRAL STATISTICAL OFFICE1981 Interviewers Manual For the 1982/83 Rural Health
Surveys, (Amharic). Addis Ababa: CSO.
1984 Study on the Levels, Patterns, Trends andDifferentials of Fertility, Infant and Child Mortality in Ethiopia, Statistical Bulletin 39. Addis Ababa: CSO.
1985a Population and Housing Census Supplementary Report , Addis Ababa: CSO.
1985b Report on the Rural Health Survey 1982/83, Vol.l, Statistical Bulletin 47. Addis Ababa: CSO.
CORNIA, J.A.1984 "A Survey of Cross-sectional and Time series
Literature on Factors affecting Child Welfare", World Development, Vol.12, No.3, pp. 1 87-202 .
ETHIOPIAN NUTRITION INSTITUTE1986 Report on the Base-line Survey, Part 2, Joint WHO/
UNICEF Nutrition Support Programme Ethiopia.Addis Ababa : ENI.
FARAH, A.Z. and S.H. PRESTON1982 "Child Mortality Differentials in Sudan",
Population and Development Review, Vol.8, pp.365-383.
FAMILY GUIDANCE ASSOCIATION OF ETHIOPIA1 983 Information Bulletin, No.4. Addis Ababa: FGAE.
FEACHEM, R.G., M.W. GUY, S. HARRISON, K.O. IWUG0,T. MARSHALL, N. MBERE, R. MULLER and A.M. WRIGHT
1983 "Excreta Disposal Facilties and IntestinalParasitism in Urban Africa: Preliminary Studies inBotswana, Ghana and Zambia", Transactions of the Royal Society of Tropical Medicine and Hygiene,Vo 1 .77 , No .4, pp.515-521 .

82
GENET, M.1987 Fertility and Childhood Mortality in Rural
Ethiopia: A Comparative Study of Selected RegionsGonder and Hararge, M.A. thesis, Canberra: Australian National University.
GREENLY, J.R.1980 "Sociocultural and Psychological Aspects of the
Utilization of Health Services", in Assessing the Contributions of the Social Sciences to Health, eds. M.H. Brenner, A. Mooney and T.J. Nagy, pp.169-207. USA: Westview Press.
HABTEMARIAM, T.1979 "Estimates of Mortality Levels, Differential and
Patterns in Ethiopia", Economic Commission For Africa, Experts Group Meeting on Fertility and Mortality levels, Patterns and Trends in Africa and Their Policy Implications. Monrovia: UN.
1986 "The Growth of Urbanization in Ethiopia, 1966- 1984", Eastern Africa Economic Review, Vol.2, No.2, pp.157-167.
HOBCRAFT, J.N., J.W. McDONALD and S.O. RUSTEIN1984 "Socio-economic Factors in Infant and Child
Mortality: A Cross-Nationa1 Comparision",Population Studies, Vol.38, No.2, pp. 1 93-223 .
HUZAYYIN, S.A.1982 "Mortality Situation in Some Arab and African
Countries: An Overview", Mortality Trends and Differentials in Some African and Asian Countries , Research Monography series, No.8, pp.3-17. Cairo: Cairo Demographic Centre.
JOHANSSON, S.R. and C. MOSK1987 "Exposure, Resistance and Life Expectancy: Disease
and Death during the Economic Development of Japan, 1900-1960", Population Studies, Vol.41, pp.207-235.
KEBEDE, S.1986 Fertility and Child Mortality in Agricultural
Households of Rural Ethiopia: The Case of ArssiAdministrative Region, M.A. Thesis, Canberra: Australian National University.
KLOOS, H . , T. CHAMA, D. ABEMO, K.G. TSADIK and S. BELAY1986 "Utilization of Pharmacies and Pharmaceutical
Drugs in Addis Ababa, Ethiopia", Social Science and Medicine, Vol.22, No.6, pp. 653-672 .
KUNE, J.B.1980 "Some Factors Influencing the Mortality of Under-
Fives in a Rural Area of Kenya, a Multivariate

Analysis", Journal of Tropical Pediatrics, Vol.26, (June ), pp.114-166.
KWAST, B.E., W.K. MARIAM, E.M. SAED and F.G.R. FOWKES 1984 Report on Maternal Health in Addis Ababa,
Addis Ababa: Swedish Save the ChildrenFederation Radda Barnen.
LAST, G.C.1983 "Physical and Social Geography", in Africa South
of the Sahara , pp. 359-362 . London: EuropaPublications Limited.
LIPSKY, G .A .1962 Ethiopia: Its People, Its Society and Its Culture,
USA: Hraf Press.MAINA-AHLBERG, B.
1984 "Beliefs and Practices Related to Measles and Acute Diarrhoea", in Maternal and Child Health in Rural Kenya, eds. J.K. Van Ginnenken and A.S. Muller, pp.323-331. London: Croom Helm.
MAMMO, B.1983 Health Care Delivery Systems in Underdeveloped
Countries: Ethiopia, A Case Study, Michigan:University Microfilms International.
MARTIN, L.G., J. TRUSSEL, F.R. SALUAIL and N.M. SHAH1983 "Co-variates of Child Mortality in the
Philippines, Indonesia and Pakistan: An Analysis,Based on Hazard Models", Population Studies, Vol.37, No.3, (November), pp. 4 1 7-432 .
MESIFIN, W.M.1972 An Introductory Geography of Ethiopia,
Addis Ababa: Berhanena Selam Printing Press.MINISTRY OF HEALTH
1980 Health Manpower Study: Ethiopia, Addis Ababa: MOH.MINISTRY OF HEALTH
1986 Comprehensive Health Services Directory 1983/84, Addis Ababa: MOH.
MORIN, M.M., L.W. PICKLE and T.J. MASON1984 "Geographic Patterns of Ethnic Groups in United
States", American Journal of Public Health,Vo 1 . 7 4 , No.2, pp. 1 33-1 39 .
MOSLEY, W.H. and L.C. CHEN1984 "An Analytical Framework For the Study of Child
Survival in Developing Countries", Population and Development Review, Vol.10 Supplement, pp. 25-45 .
NAMBOZE, J.M.1983 "Health and Cuture in An African Society", Social
Science and Medicine, Vol.17, No.24, pp.2041-2043.

84
ODEBIYI, A.I.1977 "The Socio-Gultural Factors Affecting Health Care
Delivery in Nigeria", The Journal of Tropical Medicine and Hygiene, (November), pp.249-254.
0 FO SU-AMAAH, S.1980 "The African Experience", in Changing Disease
Patterns and Human Behaviour, eds. N.F. Stanley and R.A. Joske, pp. 300-322. New York:AcademicPress.
OKED IJI, F.O.1975 "Socioeconomic Status and Attitudes to Public
Health Problems in the Western State: A CaseStudy of Ibadan", in Population Growth and Socio-economic Changes in West Africa, ed .J.C. Caldwell, pp. 27 5-29 7 . New York.: populationCouncil .
0RUBUL0YE, 1.0. and J.C. CALDWELL1975 "The Impact of Public Health Services on
Mortality: A Study of Mortality Differentials ina Rural Area of Nigeria", Population Studies,Vo 1 . 2 9 , No.2, pp. 259-27 2 .
OSBORN, R.W. and S.AMEEN1975 "Demographic and Socio-Economic Variations in
Health and Family Planning Behaviour in Urban Pakistan", Social Science and Medicine, Vol.9, No.11/12, pp. 6 59-66 3 .
PUFFER, R.R and C.V. SERRANO1973 Patterns of Mortality in Childhood, Scientific
Publication No.262. Washington DC: Pan AmericanHealth Organization.
RAMLAH, H.M.1986 Education and Use of Health Services in Malaysia,
M.A. Thesis, Canberra: Australian NationalUniversity.
RAO, P.S.S and J. RICHARD1984 "Socio-economic and Demographic Correlates of
Medical Care and Health Practices", Journal of Biosocial Science, Vol.16, No.3, pp. 343-355 .
READ, M.1966 Culture, Health and Disease, London: Travistock
Publication.ROSENZWEIG, M.R. and T.P. SCHULTZ
1983 "Estimating a Household Production Function:Heterogeneity, the Demand For Health Inputs, and Their Effects on Birth Weight", Journal of Political Economy, Vol.91, No.4, pp. 7 23-7 46 .

85
ROSS, D .A . and J.P. VAUGHAN1984 Health Interview Surveys in Developing Countries:
A Methodological Review With Recommendations For F uture Surveys, EPC Publication, No.4, (Winter). London: London School of Hygiene and TropicalMedicine .
ROWLAND, M.G.M.1983 "Epidemiology of Childhood Diarrhea in the
Gambia", in Diarrhea and Malnutrition, eds.L.C. Chen and N.S. Scrimshaw, pp.87-98. New York: Pienum Press.
SCHELL, L.M.1986 "Community Health Assessment Through physical
Anthropology: Auxological Epidemiology", HumanOrganization , Vol.45, No.4, pp. 32 1-325 .
SCHWAB, P.1985 Ethiopia: Politics Economics and Society, London:
Frances Printer.SMITH, M.F., S.K. PAULSEN, W. FOUGERE and S.J. RITCHEY
1983 "Socioeconomic, Education and Health FactorsInfluencing Growth of Rural Haitian Children", Ecology of Food and Nutrition, Vol.13, pp.99-108.
SOLOMON, A.1985 "Time Budget Analysis as a Tool For PHC Planning
(With Examples From Ethiopia)", Social Science and Medicine , Vol.21, No.8, pp. 865-87 2 .
UNITED NATIONS1982 Levels and Trends of Mortality Since 1950,
New York, ST/ESA/SER.A/74.
1984 Population Policy Compendium: Ethiopia,New York: UNFPA.
UNICEF1986 The State of The World's Children, New York:
UNICEF .UNICEF
1987 Statistics on Children in UNICEF AssistedCountries , New York: UNICEF.
VERBRUGGE, L.M.1976 "Sex Differentials in Morbidity and Mortality in
the United States", Social Biology, Vol.23, No.4, (Winter), pp.275-289.
I."The Role of Genetic and Biological Factors in Sex Differences in Mortality", in Sex Differentials in Mortality, eds. A.D. Lopez and L.T. Ruzicka, pp.141-164. Canberra: ANU.
WALDRON, 1983

86
WARE, H.1984 "Effects of Maternal Education, Women's Roles, and
Child Care on Child Mortality", Population and Development Review, Vol.10 Supplement, p p . 191-214.
WORLD FERTILITY SURVEY1983 "Infant and Child Mortality: Levels, Trends and
Demographic Differentials", Comparative S t u d i e s , N o . 24, (September).
WORLD HEALTH ORGANIZATION1981 Infant and Young Child Feeding: Current Issues,
Geneva WHO .

87
APPENDIX A
Logit Linear Main Effects Model For the Effects of Child's Age, Sex, and Maternal Age, Literacy and Ethno-religion on Child Morbidity
Variable Ne t Likelihood Degrees of PEffect Ratio freedom
Chi-square (d.f.)
Sex : 0.11 1 >.10Male 1 .00Female 0.99
Age of Child : 116.62 5 < .0050 1.111 1.172 1 .063 0.954 0.885 0.87
Ethno-religion of Mother: 28 .86 4 < .005Oromo Christian 1.10Oromo Moslem 0.99Amhara Christian 1.08Amhara Moslem 0.84Other 1.01
Maternal Age: 1 .56 2 >.10<25 1.0125-29 1.01230 0.98Literacy Status of Mother: 0.09 1 > . 10Literate 1.01Illiterate 0.99
Overall effect or grand mean= 0.6134Likelihood ratio Chi-square for the model= 375.92with 336 d.f., and p=0.07

APPENDIX B
An exaiple of the computation of indirect standardization by literacy status used in Table 3-6 (coluin (c) panel tvo):-
Literacy Status of Mother
StandardMorbidity
Rate
Nuiber of Children Who Expected Nuiber of 111 Childrenhave access to latrine
do not have access to latrine
have access to latrine
do not have access to latrine
(1) (2) (3) (4) (5)=(2)*(3) (6)={2)*(4)LiterateIlliterate
0.3010.288
171852
65810076
51.5245.4
198.12901.9
TotalMorbidityRate 0.289
Actual 111 Children* 229 3156Expected 111 Children
2(5) = 296.8
2(6) = 3099.9
Ratio=Actual ill/Expected ill 0.77 1.02Standardized Rates= (Ratio*0.289)*100 22.3 29.4Note: * Actual ill children is the observed nuiber of ill children obtained fro« the 1983
Rural Health Survey subset.Coluin (2) is sorbidity rate of children by their laternal literacy status which is used as standard lorbidity rate.

89APPENDIX C
1983 Rural Health Survey Questionnaire
STRICTLY CONFIDENTIAL
FOR STATISTICAL USE
CENTRAL STATISTICAL OFFICEI
NATIONAL in t e g r a t e d h o u s e h o ld s u r v e y p r o g r a m - r u r a l h ealth
SURVEY - FINAL QUESTIONNAIRE - 1982 783
SECTION I— IDENTIFICATION PARTICULARS
oCDOT>
l 2 3
2 0 4
I - R E G I O N 2 - A W R A J A 3 - W E R E D A
4 5 G 7 8 9
A FARMERSASSOCIATION
SERIAL NUMBER O F
5 - SELECTED HOUSEHOLDORDER OF
6 * SELECTION10 11 12 X 13 1 4 15 16 17 18
7- HOUSEHOLD-GROUP 8 * ROUND MONTH a YEAR19 20 21 2 2 2 3 2 4
NAME SIGNATURE DATE
ENUMERATOR / /
SUPERVISOR / /
REGIONAL STATISTICAL HEAD
/ /

SECT
TOM
2
----
»kO
«>tA
_>.T
>O
H
AM
O
HE
AL
TH
fA
MT
CU
LU
U—
F
INA
L
RU
RA
L
HE
AL
TH
Q
UE
JT
IOIH
AR
E
FO
R
RO
UH
O
2-I
SIB
M90
U I N I M 1 1 T H A I I 1 J I
J l l r « l i n n o t I» *
tw vK T tv i
OM *1 I U H i a r r l i I 1 H 1 M l M
Mt*N 1AJ« not on
• I t at ttm rra o o t , oh_ ji
----------- » W I 1 I I 1
N O U A iliS N I H i T r 3H
OM - I
ANTWHI JO3SnV 0 T fN tm X J
Aunrhi o i ana i i i A u a r iv n s n
ro u j i s o i l i r a
. iunrn jo Hour «naO N * J C3A • )
‘ 1 a3«nrNi neu jh j*SS3NT1 o i ana u u u o r irnsn nohj ison u ra
tsaHTii jo Nouvyna
4 *2 S3A »In o i 3«3M
ira HiMia i s r l 3or
« N rO H - iT tm s