differential subcellular redistribution of protein kinase c isozymes in the rat hippocampus induced...
TRANSCRIPT

Differential Subcellular Redistribution of Protein Kinase CIsozymes in the Rat Hippocampus Induced by Kainic Acid
Robert K. McNamara, *Elizabeth A. Wees, and Robert H. Lenox
Department of Psychiatry, University of Pennsylvania School of Medicine, Abramson Research Center, Philadelphia,Pennsylvania; and*Department of Pharmacology, University of Florida College of Medicine, Gainesville, Florida, U.S.A
Abstract: Protein kinase C (PKC) consists of a family ofCa21/phospholipid-dependent isozymes that has been im-plicated in the delayed neurotoxic effects of glutamate invitro. In the present study, we assessed the effect of theglutamate analogue kainic acid (KA) on the subcellular ex-pression of PKC isozymes in the hippocampus (HPC) in theperiod preceding (0.5, 1.5, 12, and 24 h) and during (120 h)hippocampal necrosis using western blot analysis and PKCisozyme-specific antibodies. Before subcellular fraction-ation (cytosol 1 membrane), hippocampi were microdis-sected into “HPC” (fields CA1–CA3) and “dentate gyrus”(DG; granule cells 1 hilus) regions. Four general patterns ofalterations in PKC isozyme expression/distribution were ob-served following KA treatment. The first pattern was a rel-ative stability in expression following KA treatment and wasmost apparent for cytosol PKCa (HPC 1 DG) and mem-brane (HPC) and cytosol (DG) PKCbII. The second pattern,observed with PKCg and PKCe, was characterized by aninitial increase in expression in both membrane and cyto-solic fractions before seizure activity (0.5 h) followed by agradual decrease until significant reductions are observedby 120 h. The third pattern, exhibited by PKCd, involved anapparent translocation, increasing in the membrane anddecreasing in the cytosol, followed by down-regulation inboth fractions and subsequent recovery. The fourth patternwas observed with PKCz only and entailed a significantreduction in expression before and during limbic motorseizures followed by a dramatic fivefold increase in themembrane fraction during the period of hippocampal ne-crosis (120 h). Although these patterns did not segregateaccording to conventional PKC isozyme classifications,they do indicate dynamic isozyme-specific regulation byKA. The subcellular redistribution of PKC isozymes maycontribute to the histopathological sequelae produced byKA in the hippocampus and may model the pathogenesisassociated with diseases involving glutamate-induced neu-rotoxicity. Key Words: Protein kinase C—Hippocampus—Kainic acid—Neurotoxicity—Rat.J. Neurochem. 72, 1735–1743 (1999).
The pathological sequelae induced by glutamate, stud-ied predominantly in primary neuronal cultures, is asso-ciated with a disruption of intracellular Ca21 homeosta-sis mediated by bothN-methyl-D-aspartate (NMDA) andnon-NMDA glutamate receptors, the generation of free
radicals leading to lipid peroxidation, the loss of mem-brane integrity, and eventually neuronal death (reviewedby Coyle and Puttfarcken, 1993). The disruption of Ca21
homeostasis has been divided into two phases: an acutephase involving a transient increase in intracellular Ca21
concentration ([Ca21]i), followed by a second phase in-volving a protracted increase in [Ca21]i, which exceedsthe Ca21-buffering capacity of the neuron, resulting in itsdeath (Manev et al., 1989; De Erausquin et al., 1990;Randall and Thayer, 1992). The initial acute increase in[Ca21]i is NMDA receptor-dependent (Favaron et al.,1988; Manev et al., 1989; De Erausquin et al., 1990),whereas the secondary protracted increase in [Ca21]i isNMDA receptor-independent and appears to be mediatedby protein kinase C (PKC) (Connor et al., 1988; DeErausquin et al., 1990). Neurotoxic doses of glutamate orkainic acid (KA), a rigid structural analogue of gluta-mate, induce a persistent subcellular redistribution ofPKC isozymes in vitro (Favaron et al., 1990; Vaccarinoet al., 1991; Fukunaga et al., 1992; Durkin et al., 1996),and blockade of PKC activity using gangliosides, PKCinhibitors, or prior down-regulation with phorbol estersprevents both the delayed increase in [Ca21]i and theneurotoxicity induced by glutamate receptor hyperstimu-lation (Vaccarino et al., 1987; Favaron et al., 1988, 1990;Manev et al., 1989; Felipo et al., 1993).
The PKC gene family is composed of at least 12serine/threonine isozymes with differing distributions inthe CNS, subcellular target receptors, substrate affinities,and second messenger activators (Tanaka and Nishizuka,1994; Mochly-Rosen, 1995; Nishizuka, 1995; Uberall etal., 1997). PKC isozymes have been divided into three
Received July 2, 1998; final revised manuscript received December7, 1998; accepted December 8, 1998.
Address correspondence and reprint requests to Dr. R. K. McNamaraat Department of Psychiatry, University of Pennsylvania School ofMedicine, Abramson Research Center (Room 802B), 34th Street andCivic Center Boulevard, Philadelphia, PA 19104, U.S.A.
Abbreviations used:aPKC, cPKC, and nPKC, atypical, conven-tional, and novel protein kinase C, respectively; [Ca21]i, intracellularCa21 concentration; DAG, diacylglycerol; DG, dentate gyrus; HPC,hippocampus; KA, kainic acid; NMDA,N-methyl-D-aspartate; OD,optical density; PKC, protein kinase C.
1735
Journal of NeurochemistryLippincott Williams & Wilkins, Inc., Philadelphia© 1999 International Society for Neurochemistry

major classes: conventional PKC (cPKC) isozymes (a,bI, bII, and g), which are responsive to phospholipids,diacylglycerol (DAG), and Ca21; novel PKC (nPKC)isozymes (d, e, h, u, and m), which are insensitive toCa21; and atypical PKC (aPKC) isozymes (l, i, andz),which are insensitive to both Ca21 and DAG. This het-erogeneity predicts that different PKC isozymes will beactivated in response to elevations in [Ca21]i elicited byneurotoxic doses of glutamate or KA.
The systemic administration of KA produces limbicmotor seizures followed by delayed neurotoxicity in sev-eral brain regions. Within the rat hippocampus (HPC),KA selectively destroys CA1 and CA3 pyramidal neu-rons and hilar neurons but spares dentate gyrus (DG)granule cells (Nadler et al., 1978; Ben-Ari, 1985). Asobserved in neuronal cultures, the neurotoxic effect ofKA can be prevented by prior treatment with NMDAreceptor antagonists (Fariello et al., 1989; Clifford et al.,1990), reductions in [Ca21]i (Berg et al., 1995), or theinhibition or sequestration of oxygen free radicals(Dykens et al., 1987; Miyamoto and Coyle, 1990; Bruceand Baudry, 1995; MacGregor et al., 1996). However,the molecular and cellular events responsible for theselective vulnerability of pyramidal and hilar neurons toKA are poorly understood, and only a limited number ofstudies have examined the effect of KA on PKC activityor expression in vivo. In one study, KA seizures did notalter hippocampal PKC activity 20 and 96 min followingadministration (Jope et al., 1992), whereas a secondstudy observed a reduction in PKC activity in the amyg-dala and piriform cortex, but not in the HPC, 3 daysfollowing KA seizures (Steinbach and Schliebs, 1991).Seizures induced by KA increase the expression of PKCemRNA in DG granule cells 48 h after treatment, fol-lowed by an enduring elevation in PKCe immunoreac-tivity but a reduction in PKCg mRNA in areas CA1 andCA3 24 and 48 h (CA1 only) post-KA (Guglielmetti etal., 1997).
As PKC expression is regulated predominantly post-transcriptionally (Young et al., 1987), and PKC isozymesexhibit differential subcellular distribution and redistri-bution following toxic doses of glutamate in vitro(above), the present study sought to determine the effectof KA on the subcellular localization (membrane andcytosolic fractions) of individual PKC isozymes in therat HPC following KA treatment. Hippocampal PKCisozyme expression was examined before seizure onset,during and following limbic seizures, and before andduring hippocampal necrosis/apoptosis. Moreover, to en-hance the resolution of our assays, hippocampi weremicrodissected into an “HPC” component, consisting ofcell fields CA1–CA3 to enrich for pyramidal cells, whichare sensitive to the neurotoxic effects of KA, and a “DG”component, composed of the granule cell layer and thehilus to enrich for granule cells, which are relativelyresistant to KA-induced neurotoxicity (Nadler et al.,1978). Portions of this work have been presented previ-ously in abstract form (Wees et al., 1997).
MATERIALS AND METHODS
KA injectionsThe following experimental procedures were approved by
the Institutional Animal Care and Use Committee at the Uni-versity of Florida and are in accordance with the guidelines ofthe National Institutes of Health. Adult male Sprague–Dawleyrats (weighing 250–325 g; Harlan-Farms) were administeredeither KA (10 mg/ml/kg, s.c., pH 7.4; Sigma Chemical Co.) oran equivalent volume of the drug vehicle (0.9% saline, pH 7.4)and killed by decapitation at the following time points follow-ing KA administration: 0.5 (n5 3), 1.5 (n5 3), 12 (n5 3), 24(n 5 3), or 120 h (n5 3). Control rats were killed in parallelat corresponding times (n5 1 per time point), and their datawere pooled for statistical analysis. A subgroup of rats treatedwith KA (10 mg/ml/kg, n5 3 per time point) or drug vehicle(n 5 3) was killed at 24 or 120 h and hippocampal sectionsstained for Nissl (cresyl violet) or the microglia stain lectin toassess hippocampal necrosis or Timm’s stain to assess thesprouting of mossy fibers (Nadler et al., 1980). Necrosis, lectinstaining, and Timm’s staining in the supragranular layer werenot observed in the hippocampus at 24 h (data not shown).However, at 120 h necrosis and lectin staining were apparentprimarily in CA3a–b and in the hilus and Timm’s staining inthe supragranular layer was apparent only in the temporalaspect of the HPC (data not shown). The frequency and mor-phology of behavioral seizures produced by KA were recordedfor 4 h after its administration according to the scale of Racine(1972) (stages I–V). KA-treated rats initially manifested wet-dog shakes;20–30 min after KA and the first limbic motorseizure at 506 2.3 min. Seizure (stages IV and V) episodesincreased in frequency, culminating in status epilepticus within2 h of KA treatment. All KA-treated rats exhibited statusepilepticus. Status epilepticus was still apparent 12 h after KAbut had largely subsided by 24 h. By 120 h after KA, seizureshad abated, although treated rats were highly reactive. After theanimals were killed, brains were rapidly removed and imme-diately immersed in ice-cold 13 phosphate-buffered saline(Ca21/Mg21-free) for 2 min. Bilateral hippocampal tissueswere then extracted on ice and further microdissected into HPC(CA1–CA3) and DG (granule cells1 hilus) components. Tis-sue was then homogenized and prepared in accordance withsubcellular fractionation procedures.
Subcellular fractionationFollowing hippocampal microdissection, tissues were imme-
diately placed into ice-cold, freshly prepared homogenizationbuffer [20 mM HEPES (pH 7.5), 2 mM EGTA, 0.3 mg/mldithioerythritol, 0.16 mg/ml phenylmethylsulfonyl fluoride,and 0.020 mg/ml aprotinin] and homogenized. The homogenatewas centrifuged at 100,000g for 1 h at 4°C. The resultingsupernatant represented cytosolic proteins. Membrane proteinswere collected by solubilizing the remaining pellet in homog-enization buffer containing 0.1% Triton on ice for 45 min andcentrifuging at 50,000g for 30 min at 4°C. Both fractions werenormalized to contain a final concentration of 0.05% TritonX-100. Protein concentration was determined by the method ofBradford (1972). Samples were immediately boiled in 53sodium dodecyl sulfate–polyacrylamide gel electrophoresissample buffer for 3 min and stored at280°C until used.
AntibodiesPolyclonal antibodies against PKCbII and PKCd were pur-
chased from Santa Cruz Biotechnology (Santa Cruz, CA,U.S.A.). Monoclonal antibodies against PKCa, PKCe, and
J. Neurochem., Vol. 72, No. 4, 1999
1736 R. K. MCNAMARA ET AL.

PKCz were purchased from Transduction Laboratories (Lex-ington, KY, U.S.A.). The monoclonal antibody against PKCgwas purchased from Seikaguku Corp. (Tokyo, Japan). Conju-gates of anti-mouse and anti-rabbit IgG F(ab9)2 to horseradishperoxidase were purchased from Bio-Rad (Hercules, CA,U.S.A.). Chemiluminescent substrate was purchased fromPierce Chemicals (Rockford, IL, U.S.A.). Hyperfilm ECL waspurchased from Amersham (Arlington Heights, IL, U.S.A.). Allchemicals were reagent grade.
Western blottingWestern blot analysis for individual PKC isozymes was
performed by loading 10–30mg (40–60 mg for PKCz) ofprotein on 10% sodium dodecyl sulfate-polyacrylamide minigels and electrophoresing the samples for;2 h at 100 V. Thegels were transferred to a polyvinylidene difluoride membranein a Trans-Blot electrophoresis apparatus (Bio-Rad) at 100 Vfor 2 h in Towbin’s buffer [25 mM Tris (pH 8.3), 192 mMglycine, and 20% (vol/vol) methanol]. Following transfer, theblots were rinsed in TS buffer [20 mM Tris (pH 7.5) and 500mM NaCl], and nonspecific binding sites were blocked byincubating the blots in 5% dry milk in TS buffer for 30 min atroom temperature. The primary PKC isozyme-specific antiserawere diluted in TS buffer and titrated to yield optimal specificbinding. PKCa and PKCe were used at 1:2,500 dilutions.PKCbII was used at a 1:3,500 dilution. PKCd was used at a1:750 dilution, and PKCg and PKCz were used at 1:1,000dilutions. Also, the specificity of all immunoreactive proteinswas established previously by immunoblot analysis in the pres-ence or absence of competing immunizing peptide for each ofthe antibodies. The blots were incubated with the primaryantibodies for 1–2 h at room temperature, washed three timesfor 10 min in TS buffer containing 0.2% Tween, and subse-quently incubated in the second antibody (anti-mouse or -rabbitIgG horseradish peroxidase conjugate; Bio-Rad) for 1 h atroom temperature. The dilutions for the secondary antibodieswere 1:20,000 for PKCbII, PKCd, PKCg, and PKCe and1:10,000 for PKCa and PKCe. Coomassie Blue-stained gelswere used to assess equal loading of protein into gel lanes. Theblots were washed, incubated with the Pierce Super Signalchemiluminescent substrates for 5 min, exposed to film, anddeveloped. An example of a representative western blot exhib-iting membrane and cytosolic fractions in saline- and KA-treated rats is illustrated in Fig. 1.
Densitometry and quantificationOn all blots, a standard curve of known protein concentra-
tions was included to establish a linear range of detection foreach PKC isozyme. Parameters and conditions were defined foreach isozyme that would produce a signal intensity for thecontrol fractions that was in the middle of the linear range toenable accurate detection of alterations in protein levels result-ing from KA treatment. Densitometric analyses were per-formed using NIH version 1.47 imaging software. All of theoptical density (OD) values were normalized by being ex-pressed as units per microgram of protein. Differences in ODper microgram of protein values were assessed with an overallANOVA, followed by individual one-way ANOVA pendingsignificance ofp , 0.05. For graphing purposes, potentialchanges in PKC isozyme levels following KA administrationwere expressed as a percentage of control values to normalizeacross individual time points, which were electrophoresed onseparate gels.
RESULTS
Constitutive PKC subcellular distributionIn the present study, the subcellular distribution of
individual PKC isozymes was examined in cytosolic andmembrane fractions derived from HPC and DG tissues ofcontrol (saline-treated) rats and expressed as OD permicrogram of protein units to permit normalization. Con-sistent with a previous report (Jiang et al., 1994), all ofthe PKC isozymes assayed were expressed in HPC. Foreach of the PKC isozymes, expression was detected inboth fractions and in both the HPC and DG regions (Fig.2). Each of the PKC isozymes, with the exception ofPKCbII and PKCz in the HPC, was expressed at higherlevels in the cytosolic fraction relative to the membranefraction. The higher expression of PKCe in the DGrelative to other isozymes is also consistent with immu-nohistochemical data demonstrating its greater expres-sion in the DG molecular layer and hilus (Saito et al.,1993), relative to PKCa (Ito et al., 1990), PKCbII, andPKCg (Kose et al., 1990). Moreover, the lower relativelevels of PKCz in both the HPC and DG regions isconsistent with a previous report (Jiang et al., 1994).Relative expression levels of PKCbII (Kose et al., 1990)and PKCe (Saito et al., 1993) between HPC and DGregions demonstrated by immunohistochemistry werenot as apparent by immunoblot. Nevertheless, the dra-matic expression differences in HPC and DG regions ofPKCe in controls (p , 0.001) and PKCa, PKCbII, andPKCd following KA treatment (see below) indicate thesuccessful partitioning of these two regions.
cPKC isozyme (a, b, and g) expression after KAPKCa expression in HPC remained at control levels at
0.5 h but exhibited a gradual increase in the membranefraction that began at 1.5 h and was maximal at 12 h (Fig.3). However, at 24 h PKCa expression in the membranedeclined back to control levels, where it remained at120 h. At no time point did PKCa expression changesignificantly in the cytosolic fraction in HPC. In DG,PKCa expression declined in the membrane fraction at0.5 h and returned to control levels at 1.5 h, where itremained at 12 h (Fig. 3). At 24 h, PKCa expressionagain decreased in DG membranes and subsequentlyreturned to control levels at 120 h. PKCa expression didnot change significantly from control levels in the cyto-solic fraction in the DG at any time point. The mostapparent differences in PKCa expression between theHPC and DG regions was observed at 12 h, when levelsincreased in HPC (membrane) but not DG. PKCbIIexpression in HPC did not differ from controls at 0.5 hbut increased in the cytosol at 1.5 h, where it remainedelevated at all subsequent time points (Fig. 4). PKCbIIexpression in the membrane remained at control levels inHPC at all times examined. In DG, PKCbII expressionremained at control levels in both fractions at 0.5 h, wasreduced at 1.5 h in the membrane only, elevated at 12 hin the cytosol only, and returned to control levels at 24 h(Fig. 4). At 120 h, PKCbII levels decreased dramaticallyin the membrane but not cytosol. Apparent differences in
J. Neurochem., Vol. 72, No. 4, 1999
1737KAINATE AND HIPPOCAMPAL PKC EXPRESSION
PKCbII expression between the HPC and DG regionswere observed at 1.5 h, increasing in the HPC cytosolonly, and at 120 h, decreasing in DG membrane only.PKCg expression increased in both fractions of HPC at0.5 h and subsequently decreased to control levels at1.5 h, where it remained at 12 h (Fig. 5). At 24 h, PKCgexpression decreased in the cytosol only and was re-duced even more extensively in both the membrane andcytosol at 120 h. In DG, PKCg expression increased inboth fractions at 0.5 h, returned to control levels at1.5 and 12 h, and declined in the cytosol at 24 h and bothmembrane and cytosol at 120 h. The magnitude of theincrease in PKCg expression in the DG region 0.5 h afterKA was ;50% in the DG membrane and;15% in DGcytosol.
nPKC isozyme (d and e) expression after KAPKCd expression in HPC increased in the membrane
and decreased dramatically in the cytosol at 0.5 h, de-clined in both fractions at 1.5 h, and returned to controllevels at 12 h (Fig. 6). At 24 h, PKCd expression de-clined in the cytosol and returned to control levels at
120 h. In DG, PKCd expression was unaltered at 0.5 h,declined in both fractions at 1.5 h, and returned to controllevels at 12 h. At 24 h, PKCd expression declined in bothfractions and remained reduced at 120 h (Fig. 6). Differ-ential alterations in PKCd expression between HPC andDG regions were most apparent at 0.5 h, when levelsincreased in the membrane and decreased in the cytosolof the HPC only. PKCe expression in the HPC increasedin both fractions at 0.5 h, declined back to control levelsin the membrane fraction only at 1.5 h, and then declinedto control levels in the cytosol, but increased in themembrane, at 24 h (Fig. 7). At 120 h, PKCe levelsdeclined in both fractions but significantly in the cyto-solic fraction. In DG, PKCe expression increased in bothfractions at 0.5 h, decreased at 1.5 h to control levels inthe membrane fraction only, and increased in the mem-brane and decreased in the cytosol at 12 h relative to0.5 h levels. At 24 h, PKCe expression was at control
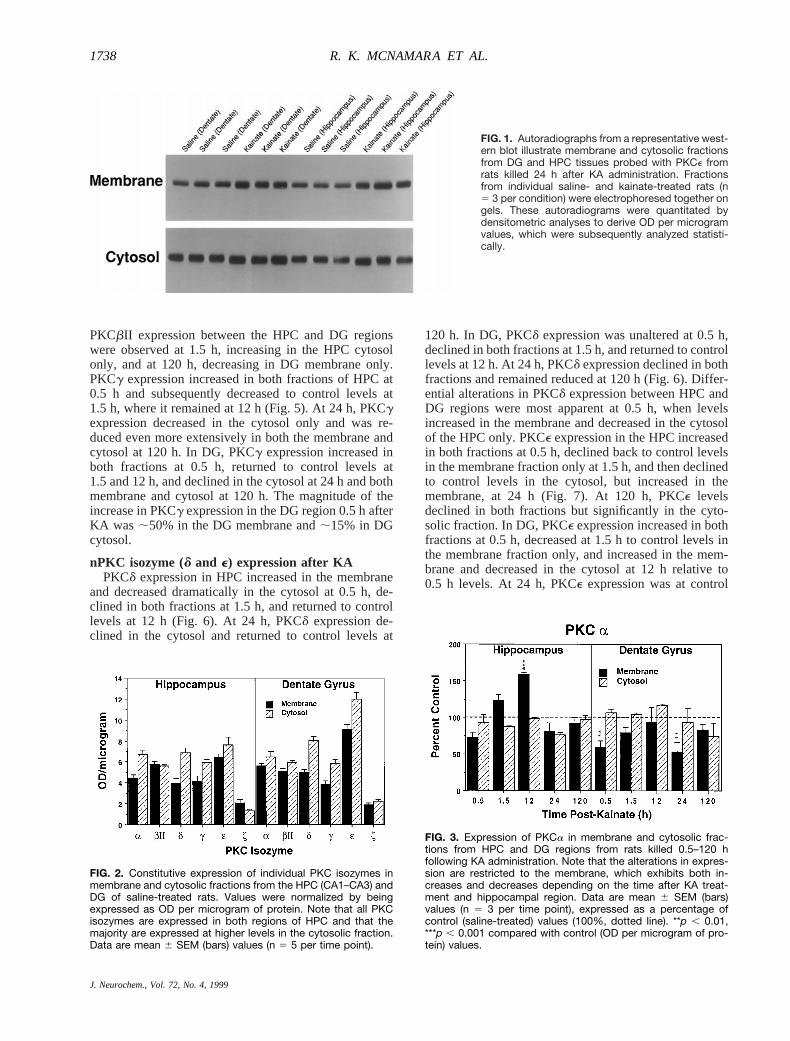
FIG. 1. Autoradiographs from a representative west-ern blot illustrate membrane and cytosolic fractionsfrom DG and HPC tissues probed with PKCe fromrats killed 24 h after KA administration. Fractionsfrom individual saline- and kainate-treated rats (n5 3 per condition) were electrophoresed together ongels. These autoradiograms were quantitated bydensitometric analyses to derive OD per microgramvalues, which were subsequently analyzed statisti-cally.
FIG. 2. Constitutive expression of individual PKC isozymes inmembrane and cytosolic fractions from the HPC (CA1–CA3) andDG of saline-treated rats. Values were normalized by beingexpressed as OD per microgram of protein. Note that all PKCisozymes are expressed in both regions of HPC and that themajority are expressed at higher levels in the cytosolic fraction.Data are mean 6 SEM (bars) values (n 5 5 per time point).
FIG. 3. Expression of PKCa in membrane and cytosolic frac-tions from HPC and DG regions from rats killed 0.5–120 hfollowing KA administration. Note that the alterations in expres-sion are restricted to the membrane, which exhibits both in-creases and decreases depending on the time after KA treat-ment and hippocampal region. Data are mean 6 SEM (bars)values (n 5 3 per time point), expressed as a percentage ofcontrol (saline-treated) values (100%, dotted line). **p , 0.01,***p , 0.001 compared with control (OD per microgram of pro-tein) values.
J. Neurochem., Vol. 72, No. 4, 1999
1738 R. K. MCNAMARA ET AL.
levels in both fractions but decreased;64% in the cy-tosolic fraction at 120 h. Although the general patterns ofchanges in PKCe expression in HPC and DG regionswere similar, the magnitude increase at 0.5 h was;80and ;40% in the HPC membrane and cytosol, respec-tively.
aPKC isozyme (z) expression after KABecause of the greater concentration of protein re-
quired to detect reliably PKCz in hippocampal fractions,the n became reduced to,3 at certain time points: HPC,membrane, 0.5 (n5 1), 1.5 (n5 1), 12 (n5 2), and 24 h(n 5 1); cytosol, 0.5 and 1.5 h (n5 2); DG, membrane,
0.5 and 12 h (n5 2). Statistical analyses were onlyconducted on groups with n5 3. PKCz expression inHPC exhibited an apparent decline in both fractions at0.5 and 1.5 h, which increased to control levels in themembrane fraction at 12 h (Fig. 8). At 24 h, PKCzexpression remained decreased in the cytosol and in-creased fivefold in the membrane fraction only at 120 h.In DG, PKCz expression was reduced in the cytosolicfraction at all time points and was apparently reduced inthe membrane fraction at 0.5 and 12 h but was found atcontrol levels at 1.5 and 24 h (Fig. 8). At 120 h, PKCzexhibited a fivefold increase in the membrane fraction.
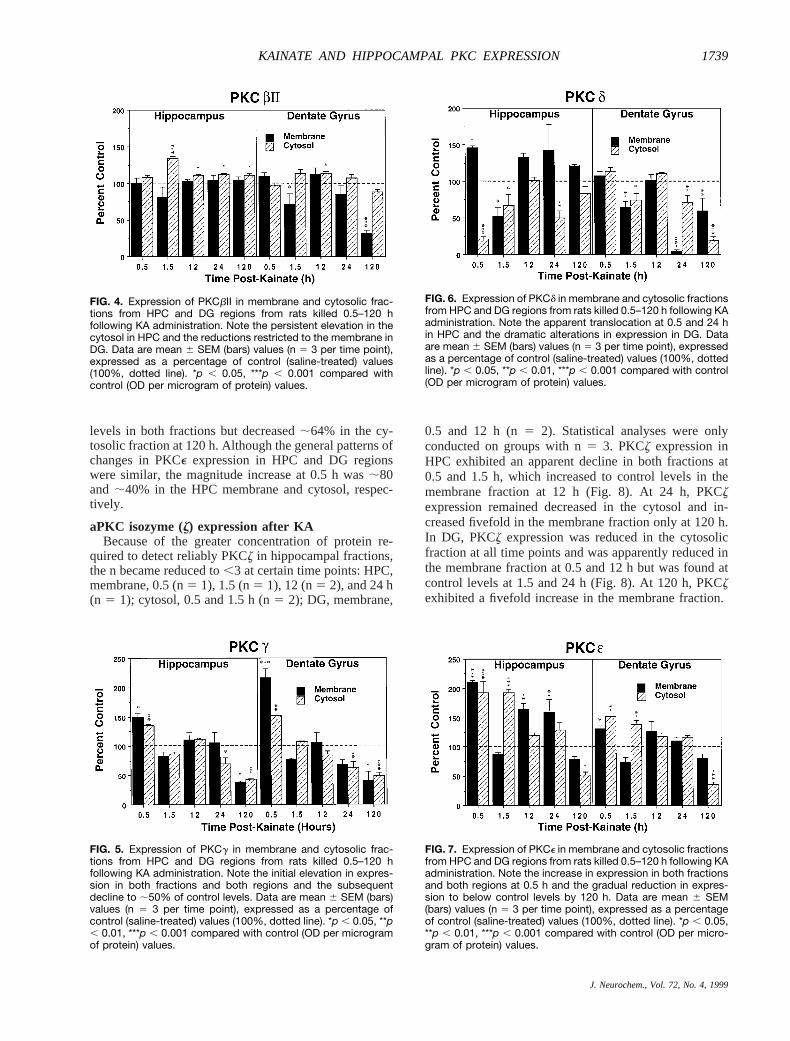
FIG. 4. Expression of PKCbII in membrane and cytosolic frac-tions from HPC and DG regions from rats killed 0.5–120 hfollowing KA administration. Note the persistent elevation in thecytosol in HPC and the reductions restricted to the membrane inDG. Data are mean 6 SEM (bars) values (n 5 3 per time point),expressed as a percentage of control (saline-treated) values(100%, dotted line). *p , 0.05, ***p , 0.001 compared withcontrol (OD per microgram of protein) values.
FIG. 5. Expression of PKCg in membrane and cytosolic frac-tions from HPC and DG regions from rats killed 0.5–120 hfollowing KA administration. Note the initial elevation in expres-sion in both fractions and both regions and the subsequentdecline to ;50% of control levels. Data are mean 6 SEM (bars)values (n 5 3 per time point), expressed as a percentage ofcontrol (saline-treated) values (100%, dotted line). *p , 0.05, **p, 0.01, ***p , 0.001 compared with control (OD per microgramof protein) values.
FIG. 6. Expression of PKCd in membrane and cytosolic fractionsfrom HPC and DG regions from rats killed 0.5–120 h following KAadministration. Note the apparent translocation at 0.5 and 24 hin HPC and the dramatic alterations in expression in DG. Dataare mean 6 SEM (bars) values (n 5 3 per time point), expressedas a percentage of control (saline-treated) values (100%, dottedline). *p , 0.05, **p , 0.01, ***p , 0.001 compared with control(OD per microgram of protein) values.
FIG. 7. Expression of PKCe in membrane and cytosolic fractionsfrom HPC and DG regions from rats killed 0.5–120 h following KAadministration. Note the increase in expression in both fractionsand both regions at 0.5 h and the gradual reduction in expres-sion to below control levels by 120 h. Data are mean 6 SEM(bars) values (n 5 3 per time point), expressed as a percentageof control (saline-treated) values (100%, dotted line). *p , 0.05,**p , 0.01, ***p , 0.001 compared with control (OD per micro-gram of protein) values.
J. Neurochem., Vol. 72, No. 4, 1999
1739KAINATE AND HIPPOCAMPAL PKC EXPRESSION

DISCUSSION
KA induced alterations in the subcellular distributionof individual PKC isozymes in a temporally and region-ally specific manner. At 0.5 h following KA treatment,before the onset of motor seizures, PKC isozymes ex-hibited both dramatic increases in expression (PKCg andPKCe), decreases in expression (PKCa and PKCz), anapparent translocation from cytosol to the membrane (inHPC, PKCd), or no change in expression (in HPC,PKCa, and PKCbII; in DG, PKCd). At 1.5 h followingKA treatment, when rats had experienced an average of5.7 6 0.9 stage IV/V limbic motor seizures, PKCisozyme expression exhibited both elevations (PKCbII)and reductions (PKCg, PKCd, and PKCe) from 0.5 hlevels or no apparent change in expression or subcellulardistribution (PKCa and PKCz). At 12 h following KAtreatment, when rats had experienced chronic seizures(status epilepticus), PKC isozymes exhibited no differ-ence from control values (PKCg and PKCd) or increasesin levels in the membrane (PKCa and PKCe) or cytosol(PKCbII) or remained decreased in level in the cytosol(PKCz). At 24 h following KA treatment, when limbicmotor seizures had largely subsided and before the ap-pearance of gross hippocampal necrosis, most PKCisozymes (PKCa, PKCd, PKCg, and PKCz) exhibitedreduced expression relative to controls with the excep-tion of PKCbII and PKCe, which remained elevated inthe hippocampus. At 120 h following KA treatment,during hippocampal necrosis, PKC isozymes exhibitedsignificant reductions (PKCd, PKCe, and PKCg), nochange (PKCa), and marginal (PKCbII) or dramatic(PKCz, membrane only) elevation in expression.
These results underscore the diversity in the regulationof individual PKC isozymes and suggest a complexpattern of synthesis, translocation, and degradation of
individual PKC isozymes in association with the se-quence of histopathology induced by KA. The dramaticincreases in PKCg and PKCe 0.5 h after KA treatmentoccur in both fractions and are, therefore, likely not dueto a translocation, which is exemplified by PKCd (HPC),for which an increase in content in the membrane isaccompanied by a reduction in the cytosol of similarmagnitude. Instead, such increases could be attributed toa reduction in proteolytic degradation or a rapid induc-tion in synthesis. Indeed, Young et al. (1987) demon-strated that PKC synthesis can occur as quickly as 15min following down-regulation with phorbol esters.Moreover, the reductions in PKC isozymes observed atvarious points in the absence of apparent translocationfrom the other fraction could be attributed to proteolyticdegradation, which can occur at a rapid rate (2.4 h for a50% reduction) following phorbol ester treatment(Young et al., 1987). It is of interest that individual PKCisozymes undergo degradation at different rates in vitrofollowing phorbol ester treatment, with PKCa beingmore resistant to degradation relative to PKCb andPKCg (Ase et al., 1988; Huang et al., 1989). In thepresent study, PKCg did exhibit a gradual reduction inexpression following KA treatment, whereas PKCa ex-pression did not diminish over the same period, suggest-ing that the degradation of these two isozymes may bedifferentially regulated in vivo as well. However, it isalso possible that the reduction of PKCg in the HPCregion may be secondary to a reduction in level of PKCgmRNA (Guglielmetti et al., 1997) rather than proteolyticdegradation. It should also be noted that the reductions inPKCg and PKCe in the HPC 120 h after KA treatmentare unlikely to be due exclusively to a reduction in thenumber of neurons because PKCa, PKCbII, and PKCdexpression remained at control levels at this time, al-though a compensating elevation in expression in reac-tive glial cells cannot be discounted.
The alterations in individual PKC isozyme expression,when generalized across hippocampal region, exhibitfour general patterns following KA treatment. The firstpattern, which is exhibited by PKCa and PKCbII, entailsa relative stability in expression following KA treatment,which is most apparent for cytosol PKCa (HPC 1 DG)and membrane (HPC) and cytosol (DG) PKCbII. Thesecond pattern, which is exhibited by PKCg and PKCe,entails an initial increase in expression in both membraneand cytosolic fractions before seizure activity (0.5 h)followed by a gradual decrease until significant reduc-tions are observed by 120 h. The third pattern, exhibitedby PKCd in HPC only, involves an apparent transloca-tion, increasing in the membrane and decreasing in thecytosol, followed by down-regulation in both fractionsand subsequent recovery. The fourth pattern, exhibitedby PKCz, entails a significant reduction before limbicmotor seizures, which is largely sustained until 120 h, atwhich point expression in the membrane fraction in-creases dramatically. Although these patterns of expres-sion do not conform well to the divisions of PKCisozymes into cPKC (Ca21- and DAG/phospholipid-de-
FIG. 8. Expression of PKCz in membrane and cytosolic fractionsfrom HPC and DG regions from rats killed 0.5–120 h following KAadministration. Note the early, and relatively persistent, reduc-tion in expression followed by a dramatic fivefold increase inmembrane expression at 120 h. Data are mean 6 SEM (bars)values (n 5 3 per time point), expressed as a percentage ofcontrol (saline-treated) values (100%, dotted line). **p , 0.01,***p , 0.001 compared with control (OD per microgram of pro-tein) values.
J. Neurochem., Vol. 72, No. 4, 1999
1740 R. K. MCNAMARA ET AL.

pendent), nPKC (Ca21-independent), and aPKC (Ca21-and DAG/phospholipid-independent), the noted distinc-tion between the aPKCz and other cPKC and nPKCisozymes does suggest that KA can alter PKC expressionindependently of Ca21 and DAG. Moreover, the appar-ent similarity between PKCg (Ca21-responsive) andPKCe (Ca21-insensitive) suggests that alterations in ex-pression are not mediated by Ca21 exclusively. Thislatter point is further supported by the differential alter-ations induced by KA in individual cPKC (Ca21-respon-sive) isozyme expression.
HPC CA1 and CA3 pyramidal neurons and DG hilarneurons are selectively vulnerable to the neurotoxic ef-fects of KA, whereas DG granule cells are relativelyresistant (Nadler et al., 1978; Ben-Ari, 1985). In thepresent study, HPC tissues were microdissected into an“HPC” component, consisting of cell fields CA1–CA3 toenrich for KA-susceptible pyramidal cells, and a “DG”component to enrich for KA-resistant granule cells. KAdid have differential effects on PKC isozyme expressionbetween the HPC and DG regions. The most apparentdistinctions between the two regions include an elevationof membrane PKCa at 12 h in HPC but not DG, anelevation in cytosolic PKCbII at 1.5 h in HPC and notDG, an apparent translocation of PKCd at 0.5 h in HPCbut not DG, and a larger increase of PKCe content inHPC relative to DG, and vice versa for PKCg, at thesame time point. Although the DG is “contaminated”with KA-sensitive hilar neurons, these differential PKCresponses may nevertheless be relevant to the differentialsensitivity of hippocampal neurons to KA.
Previous studies using primary neuronal cultures haveprovided data to indicate that glutamate-induced neuro-toxicity is preceded by an elevation in membrane PKCbexpression that persists even after glutamate is with-drawn (Favaron et al., 1990). In the present study, we didnot observe an increase in membrane PKCbII and in factobserved reductions in membrane PKCbII level in DGand a persistent elevation in cytosolic PKCbII level inHPC (Fig. 4). During ischemia, PKCa, PKCbII, andPKCg immunoreactivity increases in the membrane, andPKCbII and PKCg exhibit a transient increase in thecytosol (Cardell and Wieloch, 1993). During subsequentreperfusion, PKCbII returns to control levels, and PKCg(cytosol) expression exhibits a long-term (7-day) de-crease below control levels (Cardell et al., 1990; Wielochet al., 1991). In the present study, KA also induced anearly increase in PKCg expression in the membrane andcytosol that subsequently declined, first to control levelsand then below control levels (Fig. 5). Although it isproblematic to compare between different studies usingdifferent methods to induce brain injury, e.g., KA versusischemia, an initial increase in membrane PKCg fol-lowed by its reduction in both membrane and cytosolicfractions may represent a common event leading to glu-tamate-induced neuronal death in vivo.
Although the chronic limbic motor seizures (statusepilepticus) induced by KA subside;10 h before evi-dent neurotoxicity, seizure severity is highly correlated
with the degree of subsequent tissue necrosis(O’Shaughnessy and Gerber, 1986), suggesting that al-terations in PKC isozyme expression following KA sei-zures may contribute in some manner to the ensuingnecrosis. Several studies have assessed the effects ofseizures induced by chemical or electrical kindling onPKC isozyme expression. Chronic pentylentetrazole- orelectroconvulsive-induced seizures selectively increasePKCg immunoreactivity in both cytosolic and membranefractions in whole-brain homogenates determined imme-diately following the final seizure elicitation (Chen,1994a,b), and PKCg expression is elevated in contralat-eral piriform and entorhinal cortices;3 months follow-ing amygdala kindling (Beldhuis et al., 1993). Moreover,hippocampal kindling is associated with long-term ele-vations in PKCb and PKCg, but not PKCa, membrane-associated activities (Ono et al., 1994). These resultssuggest that seizures developed by electrical and chem-ical kindling induce a persistent elevation in PKCg ex-pression and associated activity. However, in the presentstudy PKCg expression was only elevated before theonset of KA-induced motor seizures (0.5 h; Fig. 5), didnot differ from control levels during seizure activity (1.5and 12 h post-KA), and exhibited a reduction in expres-sion in the period following status epilepticus (24 hpost-KA). This discrepancy between the present andprevious studies may be reconciled by the fact that theelectrical or chemical kindling used in the previous stud-ies does not produce the same degree of neuronal loss inthe hippocampus that KA does (Cavazos et al., 1994).Therefore, the long-term increases in PKCg levels ob-served after electrical and chemical kindling may beassociated with elevated neuronal excitability whereasthe reductions observed after KA may be associated withimpending neuronal death. A role for PKCg in the neu-rotoxic effects of KA is further suggested by the previousfinding that PKCg mRNA expression, but not that ofPKCa, PKCb, or PKCe mRNA, was reduced in vulner-able CA1 and CA3 neurons, but not in KA-resistant DGgranule cells, following KA (Guglielmetti et al., 1997).
Perhaps the most striking alteration in PKC isozymeexpression was observed with PKCz, which exhibited afivefold increase in expression in the membrane of bothHPC and DG regions 120 h following KA administration(Fig. 8). It is unclear from the present findings whetherthis dramatic increase is localized to reactive glial cells(activated microglia/astrocytes), degenerating neurons,or both, although previous reports do suggest that PKCzis localized primarily in neurons (Hunter et al., 1995). Itis also unclear whether the elevation in PKCz at 120 h isassociated with neuronal degeneration or the sprouting ofgranule cell axons, the mossy fibers, which was similarlyobserved at the 120 h time point after KA (data notshown). Previous data indicate that programmed celldeath (apoptosis) is associated with reductions, not ele-vations, in PKCz expression in several cell lines (Deaconet al., 1997). However, a role for PKCz in axonal sprout-ing is supported by the fact that it is developmentallyregulated in HPC, with high expression coinciding with
J. Neurochem., Vol. 72, No. 4, 1999
1741KAINATE AND HIPPOCAMPAL PKC EXPRESSION

the period of mossy fiber outgrowth (Jiang et al., 1994),has been shown to play a critical role in the initiation ofnerve growth factor-induced neurite outgrowth in PC12cells (Coleman and Wooten, 1994), and is concentratedin neurite and regenerating axonal growth cones (Woo-ten et al., 1994; Kawano et al., 1997). Furthermore,because granule cell axons terminate both in the hilusand on CA3 dendrites, increased PKCz expression inmossy fiber axons would be observed in both the HPCand DG regions. Nevertheless, future studies using im-munohistochemical methods will be required to localizePKCz in HPC following KA.
In summary, the present findings demonstrate that KAinduces alterations in the subcellular expression of indi-vidual PKC isozymes in a temporally and regionallyspecific manner. These findings corroborate earlier invitro studies implicating PKC in the neurotoxic effects ofglutamate as well as in vivo studies demonstrating alter-ations in PKC isozyme expression following ischemia(Cardell et al., 1990; Wieloch et al., 1991). Moreover,the present findings extend earlier findings exhibitingalterations in PKC isozyme mRNA in HPC followingKA (Guglielmetti et al., 1997) by demonstrating pro-found alterations in PKC isozyme protein expression andsubcellular distribution following KA. Future studieswill be required to determine the causal relationshipbetween alterations in PKC isozyme expression and sub-cellular distribution and the neuropathological conse-quences produced by KA, as well as to determine whichPKC substrates, including both NMDA receptors (Tin-gley et al., 1997) and calcium channels (Stea et al.,1995), mediate the neuropathological actions of PKC.Nevertheless, these findings suggest that the KA seizureparadigm will be a valuable tool to elucidate the cellularand molecular mechanisms associated with glutamate-induced neurodegeneration in vivo, with implications forseveral chronic neurodegenerative disorders, includingHuntington’s disease, Alzheimer’s disease, and temporallobe epilepsy, trauma, and focal ischemia (Choi, 1988;Manev et al., 1990; Coyle and Puttfarcken, 1993; Liptonand Rosenberg, 1994).
Acknowledgment: This research was supported in part bygrants from the Stanley Foundation to R.H.L. and R.K.M. andfrom MRC/CIBA-GEIGY to R.K.M.
REFERENCES
Ase K., Berry N., Kikkawa U., Kishimoto A., and Nishizuka Y. (1988)Differential down-regulation of protein kinase C subspecies inKM3 cells. FEBS Lett.236,396–400.
Barrios M. and Liljequist S. (1996) Developmental changes in gluta-mate receptor-activated translocation of protein kinase C in cere-bellar granule neurons.Dev. Brain Res.94, 22–30.
Beldhuis H. J., De Ruiter A. J. H., Maes F. W., Suzuki T., and BohusB. (1993) Long-term increase in protein kinase C-g and musca-rinic acetylcholine receptor expression in the cerebral cortex ofamygdala-kindled rats—a quantitative immunocytochemicalstudy.Neuroscience55, 965–973.
Ben-Ari Y. (1985) Limbic seizure and brain damage produced bykainic acid: mechanism and relevance to human temporal lobeepilepsy.Neuroscience14, 375–403.
Berg M., Bruhn T., Frandsen A., Schousboe A., and Diemer N. H.(1995) Kainic-acid-induced seizures and brain damage in the rat:role of calcium homeostasis.J. Neurosci Res.40, 641–646.
Bradford M. M. (1972) A rapid and sensitive method for the quanti-tation of microgram quantities of protein utilizing the principle ofprotein–dye binding.Anal. Biochem.72, 248–254.
Bruce A. J. and Baudry M. (1995) Oxygen free radicals in rat limbicstructures after kainate-induced seizures.Free Radic. Biol. Med.18, 993–1002.
Cardell M. and Wieloch T. (1993) Time course of the translocation andinhibition of protein kinase C during complete cerebral ischemiain the rat.J. Neurochem.61, 1308–1314.
Cardell M., Bingren H., Wieloch T., Zivin J., and Saitoh T. (1990)Protein kinase C is translocated to cell membranes during cerebralischemia.Neurosci. Lett.119,228–232.
Cardell M., Boris-Moller F., and Wieloch T. (1991) Hypothermiaprevents the ischemia-induced translocation and inhibition of pro-tein kinase C in the rat striatum.J. Neurochem.57, 1814–1817.
Cavazos J. E., Das I., and Sutula T. P. (1994) Neuronal loss induced inlimbic pathways by kindling: evidence for induction of hippocam-pal sclerosis by repeated brief seizures.J. Neurosci.14, 3106–3121.
Chen C.-C. (1994a) Alterations of protein kinase C isozyme andsubstrate proteins in mouse brain after electroconvulsive seizures.Brain Res.648,65–72.
Chen C.-C. (1994b) Pentylenetetrazole-induced chemoshock affectsprotein kinase C and substrate proteins in mouse brain.J. Neuro-chem.62, 2308–2315.
Choi D. W. (1988) Glutamate neurotoxicity and diseases of the nervoussystem.Neuron1, 623–634.
Clifford D. B., Olney J. W., Benz A. M., Fuller T. A., and ZorumskiC. F. (1990) Ketamine, phencyclidine, and MK-801 protectagainst kainic acid-induced seizure-related brain damage.Epilep-sia 31, 382–390.
Coleman E. S. and Wooten M. W. (1994) Nerve growth factor-induceddifferentiation of PC12 cells employs the PMA-insensitive proteinkinase C-z isoform.J. Mol. Neurosci.5, 39–57.
Connor J. A., Wadman W. J., Hockberger P. E., and Wong R. K. S.(1988) Sustained dendritic gradients of Ca21 induced by excita-tory amino acids in CA1 hippocampal neurons.Science240,649–653.
Coyle J. T. and Puttfarcken P. (1993) Oxidative stress, glutamate, andneurodegenerative dosorders.Science262,689–695.
Deacon E. M., Pongracz J., Griffiths G., and Lord J. M. (1997)Isozymes of protein kinase C: differential involvement in apopto-sis and pathogenesis.J. Clin. Pathol. Mol. Pathol.50, 124–131.
De Erausquin G. A., Manev H., Guidotti A., Costa E., and Brooker G.(1990) Gangliosides normalize distorted single-cell intracellularfree Ca21 dynamics after toxic doses of glutamate in cerebellargranule cells.Proc. Natl. Acad. Sci. USA87, 8017–8021.
Durkin J. P., Tremblay R., Buchan A., Blosser J., Chakravarthy B.,Mealing G., Morley P., and Song D. (1996) An early loss inmembrane protein kinase C activity precedes the excitatory aminoacid-induced death of primary cortical neurons.J. Neurochem.66,951–962.
Dykens J. A., Stern A., and Trenkner E. (1987) Mechanism of kainatetoxicity to cerebellar neurons in vitro is analogous to reperfusiontissue injury.J. Neurochem.49, 1222–1228.
Fariello R. G., Golden G. T., Smith G. G., and Reyes P. F. (1989)Potentiation of kainic acid epileptogenicity and sparing fromneuronal damage by an NMDA receptor antagonist.Epilepsy Res.3, 206–213.
Favaron M., Manev H., Alho H., Bertolino M., Ferret B., Guidotti A.,and Costa E. (1988) Gangliosides prevent glutamate and kainateneurotoxicity in primary neuronal cultures of neonatal rat cere-bellum and cortex.Proc. Natl. Acad. Sci. USA85, 7351–7355.
Favaron M., Manev H., Siman R., Bertolino M., Szekely A. M.,DeErausquin G., Guidotti A., and Costa E. (1990) Down-regula-tion of protein kinase C protects cerebellar granule neurons inprimary culture from glutamate-induced neuronal death.Proc.Natl. Acad. Sci. USA87, 1983–1987.
J. Neurochem., Vol. 72, No. 4, 1999
1742 R. K. MCNAMARA ET AL.

Felipo V., Minana M.-D., and Grisolia S. (1993) Inhibitors of proteinkinase C prevent the toxicity of glutamate in primary neuronalcultures.Brain Res.604,192–196.
Fukunaga K., Soderling T. R., and Miyamoto E. (1992) Activation ofCa21/calmodulin-dependent protein kinase II and protein kinase Cby glutamate in cultured rat hippocampal neurons.J. Biol. Chem.267,22527–22533.
Guglielmetti F., Rattray M., Baldessari S., Butelli E., Samanin R., andBendotti C. (1997) Selective up-regulation of protein kinase Ce ingranule cells after kainic acid-induced seizures in rat.Mol. BrainRes.49, 188–196.
Huang F. L., Yoshida Y., Cunha-Melo J. R., Beaven M. A., and HuangK.-P. (1989) Differential down-regulation of protein kinase Cisozymes.J. Biol. Chem.264,4238–4243.
Hunter S. E., Seibenhener M. L., and Wooten M. W. (1995) Atypicalz-protein kinase C displays a unique developmental expressionpattern in rat brain.Dev. Brain Res.85, 239–248.
Ito A., Saito N., Hirata M., Kose A., Tsujino T., Yoshihara C., OgitaK., Kishimoto A., Nishizuka Y., and Tanaka C. (1990) Immuno-cytochemical localization of thea subspecies of protein kinase Cin rat brain.Proc. Natl. Acad. Sci. USA87, 3195–3199.
Jiang X., Naik M. U., Hrabe J., and Sacktor T. C. (1994) Developmen-tal expression of the protein kinase C family in rat hippocampus.Dev. Brain Res.78, 291–295.
Jope R. S., Kolasa K., Song L., and Ormandy G. C. (1992) Seizuresselectively impair agonist-stimulated phosphoinositide hydrolysiswithout affecting protein kinase C activity in rat brain.Neurotoxi-cology13, 389–400.
Kawano S., Okajima S., Mizoguchi A., Tamai K., Hirasawa Y., and IdaC. (1997) Immunocytochemical distribution of Ca21-independentprotein kinase C subtypes (d, e, andz) in regulating axonal growthcones of rat peripheral nerve.Neuroscience81, 263–273.
Kose A., Ito A., Saito N., and Tanaka C. (1990) Electron microscopiclocalization ofg- and bII-subspecies of protein kinase C in rathippocampus.Brain Res.518,209–217.
Lipton S. A. and Rosenberg P. A. (1994) Excitatory amino acids as afinal common pathway for neurologic disorders.N. Engl. J. Med.330,613–622.
MacGregor D. G., Higgins M. J., Jones P. A., Maxwell W. L., WatsonM. W., Graham D. I., and Stone T. W. (1996) Ascorbate attenu-ates the systemic kainate-induced neurotoxicity in the rat hip-pocampus.Brain Res.727,133–144.
Manev H., Favaron M., Guidotti A., and Costa E. (1989) Delayedincrease of Ca21 influx elicited by glutamate: role in neuronaldeath.Mol. Pharmacol.36, 106–112.
Manev H., Costa E., Wroblewski J. T., and Guidotti A. (1990) Abusivestimulation of excitatory amino acid receptors: a strategy to limitneurotoxicity.FASEB J.4, 2789–2797.
Miyamoto M. and Coyle J. T. (1990) Idebenone attenuates neuronaldegeneration induced by intrastriatal injection of excitotoxins.Exp. Neurol.108,38–45.
Mochly-Rosen D. (1995) Localization of protein kinases by anchoringproteins: a theme in signal transduction.Science268,247–251.
Nadler J. V., Perry B. W., and Cotman C. W. (1978) Intraventricularkainic acid preferentially destroys hippocampal pyramidal cells.Nature271,676–677.
Nadler J. V., Perry B. W., Gentry C., and Cotman C. W. (1980) Lossand reacquisition of hippocampal synapses after selective destruc-tion of CA3–CA4 afferents with kainic acid.Brain Res.191,387–403.
Nishizuka Y. (1995) Protein kinase C and lipid signaling for sustainedcellular responses.FASEB J.9, 484–496.
Ono M., Akiyama K., Tsutsui K., and Kuroda S. (1994) Differentialchanges in the activities of multiple protein kinase C subspecies inthe hippocampal-kindled rat.Brain Res.660,27–33.
O’Shaughnessy D. and Gerber G. J. (1986) Damage induced by sys-temic kainic acid in rats is dependent upon seizure activity—abehavioral and morphological study.Neurotoxicology7, 187–202.
Racine R. J. (1972) Modification of seizure activity by electricalstimulation: II. Motor seizure.Electroencephalogr. Clin. Neuro-physiol.32, 281–294.
Randall R. D. and Thayer S. A. (1992) Glutamate-induced calciumtransient triggers delayed calcium overload and neurotoxicity inrat hippocampal neurons.J. Neurosci.12, 1882–1895.
Saito N., Itouji A., Totani Y., Osawa I., Koide H., Fujisawa N., OgitaK., and Tanaka C. (1993) Cellular and intracellular localaizationof e-subspecies of protein kinase C in the rat brain; presynapticlocalization of thee-subspecies.Brain Res.607,241–248.
Stea A., Soong T. W., and Snutch T. P. (1995) Determinants ofPKC-dependent modulation of a family of neuronal calcium chan-nels.Neuron15, 929–940.
Steinbach J., and Schliebs R. (1991) Kainic acid-induced convulsionsaffect phorbol ester binding to protein kinase C and in vitroprotein phosphorylation in rat amygdala and piriform cortex.Neurochem. Int.19, 235–241.
Tanaka C. and Nishizuka Y. (1994) The protein kinase C family forneuronal signaling.Annu. Rev. Neurosci.17, 551–567.
Tingley W. G., Ehlers M. D., Kameyama K., Doherty C., Ptak J. B.,Riley C. T., and Huganir R. L. (1997) Characterization of proteinkinase A and protein kinase C phosphorylation of theN-methyl-D-aspartate receptor NR1 subunit using phosphorylation site-spe-cific antibodies.J. Biol. Chem.272,5157–5166.
Uberall F., Giselbrecht S., Hellbert K., Fresser F., Bauer B., GschwendtM., Grunicke H. H., and Baier G. (1997) Conventional PKC-a,novel PKC-e and PKC-u, but not atypical PKC-l are MARCKSkinases in intact NIH 3T3 fibroblasts.J. Biol. Chem.272,4072–4078.
Vaccarino F. M., Guidotti A., and Costa E. (1987) Ganglioside inhi-bition of glutamate-mediated protein kinase C translocation inprimary cultures of cerebellar neurons.Proc. Natl. Acad. Sci. USA84, 8707–8711.
Vaccarino F. M., Liljequist S., and Tallman J. F. (1991) Modulation ofprotein kinase C translocation by excitatory and inhibitory aminoacids in primary cultures of neurons.J. Neurochem.57, 391–396.
Wees E. A., McNamara R. K., and Lenox R. H. (1997) Subcellulardistribution of protein kinase C isozymes in rat hippocampusfollowing kainic acid-induced seizures.Soc. Neurosci. Abstr.23,2156.
Wieloch T., Cardell M., Bingren H., Ziven J., and Saitoh T. (1991)Changes in the activity of protein kinase C and the differentialsubcellular redistribution of its isozymes in the rat striatum duringand following transient forebrain ischemia.J. Neurochem.56,1227–1235.
Wooten M. W., Zhou G., Seibenhener M. L., and Coleman E. S. (1994)A role for z protein kinase C in nerve growth factor-induceddifferentiation of PC12 cells.Cell Growth Differ.5, 395–403.
Young S., Parker P. J., Ullrich A., and Stabel S. (1987) Down-regulation of protein kinase C is due to an increased rate ofdegradation.Biochem. J.244,775–779.
J. Neurochem., Vol. 72, No. 4, 1999
1743KAINATE AND HIPPOCAMPAL PKC EXPRESSION