differential binding of lectins to lymphopoietic and myelopoietic cells in murine marrow as revealed...
TRANSCRIPT

Cytometry 5:194-203 (1984) 0 1984 Alan R. Liss. Inc.
Differential Binding of Lectins to Lymphopoietic and Myelopoietic Cells in Murine Marrow as Revealed
by Flow Cytometry J. Reimann, D. Ehman, and R.G. Miller
Ontario Cancer Institute and Department of Medical Biophysics, University of Toronto,Toronto M4X 1K9, Canada Received for publication August 10, 1983; accepted October 29, 1983
Murine marrow cells were labeled with a panel of fluorescein-conjugated lectins and analyzed by flow cytometry. All lectins tested [concanavalin A (Con A), phytohemagglu- tinin (PHA), wheat germ agglutinin (WGA), pokeweed mitogen (PWM), soybean agglu- tinin (SBA), peanut agglutinin (PNA), lentil lectin (LL)], stained a fraction of marrow cells; the fraction was, over a defined concen- tration range, linearly related to the loga- rithm of the lectin concentration. The slope of this titration curve was characteristic of the particular lectin tested but independent of
staining concentrations. These subsets were composed of cells with restricted and charac- teristic size distributions as determined by forward light scatter. Lectin staining pat- terns of marrow cells from normal mice were compared with those of athymic nude mice and mice with severe combined immunodefi- ciency (SCID). Normal and nude mice lacked a subset of small cells, dimly stained by Con A and PWM, but brightly stained by PNA. This subset, uniquely defined by the above lectins, appears to correspond to the lympho- poietic marrow compartment.
the nominal sugar specificity of the respective lectin. Con A-, PWM-, and PNA-labeled mar- row cells showed brightly and dimly stained subsets in relative fluorescence intensity dis- tribution histograms at high or intermediate
Key terms: Flow cytometry, lectin, marrow cell subpopulations, mice with severe com- bined immunodeficiency, athymic nude mice
In bone marrow, many different lineages of lympho- and is reversible on competition with an appropriate myeloid cells develop from noncommitted stem cells to monosaccharide. committed progenitor cells which in turn develop Differential lectin binding to cell subsets may be an through a sequence of intermediate maturation steps indication for differential surface glycosylation patterns into differentiated end-stage blood cells. Hence, an array between these subsets, which in turn might be related of different maturation stages of several different lin- to the differentiated andor functional state of one subset v
eages coexist in vertebrate bone marrow, making it per- haps the most heterogeneous and complex cell population in vertebrates. To the present time, analysis and separation of these subpopulations, based on mor- phologic criteria, functional assays, and cell surface markers, have not been entirely successful in resolving all lineages and identifying all subpopulations. New approaches might be useful.
Different classes of glycoproteins and different glyco- sylation patterns of a particular glycoprotein occur on cell surfaces in the course of differentiation and devel- opment (3,4,7,12,24-26). Particular configurations of sugars on glycoproteins can be recognized by lectins which are (glyco) proteins of nonimmune origin that combine with particular sugar sequences. Binding is tight and multivalent. However, it is also noncovalent
vs the other. Our objective in the present study was to determine whether the differential binding of a panel of lectins can discriminate marrow cell subsets, as a basis for eventual separation of functional lymphopoietic pre- cursor subsets.
Diverse techniques are available for studying binding of lectins to cells, involving, e.g., agglutination, immu- nofluorescence, autoradiography, rosetting, mitogenic assays, and cell affinity chromatography (reviewed in ref. 24). Optimal resolution is achieved when binding of
This work was supported by National Cancer Institute of Canada.
Address reprint requests to Dr. R.G. Miller, Ontario Cancer Insti- J.R. is a fellow of the Deutsche Forschungsgemeinshaft.
tute, 500 Sherbourne Street, Toronto M4X 1K9, Canada.

DIFFERENTIAL BINDING OF LECTINS 195
lectins to single cells is quantitatively analyzed for a large number of cells. We therefore analyzed binding of a panel of fluorescein isothiocyanate (F1TC)-conjugated lectins to murine bone marrow cells by flow cytometry. This allowed quantitative fluorescence analysis of indi- vidual cells and could be simply combined with size measurement of individual cells as determined by for- ward light scatter intensity (FLSI, ref. 10).
An autosomal-recessive mutation was recently de- scribed which is phenotypically expressed in homozy- gous mice as a state of severe combined immunodeficiency (SCID) (2). In these mice a congenital intrinsic defect at the level of lymphoid stem or progenitor cells is sug- gested by the absence of lymphopoiesis in the bone mar- row and the establishment of lymphopoiesis from congeneic marrow grafts. We therefore reasoned that the comparison of differentially lectin-labeled marrow subsets in mutant SCID mice and immunocompetent congenic wild-type CB17 strain mice might reveal a marrow cell compartment characteristic for lympho- poiesis. Through combined use of dual-parameter anal- ysis of fluorescence and light scatter we were able to delineate a marrow cell subpopulation that is absent in mice with the SCID mutation but present in the con- genic CB17 strain as well as in both euthymic and athymic (nude) mice of other inbred strains. It thus represents a candidate for the lymphopoietic compart- ment of murine marrow. These results revealed differ- ential patterns of lectin binding of the lymphopoietic vs the myelopoietic marrow cell subsets.
MATERIALS AND METHODS Mice
Nu/+ (RNC x BALB/c) F1-hybrid mice (H-2Wd) and their homozygous athymic n d n u littermates, BALB/c mice (H-2d), as well as (BALBk-congenic) CB17 (H-2d) and mutant SCID mice (H-2d) were bred in the animal colony of the Ontario Cancer Institute. Breeding pairs of CB17 and SCID mice were a generous gift from Dr. M.J. Bosma, Philadelphia. All mice were used at about 12 weeks of age.
Lectins Fluorescein (F1TC)-conjugated lectins (fluorescein to
protein ratios of 1.5 to 4) were purchased from Sigma Chemical, St. Louis, MO. Common name, abbreviation, source, and nominal sugar specificity were as follows: peanut agglutinin (PNA) from Arachis hypogaea: D (+I- galactose; concanavalin A agglutinin ( C o d ) from jack- bean: a -L-mannose; phytohemagglutinin (PHA) from Phaseolus vulgaris: N-acetyl-D-galactosamine; poke- weed mitogen (PWM) from Phytolacca americana: 0 (1 -+ 4) N-acetyl-D-glucosamine; wheat germ agglu- tinin (WGA) from Triticum vulgaris: N-acetyl-D-glucos- amine; lentil lectin (LL) from Lens culinaris: N-acetyl- D-glucosamine.
Identical results were obtained using rhodamine-con- jugated lectins purchased from E-Y Laboratories, San Mateo, CA (data not shown).
Cells
Femoral and tibia1 marrow was expelled by flushing repeatedly (serum- and phenol red-free) phosphate-buff- ered saline (PBS), pH. 7.2, through the marrow cavity. A single-cell suspension was obtained by drawing the marrow gently in and out of a Pasteur pipette. Cell clumps and tissue debris were allowed to settle for 5 min, after which cells were transferred to a second tube and washed twice in PBS. Resuspended cells (at about lo7 cells/ml) were incubated in serum-free PBS for 60 min at 37°C. Subsequently, cells were washed again twice in PBS and resuspended at 2 x lo7 celldm1 in PBS supplemented with 0.1% w/v bovine serum albumin (BSA) and 0.05% w/v sodium azide.
Lectin Binding For each lectin, 2 x lo6 nucleated marrow cells in 0.1
ml PBSA3SNazide were mixed with 0.05 ml of (FITC) lectin diluted in PBSBSNazide in at least four different concentrations and incubated for 30 min at 4°C. Cells were washed twice with 5 ml of PBS/BSA/azide and resuspended in 1 ml of the same medium for flow cyto- metric analysis. A nonlabeled aliquot of cell suspension, prepared in an identical manner, was included in each set of analyses. Furthermore, an aliquot of propidium- iodide-stained marrow cells was included for determina- tion of cell viability (always > 90%).
Flow Analyses Flow cytometry analysis was performed using a cell
sorter built in the Ontario Cancer Institute (13). Rela- tive fluorescence intensity data were collected at con- stant electronic amplification (gain) in 256-channel logarithmic distributions, stored, and processed in a PDP-11/10 computer (Digital Equipment Corporation, Maynard, MA). In histograms displaying fluorescence distributions, the cell frequency is plotted as a function of the log relative fluorescence intensity.
Histograms of forward light scatter intensities (1-15 "), FLSI, related to cell size (lo), were collected for all mar- row cells in 128-channel linear distributions and com- pared with those of (FITC) lectin-stained marrow cells. The scatter profile of unlabeled marrow cells was used as the point of reference to which all suspensions of labeled marrow cells were compared, as even minor agglutination was easily detectable as changes in the FLSI spectra of labeled cell populations. All samples showing evidence of agglutination by this criterion were discarded from analysis.
To calculate the percentage (FITC) lectin-labeled nu- cleated marrow cells, the FLSI threshold was set so as to exclude most red blood cells from the calculations. The definition of this threshold was somewhat arbitrary, as size distributions of red blood cells and nucleated marrow cells overlapped. This may explain the observed 5 8 % variation in the calculated percentage of labeled nucleated marrow cells from one experiment to another,

196 REIMANN, EHMAN, AND MILLER
a variation in striking contrast to the accurate reprodu- cibility of the slope of individual titration curves for any given (FITC) lectin in independent experiments.
In dual-parameter analysis, cell size (FLSI) and log fluorescence intensity (FI) were measured simultane- ously on 5 x lo5 individual cells and stored in a 64 x 128 matrix of FLSI (x-axis) and FI b-axis). These data are displayed as three-dimensional plots.
RESULTS Binding Patterns of Different Lectins to Murine
Marrow Cells Single-cell suspensions of mouse marrow cells were
stained under “standardized” conditions (see Materials and Methods) with varying concentrations of different lectins for flow cytometric analysis. All lectins tested stained a fraction of marrow cells. The fraction of mar- row cells detected as binding a given lectin was linearly related to the (log) concentration of the ligand in a de- fined range of concentrations which was characteristic for each particular lectin tested (Fig. 1). Linear regres- sion analysis of these titration data showed a good fit to a straight line, the slope of which reproducibly displayed “specificity” for the particular lectin tested on marrow cells from nu/+ and n d n u (RNC x BALB/c)FL mice (Table 1). Saturation levels of binding were obtained with only some of the tested lectins, e.g., in Figure 1, plateau levels of binding were reached at high concen- trations for only PNA and PWM. Cell suspensions la- beled with high concentrations of the other lectins showed evidence of agglutination. The binding patterns
of five lectins to T-cell-deficient nude marrow cells were not different from those of euthymic control marrow cells (Fig. 2, top). By contrast, binding of PNA - but not of ConA, WGA, LL, and PWM - to T-/B-cell-deficient SCID marrow cells was always lower than that to con- trol CB17 marrow cells (Fig. 2, bottom). As these results did not reveal marrow cell subset-specific lectin-binding patterns, the flow cytometric analysis was extended to fluorescence and cell size distribution measurements of lectin-labeled marrow cells.
Fluorescence Distributions of Murine Marrow Cells Labeled With Different Lectins
In most cases, marrow cells that were stained with lectins in the concentration range defined by the linear relationship between the fraction of labeled cells and the (log) concentration of the particular staining lectin showed unimodal fluorescence distribution profiles. Rep- resentative examples for ConA, PWM, and WGA are illustrated in Figure 3, and similar profiles were ob- tained with PHA, LL, and soybean agglutinin (SBA) (data not shown). With decreasing concentrations of the staining lectin, the heterogeneity of fluorescence intens- ities of individual labeled cells remained extensive, al- though the fraction of labeled cells decreased. Hence, there was no evidence for a marrow cell subset uniquely definable by differential high-avidity lectin binding.
By contrast, bimodal fluorescence distribution profiles were obtained with marrow cells from immunocompe- tent mice stained with PNA at an intermediate concen- tration. It is evident from the spectra shown in Figure 4 (left) that unimodal fluorescence distributions were ob-
I I I I ,, ” 01 I .o 10.0 200
Lectin concentrotionlpg/ml)
FIG. 1. Flow cytometric measurement of fraction of murine marrow cells labeled by various concentrations of different fluorescein-conju- gated lectins. Marrow cells from nu/+ F1 (RNC X BALB/c) mice were
stained (under “standardized” conditions, see Materials and Methods) with increasing concentrations of PNA (A), PWM ( V ) ConA (O), LL (W) , and WGA (x).

DIFFERENTIAL BINDING OF LECTINS
Table 1 Lectin Titration Curvesa
Mouse Strain Concentration (RNC x BALB/c)Fl (RNC x BALB/c)Fl
Lectinb Range (pg/ml) nu/ + n d n u CB17 SCID ConA 0.2-1.0 1.23 0.97 0.73 0.68
PNA 1.0-10.0 0.33 0.27 0.59 0.36
PWM 0.1-10.0 0.26 0.25 0.20 0.20
LL 0.2-1.0 0.70 0.61 0.88 0.75 WGA 0.1-1.0 0.57 0.48 0.32 0.52
(0.91-1.04) (0.69-0.79) (0.65-0.73)
(0.26-0.42) (0.22-0.30) (0.57-0.61) (0.31-0.41)
(0.22-0.28)
“Table entries are the slope of the linear part of the titration curve, fraction of marrow cells labeled vs log concentration of serially diluted lectin for each lectin, tested. The linear part of the titration curve was defined by linear regression analysis as showing a correlation coefficient > 0.9. The correlation coefficients of the data shown were usually >0.99. Individual experiments, or the arithmetic mean of two to three independent experiments (and the range of calculated slopes) are shown.
b2 x lo6 nucleated marrow cells were labeled with serially diluted lectin under “standard” conditions (see Materials and Methods).
0.8
. -
L I I 0. I ID 10.0
Lectm concentrotion( pgrn/mll
FIG. 2. Marrow cells from mice with SCID, but not those from athymic nude mice display lectin-binding patterns distinguishable from respective immunocompetent control mice. (Top) Marrow cells from either nu/ + F1 (RNC x BALB/c), H-2Wd mice (+ and open symbols), or from congenic ndnu F1-hybrid littermates ( x and closed symbols). (Bottom) Marrow cells from either CB17 mice ( x and closed symbols), or from congenic immunodeficient mice homozygous for the SCID mutation (+ and open symbols). Cells were labeled with various con- centrations of fluoresceinconjugated lectins: PNA (A ,A), PWM (V,V), ConA (O,.), LL (O,.), and WGA (x, +). The fraction of labeled cells was determined by flow cytometry.
197
served with marrow cells stained with a high PNA con- centration. The bimodal distribution emerged with a decrease in the concentration of the labeling PNA which reverted again to a unimodal fluorescence distribution profile upon further decrease of the staining concentra- tion of this label. Thus, in a selected concentration range of PNA, marrow cell subsets with high and low fluores- cence intensities were clearly distinguishable. Interest- ingly, in SCID mice, no PNA concentration was found which showed this bimodal type of fluorescence distri- bution (Fig. 4, right).
Bimodal fluorescence distributions were, in addition, obtained with marrow cells labeled with high concentra- tions of ConA and PWM (Fig. 5). This was observed in BALBk, CB17, nu/+ and n d n u (RNC x BALBMFI hybrid marrow cells, but not in marrow cells from mice carrying the SCID mutation (see below).
The bimodal fluorescence distributions obtained for marrow cells stained with certain lectins at selected concentrations were our first indication that marrow subsets can be defined by differential lectin binding. Furthermore, the absence of bimodal fluorescence distri- butions in SCID mice suggested that they are only found with an intact lymphopoietic marrow compartment.
Size Distribution Profile of Lectin-Labeled Marrow Cells
In BALB/c, CB17, nu/+, and n d n u marrow cell popu- lations, the relative nucleated cell size distributions (measured by FLSI) showed distinct small- and large- size peaks (Fig. 6, left). The small-size peak was not detectable in the scatter profile of SCID marrow cells (Fig. 6, right).
We next measured the size distributions of marrow cells that were labeled with various concentrations of various lectins. These spectra were obtained by record- ing an event in the scatter spectrum only if the cell producing it was also fluorescent. The spectra had two basic patterns. Spectra for C o d , typical of those found for PHA, PWM, LL, SBA, and WGA, are shown in Fig-

198 REIMANN, EHMAN, AND MILLER
FIG. 3. Examples of relative fluorescence intensity distributions ob- tained with various concentrations of fluorescein-conjugated C o d , PWM, and WGA on murine marrow cells. Marrow cells from n d + F1 (RNC X BALBlc) mice were stained with 1.0, 0.8,0.6, 0.4, or 0.2 pglml
C o d ; 30.0, 10.0, 3.0, 1.0, or 0.3 pglml PWM; and 0.4, 0.2, or 0.1 pglml WGA. Electronic amplification was identical for all spectra. No scatter gate was set.
FIG. 4. Marrow cells from immunocompetent CB17 mice and con- genic immunodeficient SCID mice display different fluorescence inten- sity distribution profiles when stained with fluorescein-conjugated PNA in selected concentration ranges. Marrow cells from CB17 and SCID
mice were stained with 130, 32, and 8 pgiml PNA and analyzed by flow microfluorometry at constant electronic amplification, as in Fig- ure 3. No scatter gate was set.
J . . . . . .\- F I 10 I00
FIG. 5. Marrow cells from immunocompetent n d + F1 (RNC X BALBlc) mice showed biomodal fluorescence intensity distribution pro- files when stained with high concentrations of fluorescein-conjugated
ConA and PWM and analyzed by flow cytometry. Electronic amplifi- cation was as in Figure 3. No scatter gate was set.

DIFFERENTIAL BINDING OF LECTINS 199
ure 7, left. The FLSI profile of ConA-labeled marrow cells indicated that only high concentrations of this label stained small-size marrow cells while cells with high binding-avidity for ConA resided almost exclusively in the large-cell-size peak. An alternative pattern was seen with marrow cells labeled with decreasing concentra- tions of PNA (Fig. 7, right) where the small-size cell subset bound the label with high avidity. Dual parame- ter analysis of PNA-stained marrow cells, i.e., fluores- cence intensity distribution in combination with FLSI distribution of labeled cells, provided further evidence for two distinct subsets of PNA-binding marrow cells distinguishable by cell size and amount of label bound to the cell surface (Fig. 8). Interestingly, one subset, i.e., the small-size cell subset with high PNA-binding avid- ity, was selectively missing in marrow cell populations of SCID mice (Fig. 8, bottom).
Marrow Cells From Severe Combined Immunodeficiency Mice Have Distinctive
Defects in Lectin-staining Patterns
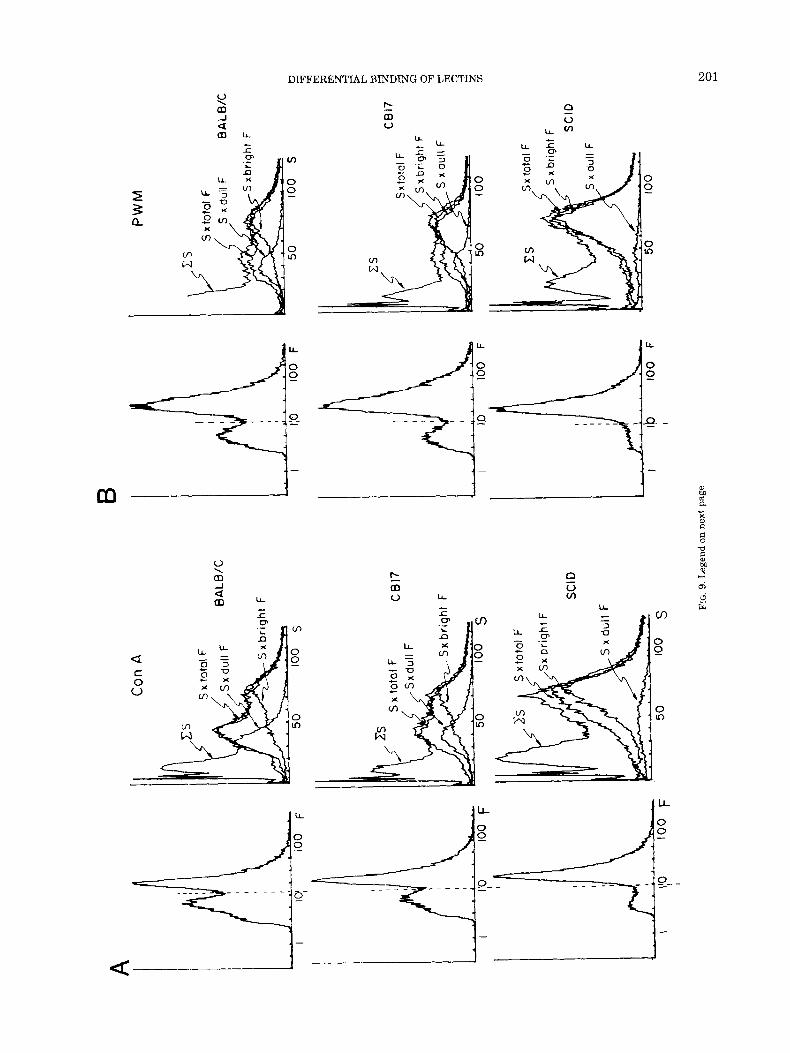
Marrow cells from CB17 and BALB/c mice (both nor- mal) and from T- B-deficient SCID mice, were stained with concentrations of Con A, PWM, and PNA chosen to maximize the bimodality of the fluorescence distribu- tions. The relative size distributions of stained cells were then compared (Fig. 9). The data clearly indicated that SCID mice lacked the marrow cell subset of small cell size which stained weakly with Con A and PWM, but intensely with PNA. Compare particularly the S x dull F distributions of the three strains for ConA and PWM (Figs. 9A, B) or the S x bright F distributions of the three strains for PNA (Fig. 9C). Hence, the absence of
50 I00
FIG 6 . A small-size subset of nucleated marrow cells, present in immunocompetent CB17 mice but absent in immunodeficient congenic SCID mice, is apparent in relative cell size distribution profiles mea-
50 100 s FIG. 7. Relative cell size distribution profiles of all cells (Total) and
(fluorescein-conjugated) lectin-staining marrow cells from nu/+ (RNC X BALB/c)Fl mice. Cells were labeled with ConA (2.0, 0.8, 0.6, 0.4, or
sured by forward light scatter intensity. The scatter threshold was set to exclude most red blood cells from the analysis.
50 100 s 0.2 pgiml) or PNA (8.0, 2.0, or 1.0 pglml) and analyzed by flow cytometry.

200 REIMANN, EHMAN, AND MILLER
CB17 ( B M C )
S
SCID( B M C )
PNA(20pg/ml )
FIG 8. The nucleated marrow cell population of immunodeficient SCID mice lacks a subset of small-size cells stained by fluorescein- conjugated PNA. Marrow cells from immunocompetent CB17 and con- genic immunodeficient SCIU mice were stained with 20 pg/ml PNA. Dual-parameter analysis of lcctin-fluorescence (F) in combination with forward light scatter intensity measurements of relative cell size is) was performed on 5 x lo5 cells of each of the two populations.
the lymphopoietic compartment in SCID bone marrow correlated with the absence of a small-cell-size subset of marrow cells which displayed differential binding of se- lected lectins.
DISCUSSION We asked if distinct subsets could be defined by flow
cytometric analysis of lectin-labeled murine bone mar- row cells. With all tested lectins, the fraction of marrow
cells binding the label was linearly related to the (log) staining concentration of this label; the slope of this titration curve as well as the range of staining concen- trations in which this linear relationship was detectable were characteristic of each particular lectin tested. In fluorescence distribution profiles, brightly vs dimly stained subsets of lectin-labeled marrow cells could be defined by flow cytometric analysis with some selected lectins a t high or intermediate staining concentrations. These subsets corresponded to cell subpopulations of restricted cell size distribution which were present in immunocompetent but absent in congenic immunodefi- cient mouse strains. Thus, some lectins (in selected ranges of staining concentrations) differentially labeled the lymphopoietic vs the myelopoietic compartment of mouse bone marrow.
In view of the extensive heterogeneity of cell types in bone marrow, which we had assumed would express different lectin-binding characteristics, the linear rela- tionship between the fraction of marrow cells stained by titrated concentrations of lectins was unexpected. We obtained plateau (or saturation) levels of binding to mar- row cells with only a few of the tested lectins at high staining concentrations. This indicated the presence of a marrow cell subset with no detectable binding of the particular lectin tested. With most lectins tested, the agghtination threshoId imposed limits on the analysis of marrow cells stained with high lectin concentrations.
The labeling conditions were of critical importance for reproducibly obtaining “lcctin-specific” slopes of titra- tions curves. In “standardized” conditions, marrow cells were prepared, washed, incubated, or labeled in PBS, either serum-free or (with equivalent results) in the presence of 0.1% w/v BSA. For some lectins, a l-hour preincubation (prior to labeling cells with lectins under serum-free conditions) with PBS supplemented with 10% v/v fetal calf serum (FCS) changed the labeling patterns dramatically. Thus, this pretreatment increased sub- stantially the labeling with PNA and decreased labeling with ConA, while not markedly affecting binding of P W M (data not shown). These data question the validity of comparing the lectin-binding characteristics of cul- tured and freshly prepared cells.
As the titration curves did not provide a means to discriminate marrow cell subsets by differential lectin binding, additional discrimination had to be included in the analysis. This was obtained by combining data on fluorescence distribution profiles and size distribution profiles of labeled marrow cells derived from immuno- competent vs immunodeficient congenic mouse strains. Mice carrying the SCID mutation (2) were especially informative as they lacked marrow cell subsets of small size with strong binding of PNA and weak binding of ConA and PWM, which were present in immunocompe- tent congenic CB17 mice as well as other euthymic or athymic (nude) mouse strains. Hence, this analysis de- fined the putative lymphopoietic compartment in mu- rine bone marrow in terms of cell size distribution and differential binding characteristics of three selected lec- tins, which can now be further dissected with serologi-
A B
S x
dull F
50
I I:O
I0
0
F
I I
h
I I I
I I0
0
F
SCI 0
I (0
I0
0
F
I
PW
M
S x
tota
l F
( ,S x
dull
F
BA
LB/C
Sx to
tal F
50
I0
0
I
FIG
. 9. L
egen
d on
nex
t pag
e

C
PN
A
FIG
. 9. M
arro
w f
rom
con
geni
c no
rmal
but
not
from
mic
e w
ith S
CID
, co
ntai
ns a
sm
all-
size
nuc
leat
ed c
ell s
ubse
t whi
ch s
tain
s br
ight
ly w
ith
PNA
, but
dim
ly w
ith
Con
A a
nd P
WM
. Mar
row
cel
ls fr
om im
mun
ocom
- pe
tent
BA
LBic
and
CB
17 m
ice
and
cong
enic
SC
ID m
ice
wer
e st
aine
d w
ith f
luor
esce
in-c
onju
gate
d le
ctin
s: 4
.0 p/
ml C
onA
(A),
100 p
g/m
l PW
M
(B) o
r 10
.0 p
g/m
l PN
A (
C).
The
rel
ativ
e fl
uore
scen
ce i
nten
sity
dis
tri-
bu
tion
prof
ile o
f lec
tin-s
tain
ed m
arro
w ce
lls (l
eft d
iagr
am in
eac
h gr
oup
of f
igur
es)
allo
wed
dis
tinct
ion
of a
bri
ghtly
vs
dim
ly l
abel
ed s
ubse
t (d
otte
d lin
e).
The
for
war
d li
ght
scat
ter
inte
nsit
y m
easu
rem
ents
of
rela
tive
cell
size
wer
e ob
tain
ed fo
r all
mar
row
cel
ls (C
S); fo
r all
mar
row
ce
lls la
bele
d by
the
resp
ectiv
e le
ctin
at t
he c
hose
n co
ncen
trat
ion
(S x
to
tal F
), an
d fo
r bri
ghtly
(S
x br
ight
F) a
nd d
imly
(S x
dul
l F) s
tain
ed
mar
row
cel
ls (
as d
efin
ed
in t
he a
djac
ent
diag
ram
of
rela
tive
flu
ores
- ce
nce
inte
nsity
dis
trib
utio
n). T
he fo
ur p
rofil
es a
re su
peri
mpo
sed
in th
e ri
ght d
iagr
ams
in e
ach
grou
p of
figu
res.
BA
LB/C
F
50
!OO
s
SCID

DIFFERENTIAL BINDING OF LECTINS 203
cally defined lymphoid differentiation markers using double-immunofluorescence analysis (work in progress).
Extensive information is available on lectih-binding sites of lymphomyeloid cells, especially for PNA. PNA binds to hemopoietic stem cells (181, a fraction of murine pre-T-cells (201, almost all cortical (human and mouse) thymocytes (5,6,11,15,17,19,23), and a fraction of acute lymphoblastic leukemias with T-cell marker expression (6,9,15,17) and some in vitro established T-cell lines (15). PNA does not bind to medullary thymocytes (5,6,17,19,20,23) and most mature peripheral T-cells (17,231, although it does bind to most in vivo or in vitro activated T-blasts (23). In addition, some chronic lym- phoblastic leukemias with T-cell marker expression have detectable PNA binding sites on the cell surface (15). Furthermore, PNA binds to pre-B cells in murine bone marrow (14,221 and germinal center B-cells and B-cell follicular lymphomas (21) as well as to committed mye- loid progenitor cells, CFU-C (16), and some myeloid leu- kemias (15). Thus, PNA binding is certainly not a lineage-specific phenotype although it seems to charac- terize discrete maturational phases within various de- velopmental pathways and certain functional (e.g., resting vs activated) states of lymphomyeloid cells. A similar picture emerges for other lectin-binding pheno- types, e.g., Helix pomatia A hemagglutinin binds to T- and B-cell subsets (1) as well as murine natural killer (NK) cells @), and soybean agglutinin preferentially binds to hemopoietic stem cells, myeloid cell subsets, and B-cell subsets (24). Hence, the characterization of cell subsets by their differential lectin-binding patterns should be considered an operational definition whose biological significance remains unclear, but which nevertheless is a very useful tool for analysis and pre- parative separation of functional cell subsets. The reso- lution of this type of analysis is considerably increased if binding of a panel of lectins to a given cell population is studied; if lectin binding is performed under “stand- ardized” conditions in selected ranges of ligand concen- trations; if binding of lectins to single cells is analyzed in a quantitative way; if size distribution of lectin bind- ing cells is included as an additional parameter in the analysis; and, finally, if lectin binding to cells can be compared in normal mouse strains and strains with genetic defects related to the cell population of interest. These criteria are most easily fulfilled by flow cytome- tric analysis and constituted the basis of this study which led to the characterization of the lymphopoietic compart- ment in murine bone marrow by differential lectin binding.
LITERATURE CITED 1. Axelsson B, Kimura A, Hammarstrom S, Wigzell H, Nilsson K,
Mellstedt H: Helix pomatia A hemagglutinin: Selectivity of bind- ing to lymphocyte surface glycoproteins on T-cells and certain B- cells. Eur J Immunol 8:757, 1978.
2. Bosma GC, Custer RP, Bosma M J A severe combined immunode- ficiency mutation in the mouse. Nature 301:527, 1983.
3. Chavez DJ, Enders AC: Temporal changes in lectin-binding of peri- implantation mouse blastocysts. Dev Biol 87:267, 1981.
4. Cowan EP, Schwartz BD, Cullen SE: Murine I-Aka-chain subspe-
cies with glycosylation differences. J Immunol 128:2019, 1982. 5. Fowlkes BJ, Waxdal MJ, Sharrow SO, Thomas CA, Asofsky R,
Mathieson BJ: Differential binding of fluorescein-labeled lectins to mouse thymocytes: Subsets revealed by flow microfluorometry.
, Polliack A: Analysis of the peanut agglutinin-binding site as a differentiation marker of normal and malignant human lymphoid cells. Clin Exp Immunol 43:311, 1981.
7. Haessli D, Bron C, Pink RL: T lymphocyte differentiation is ac- companied by increase in Sialic acid content of Thy-1 antigen. Nature 283:576,1980.
8. Haller 0, Gidlund M, Hellstrom V, Hammarstrom S, Wigzell H: A new surface marker on mouse natural killer cells: Receptors for Helix pomatia A hemagglutinin. Eur J Immunol8:765, 1978.
9. Levin S, Russel EC, Blanchard D, McWilliams NB, Maurer HM, Mohanakumar T Receptors for peanut agglutinin (Arachus hypo- pea) in childhood acute lymphoblastic leukaemia: Possible clinical significance. Blood 55:37, 1980.
10. Loken MR, Herzenberg LA: Analysis of cell populations with a fluorescence-activated cell sorter. Ann NY Acad Sci 254:163, 1975.
11. London J, Berrih S, Bach JF: Peanut agglutinin. I. A new tool for studying T lymphocyte subpopulations. J Immunol 121:438,1978.
12. Marticorena P, Hogan B, Dimeo A, Artzt K, Bennett D: Carbohy- drate changes in pre- and peri-implantation mouse embryos as detected by a monoclonal antibody. Cell Differ 12:1, 1983.
13. Miller RG, Lalande ME, McCutcheon MJ, Stewart SS, Price GB: Usage of the flow cytometer-cell sorter. J Immunol Methods 47:13, 1981.
14. Newman RA, Boss MA: Expression of binding sites for peanut agglutinin during murine B lymphocyte differentiation. Immunol- ogy 40:193, 1980.
15. Newman RA, Delia D: Analysis of the binding of peanut agglu- tinin (PNA) to leukaemic cells and its relationship to T-cell differ- entiation. Immunology 49:147, 1983.
16. Nicola NA, Burgess AW, Staber FG, Johnson GR, Metcalf D, Bat- tye FL: Differential expression of lectin receptors during hemo- poietic differentiation: Enrichment for granulocyte-macrophage progenitor cells: J Cell Physiol 103:217, 1980.
17. Reisner Y, Binyaminov M, Rosenthal E, Sharon N, Ramot B: Interaction of peanut agglutinin with normal human lymphocytes and with leukaemic cells. Proc Natl Acad Sci USA 76:447, 1979.
18. Reisner Y, Itzicovitch L, Meschorer A, Sharon N: Hemopoietic stem cell transplantation using mouse bone marrow and spleen cells fractionated by lectins. Proc Natl Acad Sci USA 75:2933, 1978.
19. Reisner Y, Linker-Israeli M, Sharon N: Separation of mouse thy- mocytes into two subpopulations by the use of peanut agglutinin. Cell Immunol 25:129, 1976.
20. Roelants GE, London J, Mayor-Withey KS, Serrano B: Peanut agglutinin. 11. Characterization of the Thy-1, Tla and Ig phenotype of peanut agglutinin-positive cells in adult, embryonic and nude mice using double immunofluorescence. Eur J Immunol 9:139, 1979.
21. Rose ML, Habeshaw J, Kennedy R, Sloane J, Wiltshaw E, Davies AJS: Binding of peanut lectin to germinal centre cells: A marker for B-cell subsets of follicular lymphoma? Br J Cancer 44338, 1981.
22. Saveriano N, Drinnan M, Santer V, Osmond DG Lectin-binding patterns of small lymphocytes in bone marrow, thymus and spleen: Demonstration of lymphocyte subsets by quantitative radioautog- raphy. Eur J Immunol 11:870, 1981.
23. Schrader JW, Cheng WF, Scollay R The acquisition of receptors for peanut agglutinin by peanut agglutinin-negative thymocytes and peripheral T-cells, J Immunol 129:545, 1982.
24. Sharon N: Cell surface receptors for lectins: Markers of murine and human lymphocyte subpopulations. In: Immunology 80 (Prog- ress in Immunology IV), Fougereau M, Dausset J (eds). Academic Press, New York, 1980, p 254.
25. Wu JT. Chang MC: Increase in concanavalin A binding sites in mouse blastocysts during implantation. J Exp Zoo1 105:447, 1978.
26. Wu TC, Wan YJ, Damjanov I Fluorescein-conjugated Bandeiraea simplicifolia lectin as a marker of endodermal, yolk sac, and tro- phoblastic differentiation in the mouse embryo. Differentiation 24:55, 1983.