difference scores or statistical control? what should i...
TRANSCRIPT

Difference scores or statistical control? What should I use to predict change over two time points?
Jason T. Newsom
Newsom, Psy 522/622 Multivariate Quantitative Methods, Winter 2018

Overview
• Purpose is to introduce a few basic concepts that may help guide researchers or those advising them on which analysis approach to use when
• No attempt to resolve or add to the long-standing debate about which approach is best
• Many complexities and many red herrings that do not really effect the essential questions addressed by the two approaches
• Despite what many if not most authors seem concerned with, there is not a “statistical winner”
Newsom, Psy 522/622 Multivariate Quantitative Methods, Winter 2018
Two Waves for Investigating Change
• Often what is available or affordable• May be only change of interest, e.g., pretest-posttest• Improvement over cross-sectional data
Newsom, Psy 522/622 Multivariate Quantitative Methods, Winter 2018

Definitions of Stability
• Absolute or exact sense: variable is stable to the extent that a) mean values for y2 and y1 equal over time, or b) individual values of y2i and y1i are the equal over time
• or y2-1i = y2i – y1i = 0• Relative sense: variable is stable to the extent that y2i is
correlated with y1i. Mean or individual values may increase or decrease over time, but correlation may be largely unchanged unless relative positioning changes
• r12 = 1
2 1 0y y− =
Newsom, Psy 522/622 Multivariate Quantitative Methods, Winter 2018

Definitions of Change
• Difference score: absolute or exact changes in value of yt.• y2-1 > 0
• Captures increase or decrease in the mean values• or individual values• Correlation between y1 and y2 can be anywhere between 0
or 1 and differences may be small or large• Ex: If r12 is 1.0 and y1 = y2, add 5 points to y2, and r12 will
still be equal to 1.0.
Newsom, Psy 522/622 Multivariate Quantitative Methods, Winter 2018

Definitions of Change
• Correlation: lower correlation indicates greater change, but change is relative to other cases in the data set not absolute.
• r12 < 1
• Ex. If r12 = .45, add 5 points to all scores, and r12 = .45. All scores and the mean of y change over time in the absolute value sense, but the degree of change (lack of stability) is unaffected.
Newsom, Psy 522/622 Multivariate Quantitative Methods, Winter 2018

Additional Approaches
• Residualized change scores (Dubois, 1957)• True score change estimates (Lord, 1956; McNemar,
1958; see Maassen, 2001 for more)• Highly correlated with other approaches and/or add
unnecessary complexity for interpretations• Residualized change may omit covariates otherwise
included• True score change may make inaccurate assumptions
about reliability• “One practice that should be discouraged is that of correlating
residualized change with other measures. If residualized change scores are desired, it is almost always better instead to employ statistical equating by using multiple regression…” (Campbell & Kenny, p. 97).
Newsom, Psy 522/622 Multivariate Quantitative Methods, Winter 2018

Note on Difference Score Computation
• Use raw scores when compute difference scores, pre-standardizing variables discards important variance information
Newsom, Psy 522/622 Multivariate Quantitative Methods, Winter 2018

Test of Average Difference, paired t-test, Repeated Measures ANOVA
• Comparison of average difference to 0 is equal to paired (dependent) t-test comparing two dependent means
• Which is equivalent to repeated measures ANOVA
( )2 1 2 1 /y y y N− = − ∑
2 12 1 / yt y SE−−=
2t F=
Newsom, Psy 522/622 Multivariate Quantitative Methods, Winter 2018

Mixed Between x Repeated Measures ANOVA
• Test of interaction assesses whether change (difference score) was the same among the two groups
Newsom, Psy 522/622 Multivariate Quantitative Methods, Winter 2018

ANCOVA
• Test of difference at Time 2, controlling for y at Time 1 assesses whether change (relative) is different in the two groups
Newsom, Psy 522/622 Multivariate Quantitative Methods, Winter 2018
Regression Models
• Difference score prediction (change score prediction, unconditional change, gain score prediction)
• Generalization of repeated measures ANOVA
• Lagged regression (conditional change, static score model, ANCOVA)
• Generalization of ANCOVA
Newsom, Psy 522/622 Multivariate Quantitative Methods, Winter 2018

Predicting Change Scores
• Measurement error in x1 biases correlation between x1 and y2-1
2 1 0 1 1y b b x e− = + +
Newsom, Psy 522/622 Multivariate Quantitative Methods, Winter 2018

Fixed Effects Regression
• Also, known as the method of first difference (Allison, 1990; Liker, Augustyniak, & Duncan, 1985), is a regression model testing whether the change in x predicts the change in y
• This regression model is the same as two separate regressions with two synchronous paths, assuming equal regression coefficients
( )
( )
1 1 11
2 2 21
y b x e
y b x e
= +
= +
( ) ( )2 1 1 2 1 2 1y y b x x e e− = − + −
Newsom, Psy 522/622 Multivariate Quantitative Methods, Winter 2018

Lagged Regression
• Measurement error in x1 biases correlation between x1 andy1 and between x1 and y2
2 0 1 1 1 1yy b b x b y e= + + +
CognitionWave 1
CognitionWave 2
Blood SugarWave 1
Newsom, Psy 522/622 Multivariate Quantitative Methods, Winter 2018

Lagged Regression
• Attempts to address initial differences in cognition due to blood sugar
• E.g., participants with poorer cognitive functioning may be at greater risk for diabetes, because their dietary habits are affected by memory problems
Blood SugarTime 1
CognitionTime 2
CognitionTime 1
Newsom, Psy 522/622 Multivariate Quantitative Methods, Winter 2018

Lord’s Paradox
• Results from the difference score prediction and lagged regression approaches may differ from one another, referred to as “Lord’s paradox” after Frederic Lord (Lord, 1967) who noted this difference
• So, the results from the two analysis approaches will usually produce estimates of the effect of the predictor on change in the dependent variable that are not equivalent
• Although the results of the two approaches may lead to the same conclusion in some instances, they may lead to different conclusions in other instances
Newsom, Psy 522/622 Multivariate Quantitative Methods, Winter 2018

Lord’s Paradox
The two approaches imply different statistical models• The difference score prediction model is
implies
• which replaces the autoregressive coefficient by1 with the value of 1 in the lagged regression,
2 1 0 1 1y y b b x e− = + +
2 0 1 1 1(1)y b b x y e= + + +
2 0 1 1 1 1y yy b b x b y e= + + +
Newsom, Psy 522/622 Multivariate Quantitative Methods, Winter 2018

Lord’s Paradox
• The closer the autoregression effect is to 1, the more likely the results from the two approaches will lead to congruent conclusions.
• Can be stated in terms of regression toward the mean (Campbell & Kenny, 1999), where extreme scores move toward the mean over time and scores near the mean move toward the extremes over time.
Newsom, Psy 522/622 Multivariate Quantitative Methods, Winter 2018

Lord’s Paradox
• If x is a binary variable representing non-equivalent groups that have pre-existing differences on y, regression toward the mean will lead to a negative association between x1 and y2-1
• This will happen to some degree whenever the autocorrelation is less than 1
Newsom, Psy 522/622 Multivariate Quantitative Methods, Winter 2018

Caution: Don’t Do Both
implies
where by1 is from the standard lagged regression
2 1 0 1 1 2 1y y b b x b y e− = + + +
( )2 1 0 1 1 1 11yy y b b x b y e− = + + − +
2 0 1 1 1 1yy b b x b y e= + + +
Newsom, Psy 522/622 Multivariate Quantitative Methods, Winter 2018

Conceptual Distinction in the Questions Asked
• Difference score prediction: “Whose score is most likely to increase or decrease over time?”
• does not address pre-existing differences due to x (i.e., direction of change in y arbitrary)
• does not address regression toward the mean• Lagged regression: “Is x a likely cause of y?”
• does not quantify the amount of change or variability in change
• does not describe who is most likely to change
Newsom, Psy 522/622 Multivariate Quantitative Methods, Winter 2018

Conceptual Distinction in the Questions Asked
is statistically equivalent to
x1 y2-1
x1 y1-2
Newsom, Psy 522/622 Multivariate Quantitative Methods, Winter 2018
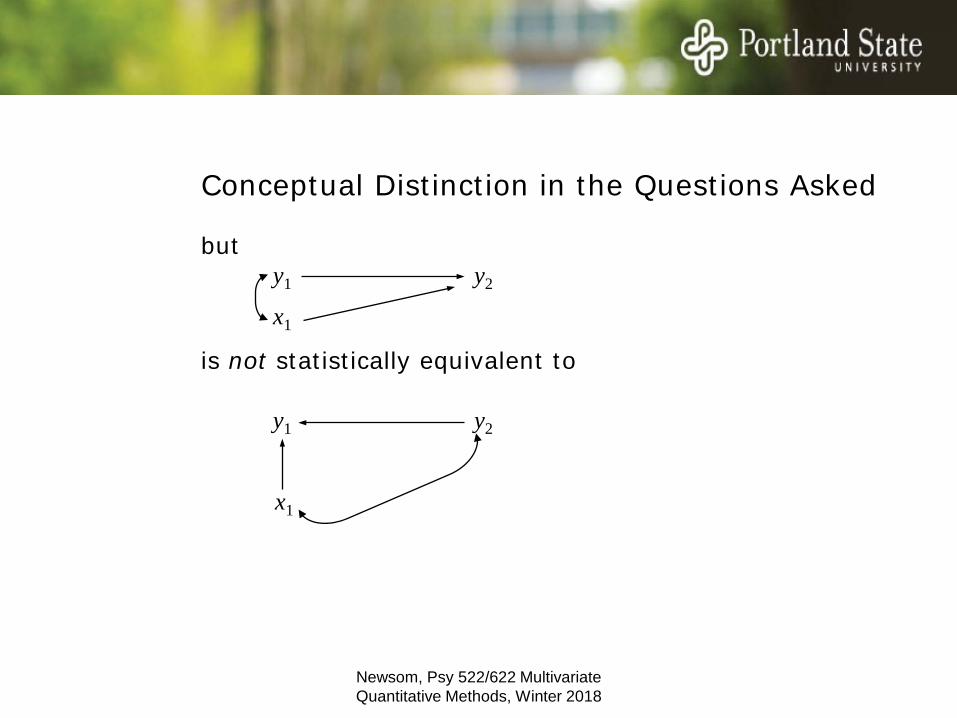
Conceptual Distinction in the Questions Asked
but
is not statistically equivalent to
y1 y2
y1 y2
x1
x1
Newsom, Psy 522/622 Multivariate Quantitative Methods, Winter 2018

Effects of Measurement Error on Difference Scores
• Does not impact on average difference, where yt = Tt + et
( ) ( ) ( )[ ] [ ][ ] [ ]
1 1 1
1 1
1
1
1
( ) ( ) ( ) ( )
( ) 0 ( ) 0( ) ( )( )
t t t t t t
t t t t
t t
t t
t t
E y y E T e T e
E T E e E T E e
E T E TE T E TE T T
− − −
− −
−
−
−
− = + − + = + − +
= + − +
= −
= −
Newsom, Psy 522/622 Multivariate Quantitative Methods, Winter 2018

Effects of Measurement Error on Difference Scores
• Does impact on variance of differences
( ) ( ) ( )( ) ( ) ( ) ( ) ( )
1 1 1
1 1 12 ,t t t t t t
t t t t t t
Var y y Var T E T E
Var T Var E Var T Var E Cov T T− − −
− − −
− = + − + = + + + −
Newsom, Psy 522/622 Multivariate Quantitative Methods, Winter 2018
Effects of Measurement Error on Difference Score Prediction
• True that reliability of the difference score is usually considerably below the reliability of the individual scores
• As the autocorrelation between in y2 and y1 approaches 1, the reliability of the difference score decreases
• Oddly enough, greater variability in the difference score will be associated with greater power to detect effect of x1on y2-1 (Collins, 1996)
• Reliability of difference scores impacts inferences about individual differences but not the expected values (Thomas & Zumbo, 2012). Noncentrality and reliability of difference scores not the same thing.
Newsom, Psy 522/622 Multivariate Quantitative Methods, Winter 2018
Effect of Measurement Error on Lagged Regression
• Measurement error on y1 or y2 will disattenuateautocorrelation (generally will underestimate stability, overestimate change)
• Measurement error on y1 or y2 will disattenuateassociation with x variable and lead to undercorrection
• Measurement error on y1 and y2 leads to over- or underestimate of group difference, depending on direction of difference at pretest and direction of the difference at posttest (see Campbell & Kenny, 1999, for more detailed analysis)
Newsom, Psy 522/622 Multivariate Quantitative Methods, Winter 2018

Limitations of Both Approaches
• Measurement error in x1 attenuates relationship of x1 to y1and y2 in lagged regression and relationship between x1and y2-1 in the difference score prediction
• Measurement error in y1 or y2 increases variance of the difference score (y2-1), so part of inter-individual variability in change is not true variability or explainable
• Either model omits alternative models between x and y. For example,
x1
y1 y2
x1
y1 y2
z1
x1 y2-1
x2
y2-1
Newsom, Psy 522/622 Multivariate Quantitative Methods, Winter 2018

Limitations of Both Approaches
• Measurement equivalency (invariance) not addressed• Correlated errors not taken into account• Omitted variables, time-invariant or time-varying, may
bias estimates of true effects in either type of model• Form of change is necessarily linear• Lag length must be appropriate
• Smoking does not cause cancer over one month• Paper cuts do not cause pain one year later
Newsom, Psy 522/622 Multivariate Quantitative Methods, Winter 2018

Thanks for Listening!
Newsom, Psy 522/622 Multivariate Quantitative Methods, Winter 2018