dietary habits and knowledge of college age …
TRANSCRIPT

University of Kentucky University of Kentucky
UKnowledge UKnowledge
Theses and Dissertations--Dietetics and Human Nutrition Dietetics and Human Nutrition
2015
DIETARY HABITS AND KNOWLEDGE OF COLLEGE AGE DIETARY HABITS AND KNOWLEDGE OF COLLEGE AGE
STUDENTS STUDENTS
Matthew R. Majors University of Kentucky, [email protected]
Right click to open a feedback form in a new tab to let us know how this document benefits you. Right click to open a feedback form in a new tab to let us know how this document benefits you.
Recommended Citation Recommended Citation Majors, Matthew R., "DIETARY HABITS AND KNOWLEDGE OF COLLEGE AGE STUDENTS" (2015). Theses and Dissertations--Dietetics and Human Nutrition. 30. https://uknowledge.uky.edu/foodsci_etds/30
This Master's Thesis is brought to you for free and open access by the Dietetics and Human Nutrition at UKnowledge. It has been accepted for inclusion in Theses and Dissertations--Dietetics and Human Nutrition by an authorized administrator of UKnowledge. For more information, please contact [email protected].
STUDENT AGREEMENT: STUDENT AGREEMENT:
I represent that my thesis or dissertation and abstract are my original work. Proper attribution
has been given to all outside sources. I understand that I am solely responsible for obtaining
any needed copyright permissions. I have obtained needed written permission statement(s)
from the owner(s) of each third-party copyrighted matter to be included in my work, allowing
electronic distribution (if such use is not permitted by the fair use doctrine) which will be
submitted to UKnowledge as Additional File.
I hereby grant to The University of Kentucky and its agents the irrevocable, non-exclusive, and
royalty-free license to archive and make accessible my work in whole or in part in all forms of
media, now or hereafter known. I agree that the document mentioned above may be made
available immediately for worldwide access unless an embargo applies.
I retain all other ownership rights to the copyright of my work. I also retain the right to use in
future works (such as articles or books) all or part of my work. I understand that I am free to
register the copyright to my work.
REVIEW, APPROVAL AND ACCEPTANCE REVIEW, APPROVAL AND ACCEPTANCE
The document mentioned above has been reviewed and accepted by the student’s advisor, on
behalf of the advisory committee, and by the Director of Graduate Studies (DGS), on behalf of
the program; we verify that this is the final, approved version of the student’s thesis including all
changes required by the advisory committee. The undersigned agree to abide by the statements
above.
Matthew R. Majors, Student
Dr. Kelly Webber, Major Professor
Dr. Kelly Webber, Director of Graduate Studies

DIETARY HABITS AND KNOWLEDGE OF COLLEGE AGE STUDENTS
________________________________________________________________________
THESIS________________________________________________________________________
A thesis submitted in partial fulfillment of the
requirements for the degree of Master of Science in the
College of Agriculture, Food and Environment
at the University of Kentucky
By
Matthew R. Majors, RD, LD
Lexington, Kentucky
Director: Kelly Webber PhD, RD, LD, Associate Professor
Lexington, Kentucky
2015
Copyright © Matthew R. Majors, RD, LD
ABTRACT OF THESIS
DIETARY HABITS AND KNOWLEDGE OF COLLEGE AGE STUDENTS
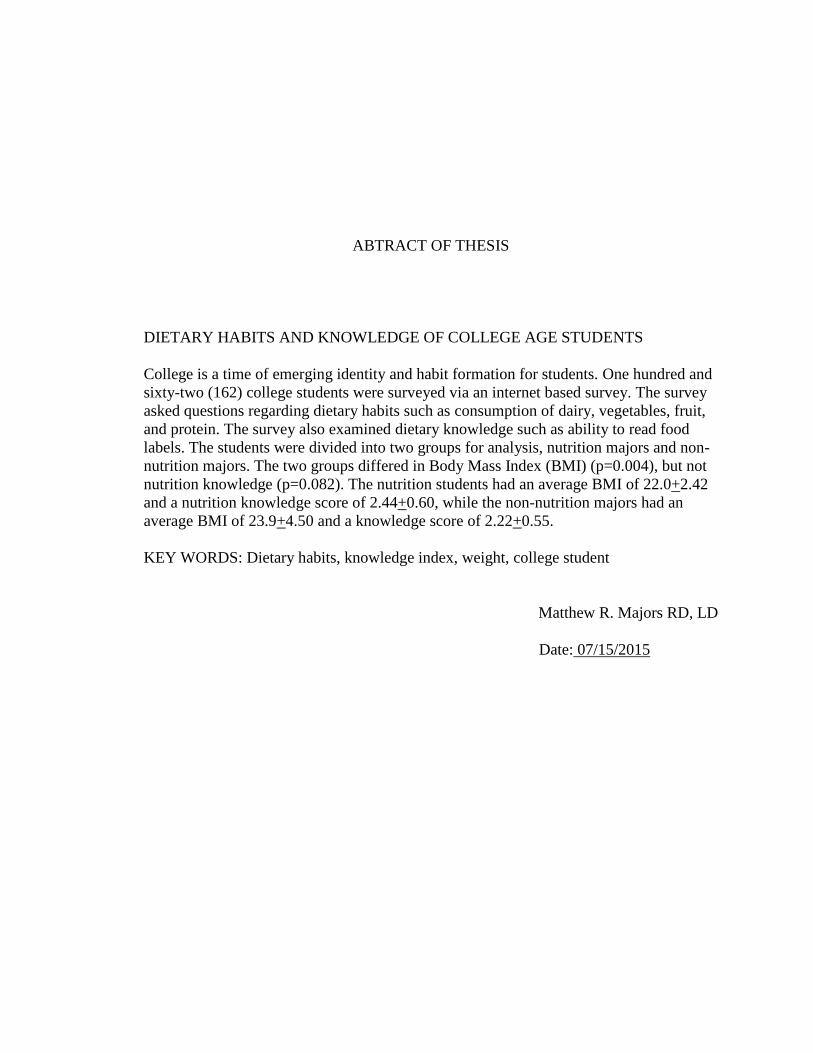
College is a time of emerging identity and habit formation for students. One hundred and
sixty-two (162) college students were surveyed via an internet based survey. The survey
asked questions regarding dietary habits such as consumption of dairy, vegetables, fruit,
and protein. The survey also examined dietary knowledge such as ability to read food
labels. The students were divided into two groups for analysis, nutrition majors and non-
nutrition majors. The two groups differed in Body Mass Index (BMI) (p=0.004), but not
nutrition knowledge (p=0.082). The nutrition students had an average BMI of 22.0+2.42
and a nutrition knowledge score of 2.44+0.60, while the non-nutrition majors had an
average BMI of 23.9+4.50 and a knowledge score of 2.22+0.55.
KEY WORDS: Dietary habits, knowledge index, weight, college student
Matthew R. Majors RD, LD
Date: 07/15/2015

DIETARY HABITS AND KNOWLEDGE OF COLLEGE AGE STUDENTS
BY
MATTHEW R. MAJORS RD, LD
Kelly Webber, PhD, RD, LD Director of Thesis
Kelly Webber, PhD, RD, LD Director of Graduate Studies
07/15/2015Date

iii
TABLE OF CONTENTS
Table of Content……….…………………………………………………………………iii
List of Tables……………………………………………………………………………...v
Chapter 1: Introduction……………………………………………………………………1
Purpose…..………………………………………………………………………….....2
Research Questions………………………………………………………………….....2
Chapter 2: Literature Review……………………………………………..……………….3
Weight and body composition………………………………………………………….3
Transition to higher education………………………………………………………….5
Dietary Habits…………………………………………………………………………..7
Dietary Knowledge……………………………………………………………………..9
Chapter 3: Methodology……………………………………………….…………………12
Chapter 4: Results……………………….………………………………………………..13
Demographics…………………………………………………………………………13
University Meal Plan Participation…………………………………………………...14
Comparison of Nutrition and Non-nutrition Majors………………………………….14
Chapter 5: Discussion…………………….………………………………………………22
College Major and BMI………………………………………………………………22
Knowledge and BMI………………………………………………………………….23
Chapter 6 Limitations……………….……………………………………………………24
Chapter 7: Conclusion and Recommendations…….……………………………………..25
References………………………………………………………………………………..45

iv
Appendices……………………………………………………………………………….33
Appendix A: IRB application……………………………………………………33
Appendix B: IRB email………………………………………………………….39
Appendix C: Survey questions…………………………………………………...40
Vita……………………………………………………………………………………….47
v
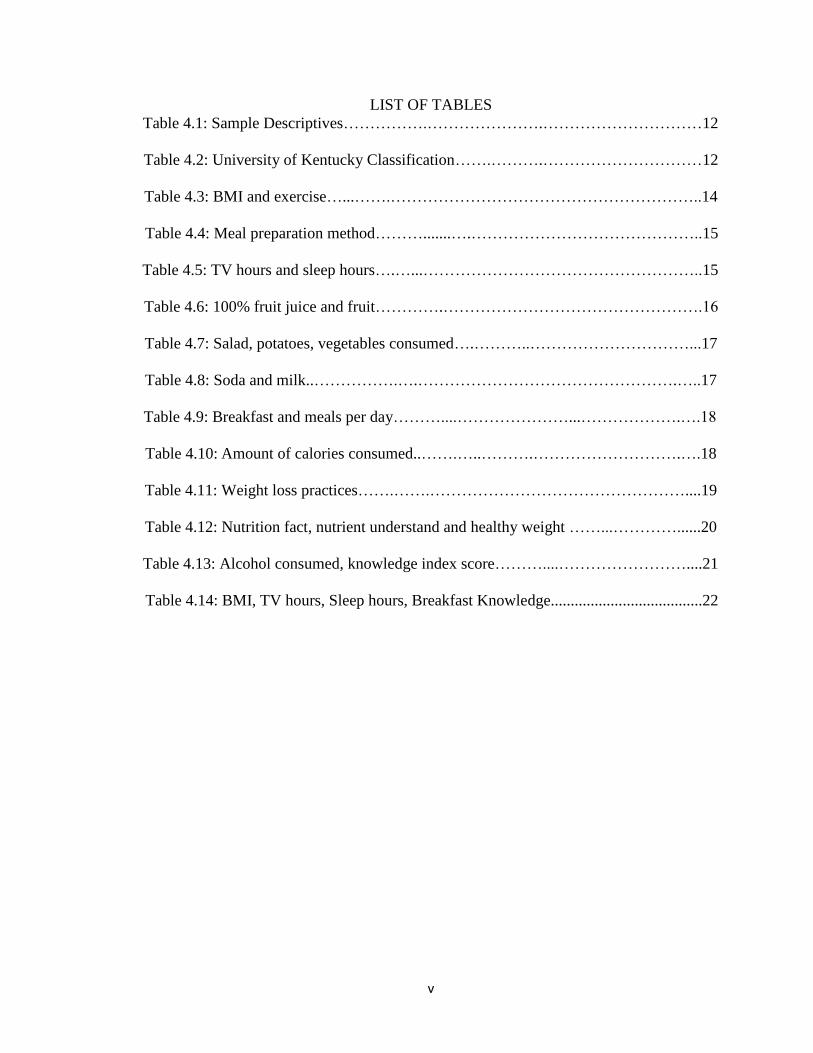
LIST OF TABLES
Table 4.1: Sample Descriptives…………….………………….…………………………12
Table 4.2: University of Kentucky Classification…….……….…………………………12
Table 4.3: BMI and exercise…...…….…………………………………………………..14
Table 4.4: Meal preparation method……….......….……………………………………..15
Table 4.5: TV hours and sleep hours….…...……………………………………………..15
Table 4.6: 100% fruit juice and fruit………….………………………………………….16
Table 4.7: Salad, potatoes, vegetables consumed….………..…………………………...17
Table 4.8: Soda and milk..…………….….………………………………………….…..17
Table 4.9: Breakfast and meals per day………....…………………...……………….….18
Table 4.10: Amount of calories consumed..…….…..……….……………………….….18
Table 4.11: Weight loss practices…….…….…………………………………………....19
Table 4.12: Nutrition fact, nutrient understand and healthy weight ……...…………......20
Table 4.13: Alcohol consumed, knowledge index score………....……………………....21
Table 4.14: BMI, TV hours, Sleep hours, Breakfast Knowledge......................................22

1
Chapter 1: Introduction
The obesity epidemic in America continues to grow. In order to obtain data
concerning the overall health of both children and adults in the United States (US) the
National Center for Health Statistics (NCHS), which is part of the Center for Disease
Control and Prevention (CDC) conducts an annual survey known as The National Health
and Nutrition Examination Survey (NHANES). NHANES is designed to assess the health
and nutritional status of adults and children in the United States. The survey is unique in
that it combines interviews and physical examinations. According to the NHANES 2011-
2012 survey, the proportion of the obese US adults was 35.1% and those considered to be
extremely obese was 6.4% (1). It was also found that an estimated 33.9% of adults were
considered to be overweight (1). Furthermore, the data from the NHANES 2011-2012
survey indicated that an estimated 16.9% of children and adolescents age 2-19 are obese,
and another 14.9% are overweight (2). Overweight and obesity is determined by dividing
weight in kilograms by height in meters squared (kg/m2). The term overweight is defined
as any adult with a Body Mass Index (BMI) greater than or equal to 25 kg/m2
to 29 kg/
m2 and obesity is defined as having a BMI of 30 kg/m
2 and above (3). Furthermore, a
child is considered to be overweight when a child’s BMI is at or above the 85th
percentile
and lower than the 95th
percentile for children of the same age and sex (4).
One researcher, Dr. Jeffrey Jensen Arnett (5) classifies the ages of 18-25 as
“emerging adulthood.” He describes this age demographic as a time where young people
transition from adolescence to adulthood and begin developing views and behaviors,
which will carry into adulthood(5). During this time the development of self-identity,
changing support systems, and the shifting of interpersonal influences occur and set this
2
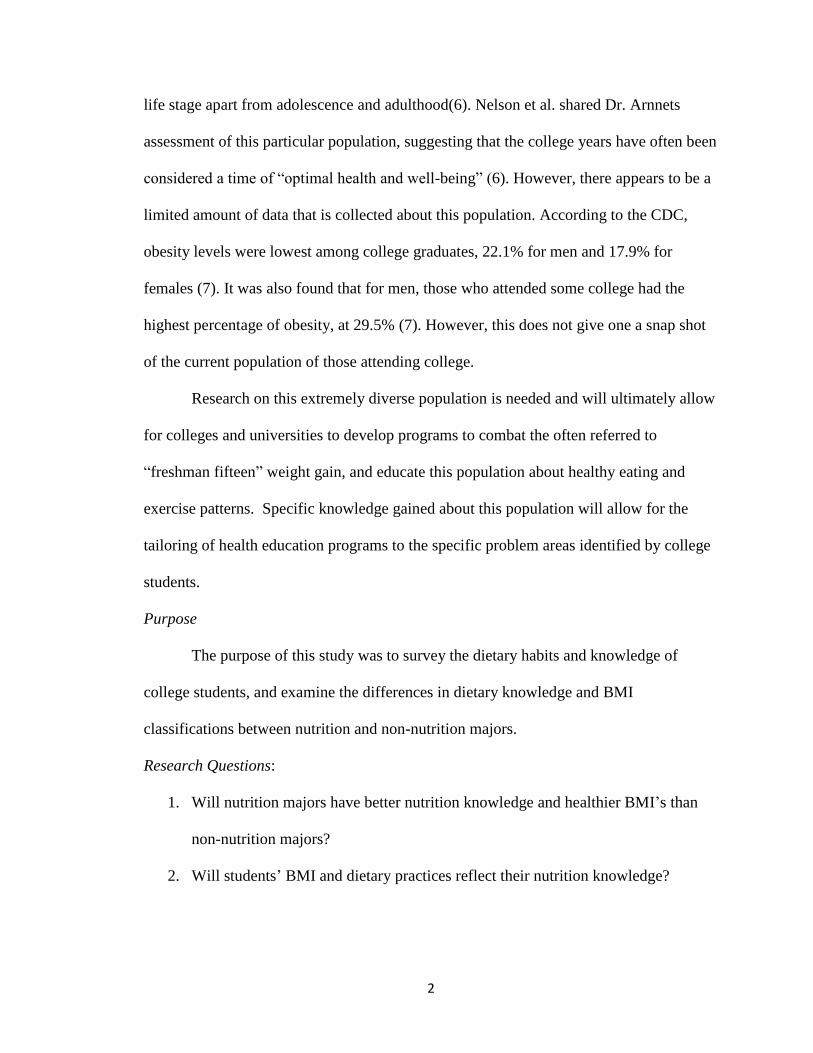
life stage apart from adolescence and adulthood(6). Nelson et al. shared Dr. Arnnets
assessment of this particular population, suggesting that the college years have often been
considered a time of “optimal health and well-being” (6). However, there appears to be a
limited amount of data that is collected about this population. According to the CDC,
obesity levels were lowest among college graduates, 22.1% for men and 17.9% for
females (7). It was also found that for men, those who attended some college had the
highest percentage of obesity, at 29.5% (7). However, this does not give one a snap shot
of the current population of those attending college.
Research on this extremely diverse population is needed and will ultimately allow
for colleges and universities to develop programs to combat the often referred to
“freshman fifteen” weight gain, and educate this population about healthy eating and
exercise patterns. Specific knowledge gained about this population will allow for the
tailoring of health education programs to the specific problem areas identified by college
students.
Purpose
The purpose of this study was to survey the dietary habits and knowledge of
college students, and examine the differences in dietary knowledge and BMI
classifications between nutrition and non-nutrition majors.
Research Questions:
1. Will nutrition majors have better nutrition knowledge and healthier BMI’s than
non-nutrition majors?
2. Will students’ BMI and dietary practices reflect their nutrition knowledge?

3
Chapter 2: Literature review
It is known that many college freshman gain weight (8). This is commonly
referred to as the “freshman 15”. This weight gain can contribute to a risk of being
overweight and obese later in life (8). Due to the difficulty associated with weight loss,
strategies are needed to combat weight gain in college students.
Weight and body composition
In the fall semester of 2004 at the Virginia Polytechnic Institute and State
University, 163 freshmen were recruited for a study that required a 7--day food journal as
well as weight and body composition measurement. Thirty-eight students gained more
than 0.5 pounds and 20 students lost more than 0.5 pounds (8). It was also found that
eleven students maintained their body weight. Initial BMI and percentage body fat were
higher in subjects who lost weight, although differences were not statistically significant
(8). Mean daily servings of dairy products were significantly greater in subjects who
maintained weight (8). Subjects who gained weight ate breakfast on fewer days per week
than those who did not eat breakfast regularly. This study suggested possible targets to be
utilized to develop nutrition education materials for college students to help prevent
weight gain (8).
In 2005, a Utah State University study was conducted that recruited 67 men and
118 women. The objective of this study was to track changes in weight, height, BMI,
percent body fat, blood pressure, waist and hip circumference among freshmen during
their first semester of college, by having participants complete a risk factor survey as well
as being weighed and measured (9). In addition to these objectives this study examined a
relationship between environmental factors and incidence of overweight/obesity and

4
weight gain (9). Positive correlations were observed among BMI, body weight, waist and
hip circumference, percent body fat, and systolic blood pressure, as expected. Thirty-six
percent of participants gained more than 2 kg during the fall semester (9). Among men,
being overweight/obese at baseline was associated with first semester weight gain; no
similar association was observed among women. This study concluded that weight gain
during the first semester of college may be associated with identifiable and in some cases
modifiable risk factors such as hypertension and diabetes (9). This study suggest that
strategies aimed at preventing overweight/obesity and weight gain among college
freshmen may decrease risk of obesity and related health problems later in life (9).
Another study that looked solely at weight gain and body changes in freshman
examined changes that might occur to body weight, body composition, resting metabolic
rate, diet and exercise in college freshmen during their first semester (10). For this study
sixty-three students were followed for a single 16--week semester (10).Weight, body
composition, resting metabolic rate, and physical activity were measured at baseline as
well as at the conclusion of the study. At the end of the 16--week semester it was found
that forty-four individuals gained ≥2 pounds, while 28 gained ≥5 pounds. A small but
significant change in percent fat mass was found in the female population, however this
was not found in men. There were no significant changes in resting metabolic rate or
Calorie intake (10). However, correlations between change in weight and change in
resting metabolic rate, change in weight and change in fat mass were significant.
Individuals who met the American College of Sports Medicine minimum guidelines for
exercise gained less weight than those who did not (10). These researchers conducted a
follow--up study that consisted of a sub-set of students at one year. At one year, there was

5
no longer a significant weight gain from baseline (10). The results from this study
support the notion that freshmen gain weight upon entering college and this weight gain
is accompanied by an increase in fat mass in women. Furthermore, individuals who
maintain moderate physical activity appeared to be protected from this weight gain (10).
This study concluded that the follow up study suggest that this weight gain may not be
sustained over an entire year (10).
Transition to higher education
The following study examined the differences of weight gain and behavior in
males and females as they transitioned from high school to college (11). This study was
conducted in 2005, and consisted of 379 college students (11). It was found that weight
gains were greatest in males, with twenty-seven percent gaining weight. Furthermore,
twenty-six percent of females also showed an increase in weight (11). This study also
found that females were more than likely to maintain or lose weight (11). This study
determined that many participants were unprepared for the transition from high school to
college (8). Furthermore, peer-led classes providing strategies for managing healthful
living during college were suggested in focus groups. Efforts to understand the college
transition and interventions addressing the broad context of behavior are needed in order
to help college students develop lifelong healthful habits (11).
In 2004, data were collected from female participants who attended three study
visits, the first was the summer before entering college, the second was the fall semester
and the last set of data were collected in the winter semester (12). The main outcome
measure was body weight; others were height, body composition, waist circumference,
dietary intake, and participation in physical and sedentary activities (12). The major
6
finding of this study was that there was a substantial increase in body weight of 2.4 kg
during the first 6 to 7 months (12). Other increases included BMI , 22.3 kg/m2 to 23.1
kg/m2,percent body fat, 23.8% to 25.6%; and waist circumference, 76.9 to 79.4 cm.
Dietary energy intake did not increase; vigorous physical, but not strength building,
activities increased; television use decreased; and computer use increased (12). This
study concluded that the term “freshman fifteen” may be misleading since the average
weight gain was significantly less (12). The results also suggested that a decrease in
moderate physical activity could play a role in energy balance resulting in weight gain
(12).
A study at Sam Houston State University examined 352 college freshmen with a
two part questionnaire to gather insight into students living away from home for the first
time (10). Data on nutrition-related behaviors of participants while living at home and
after the first year of living away from home were obtained and analyzed (13). This study
found that the average weight gain observed among these students was 10.78 pounds and
of those 185 participants who reported weight gain, 69.7% were females. It was also
found that 23% of students reported an average weight loss of 12.1 pounds and a smaller
percentage maintained weight after living away from home (13). This study found that
there was a significant change in alcohol consumption, physical activity, and specific
food consumption such as vegetables and fruits when examining practices before and
after leaving home, this was found to be true from both those who lost weight and those
who did not lose weight (13). This study concluded that there was a substantial amount of
changes in student’s nutrition related behavior after they leave home for college (13).

7
Dietary Habits
Another study sought to identify health behavior change targets related to weight
management in college students (14). This particular study examined first and second
year students who majored in nutrition, foods, and exercise (14). This study found that
body fatness was significantly higher in women than in men, and men consumed
significantly more energy than women (14). However, there were no sex differences in
percent of energy consumed from macronutrients, with carbohydrate, fat, and protein
comprising approximately 50%, 35%, and 15% of total energy, respectively (14).
Furthermore, it was found average daily intake of fruit, vegetables, and whole grains
were not significantly different between men and women and were well below
recommendations (14). Total fiber intake of the study sample was approximately half of
recommended levels (14). It was found that students generally skipped breakfast or had
something they could prepare in their dorm room, eat quickly, or carry to class (14).
Lunch generally consisted of sandwiches, salads, or wraps, but also fast-food type meals
that are available on campus (14). Dinners usually consisted of pasta, meat and potatoes,
salad, burgers, and sandwiches (14). Students reported chips or crackers and sweets that
they kept in their dorm rooms as their major snack source (14). Snack foods primarily
came from an off-campus grocer, and rarely vending machines (14). Students generally
drank water, juice, or sweetened beverages (14). It was also found when short on time,
students tended to eat something quickly, usually fast foods (14). This study concluded
that an adherence and long term adoption of healthful habits was key to weight gain
prevention in this population (14).
8
The next study that is of interest examined the relationship between weight gain
and dairy intake in college age students (15). This study more specifically looked at low
fat dairy products and weight gain/loss (15). This study looked at 7-day diet journals
from students in a freshman level nutrition course, as well as body measurements taken at
baseline (15). It was found that the mean low fat dairy intake was less than half a serving
a day (15). It was also found that the total amount of dairy consumed was approximately
1.5 servings a day (15). This study found that those who maintained weight reported
consuming significantly higher amounts of low fat dairy than those who gained weight
(15). It was found that low fat dairy intake may be associated with prevention of weight
gain in college age students (15).
At a large Midwestern university a study was conducted comparing the
differences on dietary trends, eating habits, and nutrition self-assessment and beliefs
between males and females (16). This study utilized a questionnaire to obtain information
on anthropometric measurements, use of specific diets, sources of nutrition knowledge,
individuals with whom the respondent typically eats meals, as well as nutrition self-
assessment and beliefs of college students (16). Men had significantly higher (P<0.0001)
height, weight, and body mass index values than women. It was found that significantly
higher percentages of women than men had tried a low-fat diet and a low-carbohydrate
diet (16). Significantly lower percentages of women than men had never tried a diet (13).
Significantly higher percentages of women than men reported gaining nutrition
knowledge from family and magazines/newspapers (16). Significantly higher percentages
of women than men agreed that they had too much sugar in their diets; that it is important
to limit carbohydrate consumption, that it is important to limit the amount of fat

9
consumed to lose weight, and that they needed to lose weight (16). This study concluded
that when health professionals are developing nutrition related material, they should take
the difference found between males and females into account (16).
Dietary Knowledge
The previous studies that were examined concentrated mainly on dietary habits of
college age students. The following study examines college student’s knowledge,
attitudes and label use. A group of 537 students were randomly selected to investigate
college student’s nutrition knowledge (17). It was found that the majority of the
responses came from female students (17). It is also interesting to note that the majority
of those who responded were also non-smokers (17). Most of the participants were of
normal weight and were classified as freshman and juniors (17). It was found that
graduate and undergraduate students differed significantly in their attitudes and
knowledge around nutrition (17). In fact, undergraduate students had a more positive
attitude and higher nutrition knowledge than graduate students; no difference was noted
on their label reading behavior (17). Women had significantly higher label reading
behavior scores and nutrition knowledge than did men (17). Although the majority of
students perceived food labels to be useful and easy to read, there was an inherent distrust
of the truthfulness and accuracy of food labels (17).
In 2007, a study was conducted to investigate whether or not increased nutrition
knowledge of dietary guidance actually translates into positive behavior (18). This was
achieved through the use of a cross sectional study of 200 students who self-reported
their eating habits (18). The majority of respondents were female and were between the
age of 18 and 20 (18). This study found that the majority of students were classified as

10
moderately active (18). It was observed that, for fruit, dairy, protein, and whole grains,
increased knowledge is related to increased likelihood of meeting dietary guidelines (18).
Furthermore, it was found when asked about individual food choice, nutrition knowledge
was related to making more healthful choices in every case. It appears that when posed
with a question about a specific type of food, students are able to use their knowledge to
make a more healthful choice (18). This study concluded that increased knowledge of
dietary guidance does appear to be positively related to more healthful eating patterns
among college students. The results of this study also suggest that overall better eaters
have higher nutrition knowledge (18).
This study was conducted from January 2009 to May of 2010. Its purpose was to
assess the dietary intakes and eating habits of female college athletes and compare them
with the minimum sports nutrition standards. Participants were recruited from three
university athletic departments (19). Anthropometric measurements such as height,
weight body mass index (BMI), and body composition were collected. A single 24-hour
recall was obtained on the student’s first clinic visit by a qualified research assistant. A 3-
day food record, a 24-hour recall, and a nutrition questionnaire were also utilized. The
students’ resting metabolic rate was determined using the Cunningham equation (19).
The study found that fifty -two female collegiate athletes completed all the measurements
and provided dietary data for the study. Nearly all athletes in the sample failed to match
their energy intakes with their estimated energy needs (19). Furthermore, it was found
that the majority of them also failed to meet their carbohydrate needs, even though the
study utilized only the minimum carbohydrate needs. The t-tests indicated the energy and
carbohydrate intakes were below the minimum recommended amount (p< .001), with

11
only 9% of the participants meeting their energy needs (19). Seventy-five percent of the
participants failed to consume the minimum amount of carbohydrates. It was found that
the majority of the participants reported no regular breakfast, 36% consumed < 5
meals/day, and only 16% monitored their hydration status (19). It was recommended that
greater efforts should be focused on increasing sports nutrition knowledge and improving
eating habits among female college athletes in order to optimize their nutritional status
(19). The study also recommended that sports physicians, nutritionists, as well as athletic
trainers should be aware of these nutrition-related problems because inadequate dietary
intakes and eating behaviors can negatively impact not only the quality of training and
recovery, but also the nutritional status and overall health of female college athletes (19).
Another study examined the transition to higher education and the role that such a
life changing event can have on health behaviors. The study was conducted from
February to March or 2008 and then again from February to March of 2009(20). The
study consisted of 291 randomly selected students. The students were followed their final
year of high school through their second year of college (20). Dietary intake and physical
activity were measured through the use of questionnaires, while BMI and waist
circumference where measured objectively (20). The study found that on average
students gained 2.7 kg with a greater increase in males (20). Active transportation and
sport participation decreased. Some sedentary behaviors such as watching TV, and
playing computer games did decrease, while other such as internet use and studying
increased. The study also found that consumption of different foods decreased and
alcohol consumption increased (20). The researchers also found that a higher decrease in
sport participation, a higher increase in internet use and a lower increase in studying were

12
related to a greater increase in BMI (20). An increase in alcohol consumption only
contributed to weight gain in males, whereas a decrease in fruit/vegetable intake only
contributed to weight gain in females (20).
In summary, the literature has indicated that many different factors that contribute
to weight gain or maintenance in college students. Some researchers found that weight
gain may be attributed to those who consume breakfast less often than others, have a
decrease in moderate exercise they previously participated in, and that the change from
high school to college can impact students greatly in their dietary habits. Researchers also
found strategies that can help college student decrease the risk of weight gain. Those
included nutrition education for students entering college, an increase in moderate
activity, and that in increase in overall nutrition knowledge can lead to better eating
habits. It was also noted that nutrition education should consider the differences between
males and females. Lastly, it was concluded that long term weight prevention can linked
to overall healthy habits.
Chapter 3: Methodology
The research was conducted at the University of Kentucky through the
Department of Dietetics and Human Nutrition. In order to explore the nutritional
knowledge and practices of college students, students were recruited to participate in an
internet-based survey. The survey consisted of fifty-eight questions related to dietary
practices and nutrition knowledge, as well as information pertaining to the participant’s
demographics and background. The questions for the survey were obtained from several
sources that had been utilized in previous research such as the Youth Risk Behavior
Surveillance System (YRBS) 2007, survey questions from Jane Kolodinsky’s research

13
(18), and the National Health and Nutritional Examination Survey (NHANES).
Permission to utilize the student email listserv was sought and obtained from two
colleges within the university. An email was distributed via the list-servs directing
students to the survey link. The body of the email contained details of the survey as well
as consent of the students. A follow-up email was sent two weeks after the initial email.
After 162 responses were collected, the data were exported, coded and analyzed using
SPSS v.-16.0.
Chapter 4: Results
Demographics
Of the participants, 146 were female, and 16 were male. The sample was 97%
Caucasian and 84% reported being single. Further description of the sample can be found
in Table 1 and Table 2.
Table 4.1: Sample Descriptives (N=162)
Table 4.2: University of Kentucky Classification
Category Frequency percent
Freshman (1) 26 16.0
Sophomore (5) 37 22.8
Junior (6) 38 23.5
Senior (7) 48 29.6
Graduate Student (5) 13 8.0
Total 162 100
Category Minimum Maximum Mean Std.
Deviation
Age 17 42 21.45 4.51
Height in inches 54 77 65.77 3.49
Weight in pounds 85 280 145.47 29.48
BMI (kg/m2) 15.41 40.17 23.63 4.30
TV hours watched per week 0 100 8.46 10.75
Hours of sleep per night 1 9 6.92 1.24

14
University Meal Plan Participation
The frequency of those who used the University’s meal plan was assessed and
120 of the respondents were using the meal plan, which accounted for 74.1% of
respondents. The remaining 42 responses indicated that they did use the meal plan and
accounted for 25.9% of respondents.
Comparison of Nutrition and Non-nutrition Majors
The table below examines several hypotheses with student t-tests. Nutrition and
non-Nutrition majors were compared on BMI, exercise and weight training. There was a
significant difference in BMI between non--nutrition majors and nutrition majors. This is
indicated by a p--value of 0.004. However there is no significant difference found in the
two groups regarding any area of exercise that was surveyed. When comparing the two
groups, it was found that there was no difference in those who report exercising at least
20 minutes per day, those who exercised 30 minutes per day, those who exercised 60
minutes per day, and those who reported weight training.
Table 4.3: BMI and exercise
Classification N Mean Std.
Dev
P
Value
Body Mass index (BMI)
NON NUTRITION
STUDENT 138 23.9 4.5 0.004
NUTRTION
STUDENT 24 22.05 2.42
Days a week exercised
20 min
NON NUTRITION
STUDENT 136 1.54 1.06 0.374
NUTRTION
STUDENT 24 1.75 0.94
Days a week exercised
30 min
NON NUTRITION
STUDENT 136 1.3 1.08 0.312
NUTRTION
STUDENT 24 1.54 0.98
Days a week exercised
60 min
NON NUTRITION
STUDENT 137 0.82 1.02 0.819
NUTRTION
STUDENT 24 0.88 0.8
Days a week weight
training
NON NUTRITION
STUDENT 137 0.72 0.847 0.093
NUTRTION
STUDENT 23 1.04 0.825

15
In the below table one finds that there was no significant difference between the
groups on how often students were dining out. Also there was no significant difference
found when examining if students who were majoring in nutrition utilized the meal plan.
Lastly there was no significant difference found between the amount of meals that were
prepared in the home and if the student was majoring in nutrition or not.
Table 4.4: Meal preparation method
Classification N Mean Std.
Dev
P
Value
Days a week
dine out
NON NUTRITION
STUDENT 138 1.14 0.77 0.68
NUTRTION STUDENT 24 1.58 2.08
Years of meal
plan use
NON NUTRITION
STUDENT 138 0.27 0.45 0.54
NUTRTION STUDENT 24 0.21 0.42
Days a week
self-prepared
meal
NON NUTRITION
STUDENT 138 2.87 1.07 0.98
NUTRTION STUDENT 24 2.88 0.99
It was found that the amount of television watched by students was significantly
different for the nutrition versus non-nutrition majors with a significance of p=0.005. The
amount of hours slept per night by students was not different between the two groups,
with an average of about seven hours per night for each group.
Table 4.5: TV hours and sleep hours
Classification N Mean
Std.
Dev
P
Value
Average hours of TV watched per week
NON NUTRITION
STUDENT 138 8.86 11.49 0.005
NUTRTION
STUDENT 24 6.25 4.33
Average hours of sleep per night
NON NUTRITION
STUDENT 138 6.9 1.29 0.49
NUTRTION
STUDENT 24 7.04 0.86

16
The below table examines fruit and juice consumption. It was found that there
was no significant difference between consumption of juice and fruit and if the student
had majored in nutrition or some other non-nutrition field.
Table 4.6: 100% fruit juice and fruit
Classification N Mean Std.
Dev
P
Value
Fruit juice consumed
per day
NON-NUTRITION
STUDENT 138 2.24 1.27 0.12
NUTRTION STUDENT 24 1.92 0.83
Fruit juice consumed
in past week
NON NUTRITION
STUDENT 138 3.34 4.8 0.28
NUTRTION STUDENT 24 2.25 2.99
Average fruit juice
consumed per day
NON NUTRITION
STUDENT 138 0.48 0.69 0.28
NUTRTION STUDENT 24 0.32 0.43
How much fruit
(excluding juice)
consumed in past
week
NON NUTRITION
STUDENT 138 5.24 5.37 0.06
NUTRTION STUDENT 24 0.88 8.39

17
Non-nutrition students and nutrition students were found to be different in their
consumption of vegetables. Nutrition students consumed more salad and total vegetables
than non-nutrition students.
Table 4.7: Salad, potatoes, vegetables consumed
Classification N Mean Std.
Dev
P
Value
Past 7 days how
many times
consumed green
salad
NON NUTRITION
STUDENT 137 2.08 0.86 0.003
NUTRTION
STUDENT 24 2.67 1.13
Past 7 days how
many times
consumed potatoes
NON NUTRITION
STUDENT 137 2.69 1.12 0.13
NUTRTION
STUDENT 24 3.21 1.59
Past 7 days
how many
times
consumed other
vegetables
NON NUTRITION
STUDENT 138 1.14 0.88 0.05
NUTRTION
STUDENT 24 2.15 1.69
The two groups were not significantly different on consumption of soda and milk.
Table 4.8: Soda and milk
Classification N Mean
Std.
Dev
P
Value
Past 7 days amount of
times full calorie soda
consumed
NON NUTRITION
STUDENT 138 2.17 1.41 0.26
NUTRTION
STUDENT 24 1.83 1.13
Past 7 days how
many glasses of milk
consumed
NON NUTRITION
STUDENT 138 2.97 1.6 0.49
NUTRTION
STUDENT 24 2.88 1.93

18
The table below shows that students consumed that same number of meals per
day, on average. It also shows that nutrition students were less likely to consume
breakfast than non-nutrition majors.
Table 4.9: Breakfast and meals per day
Classification N Mean
Std.
Dev
P
Value
Days per week
breakfast consumed
NON
NUTRITION
STUDENT
136 5.01 2.33 0.01
NUTRTION
STUDENT 24 6 1.47
Meals consumed in one day
NON
NUTRITION
STUDENT
137 2.61 0.53 0.49
NUTRTION
STUDENT 24 2.88 0.44
The below table shows the amount of calories students consume in a day. There
was no significances for any of the t-tests.
Table 4.10: Amount of calories consumed
Classification N Mean
Std.
Dev P Value
Days a week do
you consume less
than 2000 Calories
NON
NUTRITION
STUDENT
129 2.97 1.3 0.58
NUTRTION
STUDENT 23 3.13 1.22
Days a week do
you consume more
than 2000 Calories
NON
NUTRITION
STUDENT
131 2.44 1.91 0.63
NUTRTION
STUDENT 23 2.57 1.16
Days a week do
you consume more
than 2500 Calories
NON
NUTRITION
STUDENT
131 1.65 0.93 0.48
NUTRTION
STUDENT 24 1.5 0.93

19
The below t-test examines different strategies that students utilized to decrease
their overall weight. There was no significant difference between the groups. It was
found that for students that had majors in the nutrition department the mean was slightly
higher than those who were non-nutrition students.
Table 4.11: Weight loss practices
Classification N Mean
Std.
Dev
P
Value
How many times in past 30 days were
fewer calories consumed to lose weight
NON
NUTRITION
STUDENT
136 1.38 0.49 0.44
NUTRTION
STUDENT 24 1.46 0.51
How many times in past 30 days did
you fast to lose weight
NON
NUTRITION
STUDENT
136 1.95 0.22 0.84
NUTRTION
STUDENT 24 1.96 0.2
How many times in past 30 days were
diet pills consumed to lose weight
NON
NUTRITION
STUDENT
138 1.94 0.24 0.75
NUTRTION
STUDENT 24 1.96 0.2
Eating a variety of foods each day
probably gives you all the vitamins and
minerals you need.
NON
NUTRITION
STUDENT
134 1.97 1 0.21
NUTRTION
STUDENT 24 2.25 1.03
Starchy foods, like bread, potatoes, and
rice, make people fat
NON
NUTRITION
STUDENT
134 3.29 1.05 0.07
NUTRTION
STUDENT 23 3.71 0.96
20
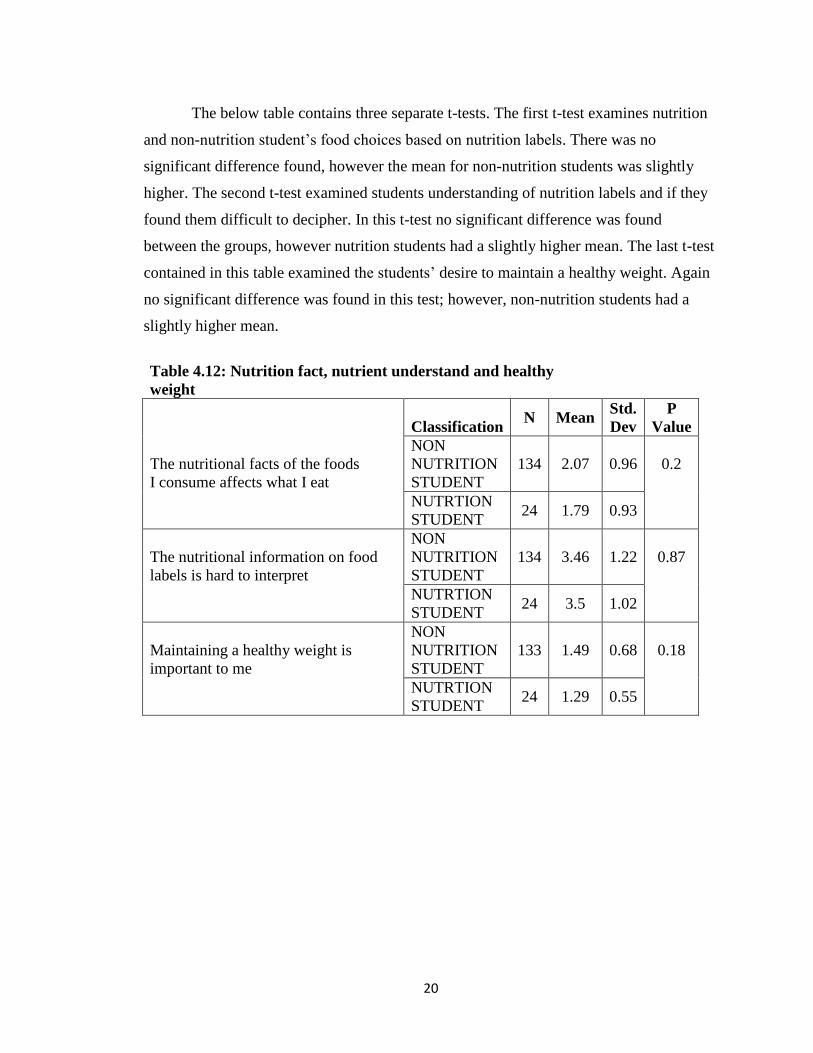
The below table contains three separate t-tests. The first t-test examines nutrition
and non-nutrition student’s food choices based on nutrition labels. There was no
significant difference found, however the mean for non-nutrition students was slightly
higher. The second t-test examined students understanding of nutrition labels and if they
found them difficult to decipher. In this t-test no significant difference was found
between the groups, however nutrition students had a slightly higher mean. The last t-test
contained in this table examined the students’ desire to maintain a healthy weight. Again
no significant difference was found in this test; however, non-nutrition students had a
slightly higher mean.
Table 4.12: Nutrition fact, nutrient understand and healthy
weight
Classification N Mean
Std.
Dev
P
Value
The nutritional facts of the foods
I consume affects what I eat
NON
NUTRITION
STUDENT
134 2.07 0.96 0.2
NUTRTION
STUDENT 24 1.79 0.93
The nutritional information on food
labels is hard to interpret
NON
NUTRITION
STUDENT
134 3.46 1.22 0.87
NUTRTION
STUDENT 24 3.5 1.02
Maintaining a healthy weight is
important to me
NON
NUTRITION
STUDENT
133 1.49 0.68 0.18
NUTRTION
STUDENT 24 1.29 0.55

21
The below table contains three different t-tests. The first t-test examined student’s
alcohol consumption over their life-time. It was found that there was no significant
difference between the groups, however the non-nutrition students mean was slightly
higher than that of nutrition students. The next t-test examined the age at which a student
had their first drink of alcohol. For this test no differences was found, however non-
nutrition students had a slightly higher mean. The last t-test examined the students overall
nutrition knowledge. Again this t-test did not show any difference however; nutrition
students had a slightly higher mean.
Table 4.13: Alcohol consumed, knowledge index score
Classification N Mean
Std.
Dev
P
Value
During your life, how many days have
you had at least one drink of alcohol?
NON
NUTRITION
STUDENT
135 4.6 2.07 0.76
NUTRTION
STUDENT 24 4.46 2.2
In past 30 days, on how many days
did you have at least one drink of
alcohol?
NON
NUTRITION
STUDENT
135 2.65 1.34 0.39
NUTRTION
STUDENT 23 2.39 1.02
Nutrition knowledge index score
NON
NUTRITION
STUDENT
132 2.23 0.55 0.08
NUTRTION
STUDENT 24 2.44 0.6
The table below examines the correlations between BMI, the amount of TV hours
watched, number of hours slept, how many days a week breakfast was consumed and the
knowledge index score. There was no correlation between a student’s BMI and the
amount of hours of television a student watches per week (p-value=0.35). There was a
weak negative correlation between BMI and the average hours of sleep per night. When
testing the correlation between BMI and days per week breakfast was consumed it was
found that the two variables were not related (p=0.93). When examining the correlation

22
between BMI and knowledge index score it was found that there was no association
between the two variables (p=0.50). Lastly, of the other correlation tests performed
between hours slept and television is of note. The r value (-0.23) indicates that there is
there is a significant weak negative correlation (P-value 0.004).
Table 4.14: BMI, TV hours, Sleep hours, Breakfast Knowledge
BMI tv sleep breakfast knowledge
BMI R-value 1 0.08 -0.15 -0.01 -0.06
p-value 0.35 0.05 0.93 0.5
TV hours watched
per week
R-value 0.075 1 -.23 -0.11 -0.04
p-value 0.35 0.004 0.17 0.63
Average hours
of sleep per
night
R-value -0.15 -0.23 1 0.14 0.08
p-value 0.054 0.004 0.09 0.33
Days per week
breakfast
consumed
R-value -0.01 -0.11 0.14 1 0.01
p-value 0.93 0.17 0.09 0.9
Knowledge index
score
R-value -0.06 -0.04 0.08 0.01 1
p-value 0.5 0.63 0.33 0.9
Chapter 5: Discussion
College Major and BMI
The results show that the majority of students, no matter the major, had a very
strong understanding of basic nutrition. In fact, both students who had chosen a major
within nutrition and those who were non-nutrition major had very similar scores for the
overall nutrition knowledge index. The non-nutrition students showed a mean of 2.22 and
the nutrition students scoring a 2.44. This indicates that both groups had a very similar
knowledge of the principles of food and nutrition. The student’s responses answer
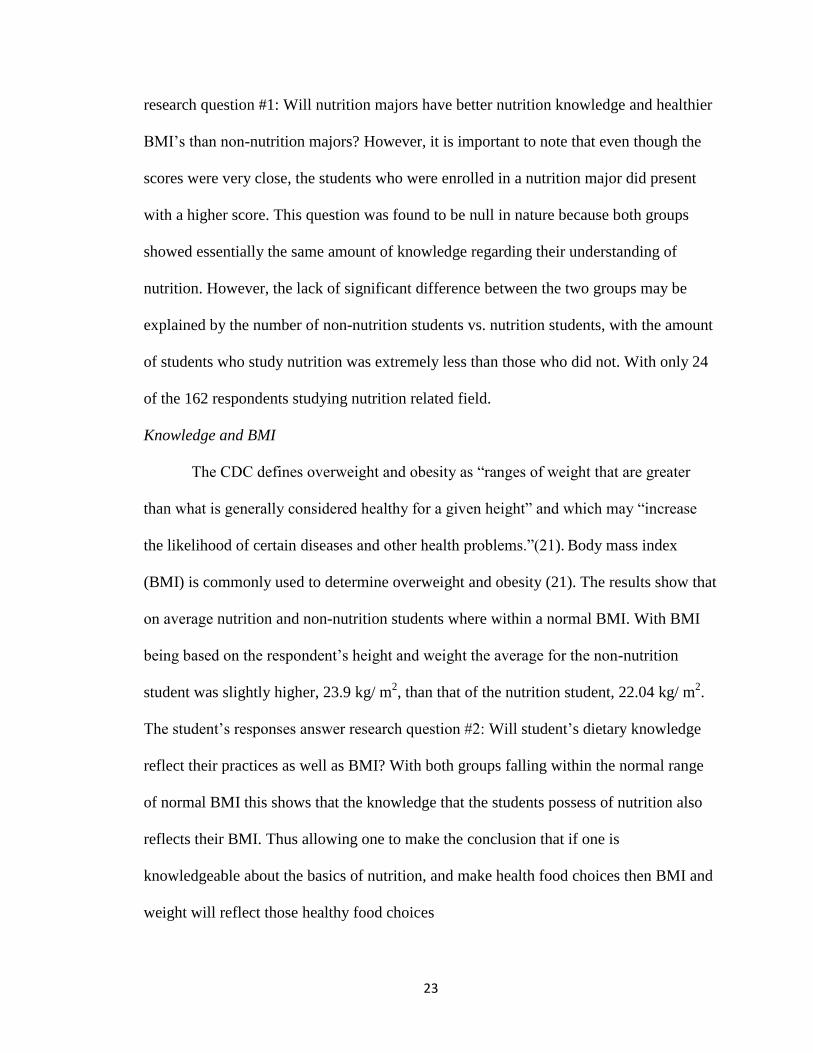
23
research question #1: Will nutrition majors have better nutrition knowledge and healthier
BMI’s than non-nutrition majors? However, it is important to note that even though the
scores were very close, the students who were enrolled in a nutrition major did present
with a higher score. This question was found to be null in nature because both groups
showed essentially the same amount of knowledge regarding their understanding of
nutrition. However, the lack of significant difference between the two groups may be
explained by the number of non-nutrition students vs. nutrition students, with the amount
of students who study nutrition was extremely less than those who did not. With only 24
of the 162 respondents studying nutrition related field.
Knowledge and BMI
The CDC defines overweight and obesity as “ranges of weight that are greater
than what is generally considered healthy for a given height” and which may “increase
the likelihood of certain diseases and other health problems.”(21). Body mass index
(BMI) is commonly used to determine overweight and obesity (21). The results show that
on average nutrition and non-nutrition students where within a normal BMI. With BMI
being based on the respondent’s height and weight the average for the non-nutrition
student was slightly higher, 23.9 kg/ m2, than that of the nutrition student, 22.04 kg/ m
2.
The student’s responses answer research question #2: Will student’s dietary knowledge
reflect their practices as well as BMI? With both groups falling within the normal range
of normal BMI this shows that the knowledge that the students possess of nutrition also
reflects their BMI. Thus allowing one to make the conclusion that if one is
knowledgeable about the basics of nutrition, and make health food choices then BMI and
weight will reflect those healthy food choices

24
The nature of the survey being a self-reporting internet survey may allow for
some discrepancies in reporting of height, weight, and body composition. Furthermore,
more healthy and knowledgeable students may have only chosen to participate in the
study, with those who have a limited understanding of BMI, and nutrition knowledge
choosing to not participate in the study. One study conducted in 2006 found that some
adolescence intentionally gave inaccurate information (22).
Chapter 6: Limitations
Limitations of this study consisted of sample size, accuracy of the nutritional
measurement tool, and survey length. Although the sample size was acceptable for
achieve a representative sample only 162 students completed the survey. With the
University of Kentucky’s overall enrollment in 2008 exceeding 26,000 (23), the response
of 162 students cannot predict the results of the entire university. Research has shown
that by obtaining a larger sample size a researcher can minimize the probability of errors,
maximize the accuracy of population estimates, and increase the generalizability of the
results (24). By obtaining a larger number of participants it may have yielded a more
significant insight into the dietary habits and knowledge of students. If the survey had not
contained as many questions more students may have been inclined to participate in the
survey, as well as complete the survey in its entirety. Focus groups or in class surveys
may have yielded a more accurate and more participants, as there is a structured time
limit in such settings.

25
Chapter 7: Conclusion and Recommendations
The literature regarding the specifics on the dietary habits and knowledge of
college age students is limited. Of the studies, almost all have found that students make
healthy eating choices, and find such tools as the nutrition label a valuable tool for
making those healthy choices. There does not appear to be any significant difference
between the non-nutrition students and nutrition students, as both reported making
healthy choices, had normal BMI’s, and had a knowledge index that was not significantly
different from one group to the next. It is recommended that more research be conducted
and a different method of reporting be conducted such as focus groups to ensure accurate
height, weight, and BMI as well as providing a more balanced number of respondents
from each study group. A 24-hour recall of food may give a better and more accurate
picture of the dietary habits of college age students.

26
Appendix A: IRB Application
IRB EXEMPTION CERTIFICATION REQUEST: PROCEDURES AND APPLICATION INSTRUCTIONS
Research activities in which the only involvement of human subjects will be in one or more specified categories are exempt from the federal regulations for the protection of human subjects. These categories are listed under item "16" of the attached EXEMPTION CERTIFICATION FORM. Although certain research activities are exempt, the Institutional Review Board (IRB) is responsible for certifying that the research meets the exemption criteria requirements. Once a research study has been certified as "exempt," continuation reviews are not required. Please note if a project extends beyond a 6 year period, you are required to submit a new exemption application. Exemption applications are only held for a six year period.
Exempting an activity from review does not absolve the investigator(s) from ensuring that the welfare of the subjects participating in the research is protected and that methods used and information provided to gain subject consent are appropriate to the activity.
Also, it is the investigator’s responsibility to notify the IRB if any changes or modifications are made in the study's design, procedures, etc. which do not fall within one of the categories exempted from the regulations.
Below are instructions for preparing an IRB Exemption Certification Application:
1. The preliminary determination that a research project is eligible for exemption is made by the investigator. This judgment should be made with care. Items "15" and "16" on the attached EXEMPTION CERTIFICATION FORM serve as a guide in making this determination. Questions of interpretation may be directed to the Office of Research Integrity at 859-257-9084.
2. If the research activities fall into an exemption category, the EXEMPTION CERTIFICATION FORM, which is attached, must be completed in duplicate. THIS FORM MUST BE TYPED.
3. The EXEMPTION CERTIFICATION FORM should be reviewed and signed by the investigator's department chairperson. If the research is being conducted to fulfill academic requirements, the investigators faculty advisor should sign the Exemption Certification Form.
4. Note that if the research is being submitted to or is supported by an extramural or internal funding agency or program, a copy of the grant or contract proposal must also be submitted to the IRB.
5. If the research includes survey or interview procedures, the questionnaire, interview questions or assessment scales should be included in the application.

27
6. The study may be regulated by the Health Insurance Portability and AccountabilityAct (HIPAA) Privacy Rule even if the study is exempt from the federal regulationsfor the protection of human subjects. Please review the Office of Research Integrity’sHIPAA web page, www.research.uky.edu/ori/HIPAA/main%20page.htm, todetermine if the study is regulated by the HIPAA Privacy Rule.
7. The materials listed below should be collated in the following order and 2 copiessubmitted to Joe Brown, Office of Research Integrity, 405 Kinkead Hall, 0057:
a) Exemption Certification Form;
b) Instruments to be used for data collection, if applicable (see item 5 above);
c) When appropriate, grant/contract proposal;
d) HIPAA forms, if applicable.
8. The copies of the IRB Exemption Certification Form will be forwarded to the IRBchairperson or designated representative(s) for review.
9. The designated representative(s) is responsible for reviewing the exemption request.The reviewer(s) recommendations usually fall into one of three categories: a)Exemption Certification Approved; b) Additional Information Required; c)Exemption Certification Disapproved (does not qualify for exempt review).
10. If the exemption request is disapproved, the standard procedures for submitting astudy for full or expedited IRB review should be followed.
11. The Office of Research Integrity will notify the investigator of the outcome of thereview.
PLEASE NOTE: IF YOUR RESEARCH INVOLVES VA PATIENTS OR VA RESOURCES, IT MUST ALSO BE APPROVED BY THE VA RESEARCH AND DEVELOPMENT COMMITTEE. PLEASE CALL THE VA RESEARCH OFFICE, 859-281-4927, FOR FURTHER INFORMATION.
EXEMPTION CERTIFICATION FORM
1. Check IRB:
Medical Nonmedical X
2. Name and Address of Principal Investigator (PI) (where mail can most easily reach
PI): If research is being submitted to or supported by an extramural funding agency
such as NIH, a private foundation or a pharmaceutical/manufacturing company, the
PI listed on the grant application or the drug protocol must be the same person listed
below. If the PI is completing this project to meet the requirements of a University of
Kentucky academic program, also list name and campus address of faculty advisor.
PI Name: Kelly Webber

28
Department: Nutrition and Food Science
*Room # &
Bldg.:
204 Funkhouser Building
Speed Sort #:
*Students should list preferred mailing address (i.e., an address where mail will
most quickly reach them).
Note: If Employee ID# is not available, provide first & last initials with year of birth
e.g., JB1969
3. PI’s Employee
ID#:
Degree and
Rank:
Ph.D. Associate
Professor
4. PI’s
Telephone
#:
Dept.
Code:
81500
5. PI’s e-mail
address:
PI’s FAX
Number:
4. Title of Project: (If applicable, use the exact title listed in the grant/contract
application. If this is a VA study, it is important that you add “UK/VA:” at the beginning of your title for internal tracking purposes.)
Nutrition Knowledge and Practice of University of Kentucky Students Survey
5. Number and age level of human
subjects:
500+ / 18 years and
older
Number Age Range
6. Does the study involve recruitment of human subjects (i.e., patients, staff,
volunteers) from the VA Medical

29
Center OR use VA resources (i.e., funds, equipment, space, VA personnel)?
YES NO X
If you answer “YES” to #6, you should also contact the VA Research and
Development Office (859-281-4927) for additional information.
7. Indicate the items below that apply to your research. Check ALL that apply:
Academic Degree / Required Research
HIPAA Authorization[HIPAA Forms web address:
http://www.research.uky.edu/ori/forms%20HIPAA.htm
HIPAA Waiver of Authorization
HIPAA De-identification
Waiver of Informed Consent
Waiver of Requirement for Documentation of Informed Consent
8. If the research is being submitted to, supported by, or conducted in cooperation with an
external or internal funding program, indicate the categories that apply. Check ALL
that apply:
x Not applicable Internal Grant Program
(HHS) Dept. of Health & Human Services
National Science
Foundation
(NIH) National Institutes of Health
Other Institutions of Higher
Education
(CDC) Center for Disease Control Pharmaceutical Company
(HRSA) Health Resources and Services
Administration
Private
Foundation/Association
(SAMHSA) Substance Abuse and Mental
Health Services Administration State
30
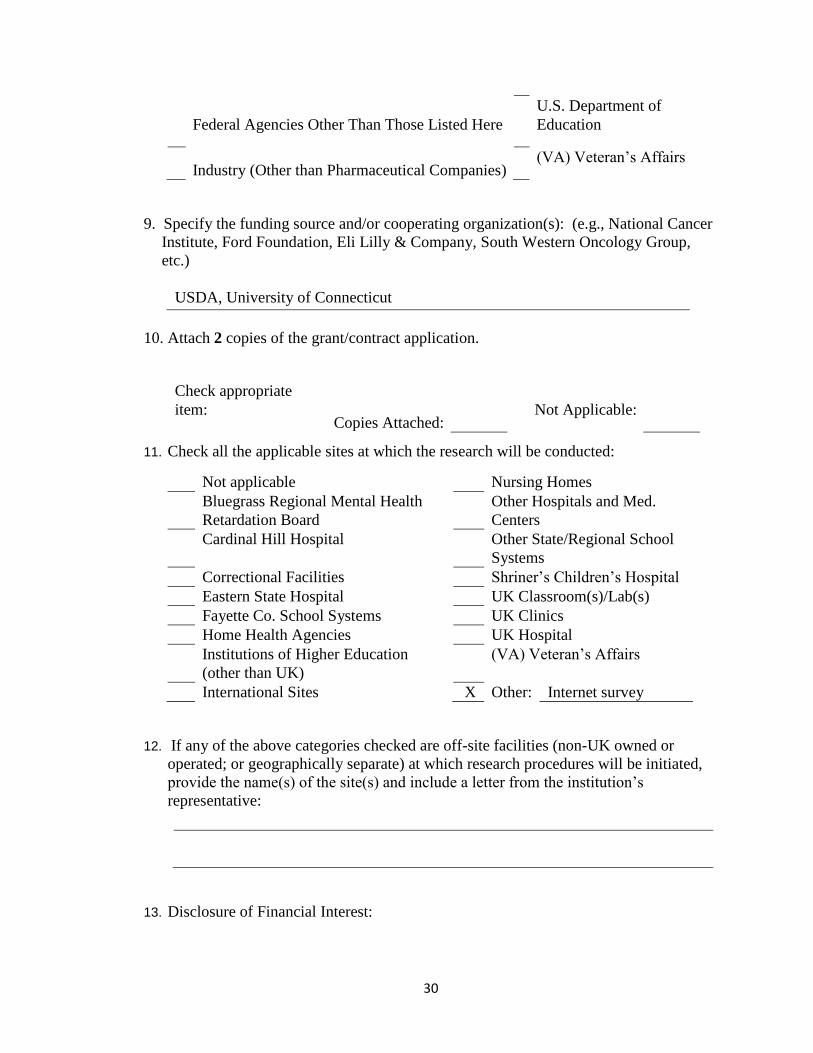
Federal Agencies Other Than Those Listed Here
U.S. Department of
Education
Industry (Other than Pharmaceutical Companies)
(VA) Veteran’s Affairs
9. Specify the funding source and/or cooperating organization(s): (e.g., National Cancer
Institute, Ford Foundation, Eli Lilly & Company, South Western Oncology Group,
etc.)
USDA, University of Connecticut
10. Attach 2 copies of the grant/contract application.
Check appropriate
item: Copies Attached:
Not Applicable:
11. Check all the applicable sites at which the research will be conducted:
Not applicable Nursing Homes
Bluegrass Regional Mental Health
Retardation Board
Other Hospitals and Med.
Centers
Cardinal Hill Hospital Other State/Regional School
Systems
Correctional Facilities Shriner’s Children’s Hospital
Eastern State Hospital UK Classroom(s)/Lab(s)
Fayette Co. School Systems UK Clinics
Home Health Agencies UK Hospital
Institutions of Higher Education
(other than UK)
(VA) Veteran’s Affairs
International Sites X Other: Internet survey
12. If any of the above categories checked are off-site facilities (non-UK owned or
operated; or geographically separate) at which research procedures will be initiated,
provide the name(s) of the site(s) and include a letter from the institution’s
representative:
13. Disclosure of Financial Interest:

31
a) All investigators and employees who are or will be responsible for the design,
conduct, or reporting of activities under externally-funded research at the
University of Kentucky are required to complete a Staff/Faculty Disclosure of
Financial Interest Form [http://www.uky.edu/eForms/forms/discfin.pdf]. Have
you, or any of the specified personnel who completed a Staff/Faculty Disclosure of
Financial Interest Form (Form X), answered "yes" to ANY of the 4 questions on
the form?
Yes X No Not externally funded
If “yes”, you must include with your IRB application submission a copy of the
completed form (Form X), and a copy of the significant financial interest
management plan established with your Dean, Director, or through the Office of
Sponsored Projects Administration (OSPA). Note: The management plan must be
included or the IRB will not review your proposal.
b) If you marked in 13a) that you are not externally funded, complete Form Y
[Staff/Faculty Disclosure of Financial Interest Form (for non-externally funded
research)] and include it with your application submission.
14. Identify other study personnel assisting in research project (attach additional sheets if
necessary):
Note: If Employee ID# is not available, provide first & last initials with year of birth –
e.g., JB1969
Name,
Rank/Degree
Matt Majors, Graduate Student
BS
Employee
ID#:
mm1984
Responsibility in
Project
Study Personnel
E-mail address: [email protected]
15. Note: The exemption categories listed in item "16" do not apply when the research
activities include the following:
prisoners

32
survey or interview techniques which include minors as subjects (this applies to
exemption category #2 only)
the observation of minors where the investigator participates in the activities
being observed (this applies to exemption category #2 only)
Food and Drug Administration (FDA) regulated research (this applies to
exemption categories 1-5 and includes projects for which the data will be
submitted to or held for inspection by the FDA, or projects for which the
investigator gathers data on participants who serve as controls for participants
who receive FDA-regulated drugs or medical devices, other than in the course of
medical practice.)
16. Research activities are exempt from the federal regulation 45 CFR 46.101(b) for theprotection of human subjects when the ONLY involvement of human subjects fallswithin one or more of the categories below. Check the appropriate categories thatapply to your research project:
(1) ___X__ Research conducted in established or commonly accepted educational settings, involving normal educational practices, such as
(i) research on regular and special educational instructional strategies, or (ii) research on the effectiveness of or the comparison among
instructional techniques, curricula, or classroom management methods.
(5) ___X__ Research involving the use of educational tests (cognitive, diagnostic, aptitude, achievement), survey procedures, interview procedures or observation of public behavior, unless:
(i) information obtained is recorded in such a manner that human subjects can be identified, directly or through identifiers linked to the subjects; and
(ii) any disclosure of the human subjects' responses outside the research could reasonably place the subjects at risk of criminal or civil liability; or
(iii) be damaging to the subjects' financial standing, employability, or reputation. For Veteran Affairs Medical Center (VAMC) research, damage to the subjects’ insurability must also be taken into consideration.
(6) _____ Research involving the use of educational tests (cognitive, diagnostic, aptitude, achievement), survey procedures, interview procedures, or observation of public behavior that is not exempt under category (5) of this section, if:
(i) the human subjects are elected or appointed public officials or candidates for public office; or
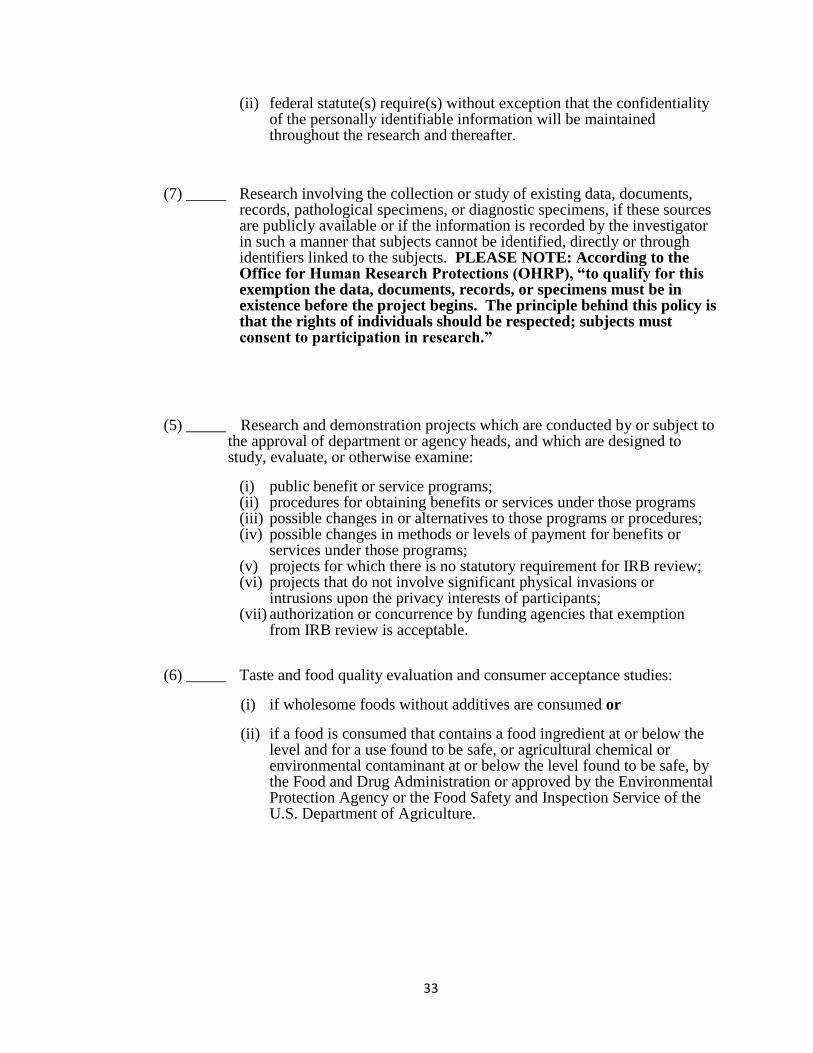
33
(ii) federal statute(s) require(s) without exception that the confidentiality of the personally identifiable information will be maintained throughout the research and thereafter.
(7) _____ Research involving the collection or study of existing data, documents, records, pathological specimens, or diagnostic specimens, if these sources are publicly available or if the information is recorded by the investigator in such a manner that subjects cannot be identified, directly or through identifiers linked to the subjects. PLEASE NOTE: According to the Office for Human Research Protections (OHRP), “to qualify for this exemption the data, documents, records, or specimens must be in existence before the project begins. The principle behind this policy is that the rights of individuals should be respected; subjects must consent to participation in research.”
(5) _____ Research and demonstration projects which are conducted by or subject to the approval of department or agency heads, and which are designed to study, evaluate, or otherwise examine:
(i) public benefit or service programs; (ii) procedures for obtaining benefits or services under those programs (iii) possible changes in or alternatives to those programs or procedures; (iv) possible changes in methods or levels of payment for benefits or
services under those programs; (v) projects for which there is no statutory requirement for IRB review; (vi) projects that do not involve significant physical invasions or
intrusions upon the privacy interests of participants; (vii) authorization or concurrence by funding agencies that exemption
from IRB review is acceptable.
(6) _____ Taste and food quality evaluation and consumer acceptance studies:
(i) if wholesome foods without additives are consumed or
(ii) if a food is consumed that contains a food ingredient at or below the level and for a use found to be safe, or agricultural chemical or environmental contaminant at or below the level found to be safe, by the Food and Drug Administration or approved by the Environmental Protection Agency or the Food Safety and Inspection Service of the U.S. Department of Agriculture.

34
EXEMPTION CERTIFICATION RESEARCH DESCRIPTION
1. Background: Provide an introduction and background information.
The answers to the question, What should Americans eat? have once again been revised .
There is some evidence that consumer-education campaigns have contributed to
increased sales of whole-grain foods in recent years; however, consumption of all food
groups has increased; including less-healthful options. Currently, although the guidelines
advise that only 20% of energy come from solid fats, alcohol, and added sugars, for
boys/men in the 14- to 18-years and 19- to 30-years age groups, intake of these foods
constitutes 39% to 42% of total daily energy. Traditional-age college students fall in the
middle of these age groups. Foods prepared away from home, including foods making up
many college meal plans, have long been recognized to contain more energy and fat and
less nutrients than foods prepared at home. There is some evidence that people use food-
related knowledge to improve their diets, although the literature has focused primarily on
food labels. There is a gap in the literature concerning whether knowledge of dietary
guidelines translates into better eating behaviors, particularly among the high-risk college
student age group.
2. Objectives: List your research objectives.
Examines if nutrition knowledge of dietary guidance actually translates into positive
behavior, this cross-sectional study will investigate self-reported eating patterns of
college students. An Internet-based survey will be used to identify how closely
respondents followed the Dietary Guidelines for Americans 2005, and whether their
eating patterns were related to their knowledge of dietary guidance. It will be observed
if, for fruit, dairy, protein, and whole grains, increased knowledge is related to
increased likelihood of meeting dietary guidelines.

35
3. Study Population: Describe the characteristics of the subject population, such as
anticipated number, age range, gender, ethnic background and health status. Identify the
criteria for inclusion and exclusion.
The estimated number of people in this study will be campus wide of all current full time
students. The study population will consist of males & females, 18 years old and over,
Englishspeaking.
4. Subject Recruitment Methods: Describe how the prospective subjects will be
identified for recruitment and describe the recruitment procedures. Also, attach a copy
of any material which will be used to recruit subjects (i.e. advertisements, flyers,
telephone scripts, verbal recruitment scripts, cover letters, etc.).
An internet based survey will be sent out over the UK listserv system asking studetns to
particiapate in the study. After a few weeks a follow up email will be sent to remind
students of the survey.
5. Research Procedures: Describe the research procedures.
6. Data Collection: List the data or attach a list of the data to be collected about or from
each subject (e.g. interview script, survey tool, data collection form for existing data).
Attached
7. Potential Risks: If applicable, describe any potential risks--physical, psychological,
social, legal or other.
None
8. Research Materials, Records and Confidentiality: Describe procedures formaintaining the confidentiality of the data.

36
All instruments will be coded and names will be removed and stored in a secured locked file cabinet in the PI’s office. No testing information will be given to the employer.
Principal Investigator’s Assurance Statement:
I understand the University of Kentucky's policies concerning research involving human
subjects and I agree:
1. to comply with all IRB policies, decisions, conditions, and requirements;
2. to accept responsibility for the scientific and ethical conduct of this research
study;
3. to obtain prior approval from the Institutional Review Board before amending or
altering the research protocol or implementing changes in the approved
consent/assent form;
4. to notify the Office of Sponsored Projects Administration (OSPA) and/or the
IRB (when applicable) of the development of any financial interest not already
disclosed;
5. each individual listed as study personnel in this application has received the
mandatory human research protections education (e.g., Dunn & Chadwick,
CITI).
This is to certify that the only involvement of human subjects in this research study will be in the categories specified in item #16.
Signature ___________________________________Date __________________
____Matthew Majors__________________________________
(Name Typed)
*Department Chairperson’s Assurance Statement:
37
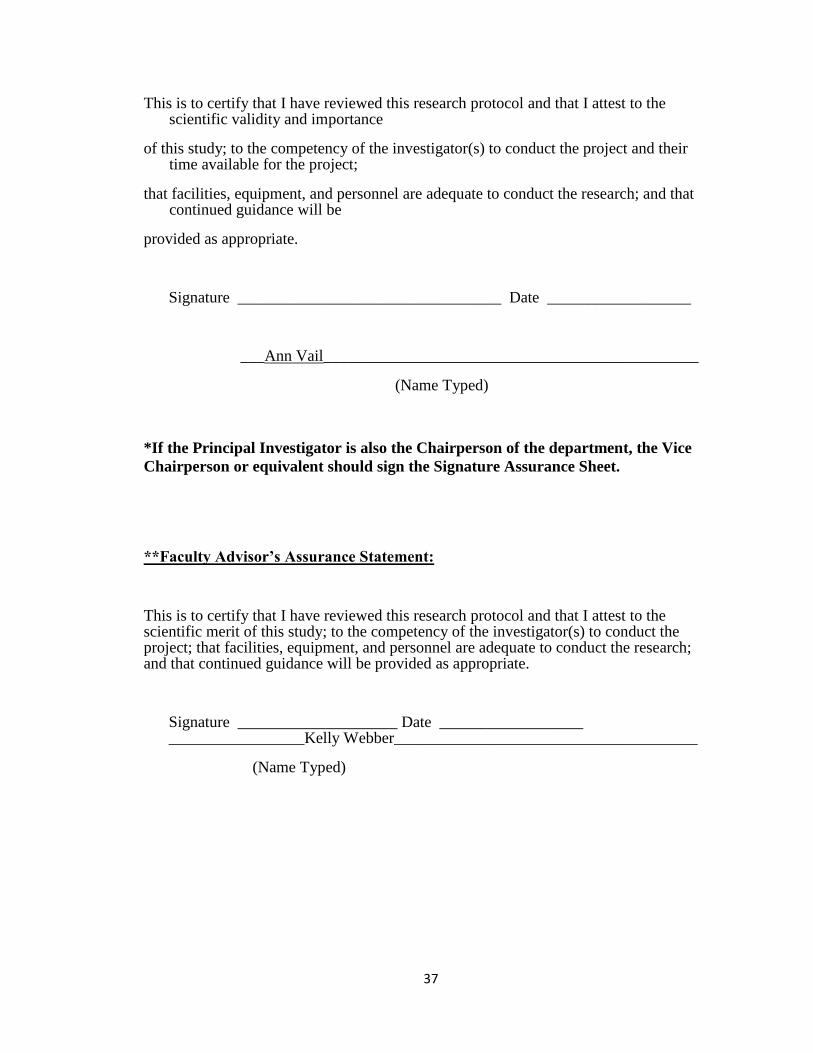
This is to certify that I have reviewed this research protocol and that I attest to the scientific validity and importance
of this study; to the competency of the investigator(s) to conduct the project and their time available for the project;
that facilities, equipment, and personnel are adequate to conduct the research; and that continued guidance will be
provided as appropriate.
Signature _________________________________ Date __________________
___Ann Vail_______________________________________________
(Name Typed)
*If the Principal Investigator is also the Chairperson of the department, the Vice
Chairperson or equivalent should sign the Signature Assurance Sheet.
**Faculty Advisor’s Assurance Statement:
This is to certify that I have reviewed this research protocol and that I attest to the scientific merit of this study; to the competency of the investigator(s) to conduct the project; that facilities, equipment, and personnel are adequate to conduct the research; and that continued guidance will be provided as appropriate.
Signature ____________________ Date __________________ _________________Kelly Webber______________________________________
(Name Typed)
38
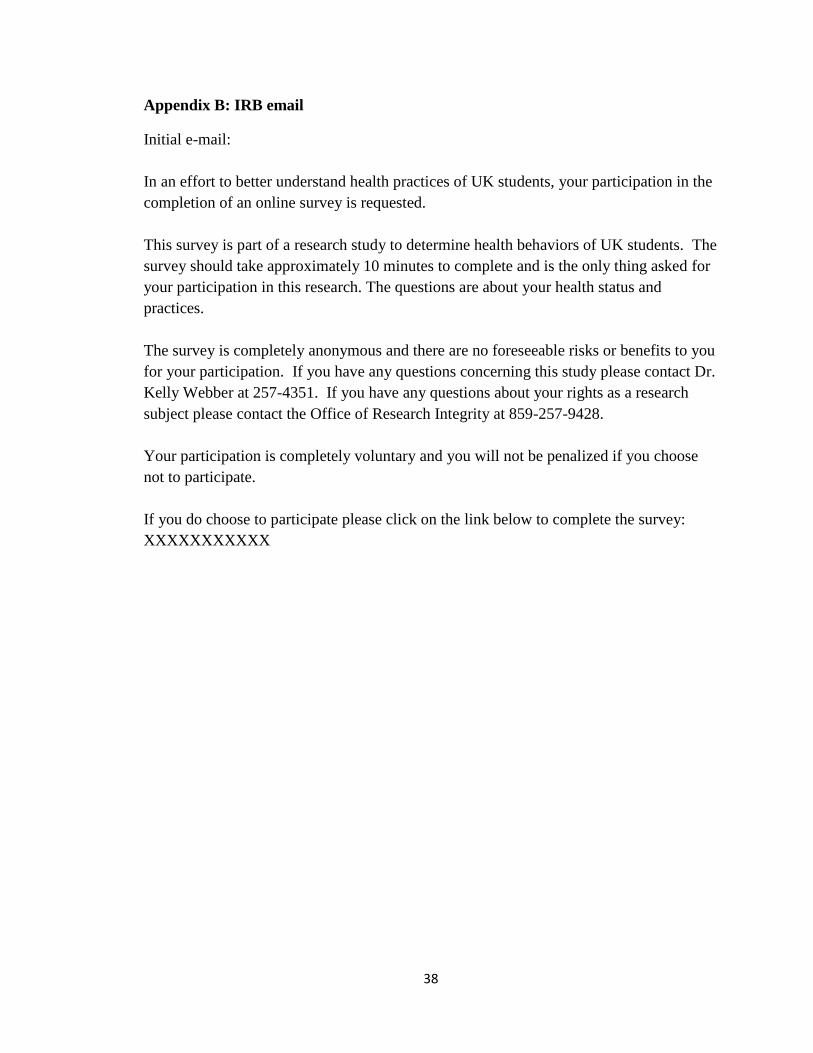
Appendix B: IRB email
Initial e-mail:
In an effort to better understand health practices of UK students, your participation in the
completion of an online survey is requested.
This survey is part of a research study to determine health behaviors of UK students. The
survey should take approximately 10 minutes to complete and is the only thing asked for
your participation in this research. The questions are about your health status and
practices.
The survey is completely anonymous and there are no foreseeable risks or benefits to you
for your participation. If you have any questions concerning this study please contact Dr.
Kelly Webber at 257-4351. If you have any questions about your rights as a research
subject please contact the Office of Research Integrity at 859-257-9428.
Your participation is completely voluntary and you will not be penalized if you choose
not to participate.
If you do choose to participate please click on the link below to complete the survey:
XXXXXXXXXXX

39
Appendix c: Survey Questions
Nutritional Knowledge and Practice Survey
Q1. What is your gender?
Q2. What is your race/ethnicity?
Q3. How old are you?
Q4. What is your height?
Q5. What is your weight?
Q6. What is your marital status?
Q7. What is your University classification?
Freshman , Sophomore, Junior, Senior , Graduate school
Q8. What is your major?
Q9. Do you belong to a campus Greek organization? If so, for how long?
Never, 1 year, 2 years, 3 years, 4 years
Q10. Do you currently use the University meal plan?
Yes, No
Q11. How many years have you used the University meal plan?
0,1,2,3,4 or more
Q12. How many meals a week do you dine on campus?
1 or less, 2-5, 6-9, 10-12, 13 or more
Q13. How often do you eat at restaurants off campus?
Never, 1-2 times a week, 3-4 times a week, 5-6 times a week, 7 times per week
Q14. How often do you cook or eat a self-prepared meal such as canned soup or cereal
and milk?
Never, 1-2 times a week, 3-4 times a week, 5-6 times a week, 7 times per week

40
Q15. How many days a week do you exercise at least 20 minutes to the point you sweat
or breathe hard: such as basketball, soccer, running, swimming laps, fast bicycling, fast
dancing, or similar aerobic
Never, 1-2 times a week, 3-4 times a week, 5-6 times a week, 7 times per
week
Q16. How many days a week do you exercise at least 30 minutes that make you sweat or
breathe hard
Never, 1-2 times a week, 3-4 times a week, 5-6 times a week, 7 times per
week
Q17. How many days a week do you exercise at least 60 minutes to the point you sweat
or breathe hard
Never, 1-2 times a week, 3-4 times a week, 5-6 times a week, 7 times per
week
Q18. How many days a week do you perform resistance exercises such as weight lifting,
isometrics, resistance bands, or similar exercises?
Never, 1-2 times a week, 3-4 times a week, 5-6 times a week, 7 times per week
Q19. How many years have you been or were you a student athlete (excluding medical,
athletic or academic red shirt years)?
Never,1,2,3,4
Q20. How many hours a week do you spend watching T.V?
Q21. On average, how many hours of sleep do you get a night?
Q22. Have you ever been diagnosed with the following conditions? (check all that apply)
Anorexia, Bulimia, High Blood pressure, High cholesterol, Diabetes
Q23. How do you describe your weight?
Very underweight, Slightly Underweight, about the right weight, Slightly
overweight, Very overweight
Q24. Which of the following are you trying to do about your weight?
Lose weight, Gain weight, stay the same weight, I am not trying to do anything
about my weight

41
Q25. During the past 30 days, did you eat less food, fewer calories, or foods low in fat to
lose weight or to keep from gaining weight?
Yes, No
Q26. During the past 30 days, did you go without eating for 24 hours or more (also called
fasting) to lose weight or to keep from gaining weight?
Yes, No
Q27. During the past 30 days, did you take any diet pills, powders, or liquids without a
doctor's advice to lose weight or to keep from gaining weight? (Do not include meal
replacement products such as Slim Fast.)
Yes, No
Q28. During the past 7 days, how many times did you drink 100% fruit juices such as
orange juice, apple juice, or grape juice? (Do not count punch, Kool-Aid, sports drinks,
or other fruit-flavored drinks.)
None, 1-3 past 7 days, 4-6 past 7 days, 1 per day, 2 per day, 3 per day, 4 or more
per day
Q29. During the past 7 days, how many times did you eat fruit? (Do not count fruit juice.)
None, 1-3 past 7 days, 4-6 past 7 days, 1 per day, 2 per day, 3 per day, 4 or more
per day
Q30. During the past 7 days, how many times did you eat green salad?
None, 1-3 past 7 days, 4-6 past 7 days, 1 per day, 2 per day, 3 per day, 4 or more
per day
Q31. During the past 7 days, how many times did you eat potatoes? (Do not count french
fries, fried potatoes, or potato chips.)
Q32. During the past 7 days, how many times did you eat carrots?
None, 1-3 past 7 days, 4-6 past 7 days, 1 per day, 2 per day, 3 per day, 4 or more
per day
Q33. During the past 7 days, how many times did you eat other vegetables? (Do not
count green salad, potatoes, or carrots.)

42
None, 1-3 past 7 days, 4-6 past 7 days, 1 per day, 2 per day, 3 per day, 4 or more
per day
Q34. During the past 7 days, how many times did you drink a can, bottle, or glass of soda
or pop, such as Coke, Pepsi, or Sprite? (Do not include diet soda or diet pop.)
None, 1-3 past 7 days, 4-6 past 7 days, 1 per day, 2 per day, 3 per day, 4 or more
per day
Q35. During the past 7 days, how many glasses of milk did you drink? (Include the milk
you drank in a glass or cup, from a carton, or with cereal. Count the half pint of milk
served at school as equal to one glass.)
None, 1-3 past 7 days, 4-6 past 7 days, 1 per day, 2 per day, 3 per day, 4 or more
per day
Q36. How many days a week do you eat breakfast?
Q37. How many meals do you consume in 1 day (including snacks)?
0-1, 2-3, 4-5, 6 or more
Q38. How many days a week do you consume 2 cups of fruit?
None, 1-2, 3-4, 5-6, 7
Q39. How many days a week do you consume 3 cups of vegetables?
None, 1-2, 3-4, 5-6, 7
Q40. How many days a week do you consume 3 cups of dairy?
None, 1-2, 3-4, 5-6, 7
Q41. How many days a week do you consume 8 oz of grains?
None, 1-2, 3-4, 5-6, 7
Q42. How many days a week do you consume 6 oz or more of meat and beans?
None, 1-2, 3-4, 5-6, 7
Q43. How many days a week do you consume 6 - 7 teaspoons of oil?
None, 1-2, 3-4, 5-6, 7
43
Q44. How many days a week do you consume less than 2000 Calories?
None, 1-2, 3-4, 5-6, 7
Q45. How many days a week do you consume more than 2000 Calories?
None, 1-2, 3-4, 5-6, 7
Q46. How many days a week do you consume more than 2500 Calories?
None, 1-2, 3-4, 5-6, 7
Q47. Eating a variety of foods each day probably gives you all the vitamins and minerals
you need.
Strongly agree, agree, Neutral, Disagree, Strongly Disagree
Q48. Starchy foods, like bread, potatoes, and rice, make people fat.
Strongly agree, agree, Neutral, Disagree, Strongly Disagree
Q49. What you eat can make a big difference in your chance of getting diseases, like
heart disease or cancer.
Strongly agree, agree, Neutral, Disagree, Strongly Disagree
Q50. The things I eat and drink now are healthy so there is no reason for me to make
changes.
Strongly agree, agree, Neutral, Disagree, Strongly Disagree
Q51. Knowing the nutritional facts of the foods I consume affects what I eat.
Strongly agree, agree, Neutral, Disagree, Strongly Disagree
Q52. The nutritional information on food labels is hard to interpret.
Strongly agree, agree, Neutral, Disagree, Strongly Disagree
Q53. Maintaining a healthy weight is important to me.
Strongly agree, agree, Neutral, Disagree, Strongly Disagree
Q54. During your life, on how many days have you had at least one drink of alcohol?
0, 1-2, 3-9, 10-19, 20-39, 40-99, 100 or more

44
Q55. How old were you when you had your first drink of alcohol other than a few sips?
8 years, 9-10, 11-12, 13-14, 15-16, 17 or older
Q56. During the past 30 days, on how many days did you have at least one drink of
alcohol?
0, 1 or 2, 3 to 5, 6 to 9, 10-19, 20-29, all 30
Q57. During the past 30 days, on how many days did you have 5 or more drinks of
alcohol in a row, that is, within a couple of hours?
0, 1, 2, 3-5, 6-9, 10-19, 20 or more
Q58. During the past 30 days, how did you usually get the alcohol you drank?
I did not drink, I bought at a store, I bought at restaurant/bar/club, I bought at a
public event such as concert or sporting, I gave someone else money to buy it for
me, someone gave it to me, I took it from a store or family member, I got it some
other way
45
References
1) Fryar, C., Carroll, M., & Ogden, C. (2014, September 19). Retrieved July 1, 2015,
from
http://www.cdc.gov/nchs/data/hestat/obesity_adult_11_12/obesity_adult_11_12.ht
m
2) (2015, June 24). Retrieved July 1, 2015, from
http://www.cdc.gov/nchs/nhanes.htm
3) Defining Overweight and Obesity. (2012, April 27). Retrieved July 1, 2015, from
http://www.cdc.gov/obesity/adult/defining.html
4) Defining Childhood Obesity. (2015, June 19). Retrieved July 1, 2015, from
http://www.cdc.gov/obesity/childhood/defining.html
5) Arnett JJ. Emerging Adulthood. Am Psychol. 2000;55(5):469-480.
6) Nelson, M., Story, M., Larson, N., Neumark-Sztainer, D., & Lytle, L. (2008).
Emerging Adulthood And College-age Youth: An Overlooked Age For Weight-
related Behavior Change. Obesity, 16(10), 2205-2211.
7) Galuska, D., Gillespie, C., Kuester, S., Mokdad, A., Cogswell, M., & Philip, C.
(2008, July 17). State-Specific Prevalence of Obesity Among Adults. Retrieved
January 7, 2015, from
http://www.cdc.gov/mmwr/preview/mmwrhtml/mm5728a1.htm
8) Howsig, K., & Nickols-Richardson, S. (2005). Associations Between Dietary
Patterns and Weight Change in College Freshmen. Journal of American Dietetic
Association, 105(8), 31-31.
9) Wengreen, H., Moncur, C., & Austin, M. (2006). Change in Weight and Other
Anthropometric Measures Among Freshmen During their First Semester of
College at Utah State University. Journal of American Dietetic Association,
106(8), A30-A30.
10) Greiner, D., Holmes, T., Hollenbeck, C., & Sucher, K. (2005). Changes in Body
Weight, Body Composition, Resting Metabolic Rate and Physical Activity in
College Freshmen at the End of One Semester and Again at One Year. Journal of
the American Dietetic Association, 105(8), 61-61.
11) Cluskey, M., & Grobe, D. (2009). College Weight Gain And Behavior
Transitions: Male And Female Differences. Journal of the American Dietetic
Association, 109(5), 325-329.
12) Edmonds, M., Ferreira, K., Nikiforuk, E., Finnie, A., Leavey, S., Duncan, A., &
Simpson, J. (2008). Body Weight and Percent Body Fat Increase during the
Transition from High School to University in Females. Journal of the American
Dietetic Association, 108(6), 1033-1037.
13) Sealey-Potts, C., Bottego, J., & Lopez, G. (2006). Weight and Nutrition-Related
Behavior Changes Experienced by First Time College Students Living Away
from Home. Journal of the American Dietetic Association, 106(8), A20-A20.
14) Strong, K., Parks, S., Anderson, E., Winett, R., & Davy, B. (2008). Weight Gain
Prevention: Identifying Theory-Based Targets For Health Behavior Change In
Young Adults. Journal of the American Dietetic Association, 108(10), 1708-
1715.e3.

46
15) Poddar, K., Hosig, K., Nickols-Richardson, S., Anderson, E., Herbert, W., &
Duncan, S. (2009). Low-Fat Dairy Intake and Body Weight and Composition
Changes in College Students. Journal of the American Dietetic Association,
109(8), 1433-1438.
16) Davy, S., Benes, B., & Driskell, J. (2006). Sex Differences In Dieting Trends,
Eating Habits, And Nutrition Beliefs Of A Group Of Midwestern College
Students. Journal of the American Dietetic Association, 106(10), 1673-1677.
17) Misra, R. (2007). Knowledge, Attitudes, and Label Use among College Students.
Journal of the American Dietetic Association, 107(12), 2130-2134.
18) Kolodinsky, J., Harveyberino, J., Berlin, L., Johnson, R., & Reynolds, T. (2007).
Knowledge Of Current Dietary Guidelines And Food Choice By College
Students: Better Eaters Have Higher Knowledge Of Dietary Guidance. Journal of
the American Dietetic Association, 107(8), 1409-1413.
19) Shriver, L., Betts, N., & Wollenberg, G. (2013). Dietary Intakes and Eating
Habits of College Athletes: Are Female College Athletes Following the Current
Sports Nutrition Standards? Journal of American College Health, 61(1), 10-16.
20) Deforche, B., Dyck, D., Deliens, T., & Bourdeaudhuij, I. (2015). Changes in
weight, physical activity, sedentary behaviour and dietary intake during the
transition to higher education: A prospective study. International Journal of
Behavioral Nutrition and Physical Activity, 12(1), 1-10.
21) Healthy Weight - it's not a diet, it's a lifestyle! (2014, November 25). Retrieved
January 7, 2015, from http://www.cdc.gov/healthyweight/
22) Fan, X. (2006). An Exploratory Study about Inaccuracy and Invalidity in
Adolescent Self-Report Surveys. Field Methods, 18(6), 223-244.
23) BLACKFORD, L. (2013, September 10). University of Kentucky enrollment tops
29,000 for first time. Retrieved January 7, 2015, from
http://www.kentucky.com/2013/09/10/2814457/university-of-kentucky-
enrollment.html
24) Osborne, JW., Costello, AB (2004). Sample size and the subject to item ratio in
principle component analysis. Practical Assessment, Research & Evaluation,
9(11). Retrieved on January 7, 2015 from
http://PAREonline.net/getvn.asp?v=9&n=11
47
Vita
Matthew Ryan Majors RD, LD
Place of birth:
Corbin KY
Education:
Bachelors of Science Dietetics University of Kentucky, July 2007
Dietetic internship, University of Kentucky, July 2007
Professional Positions:
Teaching assistant, University of Kentucky 2007-2009
Nutrition Lead, St, Joseph Hospital, Lexington KY 2009-2011
Food service manager, Mullins Nursing Center, Mullins SC 2011-2012
Dietitian, Mullins Nursing Center and Carolina Health Systems-Marion,
Mullins SC 2011-2012
Consult Dietitian, Dietary Consultants Inc, Richmond KY, 2012-2013
Renal Dietitian, Dialysis Services of London and Pineville, London and
Pineville KY, 2013-current