dietary assessment methods for micronutrient …...dietary assessment methods for micronutrient...
TRANSCRIPT

Dietary assessment methods for micronutrient intake in infants,
children and adolescents: a systematic review
Adriana Ortiz-Andrellucchi1, Patricia Henrıquez-Sanchez1, Almudena Sanchez-Villegas,
Luis Pena-Quintana1, Michelle Mendez2 and Lluıs Serra-Majem1*1Nutrition Research Group, Department of Clinical Sciences, Centre for Health Sciences, University of Las Palmas de Gran
Canaria, PO Box 550, 35080 Las Palmas de Gran Canaria, Spain2Center for Research in Environmental Epidemiology, Municipal Institute of Medical Research. Biomedical Research Park,
Barcelona, Spain
(Received 15 June 2009 – Revised 2 October 2009 – Accepted 1 November 2009)
A systematic literature search identified studies validating the methodology used for measuring the usual dietary intake in infants, children and
adolescents. The quality of each validation study selected was assessed using a European micronutrient Recommendations Aligned-developed
scoring system. The validation studies were categorised according to whether the study used a reference method that reflected short-term
intake (,7 d), long-term intake ($7 d) or used biomarkers. A correlation coefficient for each nutrient was calculated from the mean of the
correlation coefficients from each study weighted by the quality of the study. Thirty-two articles were included in the present review: validation
studies from infants (1–23 months); child preschool (2–5 years); children (6–12 years); adolescents (13–18 years). Validation of FFQ studies in
infants and preschool children using a reference method that reflected short-term intake showed good correlations for niacin, thiamin, vitamins B6,
D, C, E, riboflavin, Ca, K, Mg, Fe and Zn (with correlations ranging from 0·55 for vitamin E to 0·69 for niacin).Regarding the reference method
reflecting short-term intake in children and adolescents, good correlations were seen only for vitamin C (r 0·61) and Ca (r 0·51). Using serum levels
of micronutrient demonstrated that the 3 d weighed dietary records was superior to the FFQ as a tool to validate micronutrient intakes. Including
supplement users generally improved the correlations between micronutrient intakes estimated by any of the dietary intake methods and respective
biochemical indices.
Infants: Children: Adolescents: Dietary assessment methods: Systematic review: Validation: Micronutrients
Growth in children from birth through adolescence is an extre-mely complex process. It is influenced not only by the geneticmake-up of the individual but also by environmental factors,medical illnesses and nutritional status(1). Dietary assessmentsamong infants and preschool children are complicated by thefacts that dietary habits change rapidly in infancy, parentsmay share the responsibility for the child with other adults,e.g. in day-care, and finally not all food served to the infantsare consumed, resulting in their disposal(2).
In the school age years, children experience enormouscognitive, emotional and social growth and development.Children transition from consuming most food intake underadult control and supervision to taking increasing responsibil-ity for their food choices. The cognitive abilities required toself-report food intake include an adequately developedconcept of time, a good memory and attention span andknowledge of the names of food(3,4). The need for adult assist-ance in dietary reporting is also driven by the limited scope ofthe child’s experience and knowledge of food preparation(5).
During adolescence, children undergo profound biological,emotional, social and cognitive changes to reach adultmaturity. Adolescents’ need for energy and all nutrientssignificantly increases to support the rapid rate of growth anddevelopment. Moreover, although appetite and food intaketend to increase, psychosocial characteristics often lead tothe development of high-risk nutritional behaviours such asexcessive dieting, adoption of fad diets or excessive alcoholconsumption. The high prevalence of overweight and obesity,eating disorders, adolescent pregnancy and the lack of con-sumption of five fruits and vegetables a day constitute someof the nutritional challenges facing adolescents(6).
Research conducted as part of the European Commission’sEuropean micronutrient Recommendations Aligned Networkof Excellence(7) has focused on extensive literature reviewsaddressing the validation of methods used to assess intake ofmicronutrients, n-3 fatty acids and of special populationgroups, including pregnant women, infants, children, adoles-cents and elderly people. In this review, studies validating
On behalf of EURRECA’s RA.1.1 ‘Intake Methods’ members: Serra-Majem L (Coordinator), Cavelaars A, Dhonukshe-Rutten R, Doreste JL, Frost-Andersen L,
Garcıa-Alvarez A, Glibetic M, De Groot L, De Vries J, Gurinovic M, Henrıquez-Sanchez P, Naska A, Ngo J, Novakovic R, Ortiz-Andrellucchi A, Øverby NC,
Pijls L, Ranic M, Ribas-Barba L, Ristic-Medic D, Roman-Vinas B, Ruprich J, Saavedra-Santana P, Sanchez-Villegas A, Tabacci G, Tepsic J, Trichopoulou A,
van ’t Veer P, Vucic V, Wijnhoven TMA.
*Corresponding author: Lluis Serra-Majem, fax þ34 928 453475, email [email protected]
Abbreviations: BM, biomarker; EDR, estimated dietary records; 24HR, 24 h dietary recall; WDR, weighed dietary records; YAQ, Youth/Adolescent Questionnaire.
British Journal of Nutrition (2009), 102, S87–S117 doi:10.1017/S0007114509993163q The Authors 2010
British
Journal
ofNutrition
Dow
nloaded from https://w
ww
.cambridge.org/core . IP address: 54.39.106.173 , on 07 Jun 2020 at 02:39:42 , subject to the Cam
bridge Core terms of use, available at https://w
ww
.cambridge.org/core/term
s . https://doi.org/10.1017/S0007114509993163

dietary methods for assessing micronutrient intake in infants,children and adolescents are presented.
Material and methods
The research question applied to the systematic review was‘which dietary methods are reliable for the assessment ofmicronutrient intake in infants, children and adolescents?’The main stages of the review are illustrated in Fig. 1. Thereview included English, Spanish, French, Italian, Portugueseand German articles, without limits on time frame or countrypublished before April 2008. Stage 1 of the review involvedsearching for publications using electronic databases (MED-LINE and EMBASE). The MeSH terms used in the generalsearch were: nutritional assessment, diet, nutritional status,dietary intake, food intake, validity, validation study, reprodu-cibility, replication study, correlation coefficient and corre-lation study in the title and abstract. As a second specificsearch, the following words were included: infants (1–23months), preschool child (2–5 years), children (6–12 years),adolescents (13–18 years), ‘dietary assessment’, ‘dietary intake’,‘nutrition assessment’, ‘diet quality’, reliability, reproducibility,validit* and correlate* as free text in the title and abstract.Additional publications were identified from referencespublished in the original papers. At stage 2 of the review, thetitles and abstracts were analysed by two independent reviewersand the exclusion criteria were applied (Table 1). At stage 3,studies that fulfilled the inclusion criteria were analysed forrelevance to the research question.
The selected studies were then classified into three differenttypes according to the reference method applied in thevalidation studies: (1) reference method assessing intake of,7 d (including 24 h dietary recall (24HR), estimated dietaryrecords (EDR) and weighed dietary records (WDR)), classifiedas reflecting short-term intake; (2) reference method assessingintake of $7 d, reflecting more long-term intake; (3) referencemethod that employed the use of a biomarker (BM). Further-more, the different studies included in this review were scoredaccording to a quality score system developed by Europeanmicronutrient Recommendations Aligned. The studies wererated according to the sample size, the statistics used tovalidate the method, the procedure of data collection, theconsideration or not of seasonality and the inclusion or notof vitamin supplement use. (For details see the article in thissupplement ‘Evaluating the quality of dietary intake validationstudies’). A total score was calculated according to the meanof the correlation coefficients weighted by the quality scoreof the validation study. It was considered a poor method forassessing specific nutrient intake when the correlation between
methods was ,0·30. Methods whose correlations werebetween 0·30 and 0·50 were regarded as acceptable forassessing nutrient intake. Good methods were those whosecorrelations were between 0·51 and 0·70, and finally, whenthe correlation was .0·70 the method was consideredvery good.
Results
A total of thirty-two publications(2,8 – 39) were selected forinclusion, with information on each validation study, orderedby publication year, summarised in Table 2. Fifteen of thepublications showed results from European countries(Norway, Greece, Belgium, Italy, Denmark, United Kingdomand Finland), fifteen from American countries (United Statesof America, Brazil and Canada), one study from Australiaand one study from New Zealand. The number of participantsvaried from 17 to 741 in the selected studies. In eight of thestudies presented(11,13 – 16,26,34,36), only one type of micronutri-ent was analysed, while in the rest of the publications includedin this review, correlations for a wide variety of micronutrientswere observed, and a total of twenty micronutrients were ana-lysed. Tables 3 and 4 show information on the correlationbetween methods and other statistics in the validation studiesin infants, children and adolescents for twelve vitamins andeight minerals, respectively.
Infants
This group included infants aged 1–23 months. Of the thirty-two articles included in the present review, seven showed dataon the validation of methods used to assess micronutrientintake in infants(2,8,9,17,21,22,24). Evaluating the quality ofthese validation studies resulted in quality scores rangingfrom 2·5 to 5. All the studies evaluated micronutrient intakein infants using a FFQ, and only one article appliedfour 24HR as an additional dietary assessment method(22).Different FFQ were validated for which wide variations inFig. 1. Main stages of the systematic review process.
Table 1. Inclusion and exclusion criteria
Inclusion criteria1. Studies on micronutrient intake in infants, children and adolescents2. Validation study in human subjects
Exclusion criteria1. Studies describing the content of foods in nutrients, additives or
contaminants.2. Studies exclusively focused on diseased or institutionalised
persons.3. Articles presenting reference values for food consumption, nutrient
intake, biochemical markers and anthropometric measurements.4. Articles establishing associations between food consumption,
nutrient intake, biological variables, biochemical markers andanthropometric measurements.
5. Studies relating diseases to food consumption or nutrient intake.6. Intervention studies and other therapeutic studies with nutrients or
drugs related to the metabolism of these nutrients.7. Calibration studies and those discussing statistical methods.8. Studies evaluating the physiological effects of foods, nutrients and
in relation to their genetic determinants.9. Studies in animals.10. Studies written in other languages than English, Spanish, French,
Italian, Portuguese and German and those without abstract.
A. Ortiz-Andrellucchi et al.S88
British
Journal
ofNutrition
Dow
nloaded from https://w
ww
.cambridge.org/core . IP address: 54.39.106.173 , on 07 Jun 2020 at 02:39:42 , subject to the Cam
bridge Core terms of use, available at https://w
ww
.cambridge.org/core/term
s . https://doi.org/10.1017/S0007114509993163

Table 2. Characteristics of included studies
Author/yearpublicationand country Participants/age group Dietary method Reference method Micronutrient Conclusions
Marriott et al.(2008)(8,9) UK
Fifty infants aged 6 months& fifty infants aged12 monthsInfants
FFQ Previous 7 (6 months) or 28(12 months) days intake; thirty-four items at 6 months (includingten categories of commercialbaby foods); seventy-eight itemsat 12 monthsPortion size estimated usinghousehold measures. Exact fre-quencies Interviewer-adminis-tered
4 d weighed dietary records(within 15 days followingFFQ completion)For breast-fed infants, thelength of each feedingwas recorded.
Na, K, Ca, Mg, P. Fe, Zn,Cu, retinol, vitamins D, E,C, B6, B12, thiamin,riboflavin, niacin, folic acid
The interviewer-administered FFQare useful tools for assessingenergy and nutrient intakes ofhealthy infants at 6 and12 months.
Holmes et al.(2008)(10) UK
124 children aged2–17 years
Preschool childrenChildrenAdolescents
(i) Four multipass 24 h dietaryrecalls. Portion size in householdmeasures or using colour photo-graphs Interviewer-administered(ii) 4 d food checklist or dailyrecord of foods eaten; portionsize in household measures(iii) 4 d semi-weighed methodFood consumed at homeweighed and estimated intakeallocated to members; sup-plemented with diary for con-sumption away from home
4 d weighed dietary records(weighed inventory).Foods consumed and left-overs weighed for eachparticipant individually.
Ca, Fe, retinol, thiamin,vitamin C
Four 24 h recalls wererecommended as the mostappropriate method to estimatedietary intakes in low-incomehouseholds based in part ondata to be presented in futurepublications.
Moore et al.(2007)(11)
Canada
162 male children aged9–12 and 14–16 years
ChildrenAdolescents
Rapid assessment method (RAM)FFQthirty-two food items; intakesrefer to a ‘typical day’. Includedsupplements. Visual aids toapproximate portion size.Interviewer-administered
Single 24 h dietary recallsVisual aidsInterviewer-administeredduring same interview asRAM
Ca Correlations between questionnaireand recalls were significant butmoderate, though the RAMoverestimates daily Ca intake ascompared with the 24 h recallmethod in both children andadolescent males.
Lillegaard et al.(2007)(12)
Norway
Forty-five girls and fifty-fiveboys 9 years old
Children
4 d pre-coded food diaries (PFD)277 food itemsPortion size in householdmeasures or using colour photo-graphs
4 d weighed dietary records(same days of week asPFD, 1 week later)Records included sup-plements
Retinol, vitamins D, C,thiamin, riboflavin,Ca, Fe
The PFD method is promising as atool for assessing food intake inlarge surveys among children.
Magkos et al.(2006)(13)
Greece
351 children (189 girls and162 boys)
Mean age 11·9 yearsChildren
30-item FFQPast 12 months intake Standardreference portionsSelf-administered
Single Multipass 24HRInterviewer-administeredsubsequent to FFQ. Stan-dard household measures(cups, tablespoons, etc) &Picture food models
Ca The FFQ can be used to discrimi-nate high v. low Ca intakes, butresults do not support its use inepidemiological studies for thequantitative assessment ofindividual Ca intake.
Harnack et al.(2006)(14) USA
248 childrenAged 11–14 years
ChildrenAdolescents
10-item FFQ Past month’s intake.Portion size alternatives included.Frequency categories up to 3/d.Self-administered.
Three 24 hour dietary recallsby phone subsequent toFFQ.2D food model visual aidsmailed
Ca The Ca FFQ evaluated in this studymay be useful where a briefinstrument is needed, with amoderate association withestimates from dietary recalls.
Huybrechts et al.(2006)(15)
Belgium
509 preschool children(2·5–6·5 years)
Preschool children
FFQPast 12 months intake six
frequency categories up to one
3 d estimated dietary records(three consecutive days)
Ca This FFQ tended to underestimatepreschool children’s Ca intakebut had a fairly good ability to
Micro
nu
trient
assessmen
td
urin
gch
ildh
oo
dS
89
British Journal of NutritionDownloaded from https://www.cambridge.org/core. IP address: 54.39.106.173, on 07 Jun 2020 at 02:39:42, subject to the Cambridge Core terms of use, available at https://www.cambridge.org/core/terms. https://doi.org/10.1017/S0007114509993163

Table 2. Continued
Author/yearpublicationand country Participants/age group Dietary method Reference method Micronutrient Conclusions
daily intake. Forty-seven fooditems. Completed by the child’sparent or guardian. Portionsize alternatives included.Self-administered.
classify subjects.
Bertoli et al.(2005)(16) Italy
Eighteen children aged6–10 years nineteenadolescents aged 16–20years
ChildrenAdolescents
FFQ136 food items (period of intake not
reported). Included supplements.Portion sizeestimated using colourphotographs (small, medium,large). Seven frequencycategories. Interviewer-administered; children aided byparents as needed.
7 d weighed dietary records Ca The FFQ has proved adequate torank a paediatric population interms of Ca intake.
Williams & Innis(2005)(17)
Canada
148 infants aged 8–26months
Infants
FFQ191 foodsPrevious 2 weeks intakeIncluded
supplementsInterviewer-administered
(i) 3 d estimated dietaryrecords(3 consecutive weekdaysand 1 weekend day).Householdmeasuring utensilsprovided Completed1 week before foodrecords
(ii) Biomarkers: Serummarkers of Fe status(ferritin, haemoglobin)
Fe, vitamin C, Ca FFQ need further developmentbefore they can be used toadvance assessment of Fe intakeand status in infants (poorcorrelations with biomarkers).
Andersen et al.(2004)(18,19)
Norway
1872-year-old childrenPreschool children
Semi-quantitative FFQ (SFFQ)Previous 14 days intake. 125 fooditems Included supplements.Portion size estimated using foodphotographs or householdmeasures Self-administered
7 d weighed dietary records(7 consecutive days) Forbreast-fed infants: howoften breast milkwas given.
Vitamins A, D, E, C, thiamin,riboflavin, Ca, Fe
The SFFQ may be a valuable toolfor measuring average intakes ofenergy, macronutrients andseveral food items for a2-year-old population in Norway.
Slater et al.(2003)(20) Brazil
Seventy-nine adolescentsAged 14–18 yearsAdolescents
FFQ for adolescents (AFFQ)Seventy-six food items. Past6 months intake seven frequencycategory. Single reference portionsizes listed. Use of interviewersnot reported
Three 24 h dietary recallsAt intervals of 45 daysbefore FFQ administration
Retinol, vitamin C, Ca, Fe The FFQ provides a reliable scalefor categorising individuals bylevel of past intake of mostnutrients, excluding retinoland Fe.
Marshall et al.(2003)(21) USA
240 children6 &12 months3 & 5 yearsInfantsPreschool children
Quantitative beverage FFQ; sevenfood items or groups described.Intakes in preceding week: at6 and 12 months parentsreported average daily intake; at3 and 5 years average number ofservings per week and usualserving size for each beverageSelf-administered.
3 d weighed dietary records(2 weekdays and1 weekend day) Intakesfrom food and beverages(reported here) as well asbeverages only (similarresults) analysed
Ca, vitamin D A quantitative beverage frequencyquestionnaire can provide arelative estimate of beverage, Caand vitamin D intakes
A.
Ortiz-A
nd
rellucch
iet
al.
S9
0
British Journal of NutritionDownloaded from https://www.cambridge.org/core. IP address: 54.39.106.173, on 07 Jun 2020 at 02:39:42, subject to the Cambridge Core terms of use, available at https://www.cambridge.org/core/terms. https://doi.org/10.1017/S0007114509993163

Table 2. Continued
Author/yearpublicationand country Participants/age group Dietary method Reference method Micronutrient Conclusions
Andersen et al.(2003)(2)
Norway
Sixty-four infants12-month-old
Infants
Semi-quantitative FFQ; Forty-fourquestions about 140 food itemsand supplements Parents askedto keep in mind past 14 daysintake. Food photographs orhousehold measures to estimateportions. For breast-fed infants:how often breast milk was givenper 24 h Self-administered
7 d weighed dietary records(four consecutive days,1-week interval, and threeconsecutive days)For breast-fed infants:how often breast milk wasgiven.
Vitamins A, D, E, C, thiamin,riboflavin, Ca, Fe
The capability of the questionnaireto rank infants according to intakeof nutrients and food items wasmoderate.
Parrish et al.(2003)(22) USA
Sixty-eight children aged1–3 years (biomarkern 38)
InfantsPreschool children
(i) FFQ; Past 12 months intake.111 food items. Completed bythe child’s parent or guardian atend of study period (self-adminis-tered). Standard referenceportions.(ii) Four 24 h dietary recalls Inter-viewer-administered to parentand alternate caregiver every 3months before FFQ
BiomarkersPlasma levels of vitaminsC, D, retinol,b-carotene anda-tocopherol (vitamin E)
Vitamins D, C, retinol,b-carotene, a-tocopherol(vitamin E)
The FFQ shows mostly goodagreements with multiple 24 hrecalls and some biomarkers inpreschool children.
Lietz et al.(2002)(23) UK
Fifty children aged11–13 years(biomarker n 27)
Children
(i) EPIC FFQ; 130 items. Inter-viewer-administered. Past12 months intake; nine frequencycategories. Standard referenceportions used.(ii) 7 d weighed dietary recordssubsequent to FFQ. Food photo-graphs toestimate portions when weighingnot possible.
(i) 7 d weighed dietaryrecordsAfter FFQ. Food photo-graphs(ii) Biomarkers: 24 hurine K
Ca, Na, K The EPIC FFQ is not anappropriate method for estimatingabsolute intakes in adolescentpopulation. However, it seemsadequate to classify low, mediumand high consumers and mighttherefore be used to identifypopulation groups at risk.
Blum et al.(1999)(24) USA
233 childrenAged 1–5 yearsInfantsPreschool children
Harvard Service FFQ (HFFQ)eighty-four food items þ nineteenitems on supplements, foodhabits. Past 4-week intakes. Age-appropriate portions applied (notshown on FFQ). Completed bythe child’s parent or guardian(self-administered). Mean of twoFFQ 1 month apart.
Three 24 h dietary recalls at7–10 d intervals between1st and 2nd FFQ.Two recalls on weekdaysand one recall onweekend.Interviewer-administeredby telephone or in person.
Vitamins A, E, C, B6, B12,thiamin, riboflavin, niacin,folate, Ca, Zn, Mg, Fe
The HFFQ is a simple self-administered questionnairecompleted by the child’s parentor guardian and is useful inassessing the diets of NativeAmerican and Caucasianchildren.
Field et al.(1999)(25) USA
109 students from fourth toseventh grade
Children
FFQPast 12 months intakeSelf-administered (read aloud byteachers)ninety-seven food items, standardreferenceportions used.
Four 24 h dietary recalls(collected on non-consecutive days approxi-mately 3 months apart)Interviewer-administeredbefore FFQ Portion size inhousehold measures orusing colour photographs
Vitamin C, P, Ca, Fe Sixth and seventh grade studentsdemonstrated the ability toprovide valid estimates of intake,but children in the fourth and fifthgrades experienced somedifficulty in completing the FFQ.
Taylor & Goulding(1998)(26)
New Zealand
Forty-one girls andtwenty-six boysaged 3–6 years
FFQPast 12 months intakethirty-five food and
4 d estimated dietaryrecords
Ca The short Ca FFQ tended tooverestimate actual Ca intakes inyoung children. However, the
Micro
nu
trient
assessmen
td
urin
gch
ildh
oo
dS
91
British Journal of NutritionDownloaded from https://www.cambridge.org/core. IP address: 54.39.106.173, on 07 Jun 2020 at 02:39:42, subject to the Cambridge Core terms of use, available at https://www.cambridge.org/core/terms. https://doi.org/10.1017/S0007114509993163

Table 2. Continued
Author/yearpublicationand country Participants/age group Dietary method Reference method Micronutrient Conclusions
Preschool childrenChildren
drink items FFQ demonstrated good ability toclassify subjects into extremes ofCa intake.
Mølgaard et al.(1998)(27)
Denmark
Twenty-three childrenaged 13–14 years
Adolescents
FFQSelf-administered together withtheir parents. Past 1 month’sintake eighty-eight food items.Exact frequencies used Portionsize in household measures
3 d weighed dietaryrecordsCompleted after FFQ 2weekdays,1 weekend day
Ca, P The FFQ is able to rank childrenaccording to their intake ofCa and P.
Green et al.(1998)(28)
Canada
105 adolescent femalesaged 16–19 years
Adolescents
(i) FFQ Self-administered116 food items. Included sup-plements Past 12 months intake.Standardreference portion sizes inhousehold measures(ii) 3 d weighed records(weekdays, weekends)
BiomarkersSerum folate and serumvitamin B12
Folate, vitamin B12 The FFQ and 3 d-WDR are validmeasure of assessing folateintakes in young womencompared with biomarkers. Bothappear useful in determiningvitamin B12 intake, but only whensupplement users are included.
Rockett et al.(1997)(29) USA
261 children andadolescents (aged 9–18)
ChildrenAdolescents
Youth/Adolescent Questionnaire(YAQ)Self-administered131 items; standard referenceportions. Past 12 months intake.Mean of two questionnairesadministered approximately 1·5years apart
Three 24 h dietary recalls atapproximately 5-monthintervals, with detailedprobing. Administeredbetween 1st and 2ndFFQ.
Vitamins A, E, C, B6, B12,retinol, thiamin, riboflavin,niacin, folate, Ca, P, Mg,Fe, Zn, Cu, K, Na
A simple self-administeredquestionnaire completed by olderchildren and adolescents canprovide nutritional informationabout this age group.
Bellu et al.(1996)(30) Italy
333 children(158 girls, 165 boys) aged8–10 years
Children
FFQ116 food items
24 h dietary recallsInterviewer-administered(children’s mothers)3D-food models
Ca, Fe Average estimates with the FFQagree with findings obtained by24 h recalls for most nutrients.The FFQ we designed isappropriate in the northern Italianpaediatric population.
Arnold et al.(1995)(31)
Canada
707 girlsaged 7–12 years
Children
FFQ160 food items. Adapted fromBlock FFQ (intakes in past year).Standard reference portions.Exact frequencies Interviewersreviewed reponses.
Two 7 d estimated dietaryrecords
Vitamins A, C, riboflavin,thiamin, retinol,b-carotene
70 % of subjects were categorisedin the highest or lowest quartileby both FFQ and 7 d EDR forenergy and several nutrients.
Bellu et al.(1995)(32) Italy
Eighty-eight children(forty-nine girls, thiry-nineboys) aged 9–12 years
Children
FFQ116 food items. Referenceportion sizes Self-administered
7 d estimated dietaryrecords3D-food models Com-pleted after FFQ
Vitamins A, C, E, B6,riboflavin, thiamin, Ca, Fe
Intake estimates for most nutrientswere comparable, but there weresignificant differences in esti-mates for several nutrients. Useof nutrient density reducedmisclassification.
Andersen et al.(1995)(33)
Norway
Forty-nine adolescents(17–18 years)
Adolescents
FFQ190 food items. Portion size inhousehold measures, variableportion sizes included.Meal-based reporting Exactfrequencies. Past 12 monthsintake
7 d weighed dietary records4 consecutive days, 1-week interval and threeconsecutive days (fiveweek days and two week-end days) Completed 2–3months after FFQ
Retinol, vitamins D, C,thiamin, riboflavin, Ca, Fe,Mg
The questionnaire is able to ranksubjects according to the testednutrients (0–8 % classified inextreme quartiles), exceptvitamin D (12 % in extremequartile).
A.
Ortiz-A
nd
rellucch
iet
al.
S9
2
British Journal of NutritionDownloaded from https://www.cambridge.org/core. IP address: 54.39.106.173, on 07 Jun 2020 at 02:39:42, subject to the Cambridge Core terms of use, available at https://www.cambridge.org/core/terms. https://doi.org/10.1017/S0007114509993163

Table 2. Continued
Author/yearpublicationand country Participants/age group Dietary method Reference method Micronutrient Conclusions
Iannotti et al.(1994)(34) USA
Seventeen preschoolchildren 2–4 years
Preschool children
Willett FFQPrevious 7 days intakeSelf-administeredsix frequency category
Three 24 h dietary recallsbefore FFQ.
Na The questionnaire did not providean accurate assessment ofmeasured intake and could notreplace the dietary recall.
Byers et al.(1993)(35) USA
Ninety-seven children aged6–10 years
Children
FFQPast 3 months intakeCompleted by the child’s parentInterviewer-administered. 111food items Frequency categoriesbased on Willett
BiomarkersSerum levels of vitaminsC, A and E
Vitamins C, A, E Children in the highest v. lowestfruit and vegetable intakequartiles had 31 % higher serumvitamin C. Parental reports ofyoung children’s diet using FFQmethods are accurate enough tobe useful in nutritional screening.
Lytle et al.(1993)(36) USA
Forty-nine children aged8 years old
Children
24 h dietary recallsadministered to the child, aidedby a previous day food record(listing) Interviewer-administered.3D food models and utensils.
Observed intakes(parents and trained staff)
Na The 24 h recall assisted by foodrecords is a valid method forassessing the dietary intake ofchildren as young as 8 years old.
Stein et al.(1992)(37) USA
224 preschool children(baseline aged44–60 months)
Preschool children
Willett semi-quantitative FFQPast 6 months intake. Completedby the child’s parent. Interviewer-administered. Mean of two FFQcompleted at 6 months intervals.Reference portion sizes adaptedfor children.
Four 24 h dietary recallsInterviewer-administeredbefore each FFQ 3D-foodmodels
Na, K, Ca Agreement between the twomethods in assigning individualsto energy-adjusted quintiles wasmoderate, as were correlationsbetween energy-adjusted intakes.
Jenner et al.(1989)(38)
Australia
225 children Aged11–12 years
Children
FFQ175 food items. Previous 7 daysintake. Meal-basedreporting. six frequencycategories. No portions on FFQ(average portions from recordsapplied). Administered separatelyto (i) children and (ii) parents. Asubset of the first 1–3 dietrecords were also used as analternative intake estimate.
Fourteen 24 h dietaryrecords Completed over3-month period after FFQ
K, Ca Poor agreement between the dietrecords and the FFQ completedeither by children or parents. Incontrast, agreement between thereference method and 1–3 dietrecords in the series wasrelatively good.
Rasanen L.(1979)(39)
Finland
741 children aged5–13 years
Preschool childrenChildrenAdolescents
Single 24 h dietary recallsInterviewer-administered Com-pleted by the child’s mothersIncluded supplements Portionsize in household measures
Diet historyPast 12 months intakeInterviewer-administered
Ca, Fe, vitamins A, C,thiamin, riboflavin, niacin
Neither of the methods can beconsidered suitable for themeasurement of an individualchild’s dietary intake.
24 HR, 24 h diet recalls; EPIC, european prospective investigation of cancer; WDR, weighed dietary record; EDR, estimated dietary record.
Micro
nu
trient
assessmen
td
urin
gch
ildh
oo
dS
93
British Journal of NutritionDownloaded from https://www.cambridge.org/core. IP address: 54.39.106.173, on 07 Jun 2020 at 02:39:42, subject to the Cambridge Core terms of use, available at https://www.cambridge.org/core/terms. https://doi.org/10.1017/S0007114509993163

Table 3. Validation studies in infants, children and adolescents: vitamins
Author/yearpublication/country/(quality index) n/age group
Methods/no FFQ items,portion sizes Correlation between methods/other statistics
Vitamin AAndersen et al.(2003)(2) Norway(4·5)
n 6412 monthsInfants
FFQ v. 7 d WDR140 items. HH
measures or foodphotographs
Absolute intakeCC 0·34
Median (P25–P75) (mg)FFQ 1358 (1008–3029)WDR 681 (490–834)***
Blum et al.(1999)(24) USA (2·5)
n 2331–5 yearsInfantsPreschool children
FFQ v. three 24 HReighty-four items.
CC 0·49 Mean (SD) (RE)24 HR 1035 (569)FFQ 1176 (449)
Andersen et al.(2004)(18,19)
Norway (5)
n 1872 years oldPreschool children
FFQ v. 7 d WDR125 items. HH
measures or foodphotographs
Absolute intakeCC 0·59***
Median (P25–P75) (mg)FFQ 1586 (1130–2230)WDR 694 (473–1027)***
Rasanen L.(1979)(39) Finland(5)
n 7415–13 yearsPreschool childrenChildrenAdolescents
24 HR v. DH CC 0·20 Mean DH: 1650; 24 HR: 1061
Byers et al.(1993)(35) USA (2·5)
n 976–10 yearsChildren
FFQ v. BM111 items
Crude 0·14Adjusted 0·17
Arnold et al.(1995)(31) Canada(3·5)
n 7077–12 yearsChildren
FFQ v. 14 d EDR160 items. Standard
reference portions
Pearson CC 0·49†
Bellu et al.(1995)(32) Italy (3·5)
n 889–12 yearsChildren
FFQ v. 7 d EDR116 items. Reference
portion sizes
Raw nutrient 0·06Nutrient density 0·13
Mean (SD)EDR 419 (740)FFQ 371 (157)
Rockett et al.(1997)(29) USA (3·5)
n 2619–18 yearsChildrenAdolescents
YAQ v. three 24 HR131 items. Standard
reference portions
9–13 years CC 0·3914–18 years CC 0·37
Mean (SD) (IU)24 HR 6755 (5023)YAQ 9228 (4317)
RetinolMarriott et al.(2008)(8) UK (3·5)
n 506 monthsInfants
FFQ v. 4 d WDRthirty-four items. HH
measures
Energy adjustedCC 0·76
Median (mg)FFQ 597WDR 531
Marriott et al.(2008)(9) UK (3·5)
n 5012 monthsInfants
FFQ v. 4 d WDRseventy-eight items.
HH measures
Energy adjustedCC 0·58
Median (mg)FFQ 559WDR 400
Parrish et al.(2003)(22) USA (3·5)
n 381–3 yearsInfantsPreschool children
FFQ v. BM 111 items.Standard referenceportions
CC 0·01
24 HR v. BM CC 0·35Holmes et al.(2008)(10) UK (3)
n 1242–17 yearsPreschool childrenChildrenAdolescents
24 HR v. 4 d WDR Males-Mean difference2–10 years 77 (P ¼ 0·058)11–17 years 65 (P ¼ 0·280)
Females-Mean difference2–10 years 155 (P ¼ 0·008)11–17 years 57 (P ¼ 0·633)
FC v. 4 d WDR Males-Mean difference2–10 years 68 (P ¼ 0·135)
Females-Mean difference2–10 years 75 (P ¼ 0·076)
A.
Ortiz-A
nd
rellucch
iet
al.
S9
4
British Journal of NutritionDownloaded from https://www.cambridge.org/core. IP address: 54.39.106.173, on 07 Jun 2020 at 02:39:42, subject to the Cambridge Core terms of use, available at https://www.cambridge.org/core/terms. https://doi.org/10.1017/S0007114509993163

Table 3. Continued
Author/yearpublication/country/(quality index) n/age group
Methods/no FFQ items,portion sizes Correlation between methods/other statistics
11–17 years 19 (P ¼ 0·808) 11–17 years 2 25 (P ¼ 0·851)SW v. 4 d WDR Males-Mean difference
2–10 years 2 4 (P ¼ 0·935)11–17 years 2 21(P ¼ 0·821)
Females-Mean difference2–10 years 44 (P ¼ 0·299)11–17 years 2 27 (P ¼ 0·826)
Arnold et al.(1995)(31) Canada(3·5)
n 7077–12 yearsChildren
FFQ v. 14 d EDR160 items. Standard
reference portions
Pearson CC 0·30
Lillegaard et al.(2007)(12) Norway(3·5)
n 1009 years oldChildren
PFD v. 4 d WDR277 items. HH
measures or colourphotographs
Boys-Median (P25– P75) (mg)PFD 854 (489, 1304)WDR 800 (498, 1173)CC 0·62***
Girls-Median (P25– P75) (mg)PFD 876 (636, 1323)WDR 695 (506, 987)CC 0·40**
Rockett et al.(1997)(29) USA (3·5)
n 2619–18 yearsChildrenAdolescents
YAQ v. three 24 HR131 items. Standard
reference portions
9–13 years CC 0·4414–18 years CC 0·51
Mean (SD) (IU)24 HR 2917 (2442)YAQ 3436 (2109)
Slater et al.(2003)(20) Brazil (4)
n 7914–18 yearsAdolescents
FFQ v. three 24 HR76 items. Single
reference portionsize listed
Non-adjusted 0·28*Energy adjusted 0·06Deattenuated 0·10
Mean (SD) (mg)24 HR 745 (831)FFQ 614 (243)
Andersen et al.(1995)(33) Norway(3)
n 49Adolescents
FFQ v. 7 d WDR190 items. HH
measures
Unadjusted 0·30Energy adjusted 0·39
Median FFQ: 1381 (mg)Median WDR: 787 (mg)
b-CaroteneParrish et al.(2003)(22) USA (3·5)
n 381–3 yearsInfantsPreschool children
FFQ v. BM111 items. Standard
reference portions
CC 0·13
Arnold et al.(1995)(31) Canada(3·5)
n 7077–12 yearsChildren
FFQ v. 14 d EDR160 items. Standard
reference portions
Pearson CC 0·53
Vitamin DMarriott et al.(2008)(8) UK (3·5)
n 506 monthsInfants
FFQ v. 4 d WDRthirty-four items. HH
measures
Energy adjustedCC 0·83
Median (mg)FFQ 9·3WDR 8·3
Marriott et al.(2008)(9) UK (3·5)
n 5012 monthsInfants
FFQ v. 4 d WDRseventy-eight items.
HH measures
Energy adjustedCC 0·40
Median (mg)FFQ 6·29WDR 1·54
Andersen et al.(2003)(2) Norway(4·5)
n 6412 monthsInfants
FFQ v. 7 d WDR140 items. HH
measures or foodphotographs
Absolute intakeCC 0·18
Median (P25–P75) (mg)FFQ 2·3 (1·1–4·2)WDR 1·1 (0·4–1·9)***
Marshall et al.(2003)(21) USA (4)
n 2406–12 months3–5 yearsInfantsPreschool children
FFQ v. 3 d WDRseven items.
Estimated usualserving size
6 monthsCC 0·80***Mean (SD) mgFFQ 6·4 (3·4)WDR 5·6 (2·8)
12 monthsCC 0·60***Mean (SD) mgFFQ 6·1 (3·3)WDR 5·6 (2·8)
3 yearsCC 0·74***Mean (SD) mgFFQ 3·2 (2·3)WDR 3·7 (2·3)
5 yearsCC 0·63***Mean (SD) mgFFQ 3·3 (2·1)WDR 3·4 (1·9)
Parrish et al.(2003)(22) USA (3·5)
n 681–3 years
FFQ v. BM111 items. Standard
CC 0·00
Micro
nu
trient
assessmen
td
urin
gch
ildh
oo
dS
95
British Journal of NutritionDownloaded from https://www.cambridge.org/core. IP address: 54.39.106.173, on 07 Jun 2020 at 02:39:42, subject to the Cambridge Core terms of use, available at https://www.cambridge.org/core/terms. https://doi.org/10.1017/S0007114509993163

Table 3. Continued
Author/yearpublication/country/(quality index) n/age group
Methods/no FFQ items,portion sizes Correlation between methods/other statistics
InfantsPreschool children
reference portions24 HR v. BM CC 0·17
Andersen et al.(2004)(18,19)
Norway (5)
n 1872 years oldPreschool children
FFQ v. 7 d WDR125 items. HH
measures or foodphotographs
Absolute intakeCC 0·48***
Median (P25–P75) (mg)FFQ 9·1 (5·8–13·7)WDR 3·9 (1·6–7·3)***
Lillegaard et al.(2007)(12) Norway(3·5)
n 1009 years oldChildren
PFD v. 4 d WDR277 items. HH
measures or colourphotographs
Boys-Median (P25– P75) (mg)PFD 3·0 (1·5, 6·2)WDR 2·1 (1·2, 3·7)CC 0·51***
Girls-Median (P25– P75) (mg)PFD 3·4 (2·0, 5·9)WDR 2·2 (1·5, 4·2)CC 0·52***
Andersen et al.(1995)(33) Norway(3)
n 49Adolescents
FFQ v. 7 d WDR190 items. HH
measures
Unadjusted 0·14Energy adjusted 0·21
Median FFQ: 4·9 (mg)Median WDR: 2·2 (mg)
Vitamin EMarriott et al.(2008)(8) UK (3·5)
n 506 monthsInfants
FFQ v. 4 d WDRthirty-four items. HH
measures
Energy adjustedCC 0·83
Median (mg)FFQ 6·0WDR 5·3
Marriott et al.(2008)(9) UK (3·5)
n 5012 monthsInfants
FFQ v. 4 d WDRseventy-eight items.
HH measures
Energy adjustedCC 0·27
Median (mg)FFQ 6·13WDR 4·11
Andersen et al.(2003)(2) Norway(4·5)
n 6412 monthsInfants
FFQ v. 7 d WDR140 items. HH
measures or foodphotographs
Absolute intakeCC 0·32
Median (P25–P75) (mg)FFQ 4·0 (3·1–5·6)WDR 2·9 (2·3–4·2)***
Parrish et al.(2003)(22) USA (3·5)
n 381–3 yearsInfantsPreschool children
FFQ v. BM111 items. Standard
reference portions
CC 0·48
24 HR v. BM CC 0·30
Blum et al.(1999)(24) USA (2·5)
n 2331–5 years InfantsPreschool children
FFQ v. three 24 HReighty-four items.
CC 0·56 Mean (SD) (mg)24 HR 8 (5)FFQ 10 (7)
Andersen et al.(2004)(18,19)
Norway (5)
n 1872 years oldPreschool children
FFQ v. 7 d WDR125 items. HH
measures or foodphotographs
Absolute intakeCC 0·48***
Median (P25–P75) (mg)FFQ 9·3 (6·2–12·7)WDR 4·7 (2·9–7·2)***
Byers et al.(1993)(35) USA (2·5)
n 976–10 yearsChildren
FFQ v. BM111 items
Crude 0·32Adjusted 0·32
Bellu et al.(1995)(32) Italy (3·5)
n 889–12 yearsChildren
FFQ v. 7 d EDR116 items. Reference
portion sizes
Raw nutrient 0·31Nutrient density 0·38
Mean (SD)EDR 0·67 (0·21)FFQ 0·57 (0·22)
Rockett et al.(1997)(29) USA (3·5)
n 2619–18 yearsChildren-Adolescents
YAQ v. 3–24 HR131 items. Standard
reference portions
9–13 years CC 0·5014–18 years CC 0·55
Mean (SD) (mg)24 HR 13 (22)YAQ 13 (11)
A.
Ortiz-A
nd
rellucch
iet
al.
S9
6
British Journal of NutritionDownloaded from https://www.cambridge.org/core. IP address: 54.39.106.173, on 07 Jun 2020 at 02:39:42, subject to the Cambridge Core terms of use, available at https://www.cambridge.org/core/terms. https://doi.org/10.1017/S0007114509993163

Table 3. Continued
Author/yearpublication/country/(quality index) n/age group
Methods/no FFQ items,portion sizes Correlation between methods/other statistics
ThiaminMarriott et al.(2008)(8) UK (3·5)
n 506 monthsInfants
FFQ v. 4 d WDRthirty-four items. HH
measures
Energy adjustedCC 0·89
Median (mg)FFQ 0·65WDR 0·60
Marriott et al.(2008)(9) UK (3·5)
n 5012 monthsInfants
FFQ v. 4 d WDRseventy-eight items.
HH measures
Energy adjustedCC 0·53
Median (mg)FFQ 0·96WDR 0·75
Andersen et al.(2003)(2) Norway(4·5)
n 6412 monthsInfants
FFQ v. 7 d WDR140 items. HH
measures or foodphotographs
Absolute intakeCC 0·41
Median (P25–P75) (mg)FFQ 0·7 (0·59–0·88)WDR 0·56 (0·44–0·61)***
Blum et al.(1999)(24) USA (2·5)
n 2331–5 yearsInfantsPreschool children
FFQ v. three 24 HReighty-four items.
CC 0·57 Mean (SD) (mg)24 HR 2 (1)FFQ 2 (1)
Andersen et al.(2004)(18,19)
Norway (5)
n 1872 years oldPreschool children
FFQ v. 7 d WDR125 items. HH
measures or foodphotographs
Absolute intakeCC 0·52***
Median (P25–P75) (mg)FFQ 1·12 (0·86–1·64)WDR 0·66 (0·55–0·91)***
Holmes et al.(2008)(10) UK (3)
n 1242–17 yearsPreschool childrenChildrenAdolescents
24 HR v. 4 d WDR Males-Mean difference2–10 years 2 0·1 (P ¼ 0·480)11–17 years 0·4 (P ¼ 0·142)
Females-Mean difference2–10 years 0·2 (P ¼ 0·024)11–17 years 0·1 (P ¼ 0·041)
FC v. 4 d WDR Males-Mean difference2–10 years 2 0·2 (P ¼ 0·574)11–17 years 0·2 (P ¼ 0·433)
Females-Mean difference2–10 years 0·3 (P ¼ 0·000)11–17 years 0·2 (P ¼ 0·063)
SW v. 4 d WDR Males-Mean difference2–10 years 2 0·8 (P ¼ 0·243)11–17 years 2 0·1 (P ¼ 0·393)
Females-Mean difference2–10 years 0·0 (P ¼ 0·575)11–17 years 0·1 (P ¼ 0·658)
Rasanen L.(1979)(39) Finland(5)
n 7415 2 13 yearsPreschool childrenChildrenAdolescents
24 HR v. DH CC 0·46 Mean DH: 1·9; 24 HR: 1·3
Arnold et al.(1995)(31) Canada(3·5)
n 7077–12 yearsChildren
FFQ v. 14 d EDR160 items. Standard
reference portions
Pearson CC 0·35†
Lillegaard et al.(2007)(12) Norway(3·5)
n 1009 years oldChildren
PFD v. 4 d WDR277 items. HH
measures or colourphotographs
Boys- Median (P25– P75) (mg)PFD 1·1 (0·9, 1·4)WDR 1·1 (0·9, 1·4)CC 0·53***
Girls-Median (P25–P75) (mg)PFD 1·1 (0·9, 1·5)WDR 1·0 (0·8, 1·2)CC 0·40**
Bellu et al.(1995)(32) Italy (3·5)
n 889–12 yearsChildren
FFQ v. 7 d EDR116 items. Reference
portion sizes
Raw nutrient 0·24Nutrient density 0·27
Mean (SD)EDR 0·61 (0·78)FFQ 1·41 (0·78)
Rockett et al.(1997)(29) USA (3·5)
n 2619–18 yearsChildrenAdolescents
YAQ v. three 24 HR131 items. Standard
reference portions
9–13 years CC 0·4914–18 years CC 0·54
Mean (SD) (mg)24 HR 2·3 (1·8)YAQ 2·0 (0·8)
Micro
nu
trient
assessmen
td
urin
gch
ildh
oo
dS
97
British Journal of NutritionDownloaded from https://www.cambridge.org/core. IP address: 54.39.106.173, on 07 Jun 2020 at 02:39:42, subject to the Cambridge Core terms of use, available at https://www.cambridge.org/core/terms. https://doi.org/10.1017/S0007114509993163

Table 3. Continued
Author/yearpublication/country/(quality index) n/age group
Methods/no FFQ items,portion sizes Correlation between methods/other statistics
Andersen et al.(1995)(33) Norway(3)
n 49Adolescents
FFQ v. 7 d WDR190 items. HH
measures
Unadjusted 0·53Energy adjusted 0·53
Median FFQ: 1·58 (mg)Median WDR: 1·14 (mg)
RiboflavinMarriott et al.(2008)(8) UK (3·5)
n 506 monthsInfants
FFQ v. 4 d WDRthirty-four items. HH
measures
Energy adjustedCC 0·87
Median (mg)FFQ 1·2WDR 1·2
Marriott et al.(2008)(9) UK (3·5)
n 5012 monthsInfants
FFQ v. 4 d WDRseventy-eight items.
HH measures
Energy adjustedCC 0·51
Median (mg)FFQ 1·70WDR 1·43
Andersen et al.(2003)(2) Norway(4·5)
n 6412 monthsInfants
FFQ v. 7 d WDR140 items. HH
measures or foodphotographs
Absolute intakeCC 0·58
Median (P25–P75) (mg)FFQ 1·02 (0·72–1·34)WDR 0·78 (0·58–1·02)***
Blum et al.(1999)(24) USA (2·5)
n 2331–5 yearsInfantsPreschool children
FFQ v. three 24 HReighty-four items.
CC 0·56 Mean (SD) (mg)24 HR 2 (1)FFQ 3 (1)
Andersen et al.(2004)(18,19)
Norway (5)
n 1872 years oldPreschool children
FFQ v. 7 d WDR125 items. HH
measures or foodphotographs
Absolute intakeCC 0·51***
Median (P25–P75) (mg)FFQ 1·63 (1·24–2·24)WDR 1·06 (0·84–1·33)***
Rasanen L.(1979)(39) Finland(5)
n 7415–13 yearsPreschool childrenChildrenAdolescents
24 HR v. DH CC 0·42 Mean DH: 3·3; 24 HR: 2·3
Arnold et al.(1995)(31) Canada(3·5)
n 7077–12 yearsChildren
FFQ v. 14 d EDR160 items. Standard
reference portions
Pearson CC 0·36†
Lillegaard et al.(2007)(12) Norway(3·5)
n 1009 years oldChildren
PFD v. 4 d WDR277 items. HH
measures or colourphotographs
Boys- Median (P25– P75) (mg)PFD 1·5 (1·1, 2·0)WDR 1·3 (1·1, 1·8)CC 0·56***
Girls-Median (P25– P75) (mg)PFD 1·4 (1·1, 1·9)WDR 1·2 (0·9, 1·6)CC 0·56***
Bellu et al.(1995)(32) Italy (3·5)
n 889–12 yearsChildren
FFQ v. 7 d EDR116 items. Reference
portion sizes
Raw nutrient 0·26Nutrient density 0·22
Mean (SD)EDR 0·64 (0·16)FFQ 0·64 (0·11)
Rockett et al.(1997)(29) USA (3·5)
n 2619–18 yearsChildrenAdolescents
YAQ v. three 24 HR131 items. Standard
reference portions
9–13 years CC 0·5014–18 years CC 0·62
Mean (SD) (mg)24 HR 2·7 (1·5)YAQ 2·7 (1·0)
Andersen et al.(1995)(33) Norway(3)
n 49Adolescents
FFQ v. 7 d WDR190 items. HH
measures
Unadjusted 0·57Energy adjusted 0·65
Median FFQ: 2·01 (mg)Median WDR: 1·47 (mg)
NiacinMarriott et al.(2008)(8) UK (3·5)
n 506 monthsInfants
FFQ v. 4 d WDRthirty-four items.HH measures
Energy adjustedCC 0·88
Median (mg)FFQ 8·1WDR 8·0
A.
Ortiz-A
nd
rellucch
iet
al.
S9
8
British Journal of NutritionDownloaded from https://www.cambridge.org/core. IP address: 54.39.106.173, on 07 Jun 2020 at 02:39:42, subject to the Cambridge Core terms of use, available at https://www.cambridge.org/core/terms. https://doi.org/10.1017/S0007114509993163

Table 3. Continued
Author/yearpublication/country/(quality index) n/age group
Methods/no FFQ items,portion sizes Correlation between methods/other statistics
Marriott et al.(2008)(9) UK (3·5)
n 5012 monthsInfants
FFQ v. 4 d WDRseventy-eight items.
HH measures
Energy adjustedCC 0·60
Median (mg)FFQ 10·52WDR 7·48
Blum et al.(1999)(24) USA (2·5)
n 2331–5 yearsInfantsPreschool children
FFQ v. three 24 HR84 items.
CC 0·55 Mean (SD) (mg)24 HR 19 (8)FFQ 21 (8)
Rasanen L.(1979)(39) Finland(5)
n 7415–13 yearsPreschool childrenChildrenAdolescents
24 HR v. DH CC 0·36 Mean DH: 16·2; 24 HR: 11·2
Rockett et al.(1997)(29) USA (3·5)
n 2619–18 yearsChildrenAdolescents
YAQ v. three 24 HR131 items. Standard
reference portions
9–13 years CC 0·4514–18 years CC 0·50
Mean (SD) (mg)24 HR 26 (15)YAQ 25 (10)
Vitamin B6
Marriott et al.(2008)(8) UK (3·5)
n 506 monthsInfants
FFQ v. 4 d WDRthirty-four items. HH
measures
Energy adjustedCC 0·84
Median (mg)FFQ 0·60WDR 0·60
Marriott et al.(2008)(9) UK (3·5)
n 5012 monthsInfants
FFQ v. 4 d WDRseventy-eight items.
HH measures
Energy adjustedCC 0·54
Median (mg)FFQ 1·09WDR 0·81
Blum et al.(1999)(24) USA (2·5)
n 2331–5 yearsInfantsPreschool children
FFQ v. three 24 HReighty-four items.
CC 0·58 Mean (SD) (mg)24 HR 2 (1)FFQ 2 (1)
Bellu et al.(1995)(32) Italy (3·5)
n 889–12 yearsChildren
FFQ v. 7 d EDR116 items. Reference
portion sizes
Raw nutrient 0·17Nutrient density 0·26
Mean (SD)EDR 0·28 (0·09)FFQ 0·25 (0·1)
Rockett et al.(1997)(29) USA (3·5)
n 2619–18 yearsChildren Adolescents
YAQ v. 3–24 HR131 items. Standard
reference portions
9–13 years CC 0·5114–18 years CC 0·55
Mean (SD) (mg)24 HR 2·2 (1·5)YAQ 2·2 (1·0)
Vitamin B12
Marriott et al.(2008)(8) UK (3·5)
n 506 monthsInfants
FFQ v. 4 d WDRthirty-four items. HH
measures
Energy adjustedCC 0·74
Median (mg)FFQ 1·8WDR 1·8
Marriott et al.(2008)(9) UK (3·5)
n 5012 monthsInfants
FFQ v. 4 d WDRseventy-eight items.
HH measures
Energy adjustedCC 0·24
Median (mg)FFQ 3·08WDR 2·8
Blum et al.(1999)(24) USA (2·5)
n 2331–5 yearsInfantsPreschool children
FFQ v. 3–24 HReighty-four items.
CC 0·47 Mean (SD) (mg)24 HR 5 (3)FFQ 6 (2)
Rockett et al.(1997)(29) USA (3·5)
n 2619–18 yearsChildrenAdolescents
YAQ v. three 24 HR131 items. Standard
reference portions
9–13 years CC 0·4014–18 years CC 0·38
Mean (SD) (mg)24 HR 5·7 (4·7)YAQ 7·6 (3·8)
Green et al. n 105 FFQ v. 3 d WDR Food only Food þ supplements
Micro
nu
trient
assessmen
td
urin
gch
ildh
oo
dS
99
British Journal of NutritionDownloaded from https://www.cambridge.org/core. IP address: 54.39.106.173, on 07 Jun 2020 at 02:39:42, subject to the Cambridge Core terms of use, available at https://www.cambridge.org/core/terms. https://doi.org/10.1017/S0007114509993163

Table 3. Continued
Author/yearpublication/country/(quality index) n/age group
Methods/no FFQ items,portion sizes Correlation between methods/other statistics
(1998)(28) Canada(4·5)
16–19 yearsAdolescents
116 items. HHmeasures
Median (1st – 3rd quartile)(mg)FFQ 4·4 (3·4, 7·0)WDR 1·7 (0·7, 2·4)
Median (1st – 3rd quartile) (m)FFQ 4·9 (3·6, 10)WDR 1·9 (1·0, 3·7)
FFQ v. BM CC 0·19 CC 0·253 d WDR v. BM CC 0·38 CC 0·32
FolateBlum et al.(1999)(24) USA (2·5)
n 2331–5 yearsInfantsPreschool children
FFQ v. three 24 HReighty-four items.
CC 0·55 Mean (SD) (mg)24 HR 274 (133)FFQ 307 (147)
Rockett et al.(1997)(29) USA (3·5)
n 2619–18 yearsChildrenAdolescents
YAQ v. three 24 HR131 items. Standard
reference portions
9–13 years CC 0·5314–18 years CC 0·63
Mean (SD) (mg)24 HR 373 (216)YAQ 382 (187)
Green et al.(1998)(28) Canada(4·5)
n 10516–19 yearsAdolescents
FFQ v. 3 d WDR116 items. HH
measures
Food onlyMedian (1st–3rd quartile)(mg)FFQ 289 (218, 400)WDR 187 (0·7, 2·4)
Food þ supplementsMedian (1st–3rd quartile) (mg)FFQ 346 (229, 494)WDR 212 (155, 301)
FFQ v. BM CC 0·38 CC 0·483 d WDR v. BM CC 0·46 CC 0·65
Vitamin CMarriott et al.(2008)(8) UK (3·5)
n 506 monthsInfants
FFQ v. 4 d WDRthirty-four items. HH
measures
Energy adjustedCC 0·67
Median (mg)FFQ 86WDR 78
Marriott et al.(2008)(9) UK (3·5)
n 5012 monthsInfants
FFQ v. 4 d WDRseventy-eight items.
HH measures
Energy adjustedCC 0·47
Median (mg)FFQ 79·6WDR 42·3
Williams & Innis(2005)(17) Canada(5)
n 1488–26 monthsInfants
FFQ v. 3 d EDR191 items
CC 0·64 Median (mg)FFQ 74EDR 77·5
Andersen et al.(2003)(2) Norway(4·5)
n 6412 monthsInfants
FFQ v. 7 d WDR140 items. HH
measures or foodphotographs
Absolute intakeCC 0·41
Median (P25–P75) (mg)FFQ 88 (55–118)WDR 51 (33–77)***
Blum et al.(1999)(24) USA (2·5)
n 2331–5 yearsInfantsPreschool children
FFQ v. three 24 HReighty-four items.
CC 0·58 Mean (SD) (mg)24 HR 117 (66)FFQ 114 (49)
Parrish et al.(2003)(22) USA (3·5)
n 381–3 yearsInfantsPreschool children
FFQ v. BM111 items. Standard
reference portions
CC 0·51
24 HR v. BM CC 0·16Andersen et al.(2004)(18,19) Norway(5)
n 1872 years oldPreschool children
FFQ v. 7 d WDR125 items. HH
measures or foodphotographs
Absolute intakeCC 0·43***
Median (P25–P75) (mg)FFQ 88 (62–119)WDR 60 (42–79)***
Holmes et al.(2008)(10) UK (3)
n 1242–17 years
24 HR v. 4 d WDR Males-Mean difference2–10 years 16 (P ¼ 0·042)
Females-Mean difference2–10 years 28 (P ¼ 0·009)
A.
Ortiz-A
nd
rellucch
iet
al.
S1
00
British Journal of NutritionDownloaded from https://www.cambridge.org/core. IP address: 54.39.106.173, on 07 Jun 2020 at 02:39:42, subject to the Cambridge Core terms of use, available at https://www.cambridge.org/core/terms. https://doi.org/10.1017/S0007114509993163

Table 3. Continued
Author/yearpublication/country/(quality index) n/age group
Methods/no FFQ items,portion sizes Correlation between methods/other statistics
Preschool childrenChildrenAdolescents
11–17 years 4 (P ¼ 0·656) 11–17 years 15 (P ¼ 0·207)
FC v. 4 d WDR Males-Mean difference2–10 years 33 (P ¼ 0·002)11–17 years 18 (P ¼ 0·231)
Females-Mean difference2–10 years 43 (P ¼ 0·001)11–17 years 24 (P ¼ 0·325)
SW v. 4 d WDR Males-Mean difference2–10 years 6 (P ¼ 0·472)11–17 years 2 7 (P ¼ 0·676)
Females-Mean difference2–10 years 7 (P ¼ 0·639)11–17 years 2 31 (P ¼ 0·017)
Rasanen L.(1979)(39) Finland(5)
n 7415–13 yearsPreschool childrenChildrenAdolescents
24 HR v. DH CC 0·21 Mean DH: 113; 24 HR: 85
Byers et al.(1993)(35) USA (2·5)
n 976–10 yearsChildren
FFQ v. BM111 items
Crude 0·39Adjusted 0·37
Arnold et al.(1995)(31) Canada(3·5)
n 7077–12 yearsChildren
FFQ v. 14 d EDR160 items. Standard
reference portions
Pearson CC 0·57†
Lillegaard et al.(2007)(12) Norway(3·5)
n 1009 years oldChildren
PFD v. 4 d WDR277 items. HH
measures or colourphotographs
Boys-Median (P25–P75) (mg)PFD 86 (53, 123)WDR 80 (54, 113)CC 0·40**
Girls-Median (P25–P75) (mg)PFD 87 (66, 104)WDR 63 (38, 96)CC 0·42***
Bellu et al.(1995)(32) Italy (3·5)
n 889–12 yearsChildren
FFQ v. 7 d EDR116 items. Reference
portion sizes
Raw nutrient 0·45Nutrient density 0·53
Mean (SD)EDR 34·6 (22·2)FFQ 52·6 (26·7)
Field et al.(1998)(25) USA (4)
n 109Students from fourth
to seventh gradeChildren
FFQ v. four 24 HRninety-seven items.
Standard referenceportions.
Fourth and fifth gradesCrude 0·19Deattenuated 0·32
Sixth and seventh gradesCrude 0·50Deattenuated 0·76
Rockett et al.(1997)(29) USA (3·5)
n 2619–18 yearsChildrenAdolescents
YAQ v. three 24 HR131 items. Standard
reference portions
9–13 years CC 0·6114–18 years CC 0·45
Mean (SD) (mg)24 HR 166 (164)YAQ 161 (80)
Slater et al.(2003)(20) Brazil (4)
n 7914–18 yearsAdolescents
FFQ v. three 24 HRseventy-six items.
Reference portionsize
Non-adjusted 0·42**Energy adjusted 0·47**Deattenuated 0·91
Mean (SD) (mg)24 HR 69·8 (86·5)FFQ 79·9 (41·6)
Andersen et al.(1995)(33) Norway(3)
n 49Adolescents
FFQ v. 7 d WDR190 items. HH
measures
Unadjusted 0·34Energy adjusted 0·37
Median FFQ: 123 (mg)Median WDR: 72 (mg)
WDR, weighed dietary record; CC, correlation coefficient; 24 HR, 24 h recall; RE, retinol equivalent; DH, diet history; BM, biomarker; EDR, estimated dietary record; YAQ, Youth/Adolescent Questionnaire; FC, food checklist; SW,semi-weighed method; SAW, Self-administered workbook; PFD, pre-coded food diary; HH measures, household measures.
Mean values were significantly different: *P,0·05; **P,0·01; *** P,0·001.† Excluding vitamin supplementation.
Micro
nu
trient
assessmen
td
urin
gch
ildh
oo
dS
10
1
British Journal of NutritionDownloaded from https://www.cambridge.org/core. IP address: 54.39.106.173, on 07 Jun 2020 at 02:39:42, subject to the Cambridge Core terms of use, available at https://www.cambridge.org/core/terms. https://doi.org/10.1017/S0007114509993163
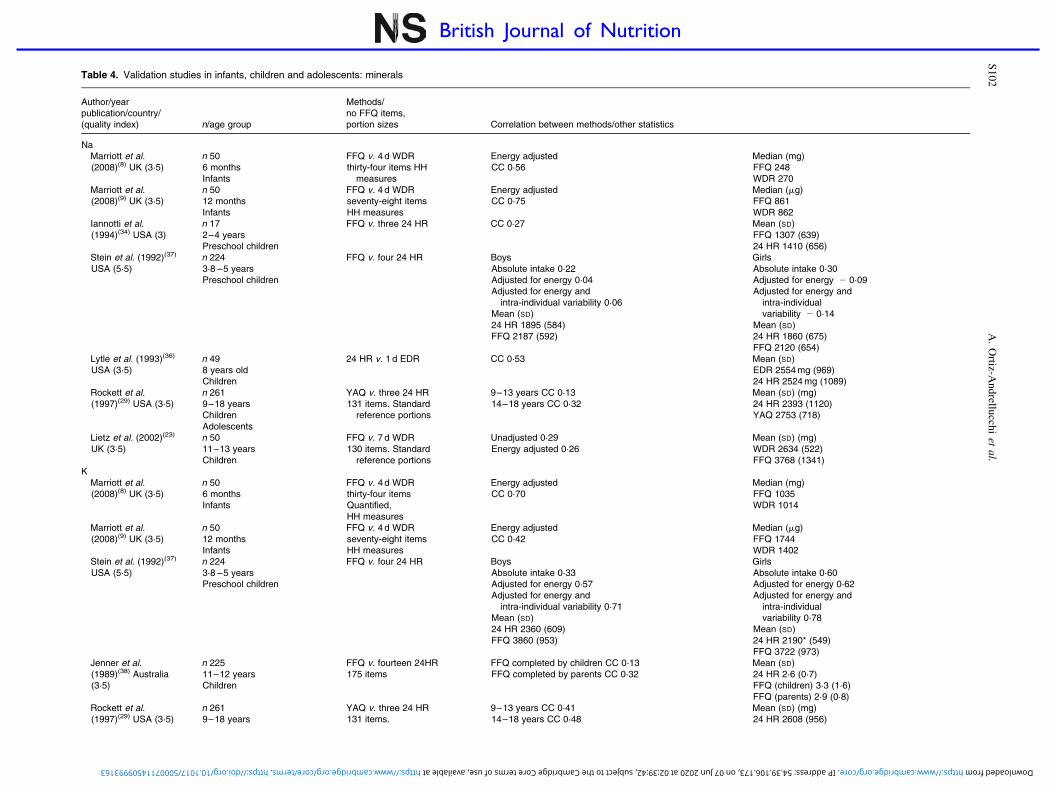
Table 4. Validation studies in infants, children and adolescents: minerals
Author/yearpublication/country/(quality index) n/age group
Methods/no FFQ items,portion sizes Correlation between methods/other statistics
NaMarriott et al.(2008)(8) UK (3·5)
n 506 monthsInfants
FFQ v. 4 d WDRthirty-four items HH
measures
Energy adjustedCC 0·56
Median (mg)FFQ 248WDR 270
Marriott et al.(2008)(9) UK (3·5)
n 5012 monthsInfants
FFQ v. 4 d WDRseventy-eight itemsHH measures
Energy adjustedCC 0·75
Median (mg)FFQ 861WDR 862
Iannotti et al.(1994)(34) USA (3)
n 172–4 yearsPreschool children
FFQ v. three 24 HR CC 0·27 Mean (SD)FFQ 1307 (639)24 HR 1410 (656)
Stein et al. (1992)(37)
USA (5·5)n 2243·8 –5 yearsPreschool children
FFQ v. four 24 HR BoysAbsolute intake 0·22Adjusted for energy 0·04Adjusted for energy and
intra-individual variability 0·06Mean (SD)24 HR 1895 (584)FFQ 2187 (592)
GirlsAbsolute intake 0·30Adjusted for energy 2 0·09Adjusted for energy and
intra-individualvariability 2 0·14
Mean (SD)24 HR 1860 (675)FFQ 2120 (654)
Lytle et al. (1993)(36)
USA (3·5)n 498 years oldChildren
24 HR v. 1 d EDR CC 0·53 Mean (SD)EDR 2554 mg (969)24 HR 2524 mg (1089)
Rockett et al.(1997)(29) USA (3·5)
n 2619–18 yearsChildrenAdolescents
YAQ v. three 24 HR131 items. Standard
reference portions
9–13 years CC 0·1314–18 years CC 0·32
Mean (SD) (mg)24 HR 2393 (1120)YAQ 2753 (718)
Lietz et al. (2002)(23)
UK (3·5)n 5011–13 yearsChildren
FFQ v. 7 d WDR130 items. Standard
reference portions
Unadjusted 0·29Energy adjusted 0·26
Mean (SD) (mg)WDR 2634 (522)FFQ 3768 (1341)
KMarriott et al.(2008)(8) UK (3·5)
n 506 monthsInfants
FFQ v. 4 d WDRthirty-four itemsQuantified,HH measures
Energy adjustedCC 0·70
Median (mg)FFQ 1035WDR 1014
Marriott et al.(2008)(9) UK (3·5)
n 5012 monthsInfants
FFQ v. 4 d WDRseventy-eight itemsHH measures
Energy adjustedCC 0·42
Median (mg)FFQ 1744WDR 1402
Stein et al. (1992)(37)
USA (5·5)n 2243·8 –5 yearsPreschool children
FFQ v. four 24 HR BoysAbsolute intake 0·33Adjusted for energy 0·57Adjusted for energy and
intra-individual variability 0·71Mean (SD)24 HR 2360 (609)FFQ 3860 (953)
GirlsAbsolute intake 0·60Adjusted for energy 0·62Adjusted for energy and
intra-individualvariability 0·78
Mean (SD)24 HR 2190* (549)FFQ 3722 (973)
Jenner et al.(1989)(38) Australia(3·5)
n 22511–12 yearsChildren
FFQ v. fourteen 24HR175 items
FFQ completed by children CC 0·13FFQ completed by parents CC 0·32
Mean (SD)24 HR 2·6 (0·7)FFQ (children) 3·3 (1·6)FFQ (parents) 2·9 (0·8)
Rockett et al.(1997)(29) USA (3·5)
n 2619–18 years
YAQ v. three 24 HR131 items.
9–13 years CC 0·4114–18 years CC 0·48
Mean (SD) (mg)24 HR 2608 (956)
A.
Ortiz-A
nd
rellucch
iet
al.
S1
02
British Journal of NutritionDownloaded from https://www.cambridge.org/core. IP address: 54.39.106.173, on 07 Jun 2020 at 02:39:42, subject to the Cambridge Core terms of use, available at https://www.cambridge.org/core/terms. https://doi.org/10.1017/S0007114509993163

Table 4. Continued
Author/yearpublication/country/(quality index) n/age group
Methods/no FFQ items,portion sizes Correlation between methods/other statistics
ChildrenAdolescents
Standard reference portions YAQ 2772 (859)
Lietz et al. (2002)(23)
UK (3·5)n 5011–13 yearsChildren
FFQ v. 7 d WDR130 items.Standard reference portions
Unadjusted 0·27Energy adjusted 0·60**
Mean (SD)WDR 2347 (619)FFQ 3660 (1288)
7 d WDR v. BM CC 0·78***FFQ v. BM CC 0·04
CaMarriott et al.(2008)(8) UK (3·5)
n 506 monthsInfants
FFQ v. 4 d WDRthirty-four itemsHH measures
Energy adjustedCC 0·78
Median (mg)FFQ 547WDR 543
Marriott et al.(2008)(9) UK (3·5)
n 5012 monthsInfants
FFQ v. 4 d WDRseventy-eight itemsHH measures
Energy adjustedCC 0·61
Median (mg)FFQ 877WDR 784
Williams & Innis(2005)(17) Canada(5)
n 1488–26 monthsInfants
FFQ v. 3 d EDR191 items
CC 0·75 Median (mg)FFQ 861EDR 691
Andersen et al.(2003)(2) Norway(4·5)
n 6412 monthsInfants
FFQ v. 7 d WDR140 items. HH measures or
food photographs
Absolute intakeCC 0·62
Median (P25–P75) (mg)FFQ 584 (377–773)WDR 527 (329–734)
Marshall et al.(2003)(21) USA (4)
n 2406–12 months3–5 yearsInfantsPreschool children
FFQ v. 3 d WDRseven items. Estimated
usual serving size
6 monthsCC 0·64***Mean (SD) mgFFQ 409 (153)WDR 380(137)
12 monthsCC 0·67***Mean (SD) mgFFQ 608 (378)WDR 601(340)
3 yearsCC 0·74***Mean (SD) mgFFQ 383 (269)WDR 449(269)
5 yearsCC 0·64***Mean (SD) mgFFQ 393 (245)WDR 406 (222)
Blum et al. (1999)(24)
USA (2·5)n 2331–5 yearsInfantsPreschool children
FFQ v. three 24 HReighty-four items
CC 0·60 Mean (SD) (mg)24 HR 1016 (328)FFQ 1087 (319)
Andersen et al.(2004)(18,19) Norway(5)
n 1872 years oldPreschool children
FFQ v. 7 d WDR125 items. HH measures
or food photographs
Absolute intakeCC 0·38***
Median (P25–P75) (mg)FFQ 689 (559–872)WDR 520 (106–649)***
Huybrechts et al.(2006)(15) Belgium(3·5)
n 5092·5–6·5 yearsPreschool children
FFQ v. 3 d EDRforty-seven items. Portion
size alternatives included.
CC 0·52 Mean (SD)EDR 838 (305)FFQ 777 (296)
Stein et al. (1992)(37)
USA (5·5)n 2243·8–5 yearsPreschool children
FFQ v. four 24 HR BoysAbsolute intake 0·50Adjusted for energy 0·54Adjusted for energy and
intra-individual variability 0·65Mean (SD)24 HR 880 (283)FFQ 1418 (404)
GirlsAbsolute intake 0·50Adjusted for energy 0·47Adjusted for energy and
intra-individualvariability 0·57
Mean (SD)24 HR 816 (248)FFQ 1351 (369)
Holmes et al.(2008)(10) UK (3)
n 1242–17 yearsPreschool childrenChildrenAdolescents
24 HR v. 4 d WDR Males-Mean difference2–10 years 15 (P ¼ 0·751)11–17 years 142 (P ¼ 0·012)
Females-Mean difference2–10 years 133 (P ¼ 0·001)11–17 years 39 (P ¼ 0·522)
FC v. 4 d WDR Males-Mean difference2–10 years 60 (P ¼ 0·248)11–17 years 39 (P ¼ 0·480)
Females-Mean difference2–10 years 89 (P ¼ 0·007)11–17 years 77 (P ¼ 0·205)
Micro
nu
trient
assessmen
td
urin
gch
ildh
oo
dS
10
3
British Journal of NutritionDownloaded from https://www.cambridge.org/core. IP address: 54.39.106.173, on 07 Jun 2020 at 02:39:42, subject to the Cambridge Core terms of use, available at https://www.cambridge.org/core/terms. https://doi.org/10.1017/S0007114509993163

Table 4. Continued
Author/yearpublication/country/(quality index) n/age group
Methods/no FFQ items,portion sizes Correlation between methods/other statistics
SW v. 4 d WDR Males-Mean difference2–10 years 2 77 (P ¼ 0·245)11–17 years 48 (P ¼ 0·480)
Females-Mean difference2–10 years 38 (P ¼ 0·452)11–17 years 43 (P ¼ 0·613)
Taylor & Goulding(1998)(26) NewZealand (2·5)
n 673–6 yearsPreschool childrenChildren
FFQ v. 4 d EDRthirty-five items.
CC 0·52 Mean (SD)EDR 798 mg (271)FFQ 942 mg (419)
Rasanen L.(1979)(39) Finland(5)
n 7415–13 yearsPreschool childrenChildrenAdolescents
24 HR v. DH CC 0·47 Mean DH: 1369; 24 HR: 1034
Bellu et al. (1996)(30)
Italy (3)n 3338–10 yearsChildren
FFQ v. 24 HR116 items.
Girls Mean (SD)24 HR 441 (179)FFQ 445 (125)
Boys Mean (SD)24 HR 453 (203)FFQ 435 (140)
Lillegaard et al.(2007)(12) Norway(3·5)
n 1009 years oldChildren
PFD v. 4 d WDR277 items. HH measures
or colour photographs
Boys-Median (P25–P75) (mg)PFD 715 (581–1036)WDR 712 (578–917)CC 0·49***
Girls-Median (P25–P75) (mg)PFD 740 (572–962)WDR 630 (473–877)CC 0·56***
Bellu et al. (1995)(32)
Italy (3·5)n 889–12 yearsChildren
FFQ v. 7 d EDR116 items. Reference
portion sizes
Raw nutrient 0·32Nutrient density 0·42
Mean (SD)EDR 377 (106)FFQ 370 (69)
Magkos et al.(2006)(13) Greece(3)
n 351Mean age 11·9 yearsChildren
FFQ v. 24 HRthirty items. Standard
reference portions
CC 0·63*** Mean (SD) mg/dFFQ 728 (361)24 HR 861(415)
Jenner et al.(1989)(38) Australia(3·5)
n 22511–12 yearsChildren
FFQ v. fourteen 24 HR175 items
FFQ completed bychildren CC 0·20
FFQ completed byparents CC 0·31
Mean (SD)24 HR 0·8 (0·3)FFQ (children) 1·2 (0·6)FFQ (parents) 1·0 (0·4)
Field et al. (1998)(25)
USA (4)n 109Students from fourth to
seventh gradeChildren
FFQ v. four 24 HRninety-seven items.
Standard referenceportions used.
Fourth and fifthgrades Crude 0·27
Deattenuated 0·39
Sixth and seventh gradesCrude 0·32
Deattenuated 0·47
Bertoli et al.(2005)(16) Italy (4)
n 376–10 years 16–20 yearsChildrenAdolescents
FFQ v. 7 d WDR136 items Portion size
estimated using colourphotographs
Young adults CC 0·5Children CC 0·60
Young adultsMean (SD)FFQ 1073 (356)WDR 726 (228)
ChildrenMean (SD)FFQ 1039 (372)WDR 691 (254)
Moore et al.(2007)(11) Canada(4·5)
n 1629–16 yearsChildrenAdolescents
FFQ v. 24 HRthirty-two items. Visual aids
to approximate portionsize
9–12 years ICC 0·4614–16 years ICC 0·43
9–12 years MeanFFQ 157624 HR 1003
14–16 yearsMeanFFQ 187324 HR 1159
Rockett et al.(1997)(29) USA (3·5)
n 2619–18 yearsChildrenAdolescents
YAQ v. three 24 HR131 items. Standard
reference portions
9–13 years CC 0·5214–18 years CC 0·57
Mean (SD) (mg)24 HR 1093 (454)YAQ 1159 (417)
Lietz et al. (2002)(23)
UK (3·5)n 5011–13 yearsChildren
FFQ v. 7 d WDR130 items. Standard
reference portions
Unadjusted 0·34*Energy adjusted 0·47**
Mean and (SD) (mg)WDR 813 (218)FFQ 1016 (273)
Harnack et al.(2006)(14) USA (2·5)
n 24811–14 yearsChildrenAdolescents
FFQ v. three 24 HRten items. Portion size
alternatives included
11–12 years ICC 0·5913–14 years ICC 0·33
11–12 yearsMean (DS)FFQ 85524 HR 1008
13–14 yearsMean (SD)FFQ 85624 HR 984
A.
Ortiz-A
nd
rellucch
iet
al.
S1
04
British Journal of NutritionDownloaded from https://www.cambridge.org/core. IP address: 54.39.106.173, on 07 Jun 2020 at 02:39:42, subject to the Cambridge Core terms of use, available at https://www.cambridge.org/core/terms. https://doi.org/10.1017/S0007114509993163

Table 4. Continued
Author/yearpublication/country/(quality index) n/age group
Methods/no FFQ items,portion sizes Correlation between methods/other statistics
Mølgaard et al.(1998)(27) Denmark(2)
n 2313–14 yearsAdolescents
FFQ v. 3 d WDReighty-eight itemsHH measures
CC 0·62 Median (P25–P75) (mg)FFQ 1102 (931–1339)WDR 924 (727–1145)
Slater et al.(2003)(20) Brazil (4)
n 7914–18 yearsAdolescents
FFQ v. three 24 HRseventy-six items.Reference portion size
listed.
Non-adjusted 0·61**Energy adjusted 0·51**Deattenuated 0·70
Mean (SD) (mg)24 HR 584 (384)FFQ 561 (223)
Andersen et al.(1995)(33) Norway(3)
n 49Adolescents
FFQ v. 7 d WDR190 itemsHH measures
Unadjusted 0·54Energy adjusted 0·54
Median FFQ: 1178 (mg)Median WDR: 936 (mg)
MgMarriott et al.(2008)(8) UK (3·5)
n 506 monthsInfants
FFQ v. 4 d WDRthirty-four itemsHH measures
Energy adjustedCC 0·68
Median (mg)FFQ 86·7WDR 78·7
Marriott et al.(2008)(9) UK (3·5)
n 5012 monthsInfants
FFQ v. 4 d WDRseventy-eight itemsHH measures
Energy adjustedCC 0·57
Median (mg)FFQ 142WDR 129
Blum et al. (1999)(24)
USA (2·5)n 2331–5 yearsInfantsPreschool children
FFQ v. three 24 HReighty-four items.
CC 0·63 Mean (SD) (mg)24 HR 225 (69)FFQ 220 (60)
Rockett et al.(1997)(29) USA (3·5)
n 2619–18 yearsChildrenAdolescents
YAQ v. three 24 HR131 items. Standard
reference portions
9–13 years CC 0·5114–18 years CC 0·54
Mean (SD) (mg)24 HR 278 (101)YAQ 285 (88)
Andersen et al.(1995)(33) Norway(3)
n 49Adolescents
FFQ v. 7 d WDR190 items HH measures
Unadjusted 0·49Energy adjusted 0·51
Median FFQ: 405 (mg)Median WDR: 292 (mg)
PMarriott et al.(2008)(8) UK (3·5)
n 506 monthsInfants
FFQ v. 4 d WDRthirty-four itemsHH measures
Energy adjustedCC 0·77
Median (mg)FFQ 422WDR 409
Marriott et al.(2008)(9) UK (3·5)
n 5012 monthsInfants
FFQ v. 4 d WDRseventy-eight itemsHH measures
Energy adjustedCC 0·58
Median (mg)FFQ 833WDR 768
Field et al. (1998)(25)
USA (4)n 109Students from fourth to
seventh gradeChildren
FFQ v. four 24 HRninety-seven items.
Standard referenceportions used.
Fourth and fifth gradesCrude 0·25Deattenuated 0·33
Sixth and seventh gradesCrude 0·29Deattenuated 0·40
Rockett et al.(1997)(29) USA (3·5)
n 2619–18 yearsChildrenAdolescents
YAQ v. three 24 HR131 items. Standard
reference portions
9–13 years CC 0·4714–18 years CC 0·61
Mean (SD) (mg)24 HR 1381 (473)YAQ 1515 (446)
Mølgaard et al.(1998)(27) Denmark(2)
n 2313–14 yearsAdolescents
FFQ v. 3 d WDReighty-eight itemsHH measures
CC 0·56 Median (P25–P75) (mg)FFQ 1191 (1027–1538)WDR 1081 (799–1360)
FeMarriott et al.(2008)(8) UK (3·5)
n 506 monthsInfants
FFQ v. 4 d WDRthirty-four itemsHH measures
Energy adjustedCC 0·78
Median (mg)FFQ 7·0WDR 6·9
Micro
nu
trient
assessmen
td
urin
gch
ildh
oo
dS
10
5
British Journal of NutritionDownloaded from https://www.cambridge.org/core. IP address: 54.39.106.173, on 07 Jun 2020 at 02:39:42, subject to the Cambridge Core terms of use, available at https://www.cambridge.org/core/terms. https://doi.org/10.1017/S0007114509993163

Table 4. Continued
Author/yearpublication/country/(quality index) n/age group
Methods/no FFQ items,portion sizes Correlation between methods/other statistics
Marriott et al.(2008)(9) UK (3·5)
n 5012 monthsInfants
FFQ v. 4 d WDRseventy-eight itemsHH measures
Energy adjustedCC 0·50
Median (mg)FFQ 8·48WDR 5·20
Williams & Innis(2005)(17) Canada(5)
n 1488–26 monthsInfants
FFQ v. 3 d EDR191 items
CC 0·64 Median (mg)FFQ 9·6; EDR 7·1
FFQ v. BM Serum ferritin and totalFe from FFQ r ¼ 0·33
3 d EDR v. BM Serum ferritin and totalFe from 3 d EDR r ¼ 0·19
Andersen et al.(2003)(2) Norway(4·5)
n 6412 monthsInfants
FFQ v. 7 d WDR140 items. HH measures or
food photographs
Absolute intakeCC 0·62
Median (P25–P75) (mg)FFQ 8·9 (6·7–12·9)WDR 5·6 (3·6–10·2)***
Blum et al. (1999)(24)
USA (2·5)n 2331–5 yearsInfantsPreschool children
FFQ v. three 24 HReighty-four items.
CC 0·51 Mean (SD) (mg)24 HR 16 (4)FFQ 12 (6)
Andersen et al.(2004)(18,19) Norway(5)
n 1872 years oldPreschool children
FFQ v. 7 d WDR125 items. HH measures or
food photographs
Absolute intakeCC 0·42***
Median (P25–P75) (mg)FFQ 46·5 (5·2–8·0)WDR 4·5 (3·6–5·2)***
Rasanen L.(1979)(39) Finland(5)
n 7415–13 yearsPreschool childrenChildrenAdolescents
24 HR v. DH CC 0·46 Mean DH: 17·6; 24 HR: 11·6
Holmes et al.(2008)(10) UK (3)
n 1242–17 yearsPreschool childrenChildrenAdolescents
24 HR v. 4 d WDR Males-Mean difference2–10 years 0·1 (P ¼ 0·864)11–17 years 1·4 (P ¼ 0·055)
Females-Mean difference2–10 years 0·7 (P ¼ 0·157)11–17 years 1·1 (P ¼ 0·072)
FC v. 4 d WDR Males-Mean difference2–10 years 0·5 (P ¼ 0·356)11–17 years 0·1 (P ¼ 0·847)
Females-Mean difference2–10 years 1·4 (P ¼ 0·000)11–17 years 0·4 (P ¼ 0·348)
SW v. 4 d WDR Males-Mean difference2–10 years 2 1·1 (P ¼ 0·101)11–17 years 2 1·2 (P ¼ 0·237)
Females-Mean difference2–10 years 2 0·5
(P ¼ 0·358)11–17 years 0·7 (P ¼ 0·398)
Bellu et al. (1996)(30)
Italy (3)n 3338–10 yearsChildren
FFQ v. 24 HR116 items.
Girls Mean (SD)24 HR 5·6 (2·6)FFQ 5·3 (0·9)
Boys Mean (SD)24 HR 5·2 (2·0)FFQ 5·0 (0·9)
Lillegaard et al.(2007)(12) Norway(3·5)
n 1009 years oldChildren
PFD v. 4 d WDR277 items HH measures or
colour photographs
Boys-Median (P25–P75) (mg)PFD 8·7 (6·4–10·3)WDR 8·4 (7·1–9·5)CC 0·32*
Girls-Median (P25–P75) (mg)PFD 8·4 (7·1–10·8)WDR 7·1 (6·4–8·0)CC 0·52***
Field et al. (1998)(25)
USA (4)n 109Students from fourth to
seventh gradeChildren
FFQ v. four 24 HRninety-seven items. Stan-
dard reference portionsused.
Fourth and fifth gradesCrude 0·20Deattenuated 0·28
Sixth and seventh gradesCrude 0·29Deattenuated 0·40
Bellu et al. (1995)(32)
Italy (3·5)n 889–12 yearsChildren
FFQ v. 7 d EDR116 items. Reference por-
tion sizes
Raw nutrient 0·31Nutrient density 0·18
Mean (SD)EDR 5·1 (0·67)FFQ 5·2 (0·64)
A.
Ortiz-A
nd
rellucch
iet
al.
S1
06
British Journal of NutritionDownloaded from https://www.cambridge.org/core. IP address: 54.39.106.173, on 07 Jun 2020 at 02:39:42, subject to the Cambridge Core terms of use, available at https://www.cambridge.org/core/terms. https://doi.org/10.1017/S0007114509993163

Table 4. Continued
Author/yearpublication/country/(quality index) n/age group
Methods/no FFQ items,portion sizes Correlation between methods/other statistics
Rockett et al.(1997)(29) USA (3·5)
n 2619–18 yearsChildrenAdolescents
YAQ v. three 24 HR131 items. Standard refer-
ence portions
9–13 years CC 0·4714–18 years CC 0·59
Mean (SD) (mg)24 HR 18 (9)YAQ 18 (8)
Slater et al.(2003)(20) Brazil (4)
n 7914–18 yearsAdolescents
FFQ v. three 24 HRseventy-six items.Reference portion size
listed.
Non-adjusted 0·46**Energy adjusted 0·17Deattenuated 0·22
Mean (SD) (mg)24 HR 11·7 (5·6)FFQ 8·4 (2·4)
Andersen et al.(1995)(33) Norway(3)
n 49Adolescents
FFQ v. 7 d WDR190 items HH measures
Unadjusted 0·52Energy adjusted 0·39
Median FFQ: 12 (mg)Median WDR: 9 (mg)
ZnMarriott et al.(2008)(8) UK (3·5)
n equals;506 monthsInfants
FFQ v. 4 d WDRthirty-four items HH
measures
Energy adjustedCC 0·83
Median (mg)FFQ 5·2WDR 4·7
Marriott et al.(2008)(9) UK (3·5)
n 5012 monthsInfants
FFQ v. 4 d WDRseventy-eight items HH
measures
Energy adjustedCC 0·48
Median (mg)FFQ 6·25WDR 4·54
Blum et al. (1999)(24)
USA (2·5)n 2331–5 yearsInfantsPreschool children
FFQ v. three 24 HReighty-four items.
CC 0·31 Mean (SD) (mg)24 HR 10 (7)FFQ 11 (5)
Rockett et al.(1997)(29) USA (3·5)
n 2619–18 yearsChildrenAdolescents
YAQ v. three 24 HR131 items. Standard
reference portions
9–13 years CC 0·3614–18 years CC 0·59
Mean (SD) (mg)24 HR 12 (6)YAQ 14 (7)
CuMarriott et al.(2008)(8) UK (3·5)
n 506 monthsInfants
FFQ v. 4 d WDRthirty-four items HH
measures
Energy adjustedCC 0·55
Median (mg)FFQ 0·46WDR 0·41
Marriott et al.(2008)(9) UK (3·5)
n 5012 monthsInfants
FFQ v. 4 d WDRseventy-eight items HH
measures
Energy adjustedCC 0·63
Median (mg)FFQ 0·64WDR 0·43
Rockett et al.(1997)(29) USA (3·5)
n 2619–18 yearsChildrenAdolescents
YAQ v. three 24 HR131 items. Standard
reference portions
9–13 years CC 0·4714–18 years CC 0·61
Mean (SD) (mg)24 HR 1·4 (0·8)YAQ 1·7 (0·8)
WDR, weighed dietary record; CC, correlation coefficient; 24 HR, 24 h recall; EDR, estimated dietary record; YAQ, Youth/Adolescent Questionnaire; BM, biomarker; HH measures, household measures; FC, food checklist;SW, semi-weighed method; DH, diet history; PFD, pre-coded food diary; IIC, intra-class correlation coefficients.
Mean values were significantly different: *P,0·05; **P,0·01; *** P,0·001.
Micro
nu
trient
assessmen
td
urin
gch
ildh
oo
dS
10
7
British Journal of NutritionDownloaded from https://www.cambridge.org/core. IP address: 54.39.106.173, on 07 Jun 2020 at 02:39:42, subject to the Cambridge Core terms of use, available at https://www.cambridge.org/core/terms. https://doi.org/10.1017/S0007114509993163

the number of food items were observed (7–191 items).In addition, five studies were classified into group 1 with areference method that reflected short-term intake, in whichone applied 24 h recalls(24), three used WDR(8,9,21) and oneapplied EDR(17). Likewise, another study was classified intogroup 2, where the reference method reflected long-termintake; this study used WDR as the reference method(2).Finally, two studies utilised BM as the referencemethod(17,22), of which one(17) presented validation of more
than one instrument. The number of repeated 24 h recallsranged from 3 to 4 d of administration. Dietary recordsvarying in the number of recording days (from 3 to 7 d)were used as the reference method in a total of five studies.
Comparison of different dietary assessment methodsin infants by vitamins and minerals is presented in Fig. 2.This figure shows that WDR used as the reference methodfor evaluating FFQ presented better correlations for severalmicronutrients than the other methods in this population
Fig. 2. Comparison of different dietary assessment methods in infants (1–23 months) and preschool children (2–5 years) by vitamins and minerals (mean of
quality weighted correlation coefficients) 24 HR, 24 h recall; EDR, estimated dietary record; WDR, weighed dietary record; BM, biomarker; DH, diet history.
(a) Infants (three or more studies: vitamin D, four studies FFQ v. WDR; vitamin E, three studies FFQ v. WDR; vitamin C, three studies FFQ v. WDR; thiamin,
three studies FFQ v. WDR; riboflavin, four studies FFQ v. WDR; calcium, four studies FFQ v. WDR; iron, four studies FFQ v. WDR). , FFQ v. 24 HR
(one study(24)); , FFQ v. WDR (four studies(2,8,9,21)); , FFQ v. EDR (one study(17)); , FFQ v. BM (one study(22)). (b) Preschool children (three or
more studies: not for any micronutrient). , FFQ v. 24 HR (three studies(24,34,37)); , FFQ v. WDR (two studies(18,19,21)); , FFQ v. BM (one study(22));
, 24 HR v. DH (one study(39)).
A. Ortiz-Andrellucchi et al.S108
British
Journal
ofNutrition
Dow
nloaded from https://w
ww
.cambridge.org/core . IP address: 54.39.106.173 , on 07 Jun 2020 at 02:39:42 , subject to the Cam
bridge Core terms of use, available at https://w
ww
.cambridge.org/core/term
s . https://doi.org/10.1017/S0007114509993163

group. However, we must emphasise that this result isprobably due to the fact that 57 % of the studies analysed inthis group used WDR as the reference method.
Table 5 presents the classification of the dietary methodsutilised for studies in infants according to the mean of thecorrelation coefficients for each micronutrient weighted bythe quality of different validation studies included in thisreview. Methods analysed met the criteria of having atleast three studies, thus providing sufficient data to conductquantitative estimates for each micronutrient(40). Vitamin Dand vitamin E intake analysed using FFQ v. WDR showedacceptable correlations. Comparing these methods, weobserved that vitamin C, thiamin, riboflavin, Ca and Fepresented a good correlation. Additionally, when FFQ werevalidated considering WDR and EDR as the referencemethods, only Ca’s correlation increased slightly. Thecorrelation for Fe was not modified, and for the rest ofthe micronutrients, there was insufficient data to conduct ananalysis. (Table 5)
Preschool children
For this review, the preschool children group includedchildren aged 2–5 years. Of the thirty-two articles includedin the present review, ten showed data on the validationof methods used to assess micronutrient intake in preschoolchildren(10,15,18,21,22,24,26,34,37,39). Eight different FFQ hadbeen validated(15,18,21,22,24,26,34,37), and a 24 h recall had beenvalidated in two studies(10,39). Some articles presentedvalidation of more than one instrument, of which one studyalso validated 24 h recalls(22), and another study validated afood checklist and a semi-weighed method(10). After evaluat-ing the quality of these validation studies, the quality scoresobtained ranged from 2·5 to 5. Different FFQ were validatedfor which wide variations in the number of food items wereobserved (7–125 items). Eight studies were classified intogroup 1 with a reference method that reflected short-termintake, in which two used WDR(10,21), another two appliedEDR(15,26), three used 24 h recalls(24,34,38) and one applied aDH(39). Likewise, one study was classified into group 2,where the reference method reflected long-term intake, in
which WDR were applied(18). Finally, one study utilised BMas the reference method, which presented validation of morethan one instrument(22). The number of repeated 24 h recallsranged from 3 to 4 d of administration. Dietary records vary-ing in the number of recording days (from 3 to 7 d) wereused as the reference method in a total of four studies.
Comparison of different dietary assessment methods forvitamin and mineral intake in preschool children is presentedin Fig. 2. This figure shows that there were not enoughstudies to conduct a comparison per micronutrient, as theminimum criterion of three studies per intake assessmentmethod was not met. Moreover, when FFQ were validatedapplying WDR and EDR as the reference methods, onlythe correlation for Ca presented acceptable values (r 0·50;Table 5 and Fig. 3 ).
Fig. 4 only shows FFQ validation studies that assessedmicronutrient intake in infants and preschool children, usinga short-term(8,9,15,17,21,24,26,34,37) or a long-term(2,18) dietaryassessment instrument or BM as a reference method(17,22).In regards to the reference method that reflected short-termintake, good correlations were observed for niacin, thiamin,vitamins B6, D, C, E, riboflavin, Ca, K, Mg, Fe, and Zn.However, when the reference method used reflected long-termintake, good correlations were observed only for riboflavinand Fe. Additionally, when BM were used as the referencemethod, a good correlation was observed only for vitamin C.None of the micronutrients analysed showed correlationshigher than 0·7 using a short-term or a long-term dietaryassessment instrument or BM as the reference method.However, results presented in FFQ validation studies usingshort-term or long-term dietary instruments or BM as thereference methods based on correlations from only one or twostudies should be viewed with caution (Fig. 4). To conductmicronutrient comparisons, there should be at least three ormore studies to ensure the robustness of the results obtained.
Children
This group included children aged 6–12 years. Of the thirty-two articles included in the present review, seventeenshowed data on validation of methods used to assess
Table 5. Classification of the dietary assessment methods for infants, children and adolescents according to the weighted mean of the correlations ofeach micronutrient (including three or more studies)
Correlation*
Micronutrient/age group FFQ v. WDR FFQ v. (WDR þ EDR) FFQ v. 24 HR (FFQ þ YAQ) v. 24 HR
Vitamin D infants A ¼ 0·48 (four studies)Vitamin C infants G ¼ 0·51 (three studies)Vitamin E infants A ¼ 0·46 (three studies)Thiamin infants G ¼ 0·59 (three studies)Riboflavin infants G ¼ 0·65 (three studies)Ca
Infants G ¼ 0·67 (four studies) G ¼ 0·69 (five studies)Preschool children A ¼ 0·50 (four studies)Children A ¼ 0·50 (four studies) A ¼ 0·48 (five studies) A ¼ 0·49 (six studies)Adolescents G ¼ 0·58 (three studies) A ¼ 0·50 (three studies) G ¼ 0·52 (four studies)
FeInfants
G ¼ 0·63 (three studies) G ¼ 0·63 (four studies)
WDR, weighed dietary record; EDR, estimated dietary record; 24 HR, 24 h recall; YAQ, Youth/Adolescent Questionnaire.* Correlation V: very good (.0·7); G: good (0·51–0·70); A: acceptable (0·30–0·50); P: poor (,0·30)
Micronutrient assessment during childhood S109
British
Journal
ofNutrition
Dow
nloaded from https://w
ww
.cambridge.org/core . IP address: 54.39.106.173 , on 07 Jun 2020 at 02:39:42 , subject to the Cam
bridge Core terms of use, available at https://w
ww
.cambridge.org/core/term
s . https://doi.org/10.1017/S0007114509993163

micronutrient intake in children(10 – 14,16,23,25,26,29– 32,35,36,
38,39). After evaluating the quality of these studies, the qualityscores obtained ranged from 2·5 to 5. Eleven differentFFQ(11,13,14,16,23,25,26,30– 32,35,38) had been validated, and 24 hrecalls had been validated in three studies(10,36,39). DifferentFFQ were validated for which wide variations in the numberof food items were observed (10–175 items). Of these, it isworth pointing out the Youth/Adolescent Questionnaire(YAQ)(29) that is a self-administered FFQ specificallydesigned for children aged 9–18 years. Another validateddietary method analysed included 4 d pre-coded fooddiaries(12). The pre-coded food diary is scanable and isdeveloped to simplify the work of the respondents as well as
of the researcher. Some articles presented validation of morethan one instrument, of which one study also validated afood checklist and a semi-weighed method(10), and anotherstudy correlated data from WDR(23). Eleven studies wereclassified into group 1 with a reference method that reflectedshort-term intake, in which six studies used24HR(11,13,14,25,29,30), two applied WDR(10,12), only onestudy used EDR(26), one applied a DH(39) and another studyobserved intakes(36). Likewise, five other studies were classi-fied into group 3, where the reference method reflectedlong-term intake, two studies used WDR(16,23), two appliedEDR(31,32) and only one study utilised 24 h recalls(38) as thereference method. Finally, one study was validated using
Fig. 3. Comparison of different dietary assessment methods in children (6–12 years) and adolescents (13–10 years) by vitamins and minerals (mean of quality
weighted correlation coefficients) 24 HR, 24 h recall; EDR, estimated dietary record; WDR, weighed dietary record; DH, dietary history; YAQ, Youth/Adolescent
Questionnaire. (a) Children (three or more studies: calcium, five studies FFQ v. 24 HR). , FFQ v. EDR (three studies(26,31,36)); , FFQ v. WDR (two
studies(16,23)); , FFQ v.BM (one study(35)); , 24 HR v. DH (one study(39)); , YAQ v. 24 HR (one study(29)); , FFQ v. 24 HR
(five studies(11,13,16,25,38)). (b) Adolescents (three or more studies: calcium: three studies FFQ v. 24 HR; three studies FFQ v. WDR). , FFQ v. 24 HR
(three studies(11,14,20)); , FFQ v. WDR (three studies(16,27,33)); , 24 HR v. DH (one study(39)); , YAQ v. 24 HR (one study(29)).
A. Ortiz-Andrellucchi et al.S110
British
Journal
ofNutrition
Dow
nloaded from https://w
ww
.cambridge.org/core . IP address: 54.39.106.173 , on 07 Jun 2020 at 02:39:42 , subject to the Cam
bridge Core terms of use, available at https://w
ww
.cambridge.org/core/term
s . https://doi.org/10.1017/S0007114509993163

BM(35). Some articles applied more than one instrument asthe reference methods, also employing the use of BM(23).The number of repeated 24 h recalls ranged from 1 to 14administration days. Dietary records varying in the numberof recording days (from 1 to 14 d) were used as the referencemethod in a total of seven studies.
Fig. 3 presents the comparison of different dietary assess-ment methods in children by vitamins and minerals. In thisfigure, when the 24HR was used as the reference method, itseemed to obtain better correlations for several micronutrients.However, only five studies were included for measuringCa intake, for which FFQ were validated against 24HR,presenting an acceptable correlation.
Additionally, when FFQ were validated utilising WDRand EDR as the reference methods, only the correlationfor Ca presented an acceptable value (r 0·50). Similar corre-lations were observed when the validity of Ca intakemethods using FFQ (FFQ and YAQ) was assessed by com-paring them with Ca intake estimated by 24 HR (r 0·48and r 0·49, respectively). The analysis for Ca was conductedas it met the minimum of having data from at least threestudies. However, for the rest of the micronutrients, therewere insufficient data to conduct a comparative analysis(Table 5).
Adolescents
For the present paper, the adolescent age group included
children aged 13–18 years. Of the thirty-two articles included
in the present review, ten showed data on validation of
methods used to assess micronutrient intake in adoles-
cents(10,11,14,16,20,27– 29,33,39). Eight different FFQ(11,14,16,20,
27 – 29,33,39) had been validated (of which one was the
YAQ)(29), and 24 h recalls had been validated in two
studies(10,39). Some articles presented validation of more
than one instrument, of which one study also validated a
food checklist and a semi-weighed method(10). After evaluat-
ing the quality of these studies, the quality scores obtained
ranged from 2·5 to 5. Seven studies were classified into
group 1 with a reference method that reflected short-term
intake, in which four studies used 24HR(11,14,20,29), two studies
applied WDR(10,27) and another study administered a DH(39).
In addition, two studies were classified into group 2 with a
reference method that reflected long-term intake, in which
WDR were used as the reference method(16,33) and finally,
one study used BM(28). The number of repeated 24 h recalls
ranged from 1 to 3. Different FFQ were validated for which
wide variations in the number of food items were observed
(10–190 items). Dietary records varying in the number of
Fig. 4. Validation of FFQ studies that assess micronutrient intake in infants (1–23 months) and preschool children (2–5 years) using as the reference method:
short-term or long-term dietary instruments or biomarkers. Correlations: poor (,0·30), acceptable (0·30–0·50), good (0·51–0·70) and very good (.0·70). Three or
more studies: sodium, vitamins B12, E, C, D, B6, zinc, iron, magnesium, potassium, calcium, riboflavin, thiamin, niacin. B, Short-term intake (,7 d); , long-term
intake ($7 d); o, biomarkers.
Micronutrient assessment during childhood S111
British
Journal
ofNutrition
Dow
nloaded from https://w
ww
.cambridge.org/core . IP address: 54.39.106.173 , on 07 Jun 2020 at 02:39:42 , subject to the Cam
bridge Core terms of use, available at https://w
ww
.cambridge.org/core/term
s . https://doi.org/10.1017/S0007114509993163

recording days (from 1 to 7 d) were used as the referencemethod in a total of four studies.
Comparison of different dietary assessment methods waslimited in the adolescent group, due to the fact that therewas an insufficient number of studies for each micronutrientthat could provide conclusive results (Fig. 3). A goodcorrelation (r 0·58) was observed, when FFQ were validatedapplying WDR as the reference method only for Ca. Addition-ally, when FFQ were validated considering 24HR as thereference method, the correlation for Ca presented an accepta-ble correlation (r 0·50). Similar correlations were observedwhen the validity of Ca intake using the FFQ (including theYAQ) was assessed by comparing them with Ca intakeusing the 24HR (r 0·52). There were not enough data toconduct an analysis for the rest of the micronutrients in thispopulation group (Table 5).
Fig. 5 shows only FFQ validation studies that assessedmicronutrient intake in children and adolescents, usinga short-term(11,13,14,20,25 – 27,29) or a long-term(16,23,31 – 33,38)
dietary assessment instrument or BM as the referencemethod(23,28,35). In regards to the reference method thatreflected short-term intake, good correlations were observedfor thiamin, vitamins B6, C, E, riboflavin, Ca, Mg, Cu andfolate. However, when the reference method used reflected
long-term intake, good correlations were observed only forMg and b-carotene. Additionally, when BM were used asthe reference method, correlations having a very goodclassification were not observed. None of the micronutrientsanalysed showed correlations higher than 0·7 using short orlong-term dietary assessment instruments or BM as thereference method. Nevertheless, the results presented inFFQ validation studies using short-term or long-term dietaryinstruments or BM as the reference methods based oncorrelations from less than three studies should be viewedwith caution (Fig. 5).
Biomarkers
A total of five publications analysed BM(17,22,23,28,35), whichwere used to validate five FFQ. Some articles presentedvalidation of more than one instrument, of which onestudy also validated estimated dietary records(17) and twostudies validated WDR using BM as the referencemethod(23,28). The BM analysed were: serum markers ofFe status (ferritin, Hb)(17), plasma levels of vitamins C, D,retinol, b-carotene and a-tocopherol (vitamin E)(22), 24 hurine K(23), serum folate and serum vitamin B12
(28) andserum levels of vitamins C, A and E(35).
Fig. 5. Validation of FFQ studies that assess micronutrient intake in children (6–12 years) and adolescents (13–10 years) using short-term or long-term dietary
instruments or biomarkers as the reference methods. Correlations: poor (,0·30), acceptable (0·30–0·50), good (0·51–0·70) and very good (.0·70).
B, Short-term intake (,7 d; three or more studies: vitamin C, iron, calcium, phosphorus); , long-term intake ($7 d; three or more studies: vitamin C, calcium,
riboflavin, thiamin); o, biomarkers.
A. Ortiz-Andrellucchi et al.S112
British
Journal
ofNutrition
Dow
nloaded from https://w
ww
.cambridge.org/core . IP address: 54.39.106.173 , on 07 Jun 2020 at 02:39:42 , subject to the Cam
bridge Core terms of use, available at https://w
ww
.cambridge.org/core/term
s . https://doi.org/10.1017/S0007114509993163

Discussion
In the present review, thirty-two studies(2,8 – 39) are described.The aim of this analysis was to determine the reliability ofmethods used to measure the usual intake of vitaminsand minerals in infants, children and adolescents and howthese were validated. The different studies included in thisreview were classified according to which reference methodwas used, those reflecting short-term intake, long-termintake or BM. To rate the different studies, a quality scoresystem was developed by the European micronutrientRecommendations Aligned network. A total score was calcu-lated according to the weighted mean of the correlations thathad been adjusted by the quality of the different validationstudies, and all the methods were scored into the categories:poor, acceptable, good or very good. Measuring dietaryintake in very young children is difficult because of therapid changes in the food habits of toddlers, the need to relyon parental reporting and the questionable ability of parentsto accurately report their child’s diet when other caregiversare also involved in feeding the child(22). Adolescents’eating habits are highly influenced by family patterns andhabits, their peer group, as well as by their increasing concernwith body image. Habits such as meal skipping (particularlybreakfast), consuming high-energy foods that are poor innutrients and the tendency, particularly among girls, to restricttheir diet and to go on diets are part of the repertoire of ado-lescent eating behaviour(20).
Infants
This group included infants aged 1–23 months. Evidence forthe long-term effects of infant nutrition on later health hasgiven impetus to the need for developing methods to assessthe diets of infant populations(41). In general, for this group,the daily non-human milk intake in the previous day orweek was estimated from the average total volume ofbottle-feeds consumed per day; for breast-fed infants, theusual feeding length and number of feeds per day wererecorded. In Andersen’s study(2), the relative validity of asemi-quantitative FFQ (140-item semi-quantitative FFQ)used in 12-month-old infants was examined (with correlationsranging from 0·18 for vitamin D to 0·62 for Ca and Fe). Thisvalidation study indicated that the semi-quantitative FFQ usedin infants overestimated the median intake of nutrients exceptfor Ca intake. In a sample of fifty infants aged 6 months,Marriott et al. (8) compared the energy and nutrient intakesassessed by a newly developed, interviewer-administered,34-item infant FFQ with intakes determined from 4 d WDR.Differences in intakes between methods were observed, andthe agreement tended to be lower for breast-fed than forformula-fed infants. The correlation coefficients of this studycompared favourably with other FFQ validation studies foryoung children. Reported correlation coefficients for energyand nutrients were 0·18–0·72 at 1 year in Andersen’sstudy(2), and 0·26–0·63 for 1- to 5-year-olds in Blum’sstudy(24). In the latter study, an 84-item FFQ was used, withcorrelations ranging from 0·31 for Zn to 0·63 for Mg. Marriottet al. (9) also evaluated the relative validity of a 76-item FFQfor assessing micronutrient intakes in 12-month-old infants.They reported smaller correlations in infants aged 12 months
(with correlations ranging from 0·24 for vitamin B12 to 0·75for Na) than in the infants aged 6 months (with correlationsranging from 0·55 for Cu to 0·89 for thiamin). Marshallet al. (21) compared nutrient intakes from beverages in asample of 6-month-old infants using a 7-item FFQ andobtained coefficients for Ca and vitamin D intakes of 0·64and 0·80, respectively. Similar results were shown for Marriottet al. (8) for these nutrients (Ca, r 0·78 and vitamin D,r ¼ 0·83). The ability of the FFQ to accurately rank intakesof energy and all the nutrients in infants is enhanced by thequality and detail of the information collected, which includesinformation about brands and types of baby foods and milksused(8). In Williams & Innis(17), parents of 148 infants aged8–26 months completed a 191-item FFQ and 3 d EDR forassessing Fe nutrition in infants (with correlations rangingfrom 0·64 for vitamin C and Fe to 0·75 for Ca). These resultsshowed relative validity of a FFQ in comparison with 3 d EDRfor estimating Fe intakes in a group of infants and suggestedthat while dietary assessments can serve as useful researchtools to assess nutrient intakes in 8- to 26-month-old infants,they have limited value as tools to identify infants at risk ofFe deficiency.
Preschool children
In this review, the preschool children group included childrenaged 2–5 years. Many factors contribute to making intakeassessment in this age group difficult: preschool children eatsmall amounts of food at frequent intervals, they are notable to complete questionnaires and their food habits andnutrient intakes may rapidly change(42,43). In Huybrechtset al. (15), the relative validity of a 47-item FFQ for measuringpreschool children’s usual Ca intake was assessed usingparents or guardians as a proxy, and EDR were used as thereference method. Based on the comparison of means,the FFQ underestimated the mean Ca intake measured bythe EDR. These findings are in contrast to the findings ofanother study(26), which reported overestimates of actual Caintakes in young children (3–6 years) using a 35-item FFQ.Andersen et al. (18) presented the relative validity of foodand nutrient intakes estimated by the 125-item FFQ againstintakes from 7 d WDR applied in the nation-wide surveyamong 2-year-old children in Norway. The correlations inthis study were also lower than those observed by Blumet al. (24) However, the correlation coefficients for nutrientdensity values estimated from the two methods were muchhigher than those seen for absolute nutrient intakes, and forten out of sixteen nutrients, the correlations were .0·50.The average correlation (median r 0·52) for nutrient densitywas similar to that observed among 12-month-old Norwegianinfants (median r 0·50)(2). The agreement across quartilesbetween the two methods was on average (median) 36 %,which is similar to the results observed among 12-month-oldinfants (38 %)(2). In Andersen’s study(18), agreement acrossquartiles increased when using nutrient density. Other authorsstudied 224 preschool children and obtained dietary data byinterviewing the child’s mother(37). The present study was per-formed to determine the utility of the Willett semi-quantitativeFFQ for assessing habitual diets of preschool children.Results reported associations between nutrient intakes esti-mated by the FFQ and 24 h recalls, with correlations (adjusted
Micronutrient assessment during childhood S113
British
Journal
ofNutrition
Dow
nloaded from https://w
ww
.cambridge.org/core . IP address: 54.39.106.173 , on 07 Jun 2020 at 02:39:42 , subject to the Cam
bridge Core terms of use, available at https://w
ww
.cambridge.org/core/term
s . https://doi.org/10.1017/S0007114509993163

for within-person variability and non-differential measurementerror) in the range of 0·20–0·60(37). Blum et al. (24) demon-strated that past dietary intake of children aged 1–5 yearscould be measured reasonably well with an 84-item FFQcompleted by child’s parent or guardian. Correlation coeffi-cients between the dietary intakes assessed by the twomethods ranged from 0·26 for fibre to 0·63 for Mg. All butthree nutrients (protein, dietary fibre and Zn) had correlationsof 0·47 or higher. After adjusting for energy intake and within-person variation, the average correlation was 0·52.
Children
This group included children aged 6–12 years. The food andnutrient intake of children is important not only for growthand development but also for present and future health, includ-ing the prevention of chronic diseases in adulthood(44,45). Tosucceed in nutrition monitoring and epidemiologic researchamong large groups of children, it is necessary to have adietary assessment method that is both valid and functionalwith young age groups(12). Almost all of the reviewed validityand reliability studies in children younger than age 9 includedadult assistance in providing information on the child’s intake.In general, the reviews concluded that children generally havedifficulty in estimating portion sizes(46). Rasanen(39) comparedthe 24 h recall method with the diet history method as used ina food consumption survey for children. The correlationcoefficients between the values obtained by the 24 h recallsand the diet history method varied from 0·20 (vitamin A) to0·50 (energy). The history method used in this study gave con-sistently higher mean values than the 24 h recalls. Lytleet al. (36) found correlations for nutrient intake between 0·45and 0·79 when comparing observed and recalled food intakein 8- to 10-year-old children. These are within the samerange or somewhat higher than results obtained in Lillegaard’sstudy(12), which evaluated intake of energy, macro- and micro-nutrients assessed from pre-coded food diaries and by using4 d WDR as the reference method in 9-year-old Norwegians.The pre-coded food diary is scanable and is developed tosimplify the work of the respondents as well as of theresearcher. In Belgium, a self-administered computer dietaryassessment program ‘Young Adolescents Nutrition Assess-ment Computer’ was developed, based on the concept of the24HR. The Young Adolescents Nutrition Assessment Compu-ter is a computer program designed for use with children andadolescents aged 11 years and over(47). Vereecken et al. (47)
assessed the relative validity of the computerised 24 h recallYoung Adolescents Nutrition Assessment Computer compar-ing results with a 1 d EDR and 24 h recall; the Spearman’scorrelations obtained for the 24 h recall (ranging from 0·44to 0·86) were comparable to those observed by Lytleet al. (36) between 24 h recalled and observed nutrient intakeof third-grade children (ranging between 0·45 and 0·79).In the study of Van Horn et al. (48), the correlations wereslightly higher (0·64–0·96) using electronic methods such astelephone recalls and tape-recorded dietary records. Belluet al. (30) reported on the ability of a 116-item FFQ to estimatethe mean nutrient intake at the population level for an Italianpaediatric population (mean age ¼ 9·3 years) comparingresults with a 24 h recall. Moderate concordance betweenthe two methods was found. Similar results were presented
in by Stein et al. (37) In another study, Bellu et al. (32) testedthe validity for the assessment of individual nutrient intakeby a 116-item FFQ for Northern Italian school childrencomparing results with 7 d EDR. In this study, the Pearson’scorrelation coefficients ranged between 0·30 and 0·58, andfor some nutrients (vitamins A and B6) the correlation wasfound to be low.
Adolescents
For the present paper, the adolescent age group included youthaged 13–18 years. Adolescents are a group whose eating habitsare characterised by factors such as irregular meals, snackingand meal-skipping. These eating habits are not easily conduciveto diet assessment by a prospective methodology(23). Slateret al. (20) compared the 76-item FFQ developed for adolescentsto data obtained from 24 h recalls, and similar values for energy,carbohydrates, total fat and Ca intake were observed,suggesting a high consistency in estimating these nutrients.However, there was a significant difference for seven remainingnutrients (protein, polyunsaturated fat, dietary fibre, cholesterol,retinol, vitamin C and Fe). Higher values (mean r 0·57) wereobserved with unadjusted correlations compared with resultsobtained by Rockett et al. (29) (mean r 0·39) and Fieldet al. (25) (0·27 for Ca, 0·25 for P, 0·20 for Fe, 0·19for vitamin C). The YAQ is a youth-friendly FFQ that allows9- to 18-year-old adolescents to report on their own diet(49).Rockett et al. (29) evaluated the questionnaire’s validity bycomparing the nutrient scores of the YAQ with those fromthe average of three 24 h recalls. Similar mean nutrients werefound by both the methods. Correlation coefficients betweenthe mean energy-adjusted nutrients computed by the twomethods ranged from 0·21 for Na to 0·58 for folate. Aftercorrection for within-person error, the average correlationcoefficient was 0·54, similar to that found for adults(50). In thevalidation study developed by Mølgaard et al. (27), twenty-three children aged 13–14 years filled in an 88-item FFQdesigned to assess Ca, protein and P intakes and kept 3 dWDR. Spearman rank correlations between nutrient intakevalues from the FFQ and WDR were 0·56–0·62 (mean 0·60).Another study showed similar findings for Ca intake(r 0·54)(33) using 7 d WDR as the reference method.
Biomarkers
Williams & Innis(17) showed the validity of nutrient intakeestimates using a 191-item FFQ that was assessed by compar-ing data with biochemical measures of Fe status in infants.These results presented weak correlations for assessmentmethods (acceptable classification for FFQ v. BM r 0·33 andpoor classification for a 3 d EDR v. BM r 0·19). This is theonly study presented in this review that analyses biochemicalmeasures of Fe status in infants and possibly, the lowercorrelation coefficients between Fe intake and serum ferritinobserved in this study, as compared to previous studies witholder subjects, involve factors inherent to studies in infantsbut not in older children and adults(51). Lietz et al. (23) reportedon the correlation coefficient between urinary K and dietaryintake from a 130-item FFQ (r 20·04) and from a 7 d WDR(r 0·78) in fifty children between 11 and 13 years. The latter
A. Ortiz-Andrellucchi et al.S114
British
Journal
ofNutrition
Dow
nloaded from https://w
ww
.cambridge.org/core . IP address: 54.39.106.173 , on 07 Jun 2020 at 02:39:42 , subject to the Cam
bridge Core terms of use, available at https://w
ww
.cambridge.org/core/term
s . https://doi.org/10.1017/S0007114509993163

correlation was higher than correlations reported in aprevious study(52).
Green et al. (28) validated a 116-item FFQ and a 3 d WDRby comparing nutrient intake estimates using these methodswith serum folate and serum vitamin B12 concentrations in105 females aged 16–19 years. Using serum folate concen-tration as the sole biochemical criterion, it appeared that the3 d WDR was superior to the FFQ as a tool to predict folateintakes. The correlations between folate intakes and serumfolate as determined by 3 d WDR (adjusted r 0·65) showedhigher correlations than those determined by FFQ (r 0·48;supplement users were included in these analyses). VitaminB12 intake as determined by either of the dietary methodsshowed only a modest association with serum vitamin B12
concentrations, when supplement users were included in theanalyses (3 d WDR r 0·32; FFQ r 0·25). Another author(53)
using a FFQ reported a correlation of r 0·60 between folateintakes and plasma folate concentrations and a correlation ofr 0·35 between vitamin B12 intakes and serum vitamin B12
concentrations in a group of 139 adults aged 40–83 years.The correlations observed by Parrish et al. (22) compared the
reported dietary intake in infants and preschool children usinga 111-item FFQ with plasma concentrations of the micronutri-ent. The highest correlation between plasma concentrationsand dietary intake as measured by the FFQ was forvitamin C (r 0·51), and the correlations were weak or absentfor vitamin D, retinol and b-carotene. Byers et al. (35) adminis-tered a 111-item FFQ to ninety-seven parents of childrenaged 6–10 years to evaluate their children’s usual dietaryintake and compared results with children’s serum levels ofvitamins C, A and E. The correlations observed in thisstudy between circulating levels of vitamin C (r 0·37) andvitamin E (r 0·32), and the parent’s reports of their children’sdiets were similar to those observed in dietary validationstudies conducted in adults(54). However, it is important tokeep in mind that the results presented in FFQ validationstudies using BM as the reference method based on corre-lations from only one or two studies should be interpretedwith caution (Figs. 4 and 5).
Conclusion
When comparing different validation methods in infants, thereviewed studies showed that the FFQ was the method usedin all the studies to assess micronutrient intake in infants.Different FFQ were validated for which wide variations inthe number of food items were observed (7–191 items).The ability of the FFQ to accurately rank intakes of energyand all the nutrients in infants is enhanced by the qualityand detail of the information collected, which includes infor-mation about brands and types of baby foods and milksused(8). The WDR used as the reference method for evaluatingFFQ present better correlations for several micronutrients thanother methods in this population group. However, we mustemphasise that this result is probably due to the fact that57 % of the studies analysed in infants used WDR as the refer-ence method. Vitamin D and vitamin E intake analysed usingFFQ v. WDR showed acceptable correlations, and goodcorrelations were observed for vitamin C, thiamin, riboflavin,Ca and Fe. For the rest of the micronutrients, there were
insufficient data to conduct an analysis (three or more studieswere needed for each micronutrient).
In the preschool children cluster, different FFQ werevalidated for which wide variations in the number of fooditems were observed (7–125 items).The FFQ was used asthe method to assess micronutrient intake in 80 % of thestudies in preschool children. Comparison of different dietaryassessment methods was difficult in this group, as there werenot enough studies to analyse for each micronutrient. Exceptfor the measurement of Ca intake, acceptable correlations(r 0·50) were observed when FFQ were validated applyingWDR and EDR as the reference methods. This age grouptypically eat more frequently, and since 50 % of thepreschool children consume two meals outside of theirhomes, parents may not be able to accurately describe whatwas actually consumed(34).
The results presented in the FFQ validation studies forinfants and preschool children, using long-term dietary instru-ments or BM as the reference methods were based on only oneor two correlation studies and as such, there were insufficientdata to reach robust conclusions. In regards to the referencemethod that reflected short-term intake in the infants and pre-school children group, good correlations were observed forniacin, thiamin, vitamins B6, D, C, E, riboflavin, Ca, K, Mg,Fe, and Zn (with mean weighted correlations ranging from0·55 for vitamin E to 0·69 for niacin). For the analysis ofthese micronutrients, data from three or more studies wereincluded (the study quality scores ranging from 2·5 to 5·5).
For the children group, 65 % of the reviewed studies usedFFQ to assess micronutrient intake for which wide variationsin the number of food items were observed (10–175 items).When comparing different validation methods in this group,only an acceptable correlation (r 0·50) was observed formeasuring of Ca intake, when FFQ were validated applyingWDR and EDR as the reference methods. Similar correlationswere observed when the validity of Ca intake estimates usingthe FFQ (including YAQ) was assessed by comparing themwith the Ca intake estimates using a 24HR (r 0·49). For theother micronutrients, there were insufficient data to compare.
Assessing the validation of different dietary assessmentmethods in adolescents was difficult as there were not enoughstudies to compare for each micronutrient. A good correlation(r 0·58) was observed when FFQ were validated applyingWDR as the reference method only for Ca intake. Additionally,when FFQ were validated using a 24 HR as the referencemethod, correlations for Ca presented acceptable values(r 0·50). In the adolescent group, 80 % of the reviewed studiesused FFQ to assess micronutrient intake for which wide variationsin the number of food items were observed (10–190 items).
There were not enough data to contrast FFQ studies thatassessed micronutrient intake in children and adolescentsusing long-term dietary instruments (except for thiamin,riboflavin, Ca and vitamin C intake that showed acceptablecorrelations) or BM as the reference methods. (Only one ortwo studies, thus being insufficient to reach strongconclusions). Regarding the reference method that reflectedshort-term intake in children and adolescents, good corre-lations were observed only for vitamin C (r 0·61) and Ca(r 0·51). In the analysis of these micronutrients, data fromthree or more studies were included (the study quality scoresranging from 2 to 4·5).
Micronutrient assessment during childhood S115
British
Journal
ofNutrition
Dow
nloaded from https://w
ww
.cambridge.org/core . IP address: 54.39.106.173 , on 07 Jun 2020 at 02:39:42 , subject to the Cam
bridge Core terms of use, available at https://w
ww
.cambridge.org/core/term
s . https://doi.org/10.1017/S0007114509993163

In the studies reviewed, FFQ comprised the dietary methodthat was most utilised to assess the micronutrient intake inthese groups, in which it is of utmost importance to recognisemethodological aspects such as food composition databasesused for analysis, portion size assessment and the time periodsbetween the two dietary assessment methods(23). On the otherhand, dietary assessment in children and adolescents usingelectronic methods for deriving self-reports, such as thetape-recorded food record or the computer dietary assessmentprogram, may help improve compliance and frequency ofrecord keeping in these age groups(48).
The micronutrients analysed in this review using BM as thereference method were: vitamins A, C, D, E, and B12, retinol,b-carotene, folate and K. In general, the best correlations wereobserved when the validity of nutrient intake estimates usingWDR was assessed by comparing them with micronutrientserum levels. Validation of FFQ studies that assess micronutri-ent intake in the infant and preschool children group using BMas the reference method presented good correlations only forvitamin C. Poor rankings (r , 0·3) were observed for retinol,b-carotene and K, and acceptable rankings were observed onlyfor vitamin E and Fe. In the children and adolescent group, thevalidation of FFQ studies that assess micronutrient intakecomparing them with biochemical measures of micronutrientstatus presented poor correlations for vitamins A and B12
and acceptable correlations for folate, vitamins E and C.However, we must emphasise once more that the datapresented in FFQ validation studies using BM as the referencemethod showed correlations from only one or two studies; assuch, this information should be viewed with caution. Includ-ing supplement users generally improved the correlationsbetween micronutrients intakes estimated by either of thedietary intake methods and their respective biochemicalindices. Nutrient BM are appealing as a comparison methodbecause measurement errors are uncorrelated with reportingerrors(55). However, given that blood concentrations may bea result of absorption and metabolism and not only reflectingintake, nutrient BM may not always be an appropriate methodof comparison(22).
Acknowledgements
The studies reported herein have been carried out within theEuropean micronutrient Recommendations Aligned Networkof Excellence (www.eurreca.org), financially supported bythe Commission of the European Communities, specificResearch, Technology and Development (RTD) ProgrammeQuality of Life and Management of Living Resources,within the Sixth Framework Programme, contract no036196. This report does not necessarily reflect the Commis-sion’s views or its future policy in this area. A. O.-A. wrotethe first manuscript; A. O.-A., P. H.-S. and A. S.-V. contribu-ted to the planning of the search and analysed the articlesincluded in this review; M. M. analysed the articles includedin this review; L. P.-Q. and M. M. revised and discussedprevious drafts; L. S.-M. contributed to the planning of thesearch, decided the analysis and presentation of the resultsand created the quality assessment tool of the articles, andrevised and discussed previous drafts. There are no conflictsof interest to report. The authors of the present paper wouldlike to thank Dr Margaret Ashwell, Dr Janet Lambert,
Dr Adrienne Cavelaars, Dr Olga Souverein and Mrs SandraCrispim for their technical contribution and advice to thispublication. The authors also thank the Health SciencesLibrary of the University of Las Palmas de Gran Canaria,Lourdes Ribas, and Nuria Melian for their contribution inthe collection of articles analysed in this review. Specialthanks to Joy Ngo, RD from the Nutrition ResearchFoundation (FIN) for her help in editing the Englishversion of the manuscript.
References
1. Mascarenhas MR, Zemel B & Stallings VA (1998) Nutritional
assessment in paediatrics. Nutrition 14, 105–115.
2. Andersen LF, Lande B, Arsky GH, et al. (2003) Validation of a
semi-quantitative food-frequency questionnaire used among
12-month-old Norwegian infants. Eur J Clin Nutr 57, 881–888.
3. Baranowski T & Domel SB (1994) A cognitive model of chil-
dren’s reporting of food intake. Am J Clin Nutr 59, S212–S217.
4. Livingstone MB & Robson PJ (2000) Measurement of dietary
intake in children. Proc Nutr Soc 59, 279–293.
5. Sobo EJ & Rock CL (2001) ‘You ate all that!?’: caretaker-child
interaction during children’s assisted dietary recall interviews.
Med Anthropol Q 15, 222–244.
6. Frank GC (1997) Methodological issues regarding eating beha-
vior of high-risk adolescents. Ann N Y Acad Sci 817, 66–82.
7. Ashwell M, Lambert JP, Alles MS, et al. (2008) How we will
produce the evidence-based EURRECA toolkit to support nutri-
tion and food policy. Eur J Nutr 47, Suppl. 1, 2–16.
8. Marriott LD, Robinson SM, Poole J, et al. (2008) What do
babies eat? Evaluation of a food frequency questionnaire to
assess the diets of infants aged 6 months. Public Health Nutr
11, 751–756.
9. Marriott LD, Inskip HM, Borland SE, et al. (2008) What do
babies eat? Evaluation of a food frequency questionnaire to
assess the diets of infants aged 12 months. Public Health Nutr
12, 967–972.
10. Holmes B, Dick K & Nelson M (2008) A comparison of four
dietary assessment methods in materially deprived households
in England. Public Health Nutr 11, 444–456.
11. Moore M, Braid S, Falk B, et al. (2007) Daily calcium intake in
male children and adolescents obtained from the rapid assess-
ment method and the 24-hour recall method. Nutr J 6, 24–28.
12. Lillegaard IT, Løken EB & Andersen LF (2007) Relative
validation of a pre-coded food diary among children, under-
reporting varies with reporting day and time of the day. Eur J
Clin Nutr 61, 61–68.
13. Magkos F, Manios Y, Babaroutsi E, et al. (2006) Development
and validation of a food frequency questionnaire for assessing
dietary calcium intake in the general population. Osteoporos
Int 17, 304–312.
14. Harnack LJ, Lytle LA, Story M, et al. (2006) Reliability and
validity of a brief questionnaire to assess calcium intake of
middle-school-aged children. J Am Diet Assoc 106, 1790–1795.
15. Huybrechts I, De Bacquer D, Matthys C, et al. (2006) Validity
and reproducibility of a semi-quantitative food-frequency ques-
tionnaire for estimating calcium intake in Belgian preschool
children. Br J Nutr 95, 802–816.
16. Bertoli S, Petroni ML, Pagliato E, et al. (2005) Validation of
food frequency questionnaire for assessing dietary macronutri-
ents and calcium intake in Italian children and adolescents.
J Pediatr Gastroenterol Nutr 40, 555–560.
17. Williams PL & Innis SM (2005) Food frequency questionnaire
for assessing infant iron nutrition. Can J Diet Pract Res 66,
176–182.
A. Ortiz-Andrellucchi et al.S116
British
Journal
ofNutrition
Dow
nloaded from https://w
ww
.cambridge.org/core . IP address: 54.39.106.173 , on 07 Jun 2020 at 02:39:42 , subject to the Cam
bridge Core terms of use, available at https://w
ww
.cambridge.org/core/term
s . https://doi.org/10.1017/S0007114509993163

18. Andersen LF, Lande B, Trygg K, et al. (2004) Validation of
a semi-quantitative food-frequency questionnaire used among
2-year-old Norwegian children. Public Health Nutr 7, 757–764.
19. Andersen LF, Lande B, Trygg K, et al. (2004) Validation of
a semi-quantitative food-frequency questionnaire used among
2-year-old Norwegian children – Corrigendum. Public Health
Nutr 12, 1026–1027.
20. Slater B, Philippi ST, Fisberg RM, et al. (2003) Validation of a
semi-quantitative adolescent food frequency questionnaire
applied at a public school in Sao Paulo, Brazil. Eur J Clin
Nutr 57, 629–635.
21. Marshall TA, Eichenberger Gilmore JM, Broffitt B, et al. (2003)
Relative validation of a beverage frequency questionnaire in
children ages 6 months through 5 years using 3-day food and
beverage diaries. Am Diet Assoc 103, 714–720.
22. Parrish LA, Marshall JA, Krebs NF, et al. (2003) Validation
of a food frequency questionnaire in preschool children.
Epidemiology 14, 213–217.
23. Lietz G, Barton KL, Longbottom PJ, et al. (2002) Can the
EPIC food-frequency questionnaire be used in adolescent
populations? Public Health Nutr 5, 783–789.
24. Blum RE, Wei EK, Rockett HR, et al. (1999) Validation of a food
frequency questionnaire in Native American and Caucasian
children 1 to 5 years of age. Matern Child Health J 3, 167–172.
25. Field AE, Peterson KE, Gortmaker SL, et al. (1999) Reproduci-
bility and validity of a food frequency questionnaire among
fourth to seventh grade inner-city school children: implications
of age and day-to-day variation in dietary intake. Public Health
Nutr 2, 293–300.
26. Taylor RW & Goulding A (1998) Validation of a short food
frequency questionnaire to assess calcium intake in children
aged 3 to 6 years. Eur J Clin Nutr 52, 464–465.
27. Mølgaard C, Sandstrom B & Michaelsen KF (1998) Evaluation
of a food frequency questionnaire for assessing of calcium,
protein and phosphorus intakes in children and adolescents.
Scand J Nutr 42, 2–5.
28. Green TJ, Allen OB & O’Connor DL (1998) A three-day
weighed food record and a semiquantitative food-frequency
questionnaire are valid measures for assessing the folate and
vitamin B-12 intakes of women aged 16 to 19 years. J Nutr
128, 1665–1671.
29. Rockett HR, Breitenbach M, Frazier AL, et al. (1997)
Validation of a youth/adolescent food frequency questionnaire.
Prev Med 26, 808–816.
30. Bellu R, Riva E, Ortisi MT, et al. (1996) Validity of a food
frequency questionnaire to estimate mean nutrient intake of
Italian school children. Nutr Res 16, 197–200.
31. Arnold JE, Rohan T, Howe G, et al. (1995) Reproducibility and
validity of a food-frequency questionnaire designed for use in
girls age 7 to 12 years. Ann Epidemiol 5, 369–377.
32. Bellu R, Ortisi MT, Riva E, et al. (1995) Validity assessment
of a food frequency questionnaire for school-age children in
Northern Italy. Nutr Res 15, 1121–1128.
33. Andersen LF, Nes M, Lillegaard IT, et al. (1995) Evaluation of
a quantitative food frequency questionnaire used in a group
of Norwegian adolescents. Eur J Clin Nutr 49, 543–554.
34. Iannotti RJ, Zuckerman AE, Blyer EM, et al. (1994)
Comparison of dietary intake methods with young children.
Psychol Rep 74, 883–889.
35. Byers T, Trieber F, Gunter E, et al. (1993) The accuracy of par-
ental reports of their children’s intake of fruits and vegetables:
validation of a food frequency questionnaire with serum levels
of carotenoids and vitamins C, A, and E. Epidemiology 4,
350–355.
36. Lytle LA, Nichaman MZ, Obarzanek E, et al. (1993) Validation
of 24-hour recalls assisted by food records in third-grade
children. The CATCH Collaborative Group. J Am Diet Assoc
93, 1431–1436.
37. Stein AD, Shea S, Basch CE, et al. (1992) Consistency of
the Willett semiquantitative food frequency questionnaire
and 24-hour dietary recalls in estimating nutrient intakes of
preschool children. Am J Epidemiol 15, 667–677.
38. Jenner DA, Neylon K, Croft S, et al. (1989) A comparison of
methods of dietary assessment in Australian children aged
11–12 years. Eur J Clin Nutr 43, 663–673.
39. Rasanen L (1979) Nutrition survey of Finnish rural children. VI.
Methodological study comparing the 24-hour recall and the diet-
ary history interview. Am J Clin Nutr 32, 2560–2567.
40. Treadwell JR, Tregear SJ, Reston JT, et al. (2006) A system for
rating the stability and strength of medical evidence. BMC Med
Res Methodol 6, 52–70.
41. Owen CG, Martin RM, Whincup PH, et al. (2005) Effect of
infant feeding on the risk of obesity across the life course: a
quantitative review of published evidence. Pediatrics 115,
1367–1377.
42. Hertzler AA, Bowens J & Hull S (1993) Preschoolers’ reporting
of food habits. J Am Diet Assoc 93, 1159–1161.
43. Stein AD, Shea S, Basch CE, et al. (1991) Variability and track-
ing of nutrient intakes of preschool children based on multiple
administrations of the 24-hour dietary recall. Am J Epidemiol
134, 1427–1437.
44. Berenson GS (2002) Childhood risk factors predict adult
risk associated with subclinical cardiovascular disease.
The Bogalusa Heart Study. Am J Cardiol 90, 3L–7L.
45. McGill HC Jr, McMahan CA, Herderick EE, et al. (2000)
Origin of atherosclerosis in childhood and adolescence. Am J
Clin Nutr 72, Suppl. 5, 1307–1315.
46. Cypel YS, Guenther PM & Petot GJ (1997) Validity of portion-
size measurement aids: a review. J Am Diet Assoc 97, 289–292.
47. Vereecken CA, Covents M, Matthys C, et al. (2005) Young ado-
lescents’ nutrition assessment on computer (YANA-C). Eur J
Clin Nutr 59, 658–667.
48. Van Horn LV, Gernhofer N, Moag-Stahlberg A, et al. (1990)
Dietary assessment in children using electronic methods:
telephones and tape recorders. J Am Diet Assoc 90, 412–416.
49. Lamb MM, Ross CA, Brady HL, et al. (2007) Comparison of
children’s diets as reported by the child via the Youth/Adoles-
cent Questionnaire and the parent via the Willett food-frequency
questionnaire. Public Health Nutr 10, 663–670.
50. Rimm EB, Giovannucci EL, Stampfer MJ, et al. (1992) Repro-
ducibility and validity of an expanded self-administered semi-
quantitative food frequency questionnaire among male health
professionals. Am J Epidemiol 135, 1114–1126.
51. Fomon SJ, Ziegler EE, Nelson SE, et al. (1981) Cow milk feed-
ing in infancy: gastrointestinal blood loss and iron nutritional
status. J Pediatr 98, 540–545.
52. McKeown NM, Day NE, Welch AA, et al. (2001) Use of
biological markers to validate self-reported dietary intake in a
random sample of the European Prospective Investigation into
Cancer United Kingdom Norfolk cohort. Am J Clin Nutr 74,
188–196.
53. Jacques PF, Sulsky SI, Sadowski JA, et al. (1993) Comparison
of micronutrient intake measured by a dietary questionnaire and
biochemical indicators of micronutrient status. Am J Clin Nutr
57, 182–189.
54. Coates RJ, Eley JW, Block G, et al. (1991) An evaluation of a
food frequency questionnaire for assessing dietary intake of
specific carotenoids and vitamin E among low-income black
women. Am J Epidemiol 134, 658–671.
55. Willett WC, Sampson L, Stampfer MJ, et al. (1985) Reproduci-
bility and validity of a semiquantitative food frequency
questionnaire. Am J Epidemiol 122, 51–65.
Micronutrient assessment during childhood S117
British
Journal
ofNutrition
Dow
nloaded from https://w
ww
.cambridge.org/core . IP address: 54.39.106.173 , on 07 Jun 2020 at 02:39:42 , subject to the Cam
bridge Core terms of use, available at https://w
ww
.cambridge.org/core/term
s . https://doi.org/10.1017/S0007114509993163