dielectric properties and method of characterizing ceramic
TRANSCRIPT

Clemson UniversityTigerPrints
All Theses Theses
12-2006
Dielectric Properties and Method ofCharacterizing Ceramic Powders and MultiphaseCompositesRavi kiran KotaClemson University, [email protected]
Follow this and additional works at: https://tigerprints.clemson.edu/all_theses
Part of the Materials Science and Engineering Commons
This Thesis is brought to you for free and open access by the Theses at TigerPrints. It has been accepted for inclusion in All Theses by an authorizedadministrator of TigerPrints. For more information, please contact [email protected].
Recommended CitationKota, Ravi kiran, "Dielectric Properties and Method of Characterizing Ceramic Powders and Multiphase Composites" (2006). AllTheses. 51.https://tigerprints.clemson.edu/all_theses/51

i
OM
DIELECTRIC PROPERTIES AND METHOD OF CHARACTERIZING CERAMIC POWDERS AND MULTIPHASE COMPOSITES
_____________________________________________________
A Thesis Presented to
the Graduate School of Clemson University
______________________________________________________
In Partial Fulfillment of the Requirements for the Degree
Master of Science Material Science and Engineering
_______________________________________________________
by Ravi Kiran Kota December 2006
________________________________________________________
Accepted by: Dr. Burtrand. I. Lee, Committee Chair
Dr. Sarit Bhaduri Dr. Jian Luo
ii
ABSTRACT
Barium Titanate was the first developed ferroelectric ceramic material and it is
mostly used in capacitors. The reason behind a wide range of applications is that the
barium titanate boasts of high dielectric properties. A phase transition from cubic to
tetragonal at normal working temperatures provides enhanced dielectric properties in this
electronic material. For any application and design, the most inquired property is the
dielectric constant. Knowing or predicting the dielectric constant is very much required
as it forms the pre-requisite for the design of any component. This is the major objective
of the present work. Driven by the nanotechnology and miniaturization of electronic
devices along with volumetric efficiency, synthesis forces us to consider ever decreasing
particle size of ferroelectric materials. Therefore, when we prepare or custom design
nanoparticles, it is imperative to determine the electrical properties of the as-synthesized
particles.
To estimate the quality of a synthesized powder relative to an already existing
commercial powder, a method has been introduced to characterize the powder for
dielectric constant. Chapter 1 is mainly discussed about the crystal structure, different
phases, and the dielectric principles involved with barium titanate powder.
Chapter 2 is focused on the same method that has been introduced to measure the
dielectric constant of polymer/ceramic composites. In this work, the dielectric constant of
polyvinyl cyanoethylate/barium titanate composite was determined. The obtained results
are compared with the many available theoretical models to predict the dielectric constant

iii
of the composites. Then these results are extrapolated to comprehend the dielectric
constant values of ceramic particles as these values form the base for the design of the
composite.
Chapter 3 is focused on the determination of dielectric constant of a
polymer/ceramic composite embedded with metallic nano-particles. The same
polymer/ceramic composite that was discussed about in chapter 2 was considered with a
0.8 weight fraction of the ceramic. The precision and simplicity of the method can be
exploited for predictions of the properties of nanostructure ferroelectric polymer/ceramic
composites.
The characterization method developed and demonstrated in Chapters 2 & 3 is
further applied for the barium titanate particle characterization. Chapter 4 is dealt with the
presence of the lattice hydroxyls that is believed to be the major cause of the reduced
tetragonality in the barium titanate ceramic powder. The sub-micron commercial barium
titanate powder is treated with N-Methyl-2-Pyrrolidinon (NMP) to obtain a tetragonal
powder. The dielectric constant of a single particle of this NMP treated cubic powder is
reported to be around 64% higher than the as-received cubic powder. The dielectric
properties of the barium titante ceramic powder that is determined does depend inversely
on the lattice OH content as confirmed by FTIR spectroscopic analysis and TGA results.
OM
iv
DEDICATION
This thesis is dedicated to the memories of my late paternal grand parents Sri.
Sree Rama Murthy Kota, and Smt. Seetha Ramamma Kota. I would also like to thank my
maternal grand parents Late Sri. Sampoorna Kutumba Bhaskaram Kuchibhotla, and Smt.
Satyavati Devi Kuchibhotla, for their blessings that helped me come out with flying
colors.
v
ACKNOWLEDGEMENTS
First, I thank my advisor Dr. Burtrand I. Lee, for his continuous support in the
Masters program. Dr. Lee was always there to listen, advice and guide me from the
beginning. He taught me how to ask questions and express my ideas. He showed me
different ways to approach a research problem and the need to be persistent to accomplish
any goal. He is the person who is most responsible for helping me complete the writing
of this thesis as well as the challenging research that lies behind it. He has been a friend
and mentor. He taught me how to write academic papers and brought out the good ideas
in me. Without his encouragement and constant guidance, I could not have finished this
thesis. He was always there to meet and talk about my ideas, to proofread and mark up
my papers and chapters, and to ask me good questions to help me think through my
problems (whether philosophical or analytical). Thanks, Dr. Lee! I hope our relation
flourishes and you would be as helpful as you were, all through my professional career.
Besides my advisor, I would like to thank the rest of my thesis committee: Dr.
Sarit Bhaduri and Dr. Jian Luo for their friendship, encouragement, good questions,
insightful comments and reviewed my work on a very short notice. During the course of
this work, at Clemson University (Spring 2005 – Fall 2006), I was supported in part by
Teaching Assistanship and Research Assistantship. Thanks to Dr. Kathleen Richardson,
Director, School of Material Science & Engineering. Let me also say ‘thank you’ to the
following people though they are elsewhere. Dr. Jin Hwang and Dr. Ashraf Ali, whose
stay here as Post-Doctorates, greatly helped me in my thesis take-off. Thanks to Kim
Ivey, for always being there and helping me with the thermal characterization techniques.

vi
Kim, you are great! I am also greatly indebted to many teachers in the past: Mr. Sailesh
Kumar for getting me interested in basic mathematics and science concepts. Thanks to
Dr. Viplava Kumar, for introducing me to Metallurgy & Material Technology and
teaching me all the intricacies of the subject and related skills. Dr. Ajit James and Dr.
Narayana Murty deserve a special mention. After hearing my complaints and frustration
with the ability of the state of material science, they helped me develop my idea and
vision of what materials can do for scientists & engineers.
I appreciate my group members Gopi, Venkat, Prem, Radhika, Sujaree and
Hiroki, for their words and suggestions that boosted my courage and determination to
finish my research work and write this thesis. I extend my thanks to my friends, Sunil &
Sunil, Kaushik, Vinod, Kiran, Anand, Ajay, Abhilash, Ram, Jeetu, and above all Gopi
here in United States, Satish in Europe and Anil, Prabhakar, Ravi, Suresh and Chandu,
back in India. This thesis would be incomplete without a mention of the support given me
by my beloved friend, Aparna, who accompanied me in each and every aspect of my life.
Last, but not least, I thank my family: my parents, Venkata Ramana Kota and Sita
Rama Lakshmi Kota, for giving me life in the first place, for educating me with aspects
from both arts and sciences, for unconditional support and encouragement to pursue my
interests and for reminding me that my research should always be useful and serve good
purposes, my brother, Naveen Kota, for believing in me.

vii
TABLE OF CONTENTS
Page
TITLE PAGE .......................................................................................................... i ABSTRACT............................................................................................................ ii DEDICATION ........................................................................................................ iv ACKNOWLEDGEMENTS .................................................................................... v LIST OF TABLES .................................................................................................. ix LIST OF FIGURES................................................................................................. x PREFACE ............................................................................................................... xii CHAPTER 1. INTRODUCTION.................................................................................... 1
2. DIELECTRIC PROPERTIES OF TWO-PHASE BARIUM TITANTATE/CYANOETHYL ESTER OF POLYVINYL ALCOHOL COMPOSITE IN COMPARISON WITH THE EXISTING THEORETICAL MODELS................................... 10
Abstract .............................................................................................. 10 Introduction ........................................................................................ 11 Materials & Procedure ....................................................................... 13 Results & Discussion ......................................................................... 15 Conclusions ........................................................................................ 25
3. DIELECTRIC PROPERTIES OF THREE-PHASE BARIUM TITANATE/CYANOETHYL ESTER OF POLYVINYL ALCOHOL/SILVER COMPOSITE.................................................. 27
Abstract .............................................................................................. 27 Introduction ........................................................................................ 27 Materials & Procedure ....................................................................... 30 Results & Discussion ......................................................................... 32 Conclusions ........................................................................................ 37

viii
Table of Contents (Continued)
4. EFFECT OF LATTICE HYDROXYL ON THE PHASE TRANSITION AND DIELECTRIC PROPERTIES OF BARIUM TITANATE PARTICLES................................................. 39
Abstract .............................................................................................. 39 Introduction ........................................................................................ 40 Materials & Procedure ....................................................................... 41 Results & Discussion ......................................................................... 44 Conclusions ........................................................................................ 61 REFERNCES .......................................................................................................... 63

ix
LIST OF TABLES
Table Page 1. Different sample mixtures used in the study of the synthesis of
Barium Titanate/Cyanoethyl Ester of Polyvinyl Alcohol Composite........................................................................................ 14
2. Amount of lattice OH content with respect to temperature aged in acidic and basic waters based on FTIR analysis ........................ 53
3. Amount of lattice OH content with respect to temperature aged in acidic and basic waters based on TGA results ........................... 55
4. Variations in OH content, dielectric constant and dielectric loss values with respect to different pH treatments of barium titanate powder ............................................................................... 61

x
LIST OF FIGURES
Figure Page 1. Perovskite structure of BaTiO3 ............................................................... 1 2. (a) Perovskite structure of BaTiO3 above Curie point ............................ 2 (b) a-axis projection of tetragonal BaTiO3 with atomic displacements ................................................................................. 2 (c) [TiO6] octahedron in tetragonal phase showing displacement of Ti along c-axis............................................................................ 2 3. Lattice parameters of single crystal BaTiO3 as a function
of temperature ................................................................................ 4
4. Temperature and relative dielectric constant εa and εc for single crystal BaTiO3................................................................ 7
5. Dielectric constant values vs. ceramic volume % (BT 8 and Castor oil)...................................................................... 17 6. Dielectric constant values vs. ceramic volume % (BT 8 and CEPVA with other theoretical models) ........................ 19 7. Dielectric constant values vs. ceramic volume %
(BT 8 and CEPVA) ........................................................................ 20
8. Dielectric constant values vs. ceramic volume % (BT 8 and CEPVA – Lichtenecker model) .................................... 20
9. Dielectric constant values vs. ceramic volume % (BT 8 and CEPVA – Smith model)................................................ 22
10. Dielectric constant values vs. ceramic volume (BT 8 and CEPVA – Maxwell model) ......................................... 22
11. Dielectric constant values vs. ceramic volume % (BT 8 and CEPVA – Yamada model) ........................................... 24

xi
List of Figures (Continued) Figure Page 12. Dielectric constant values of Cermetplas (0.8 wt. fraction BT) vs. silver volume % ...................................................................... 35 13. Loss factor values of Cermetplas (0.8 wt. fraction BT) vs. silver volume % ...................................................................... 36 14. Partial XRD pattern of BT – before and after NMP treatment
(NMP treatment showing the peak split at 45ºC).......................... 46
15. DSC curve showing the tetragonal-to-cubic transition in the NMP treated barium titanate powder during the process of increasing the temperature ....................................................... 48 16. FTIR spectra of BT- before and after NMP treatment
showing the OH vibration at 2600 – 3600 cm-1 ........................... 49
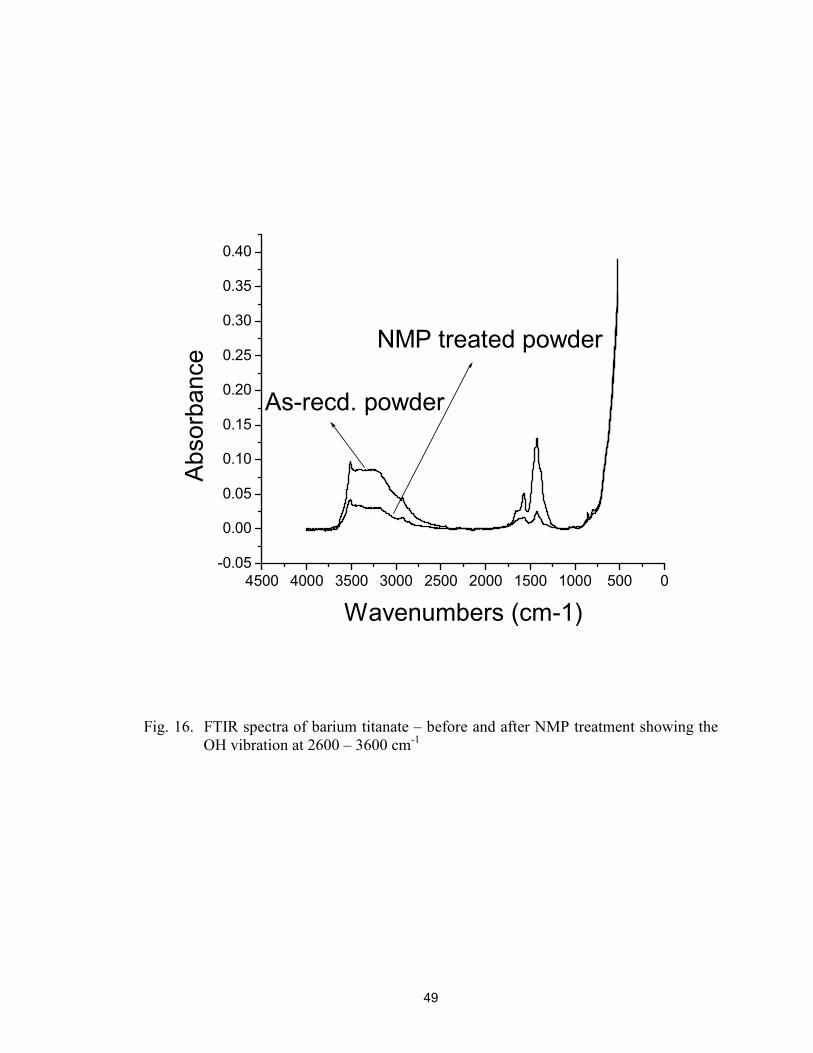
17. (a)FTIR spectra of calcined BT aged in acidic water.............................. 51 (b)FTIR spectra of calcined BT aged in basic water............................... 52 18. (a)TGA curves for BT aged in acidic water ............................................ 54 (b)TGA curves for BT aged in basic water ............................................. 54 19. Dielectric constant values for NMP treated BT
vs. ceramic volume % ................................................................... 56
20. (a)Dielectric constant values of BT aged in acidic water as a function of calcining temperature .......................................... 57 (b)Dielectric constant values of BT aged in basic water as a function of calcining tempetrature ......................................... 58
21. (a)Dielectric properties of BT aged in acidic water with increasing OH content........................................................... 59 (b)Dielectric properties of BT aged in basic water with increasing OH content........................................................... 60

xii
PREFACE
Our goal of this project was to characterize ceramic powders and composites
which are used as embedded capacitors. This work was systematically divided into three
parts. The first part deals with the characterization of two-phase barium
titanate/cyanoethyl ester of polyvinyl alcohol (polymer/ceramic) composite in
comparison with the existing theoretical models by developing a different method of
determining the dielectric constant. Commercial barium titanate and the polymer
obtained from Russia were used as raw materials. The second part of the project deals
with the incorporation of silver conducting particles into the polymer/ceramic matrix,
using the principle of percolation. The last part of the thesis deals with phase transition
and the related OH group effect on the dielectric properties of barium titanate.

1
Chapter 1
Introduction
Barium titanate has a typical perovskite structure which is shown in Fig.1.
Perovskite materials, with general stoichiometry as ABO3, represent a unique class of
crystalline solids that demonstrate a variety of interesting dielectric, piezoelectric,
ferroelectric, and electro-optic properties. The unique properties of perovskite materials
are the result of the crystal structure, phase transitions as a function of temperature, and
the size of the ions present in the unit cell.
Fig. 1. Perovskite structure of BaTiO3.

2
Fig. 2. (a) Perovskite structure of BaTiO3 above Curie point, (b) a-axis projection of tetragonal BaTiO3 with atomic displacements, and (c) [TiO6] octahedron in tetragonal phase showing displacement of Ti along c-axis.
c-axis
OI
OII
c-axis OII
OI
2.00 Å
1.86 Å
2.17 Å
(a)
(b)
(c)
O2-
Ba2+
Ti4+
c
a
b

3
The barium ions reside at the corners of the cubic forming a close-packed
structure along with the oxygen ions, which occupy the face center of the cubic. Each
barium ion is surrounded by twelve oxygen ions and each oxygen ion is surrounded by
four barium ions and eight oxygen ions. In the center of the face-centered cubic unit cell,
the small highly charged titanium (Ti4+) ion is octahedrally coordinated by six oxygen
ions.
The lattice parameter of BaTiO3 is slightly larger than that of the ideal perovskite
due to the size of barium ions. Because of the large size of the barium ions, the octahedral
interstitial position in BaTiO3 is quite large compared to the size of the titanium ions. To
some extent, the titanium ions are too small to be stable in these octahedral positions and
tend to position themselves in an off-centered position resulting in an electric dipole.
Since each titanium ion has a + 4 charge, the degree of the polarization is very high.
When an electric field is applied, titanium ions can shift from random positions to aligned
positions and result in high bulk polarization and a high dielectric constant.
The crystal structure and dielectric characteristics of BaTiO3 strongly depend on
temperatures. Above the Curie point, 130 °C, the unit cell of BaTiO3 is cubic as shown in
Fig. 3. When the temperature is below the Curie temperature (130oC), the cubic structure
is slightly distorted to a ferroelectric tetragonal structure having a dipole moment along
the c direction. When the temperature goes down below 5oC, the tetragonal structure will
transform to an orthorhombic ferroelectric phase with the polar axis parallel to a face
diagonal. When the temperature goes down further to -90 oC, it will transform to a
rhombohedral structure with the polar axis along a body diagonal.

4
Fig. 3. Lattice parameters of single crystal BaTiO3 as a function of temperature
In the temperature range of 5o to 130oC, the crystal is spontaneously polarized
along a <100> direction, accompanied with tetragonal symmetry. In the range of –90o
and 5oC, the crystal symmetry is orthorhombic and the direction of spontaneous
polarization transfers to a pseudocubic <110>, a face diagonal of the former cubic cell.
Around –90oC, a further transition to rhombohedral symmetry spontaneously polarized
along a body diagonal takes place. These three transitions exhibit different electrical
properties near the transition temperatures.
-100 -50 0 50 100 150
3.98
3.99
4.00
4.01
4.02
4.03
4.04
4.05
a
a=b
c
b
a=c
a
ParaelectricFerroelectric
CubicTetragonalOrthorhombicRhombo
-hedral
O
Lattice spacing (Α)
Temperature (oC)

5
It results in a large change of the Ti-O bond length compared to a small change in
the Ba-O bond during the cubic to tetragonal phase change. A perovskite lattice structure,
the displacement of the Ti4+ and O2- ions and the slight distortion of oxygen octahedra
during the cubic to tetragonal phase transition are shown in Fig. 2. These ionic
displacements also result in a change in lattice dimensions, and a negative linear thermal
expansion coefficient along the c-axis, while a thermal expansion coefficient is usually
positive due to a-, b-axes expansion. As shown in Fig. 3, the crystal structure of BaTiO3
becomes less and less tetragonal as the temperature increases toward the tetragonal to
cubic transition temperature.
Size effects in nanostructured materials are of great importance from both
fundamental considerations and practical applications. The properties and behavior of
macroscopic ferroelectric systems are, in principle, well known. An area, which is poorly
understood at best, is so-called size effect. Initial research on size effects in ferroelectrics
has concentrated on BaTiO3, with the desire to understand the governing mechanisms
that control the performance of multilayer capacitors as a function of layer thickness.
However, in ferroelectric fine particles, it was known that ferroelectricity
decreases with decreasing particle and grain sizes, and disappears below a certain critical
size. The preferred tetragonal phase of BaTiO3 may be unstable at room temperature for a
crystallite size below a certain size and then the stable phase is cubic. Therefore, the size
effect in ferroelectrics such as BaTiO3 can be considered to be one of the most important
phenomena for an interest to the industry as well as to the scientific community.
BaTiO3 must be modified to shift its Curie point to lower temperatures and
improve the temperature coefficient of capacitance for use in capacitor devices. During

6
the past few decades, extensive work has been conducted to modify the dielectric
properties of BaTiO3 for capacitor applications by introducing different additives. In
general, there are three ways to alter the structure and modify the properties of BaTiO3:
substitute smaller divalent ions for barium, substitute larger tetravalent ions for titanium
and nonisovalent donor or acceptor doping, which is used to modify phase structure and
the subsequent electrical behavior of BaTiO3 dielectrics.
Dielectric properties of BaTiO3
Cubic BaTiO3 has paraelectric properties which show no displacement of ions,
and hence, results in low dielectric permittivity. On the other hand, tetragonal BaTiO3
shows ferroelectric properties which are more interesting properties of BaTiO3 for
dielectric applications. The temperature dependence of the relative permittivity of
BaTiO3 measured in a and c directions is shown in Fig. 4.
An explanation for why the dielectric constant along the c-axis is less than that
along the a-axis is that oxygen ions in the c-axis, which is also cell polar axis, make
strong ionic attractions with the central Ti4+ ion. This gives an interaction force between
the Ti4+ and O2- ions which makes vibration difficult because of a “pinning” effect under
an external AC source. On the other hand, oxygen ions in the a- and b-axes are relatively
free to vibrate perpendicularly to this c-axis, consequently, the dielectric constants along
a- and b-axes are higher.

7
Fig. 4. Temperature and relative dielectric constant εa and εc for single crystal BaTiO3
In the vicinity of the Curie point, the stability of the lattice decreases, and the
amplitude of the vibration becomes higher. This induces a high dielectric constant at the
Curie point. Based on these dielectric properties of a single crystal, we can infer the
dielectric behavior of the polycrystalline sample or powder which is the starting material
for MLCC fabrication. Although the basic dielectric properties are well known, it is
worthwhile to note that the physical parameters related to the phase transition are affected
by chemical purity, surface defects, particle size and sintering conditions.
Among these factors, understanding the relationship between particle size and
tetragonality is especially important. This is because a recent preference for producing
thinner dielectric layers and lowering sintering temperatures is dependent on fine particle
-160 -120 -80 -40 0 40 80 120 160
0
2000
4000
6000
8000
10000
c-axis
a-axis
Dielectric constant
Temperature (oC)

8
size. Generally, the belief is that there is a decrease in tetragonality, which is the c/a ratio,
with decreasing particle size. This critical size difference may come from the different
residual elastic strain energy, chemical impurity level and crystalline defects. Moreover,
the tetragonal to cubic change is a gradual transition, and there is no clear one size factor
dividing the phase completely.
Principles of Dielectrics
Dielectrics and insulators can be defined as materials with high electrical
resistivities. A good dielectric is, of course, necessarily a good insulator, but the converse
is by no means true. Dielectric properties, dielectric constant, dielectric loss factor, and
dielectric strength will be interpreted as follow.
Capacitance
The principal characteristic of a capacitor is that an electrical charge Q can be
stored. The charge on a capacitor is given in equation 1.
Q=CV (1)
where V is the applied voltage and C is the capacitance. The capacitance C contains both
a geometrical and a material factor. For a large plate capacitor of area A and thickness d
the geometrical capacitance in vacuum is given by equation 2.
C0=(A/d)*ε0 (2)
where ε0 is the permittivity (dielectric constant) of a vacuum. If a ceramic material of
permittivity ε΄ is inserted between the capacitor plates,
C=C0*(ε΄/ε0)=C0K (3)

9
where K is the relative permittivity or relative dielectric constant, then the capacitance
can be shown in equation 3. This is the material property that determines the capacitance
of a circuit element.
Dielectric loss factor
The loss factor ε˝, as shown in equation 4, is the primary criterion for the
usefulness of a dielectric as an insulator material.
ε˝=tanδ/ε΄ (4)
In equation 4, ε΄ is dielectric constant defined above, while tanδ is the dissipation factor.
For this purpose it is desirable to have a high dielectric constant and particularly a very
small loss angle. Applications that are desirable to obtain a high capacitor in the smallest
physical space, the high dielectric constant materials must be used and it is equally
important to have a low value for the dissipation factor, tanδ.
Dielectric strength
Dielectric strength is defined when the electric field is just sufficient to initiate
breakdown of the dielectric. It depends markedly on material homogeneity, specimen
geometry, electrode shape and disposition, stress mode (DC, AC or pulsed) and ambient
conditions.

10
Chapter 2
Dielectric Properties of Barium Titanate/Cyanoethyl Ester of Polyvinyl Alcohol
Composites in Comparison with the Existing Theoretical Models
Abstract
A unique method has been introduced to measure the dielectric constant of
polymer/ceramic composites using an effective medium instead of using the general
methods of preparing bulk sintered pellets or films. In this work, a new and a simple
method has been applied to measure the dielectric constant of polyvinyl
cyanoethylate/barium titanate composite. The results are obtained by dispersing the
ceramic powders in the polymer of a relatively low dielectric constant value. The
dielectric constant of the composite is measured with varying ceramic volume
percentages. The obtained results are compared with the many available theoretical
models that are generally in practice to predict the dielectric constant of the composites.
Then these results are extrapolated to comprehend the dielectric constant values of
ceramic particles as these values form the base for the design of the composite. The
precision and simplicity of the method can be exploited for predictions of the properties
of nanostructure ferroelectric polymer/ceramic composites.

11
Introduction
Passive components in an electronic system are those electrical elements which
support the active components and are characterized as resistors, inductors, and
capacitors. Discrete passives are considered to be the major barrier of the miniaturization
of electronic system. Assimilation of passives provides the components with the
advantages like better electrical performance, higher reliability, lower cost, and improved
design options [1].
Currently, interest in passive components is increasing for miniaturization and
better electrical performance of electronic packages. Among various kinds of passives,
focus is on decoupling capacitors, which are used for simultaneous switching noise
suppression [2]. The science of embedded capacitor is a sophisticated technology with
the congregation of both performance and functionality requirements for future electronic
devices. One of the major hindrances for implementing this technology is the lack of
dielectric materials with promising dielectric properties.
Polymer based composite is considered as a solution to the problem mentioned
hitherto. Developing a composite with compatible high dielectric constant material is the
major challenge of the integral capacitor technology. Polymer/ceramic composites can be
used in forming capacitors because they combine the process ability of polymers and
high dielectric constant of ceramics. One of the promising embedded capacitor materials
is a polymer/ceramic composite which is a ceramic particle-filled polymer. It is a material
utilizing both high dielectric constant of ceramic powders and good process ability of
polymers. Particularly epoxy/ceramic composites have been investigated and studied due
to their compatibility with printed writing boards (PWB) [3-9].

12
It is very important for composite material design to precisely understand the
dielectric constant of ceramic particles. Many methods and models, with several
quantitative rules, have been developed to predict the dielectric constant of heterogeneous
two component composites counting on the basis of dielectric properties of each
component, i.e., both ceramic and polymer [10-13]. However, while different models
have been developed, usually little or no experimental evidence was provided to support
the derived equations. So ambiguity still prevails in which model is more useful for the
prediction of the effective dielectric constant of the composites.
Polymers filled with ceramics have been studied for use as dielectric materials in
thick film capacitors [14]. Ceramic particle size influences the effective dielectric
constant of composite dramatically. Precise prediction of the effective dielectric constant
of polymer/ceramic nanocomposites forms the focal point for the design of composite
materials. Many theoretical models have been proposed in the literature for simulating
the electrical properties of the composites. Mostly, composite dielectrics are statistical
mixtures of several components.
The models mentioned are empirical models to describe the polymer/ceramic
nanocomposite property. Other efforts also have been made to predict the dielectric
properties of composite using percolation theory [15–18]. The major interest in the
physics of disordered materials lies in relating the macroscopic property of interest like
permittivity, conductivity, etc. The effective-medium theory (EMT) is also used to set up
a numerical model that can precisely predict the dielectric constant of polymer/ceramic
nanocomposite [22]. The major factors that affect the dielectric properties of barium
titanate ceramics are the grain size, phase contents and the types of dopants used [19-21].

13
Thus the dielectric property of composite can be treated in terms of an effective medium
whose dielectric permittivity can be obtained by a suitable averaging over the dielectric
permittivity of the two constituents [25].
For polymer/ceramic composites, the perovskite-type barium titanate is in the
powder form instead of the sintered form. The removal of grain boundaries, elimination
of constrained forces from neighboring grains and a drop in domain density due to
decrease in the particle size will reduce the dielectric constant of BT powders [23,24].
Hence, sintered and unsintered powders of BT show a different dielectric behavior.
Our work deals with a composite medium composed of dispersed unsintered
ceramic within the polymer with the sole intention of minimizing voids or pores. Though
this is a relative way of characterizing the composite for dielectric constant values, the
method seemed interesting and reliable for measuring the dielectric constant values of the
composites and these results are hence used to extrapolate linearly only to achieve the
dielectric constant value of the unsintered ceramic powder.
Materials & Procedure
The polymer/ceramic composites are prepared using the commercial ceramic powder,
Cabot BT-8 (BT), (hydrothermal powder with a mean particle size of 0.2µm obtained
from Cabot Performance Materials, Boyertown, PA), a cyanoethyl ester of polyvinyl
alcohol (CEPVA) kindly provided by Plastpolymer J.S.Company via St. Petersburg State
Institute of Technology, Russia, Castor oil, Eur. Pharm. grade, having a density of 0.957
g/cc obtained from Acros Organics and BYK-W 9010 from BYK-Chemie which is a
dispersant used for a better dissolution of the ceramic powder. N,N - dimethyl formamide
14
(DMF) from Fisher and 2-methoxyethanol from Aldrich were used as the solvents
without any prior treatment and further purification.
DMF and 2-methoxyethanol were mixed in a 1:1 volume ratio and the solid
polymer was dissolved maintaining the temperature at around 65° C. The amount of solid
polymer added was adjusted to get a final polymer concentration of 30% by weight. After
dissolution, the solution was cooled to room temperature and magnetic stirring was
continued for 12 hr in a teflon jar to obtain a clear transparent pale yellow solution. The
solution was stable over a period of several weeks and did not show any signs of
turbidity. In a different teflon jar, a 50% by weight suspension of the commercial ceramic
powder was prepared by agitation by magnetic stirring in a similar mixed solvent of 1:1
DMF and 2-methoxyethanol.
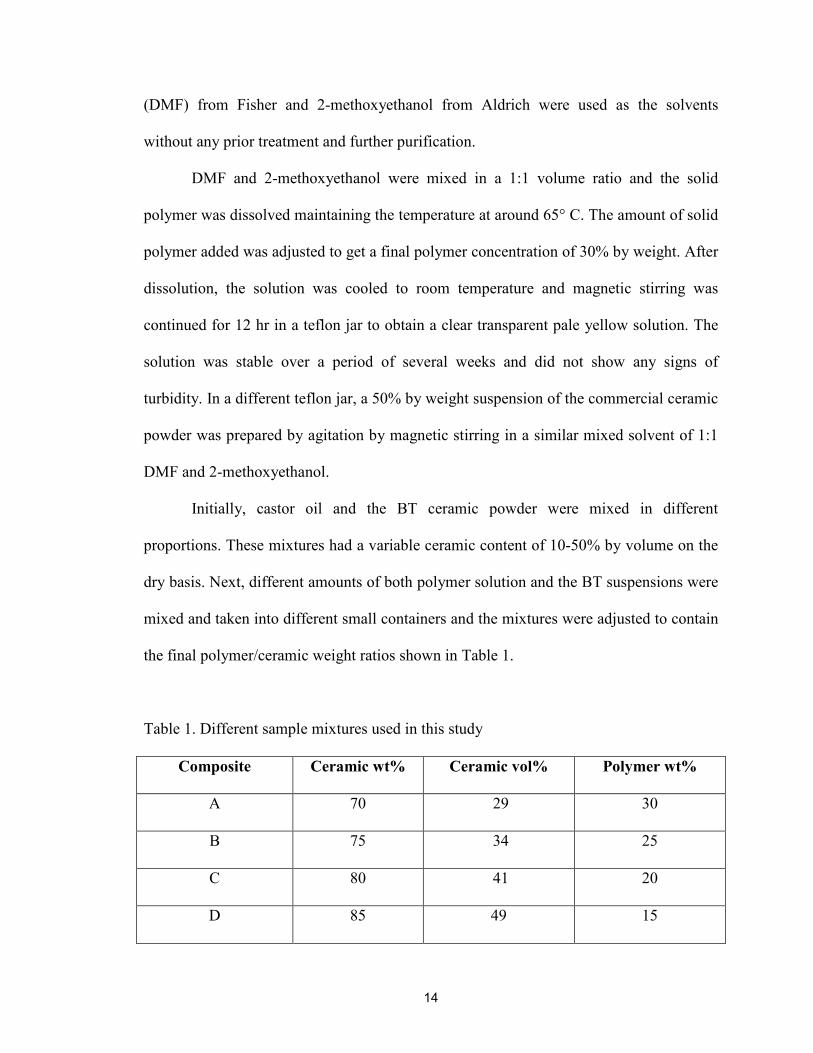
Initially, castor oil and the BT ceramic powder were mixed in different
proportions. These mixtures had a variable ceramic content of 10-50% by volume on the
dry basis. Next, different amounts of both polymer solution and the BT suspensions were
mixed and taken into different small containers and the mixtures were adjusted to contain
the final polymer/ceramic weight ratios shown in Table 1.
Table 1. Different sample mixtures used in this study
Composite Ceramic wt% Ceramic vol% Polymer wt%
A 70 29 30
B 75 34 25
C 80 41 20
D 85 49 15

15
The prepared mixtures were then gently dried at 80°-90° C under both continuous
magnetic stirring and mildly reduced pressure to get rid of the solvents where viscous
slurries/pastes were obtained. The dried composites were then kept under reduced
pressure and used for further characterization.
The capacitor is fabricated using the same procedure that was followed in our
earlier work [26] and is characterized for capacitance. Dielectric constants of the
composites were determined by preparing four specimens in a slurry/paste form free from
pores composed of different volume fractions of BT particles and polymer followed by
filling the teflon cell with aluminum plate electrodes. The capacitance was measured at 1
MHz using HP 4284A Precision LCR Meter. The dielectric constant values (Ks) were
calculated from the measured capacitance data using the equation 5.
C = ε0 KA/t (5)
Where ε0 = dielectric permittivity of the free space, 8.854 X 10⁻¹² F/m
A = area of the electrode and ceramic contact area, 1 cm2
t = thickness of the ceramic specimen, 0.4 cm
The dielectric constant of all the samples was determined using the capacitance values.
The values thus obtained were plotted and compared with the known theoretical models
to make sure that this method is consistent and reliable.
Results & Discussion
Dielectric constant values of the different composite samples were calculated
from the measured capacitance data using the equation 5. The dielectric constant values
obtained by using castor oil as the second phase are plotted in Fig. 5.

16
The values using the polymer as the second phase are also obtained. These values
are plotted against the theoretical models shown in Fig. 6. The values indicate that at 50
volume% of the ceramic the dielectric constant of the composite is 89 which is
considerably higher than the values predicted by the theoretical models.
A composite with a higher volume% of the ceramic could not be fabricated as
higher content of the filler leads to a non-uniform functional layer. Extrapolating the
dielectric constant results that are plotted against the ceramic volume fractions in Fig. 5
gives the dielectric constant of ceramic particle as 178.
The experimental results of the dielectric constant values of the composite are
plotted against the ceramic volume fractions in Fig. 7 and extrapolating this plot gives the
dielectric constant of ceramic particle as 171. Both the composites with castor oil and the
polymer show the dielectric constant values in the same range.

17
10 20 30 40 50
20
30
40
50
60
70
80
90
Dielectric constant
Ceramic vol%
Fig. 5. Dielectric constant values vs. ceramic volume % (BT 8 & Castor oil)

18
The true value of permittivity of a statistic composite should lie between the
values determined by Lichtenecker equation. The dielectric behavior of statistic systems
has been analyzed by many scientists and many equations have been derived based on
experimental results and theoretical derivation. The most commonly used equation is the
Lichtenecker logarithmic law of mixing and is written for a two-component system as
shown in equation 6 & equation 7 is a modified form of Lichtenecker equation, where k
is a fitting constant subject to composite material. It is reported that k has a value around
0.3 for most well-dispersed polymer/ceramic composites [12].
log ε = vp log εp + vc log εc (6)
log ε = log εp + vc(1-k) log (εc/εp) (7)
where vp = volume fraction of polymer
vc = volume fraction of the ceramic
εp = dielectric constant of the polymer
εc = dielectric constant of the ceramic
The logarithm of dielectric constant results are plotted against the ceramic volume
fractions in Fig. 8.

19
20
30
40
50
60
70
80
90
100
20 25 30 35 40 45 50 55 60
Ceramic vol%
Dielectric constant
Experimental results Jayasundere-Smith model
Yamada model Maxwell-Wagner model
Fig. 6. Dielectric constant values vs. ceramic volume % (BT 8 & CEPVA with other theoretical models)

20
25 30 35 40 45 50
55
60
65
70
75
80
85
90
Dielectric consatnt
Ceramic vol%
Fig. 7. Dielectric constant values of the composite vs. BT volume % (BT 8 & CEPVA)
25 30 35 40 45 50
1.75
1.80
1.85
1.90
1.95
log(Dielectric constant)
Ceramic vol%
Fig. 8. log ε values of the composite vs. BT volume % (BT 8 & CEPVA – Lichtenecker
model)

21
Based on this result, after linear fitting or extrapolating the curve the dielectric
constants of the ceramic and the polymer were estimated and the results obtained were as
follows.
εc = dielectric constant of ceramic, 170
εp= dielectric constant of the polymer, 21.7 ~ 22, which corresponds to the value
provided by Plastpolymer J.S.Company in Russia. Using these dielectric constant values
some predictions of the theoretical models have been considered for comparison.
Jayasundere and Smith [11] have worked together in deriving an equation which was
modified from the well-known Kerner equation by including interactions between
neighboring spheres for the measurement of dielectric constant of binary composites and
the equation is shown in equation 8
(8)
where vp = volume fraction of polymer
vc = volume fraction of the ceramic
εp = dielectric constant of the polymer
εc = dielectric constant of the ceramic
The dielectric constant results are plotted against the ceramic volume fractions in Fig. 9
and extrapolating this plot gives the dielectric constant of ceramic particle as 161.
The Maxwell-Garnett mixing rule was initially used in a system where metal particles are
encapsulated in an insulating matrix [13]. But in recent times the same mixing rule is
applied for ceramic particle inclusions.

22
25 30 35 40 45 50
50
55
60
65
70
75
80
Dielectric constant
Ceramic vol%
Fig. 9. Dielectric constant values vs. BT volume % (BT 8 & CEPVA – Smith model)
25 30 35 40 45 50
38
40
42
44
46
48
50
52
54
56
58
Dielectric constant
Ceramic vol%
Fig. 10. Dielectric constant values vs. BT volume % (BT 8 & CEPVA – Maxwell model)

23
This mixing rule is then modified and the effective dielectric constant for a
polymer/ceramic composite incorporating homogeneous distribution of spherical ceramic
material can be determined by this equation developed by Maxwell and Wagner [12]
which is known as Maxwell-Wagner mixing rule and is shown in equation 9.
(9)
where vc = volume fraction of the ceramic
εp = dielectric constant of the polymer
εc = dielectric constant of the ceramic
The dielectric constant results are plotted against the ceramic volume fractions in Fig. 10
and extrapolating this plot gives the dielectric constant of ceramic particle as 110.
Yamada have studied the polymer/ceramic binary system and proposed a model
using the properties of its constituent materials [10]. Considering the system to comprise
ellipsoidal particles dispersed continuously, the dielectric constant is given by the
equation 10.
(10)
where n = 0.2, morphology factor depending on the shape of ellipsoidal particles on the
surface of the film in his model.
vc = volume fraction of the ceramic

24
εp = dielectric constant of the polymer
εc = dielectric constant of the ceramic
The dielectric constant results are plotted against the ceramic volume fractions in Fig. 11
and extrapolating this plot gives the dielectric constant of ceramic particle as 135.
25 30 35 40 45 50
40
45
50
55
60
65
Dielectric constant
Ceramic vol%
Fig. 11. Dielectric constant values of the composite vs. BT volume % (BT 8 & CEPVA – Yamada model)

25
Conclusions
After a thorough analysis of the results obtained, the dielectric constant values of
these slurry composites calculated from the capacitance values are 0-35% higher than the
values predicted by the most relied theoretical models. Hence the unique method that is
developed and adapted in determining the dielectric constants of two phase
polymer/ceramic composite is definitely useful in the prediction of electrical properties of
such composites. Extrapolating these results, the dielectric constant of ceramic particles
is observed to be 171 as calculated from this method while dielectric constant predicted
by Lichtenecker, Smith, Maxwell-Wagner and Yamada are 170, 161, 110 and 135
respectively considering the values obtained are relative.
It is well-known that polymer/ceramic composites were synthesized,
characterized and are widely used in various applications [27-29]. But majority of
researchers considered epoxy as the second phase. The dielectric constant value was
reported as 35 at 0.5 volume fraction of ceramic with modified high dielectric, low
viscosity resin [27], 48 at 0.5 volume fraction of ceramic with photo-definable epoxies
[28], 45 at 0.4 volume fraction of self-synthesized BT ceramic with epoxy [24], 65 at 0.6
volume fraction of BT with epoxy and the dielectric constant value falls down abruptly
[8], and 45 at 0.6 volume fraction of BT which increased to 65 at 0.7 volume fraction of
BT with epoxy [29]. Hence, by considering CEPVA as the second phase in this study,
there was an increase in the dielectric constant value of the composite at the same volume
fractions when compared to the values of the composites already known.
This method can also be used for a three phase composite considering the ratio of
two phases to be constant. The precision and simplicity of this method can be exploited

26
for predictions of the properties of nanostructure ferroelectric polymer/ceramic
composites.

27
Chapter 3
Dielectric Properties of Three-Phase Barium Titanate/Cyanoethyl Ester of Polyvinyl
Alcohol/Silver Composites
Abstract
Three phase ceramic/metal/plastic (Cermetplas) percolative nanocomposites were
prepared. A cyanoethyl ester of polyvinyl alcohol (CEPVA) was used as the base
polymer to prepare the composites. Silver nanoparticles were prepared and used as the
conducting phase. Nanocomposites of barium titanate particles embedded in CEPVA
matrix, with silver as metallic inclusion, were characterized using the unique technique
that was developed. The dielectric constant/permittivity, and loss tangent factor
measurements were reported and discussed for Cermetplas composites below the
percolation threshold. Experimental results show that a dielectric constant of above 320
could be achieved and the loss factor to be 0.05 below the percolation limit.
Introduction
Polymer/ceramic composites have drawn great interest recently as dielectric
composite materials because of their ease of processability. There has been extensive
research on these ceramic filled dielectric composites by many groups [30-35]. Need for
high dielectric constant materials, makes it obvious to increase the ceramic loading in the
polymer. But addition of ceramic itself will not help in achieving the requirements. Thus,
metallic particles are introduced into the polymer/ceramic composite. On the other hand,
28
there have been reports of a high dielectric constant, but the metal/ceramic composites
still need to be sintered at high temperatures [36-38].
In this study we report high dielectric constant values of three-phase composites.
Silver has been introduced into the optimized polymer/ceramic matrix. The formulation
for these composites was based on the effective dielectric constant prediction equations
and the percolation theory [39-42]. Several researchers have found experimental evidence
of an increase in the dielectric constant of the composite in the neighborhood of the
percolation threshold [38,39,43-46]. A very high dielectric constant value can be obtained
at conductive filler loading close to the percolation threshold taking care that the filler
content does not exceed the threshold value. The percolation theory can be applied to
analyze such composites when the metallic filler composition is close to the percolation
threshold [29,30].
Metal particles can be polarized in the same way as dielectric ceramics, if
insulated from the electrodes. In this case the polarization is caused by the electrons
rather than ions. The only difference is that the polarization is caused by the displacement
of free electrons rather than ions. Although the dielectricity of metal particles can not be
characterized by the dielectric constant, it is this "dielectricity" (polarization) causes the
enhancement of dielectric constant of the metal/polymer composites. This is the reason
for metal/polymer composites showing increased dielectric constants [47-49].
Nevertheless, the accumulated polarization will disappear when the insulation between
filler particles is broken by direct contact of particles or electron tunneling. The charge
will be transported through the formed filler network to the electrodes. The probability of
forming a giant particle network between the two electrodes is proportional to the particle

29
concentration, which is known as percolation [50]. As soon as such a conducting channel
is formed, the free charges in fillers will merge with the outside current, and dielectricity
is lost. For composites with conducting fillers, the occurrence probability of percolation
will become nearly unity at certain filler concentration, which is known as the percolation
threshold. The dielectric constants of conductor-insulator composites near the threshold
were usually modeled by the scaling theory [50].
When a giant percolative particle cluster forms, a conducting network is formed
between electrodes. The dielectric constant of the material will sharply decrease to almost
zero and dielectric loss will be extremely high. Therefore, although high dielectric
constants near the percolation threshold are attractive to researchers, the risk of
percolation should also be considered for practical applications. Therefore, to utilize the
divergent behavior of the dielectric constant of a metal/polymer composite for the
dielectric applications, measures have to be taken to prevent the occurrence of
percolation. For practical applications, it will be worthy to eliminate the risk of
percolation.
In our study, nanoparticles of silver have been used, with an aim of forming a
large number of microcapacitors to achieve higher dielectric constants. Silver was
selected as the metal filler material because of several reasons. First, silver is an excellent
conductor. Secondly, silver is a noble metal which can be easily reduced to form metal
particles. Third, the chemical methods for preparing silver nanoparticles are well
developed. Finally, the cost of silver is relatively lower than those for gold or platinum.
These nanoparticles were synthesized with a surfactant layer on it which eliminates the
difficulty in dispersion. CEPVA has been used as the matrix because of its better

30
toughness, chemical and thermal stability, and low coefficient of thermal expansion.
Silver nanoparticles were synthesized for the preparation of ceramic/metal/polymer
composites. The produced silver nanoparticles were coated with organic surfactant during
the synthesis, which functions as a final barrier to prevent the particles from contacting
each other. The surfactants also performed as both a size-controlling agent and a
dispersing agent.
Materials & Procedures
The polymer/ceramic composites are prepared using the commercial ceramic
powder, Cabot BT-8 (BT), (hydrothermal powder with a mean particle size of 0.2µm
obtained from Cabot Performance Materials, Boyertown, PA), a cyanoethyl ester of
polyvinyl alcohol (CEPVA) kindly provided by Plastpolymer J.S.Company via St.
Petersburg State Institute of Technology, Russia, Castor oil, Eur. Pharm. grade, having a
density of 0.957 g/cc obtained from Acros Organics and BYK-W 9010 from BYK-
Chemie which is a dispersant used for a better dissolution of the ceramic powder. The
silver nanoparticles were prepared by a method similar to those reported [51,52]. Silver
nitrate was used as the silver precursor. Sodium borohydride (SBH) was used as the
reducing agent. A mixture of mercaptosuccinic acid (thiol ligand) and dodecanoic acid
(acid ligand) was used as the surfactant. All the chemicals were purchased from Aldrich.
A pre-determined amount of silver nitrate, 2 g, was dissolved in 10 ml of distilled water.
The thiol and acid ligands were dissolved in anhydrous methanol that was about 10 times
in volume of the water used above. The molar ratio of thiol ligand to acid ligand was set
to 1:4.5. The molar ratio of thiol ligand to silver varied from 2:1 to 1:100. The silver
31
solution was then mixed with ligand solution under stirring. Freshly prepared SBH
methanol solution was added into the silver solution dropwise. Dark brown color
appeared instantly upon the adding of SBH and the whole solution became dark red or
black after the addition. The molar ratio of SBH to silver was set to 1:2.
The reacting solution was kept under stirring for 10 more minutes after the
addition to fully reduce silver. The dark precipitate was separated by centrifugation and
the supernatant liquid was decanted. The precipitated silver nanoparticles were then
refluxed in methanol for 15 minutes. After refluxing, silver particles were precipitated by
centrifugation. The refluxing-centrifugation cycle was repeated in methanol for three
times to remove the extra organic and inorganic ions and the silver particle size was
estimated to be around 50 nm.
The same polymer/ceramic composite that was discussed about in chapter 2 was
considered with a 0.8 weight fraction of the ceramic. The reason for considering that
particular composite was because it was observed to have the maximum dielectric
constant value among all the samples prepared. The procedure for preparing the polymer
and ceramic suspensions was the same as followed in our earlier work [54]. Synthesized
silver particles were introduced into the polymer/ceramic suspensions. Then the
suspension is ball-milled for 12 hr. The prepared mixtures were then gently dried at 80°-
90° C under both continuous magnetic stirring and mildly reduced pressure to get rid of
the solvents where viscous slurries/pastes were obtained. The dried composites were then
kept under reduced pressure and used for further characterization.
The capacitor is fabricated using the same procedure that was followed in our
earlier work [53,54] and is characterized for capacitance. Dielectric constants of the

32
composites were determined by preparing four specimens in a slurry/paste form free from
pores composed of different volume fractions of BT particles and polymer followed by
filling the teflon cell with aluminum plate electrodes. The capacitance was measured at 1
MHz using HP 4284A Precision LCR Meter. The dielectric constant values (Ks) were
calculated from the measured capacitance data using the equation 11
C = ε0 KA/t (11)
where ε0 = dielectric permittivity of the free space, 8.854 X 10⁻¹² F/m
A = area of the electrode and ceramic contact area, 1 cm2
t = thickness of the ceramic specimen, 0.4 cm
The dielectric constant of all the samples was determined using the capacitance values.
The values thus obtained were plotted and compared with the known theoretical models
to make sure that this method is consistent and reliable.
Results & Discussion
Dielectric constant values of different composite samples were calculated from
the measured capacitance data using the equation 11. Fig. 12 is the plot of dielectric
constant of the Cermetplas composites as a function of the silver volume fraction. The
dielectric constant of Cermetplas composites increased gradually from 89 (the dielectric
constant of BT/CEPVA composite with 0.8 wt. fraction of ceramic) to above 320 at 1
MHz and room temperature with a silver volume fraction up to 30 vol%. The dielectric
constant then started decreasing with further addition of silver. The origin of the increase
of effective dielectric constant can be intuitively explained by the polarization of silver

33
particles within the CEPVA matrix under the electric field. The dielectric constant of the
composite shows a curve similar to that follows the general material-mixing rule.
When the filler concentration is low, the average distance between silver particles
is relatively large. When the filler concentration increases, the distance between particles
decreased and the coupling of the induced polarization between silver particles become
stronger. Thus the dielectric constant of composites goes up. In a classic model, when the
filler concentration increases to a certain critical value, a giant cluster forms between
electrodes and the coupling of the polarization in fillers reach the maximum. Thus, an
almost infinitely high dielectric constant will result. When the filler concentration
increases beyond the critical value, the coupling is so strong that the insulation between
particles is broken and a conducting channel is formed. So, the dielectric constant
decreases to nearly zero.
However, in this work, silver nanoparticles were enveloped in a thin layer of
organic surfactants, which set the minimum distance between the particles. Thus, the
particles can not directly touch each other even without the matrix. As a consequence, the
synthesized Cermetplas composites did not show very sharp increase of the dielectric
constant at a certain concentration.
The dielectric constant of Cermetplas composites increased more smoothly and
formed a broad peak between 15 vol% and 35 vol%. This slow but broad increase of
dielectric constant demonstrates a high concentration tolerance, which reduces the risk of
conductive percolation. The dielectric loss factor values are plotted in Fig. 13 which
indicates a sudden increase in the loss factor with increase in silver volume% above the
percolation threshold. According to Lai Qi [55], Cermetplas with epoxy matrix showed a
34
similar broad peak and the percolation limit was observed at 22.5 vol% of the silver
content. The effective dielectric constant value of the epoxy composite at 30 vol% silver
was 316.7 whereas the dielectric constant value of our CEPVA composite at 30 vol% was
320. Though we have used a polymer, CEPVA with a relatively high dielectric constant
than epoxy, the effective dielectric constant of the composite showed almost the same
value. With this evidence we might predict or assume that the polymer matrix just acts as
a binder phase in a 3-phase composite.
This characteristic makes the Cermetplas composites suitable for practical
applications. The decrease of dielectric constant of the Cermetplas composites with
increasing frequency was due to the slower dielectric relaxation of CEPVA at higher
frequency.

35
15 20 25 30 35 40
200
220
240
260
280
300
320
340
Dielectric constant
Ag volume %
Fig. 12. Dielectric constant values of Cermetplas (0.8 wt. fraction BT) vs. silver volume%

36
15 20 25 30 35 40
0.01
0.02
0.03
0.04
0.05
0.06
0.07
0.08
0.09
0.10
Loss factor
Ag volume%
Fig. 13. Loss factor values of Cermetplas (0.8 wt. fraction BT) vs. silver volume %
37
When the silver volume fraction increased to about 30 vol%, the dielectric
constants of Cermetplas composites started decreasing with further addition of silver. The
reason was the introduction of porosity into the composites. Due to the absorbed
surfactants, there is space between silver particles even in the powder state. When the
amount of silver is small, CEPVA is enough to fill the space. When the amount of silver
increases to certain value, CEPVA is not enough even to fully occupy the space between
particles. Thus, the porosity of the composites increases.
After the refluxing treatments, the dried silver nanoparticle lump has a volume
about 6-7 times larger than the theoretical value. This renders a density only 20-25% of
the density of the pure silver (10.5 g/cm3). Therefore, the maximum loading of silver is
approximately 35 vol%. A volume fraction above this value is not practically achievable,
even with a higher Cermetplas weight ratio. In other words, when the CEPVA amount
was right enough to just occupy the space between particles, the composite reached the
maximum silver volume fraction. Further adding silver caused the introduction of air,
which will decrease the relative density and dielectric constant of the composite.
Conclusions
The Barium titanate/silver/CEPVA Cermetplas composites were successfully
prepared. Characterization of their dielectric properties was performed. The dependence
of dielectric constant and loss on the conducting filler content was studied. The dielectric
constant of the composites can be enhanced greatly by introducing metal particles in it.
Processing ease and flexibility to make capacitors, and high dielectric constant, makes
Cermetplas candidates for a wide variety of energy storage applications. Barium

38
titanate/silver/CEPVA Cermetplas showed a dielectric constant of more than 320 at room
temperature. This value is among the highest dielectric constants reported. The dielectric
loss of prepared Cermetplas is also relatively low. The technique followed in fabricating
the capacitor for characterizing the dielectric properties definitely works for a three phase
composite.
39
Chapter 4
Effect of Lattice Hydroxyl on the Phase Transition and Dielectric Properties of
Barium Titanate Particles
Abstract
Presence of the hydroxyls in the lattice is believed to be the major cause of the
reduced tetragonality in the barium titanate ceramic powder. Commercial barium titanate
that is known to be cubic in nature has been used in this study. This sub-micron powder is
treated with N-Methyl-2-Pyrrolidinon (NMP) to obtain a tetragonal powder as confirmed
by x-ray diffraction analysis, differential scanning calorimetry and the c/a ratio. The
dielectric constant of a single particle of this NMP treated cubic powder is reported to be
around 64% higher than the as-received cubic powder. To add weight to the hypothesis
mentioned hitherto, simulation experiments have been performed by preparing acidic
water, with a pH~3-4 and in basic water, with a pH~12-13. The as-received cubic barium
titanate powder, calcined at different temperatures, has been aged in different pH
conditions, acid and basic waters. Then the powder is further used for the characterization
of electrical properties. The dielectric properties of the barium titante ceramic powder
that is determined does depend inversely on the lattice OH content as confirmed by FTIR
spectroscopic analysis and TGA results.

40
Introduction
The miniaturization of the electronic devices and electronic components has
received phenomenal interest in the prospects of future technology [56-60]. The
perovskite type structured barium titanate which is a metal oxide exhibits outstanding
chemical and physical properties, such as catalysis, oxygen-transport, ferroelectric,
piezoelectric and dielectric behavior [61-63]. High values of the dielectric constant and
low loss factor of barium titanate make it a particularly desired material from which
capacitors, condensers, resistors, insulators and other electronic components can be
fabricated [64-70].
The high value of dielectric constant of barium titanate particle arises due to the
high polarizability of its relatively simple lattice structure in which small Ti+4 ions have
relatively more space within the oxygen octahedra [71]. It was well known that the
stability of the unit cell strongly depends on the size of the crystals and the Curie
temperature, 130°C. Below the curie temperature, the Ti+4 ions occupy off-center
positions, which results in the change of crystal structure from cubic to tetragonal [72-
74]. This displacement is the origin of the room-temperature ferroelectricity and
piezoelectricity of barium titanate and other perovskite oxides.
The values of the dielectric constant of the barium titanate also change
accordingly depending on the size and the crystal phase. The dependence of dielectric
constant on the particle size of barium titanate has been already reported [65,66,75]. The
synthesis of barium titanate via hydrothermal process is carried out in excess water
content at very high OH concentration [76,77]. Therefore, it is evident that some OH
groups may be entrapped in the crystal lattice. The adverse effects of the entrapped OH

41
groups have been well documented [78-83]. No method other than heating has been
reported so far, which can effectively extract the lattice hydroxyls. Also, experimental
evidence of the lattice impurity effect on the cubic–tetragonal transition has been reported
[84-86]. However, a clear understanding of the nature of the incorporation and
mechanism of removal of these species is still lacking.
Lattice hydroxyl groups are the most well-known lattice impurity in barium
titanate, which cause cationic vacancies, enlargement of unit cell and sintering difficulty.
Our previous study showed that OH extraction could be achieved by treating the
hydrothermal barium titanate powder in Dimethyl Formamide [87]. The dielectric
properties were significantly improved. By changing the reaction media from a water-
providing type to a water-extracting one, the water molecules can be extracted from the
crystallites by diffusing and dissolving in a highly polar, high boiling point organic
liquid.
It has been reported that OH groups adsorbed on the surface of the barium titanate
powder exhibit an infrared absorption because of the availability of many different
surface adsorption sites [88]. However, in the case of hydrothermal barium titanate
powders, a relatively sharp peak occurring at a similar wave number 3496 cm−1 was
observed by Noma et al. [89] and attributed to the absorbance of OH groups incorporated
into the barium titanate ceramic lattice. The broad OH resonance was almost eliminated
only after calcining the barium titanate powder for 1 h at 600–800 °C, as observed in
previous studies. It is also observed that there will be a band height increase at 600ºC
which is explained by the diffusion of the incorporated lattice hydroxyl ion to the surface
of the barium titanate particles [67,89-91]. There is an appreciable amount of lattice

42
incorporated protons and hydroxyl ions present in hydrothermally synthesized barium
titanate powder and it is found that this lattice OH diffuses to the surface by the process
of annealing [80,87].
Some information on the presence and location of OH groups has been obtained
using a variety of techniques, including infrared analysis, FTIR and TGA which have
been used to further elucidate the nature of lattice hydroxyl groups in hydrothermal
barium titanate powder ceramics. The formation mechanism and the effect of hydroxyl
ion on the dielectric properties of the barium titanate nano-crystals were not explored till
date. Therefore, our present investigation involves the reporting the chemical treatment of
converting nanocrystalline cubic barium titanate to tetragonal phase without particle
growth. The results are then related to dielectric properties.
Materials & Procedure
A commercial grade barium titanate, Cabot BT-8 , (hydrothermal powder with a
mean particle size of 0.2µm obtained from Cabot Performance Materials, Boyertown,
PA), was used in the present work. A highly polar solvent N-Methyl-2-pyrrolidinon
(NMP), (bearing a density of 1.03 g/cc obtained from Acros Organics), was used to
extract OH ions, Castor oil, (Eur. Pharm. grade, having a density of 0.957 g/cc obtained
from Acros Organics), acetic acid, CH3COOH (glacial with 99.7% purity obtained from
Fisher products) and potassium hydroxide, KOH (flakes obtained from Aldrich). The
solvent was used without any prior treatment and purification.
The commercial BT that retains a cubic phase was initially estimated for a
definite amount of 5 g in a closed teflon jar. A pre-determined amount, 75 ml of NMP

43
was then added to the teflon jar. The mixture or the suspension was thoroughly agitated at
a temperature of 200ºC for 24 hr on a magnetic stirring hot plate. Then the obtained sol
was centrifuged to remove the solvent, washed with diluted CH3COOH and then with
water and ethyl alcohol alternately. The washing process was repeated for three times.
The collected powder was then dried under vacuum at 90ºC only to remove the excess
surface water and solvent present leaving a pure barium titanate powder behind. The
crystallinity and the tetragonal phase transformation were confirmed by the x-ray
diffractometry.
As discussed, the major constituent in this type of cubic-to-tetragonal phase
transformation is due to the elimination of OH ions present in the lattice. Simulation
experiments have been done to elaborate the concept. 200 ml of deionized water was
taken in two different beakers each of 100 ml. We prepared the water in one beaker with
CH3COOH maintaining a pH around 3-4 and naming it as acidic water whereas the other
beaker of water with KOH maintaining a pH around 12-13, naming it as basic water. The
commercial cubic phase barium titanate was introduced as three different samples. The
first sample – as-received and at room temperature, the second sample – as-received and
calcined at 200ºC, and the third sample – as-received and calcined at 1100ºC. Each
sample was exactly estimated to 10 g, 5 g for acidic water and 5 g for basic water
respectively. Once the samples were ready, they were aged for 24 hr in the different pH
waters at room temerature. Then the samples were dried under vacuum at 90ºC only to
remove the excess surface water content.
After the x-ray diffraction analysis and other thermal analysis methods, the
samples were used for the determination of the dielectric properties using the capacitor
44
technique. Initially, castor oil and the NMP treated barium titanate ceramic powder was
mixed in different proportions. These mixtures had a variable ceramic content of 10-50%
by volume on the dry basis. Then castor oil was mixed with the differently aged barium
titanate ceramic powder samples one-by-one. These mixtures had a variable ceramic
content by volume on the dry basis. All these samples were ready for the characterization.
The capacitor was fabricated using the same procedure that was followed in our earlier
work [53,54] and the samples were characterized for capacitance and loss factor.
Dielectric constants of all the ceramic powders were determined by preparing a
slurry/paste form free from pores composed of different volume fractions of barium
titanate particles and castor oil followed by filling the teflon cell with aluminum plate
electrodes. The capacitance was measured at 1 MHz using HP 4284A Precision LCR
Meter. The dielectric constant values (Ks) were calculated from the measured capacitance
data using the equation 12.
C = ε0 KA/t (12)
Where ε0 = dielectric permittivity of the free space, 8.854 X 10⁻¹² F/m
A = area of the electrode and ceramic contact area, 1 cm2
t = thickness of the ceramic specimen, 0.4 cm
The dielectric constant of all the samples was determined using the capacitance values.
Results & Discussion
This method is a low-temperature solvothermal treatment of hydrothermal
commercial barium titanate powders in a polar solvent, NMP in a sealed teflon jar. Fig.
14 shows the XRD pattern, in the 2θ range of 35-55 for the NMP treated barium titanate

45
particles at 200ºC for 24 hr along with the XRD of untreated barium titanate particles.
The tetragonality of barium titanate crystal is characterized by measuring the broadening
of the {200} peaks. Before the NMP treatment, there was no appreciable broadening of
the {200} peaks. When the samples were treated for 24 hr, a noticeable peak splitting is
clearly observed at 2θ = 45º.
The peak splitting value and the c/a ratio were determined using the {200} peaks
through the single peak deconvolution approach. The c/a ratio changed from 1.001 (as-
received) to about 1.0078 after samples were treated in NMP at 200ºC for 24 hr.
Considering the theoretical tetragonal asymmetry (c/a =1.01) [92] and the fact that
tetragonal and cubic phases always co-exist in barium titanate crystals, it is very much
obvious to conclude that the NMP treated barium titanate particles were tetragonal. The
enhanced tetragonality was also confirmed by the DSC results, a curie transition at
133ºC, as shown in Fig. 15. Before the NMP treatment, the barium titanate particles were
cubic at room temperature and showed no phase transformation in DSC upon heating up
to 200ºC.

46
35 40 45 50 55
0
200
400
600
800
1000
1200
1400
1600
NMP treated BT
BT
Arbitrary units
Degree (2 Theta)
Fig. 14. Partial XRD pattern of BT – before and after NMP treatment (NMP treatment showing the peak split at 45º)

47
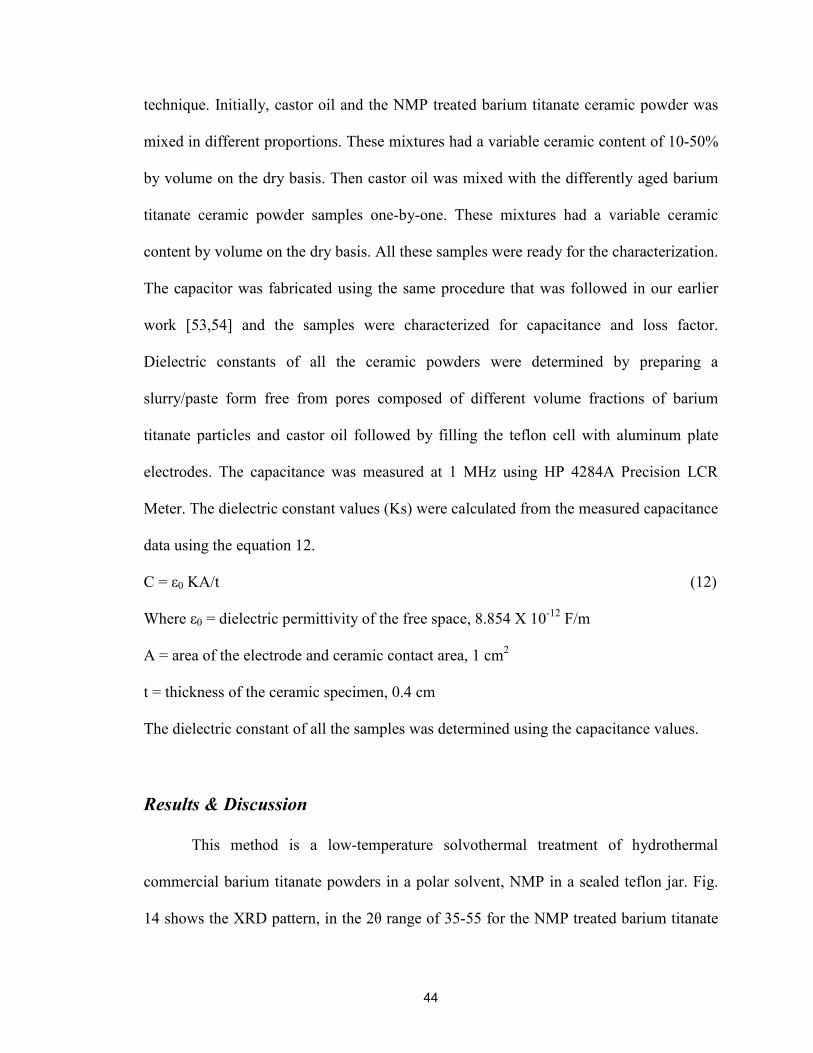
The hydroxyl content in the as-received, aged and NMP treated barium titanate
particles was determined by FTIR analysis and TGA. Fig. 16 shows the FTIR spectrum
of NMP treated barium titanate along with the untreated powder. The intensity of this
broad peak in the range of 2600 - 3600 cm-1, which is assigned to the OH stretching
vibration, was significantly reduced after the NMP treatment. The presence of some
barium carbonate was also detected in as-received powders, which was also removed by
the treatment. It is necessary to distinguish lattice hydroxyls from the naturally absorbed
surface water because surface water does not cause lattice strain. The semi quantitative
comparison of the band intensities show that the lattice OH content in this NMP treated
barium titanate powder to be 0.35%.

48
90 100 110 120 130 140 150 160 170
-0.85
-0.80
-0.75
-0.70
-0.65
-0.60
-0.55
-0.50
-0.45
Heat flow (w/g)
Temperature (degree celcius)
Fig. 15. DSC curve showing the tetragonal-to-cubic transition in the NMP treated barium titanate powder during the process of increasing the temperature
49
4500 4000 3500 3000 2500 2000 1500 1000 500 0
-0.05
0.00
0.05
0.10
0.15
0.20
0.25
0.30
0.35
0.40
NMP treated powder
As-recd. powder
Absorbance
Wavenumbers (cm-1)
Fig. 16. FTIR spectra of barium titanate – before and after NMP treatment showing the OH vibration at 2600 – 3600 cm-1

50
FTIR spectra, in the OH stretching region, of hydrothermal barium titanate powder
calcined in air for 24 hr at room temperature, 200 and 1100 °C are shown in Fig. 17. The
broad spectrum attributable to OH groups decreases with increasing the calcining
temperature. The spectrum of the BT powder aged in different pH waters has two sharp
peaks, a larger peak at 3496 cm−1 corresponding to the surface OH and a smaller peak at
2931 cm−1 that corresponds to the peak position observed for the lattice OH, of 1426 and
1469 cm-1 to lattice and surface carbonate respectively and of 785 and 545 cm-1 to barium
titanate.
Semi quantitative comparison of the species by band intensity of OH at 2931 cm-1
was calculated to the ratio of the species by band intensity of barium titanate at 545 cm-1.
The observed lattice OH content in both the different pH waters is tabulated in Table 2.
The TGA results obtained were analyzed for the weight loss in each sample. It is
generally considered that the total weight loss as a combination of weight loss of
hydroxyl ions, both surface and lattice, and carbonate ions. Based on these results, a
study is being done on the TGA curves, shown in Fig. 18, for the exact temperature range
and the amount of weight loss of the lattice OH content.
It was already mentioned that between the temperature 250 – 450ºC, the
incorporated lattice hydroxyl ion diffuses to the surface [80]. Hence, at that particular
temperature range the slope and the weight loss are being calculated and the results are
tabulated in Table 3.
It is clearly evident that as the temperature increases the amount of water and
hydroxyl groups deplete. Both the results from FTIR and TGA support the earlier
statement.

51
Fig. 17a. FTIR spectra of calcined barium titanate aged in acidic water

52
Fig. 17b. FTIR spectra of calcined barium titanate aged in basic water

53
Table 2. Amount of lattice OH content with respect to temperature aged in acidic and basic waters based on FTIR analysis.
Acidic water Basic water
RT 0.733 % RT 2.213 %
200 ºC 0.599 % 200 ºC 2.022 %
1100 ºC 0.125 % 1100 ºC 0.385 %
Now it is very much understood that lattice OH plays an important role in phase
transformation of barium titanate. The effect of the lattice OH content can be more
clearly estimated by performing a dielectric study on the NMP treated barium titanate as
well as the samples aged in different pH waters.
Dielectric constant values of the different samples were calculated from the
measured capacitance data using the equation 12. The dielectric constant and loss values
of the NMP treated barium titanate powder particles obtained by using castor oil as the
binder phase is plotted in Fig. 19 and extrapolating this plot gives the dielectric constant
of the NMP treated ceramic particles as 291 and the dielectric loss factor to be 0.03.
Using the same technique, the dielectric constant value of the as-received powder
particles is found to be 177 that were reported by our earlier work [53]. The dielectric
constant of the commercial tetragonal powder particles, BT 219-6, in as-received
condition is determined as 306 using the same procedure that was followed in our
previous work [53,54].
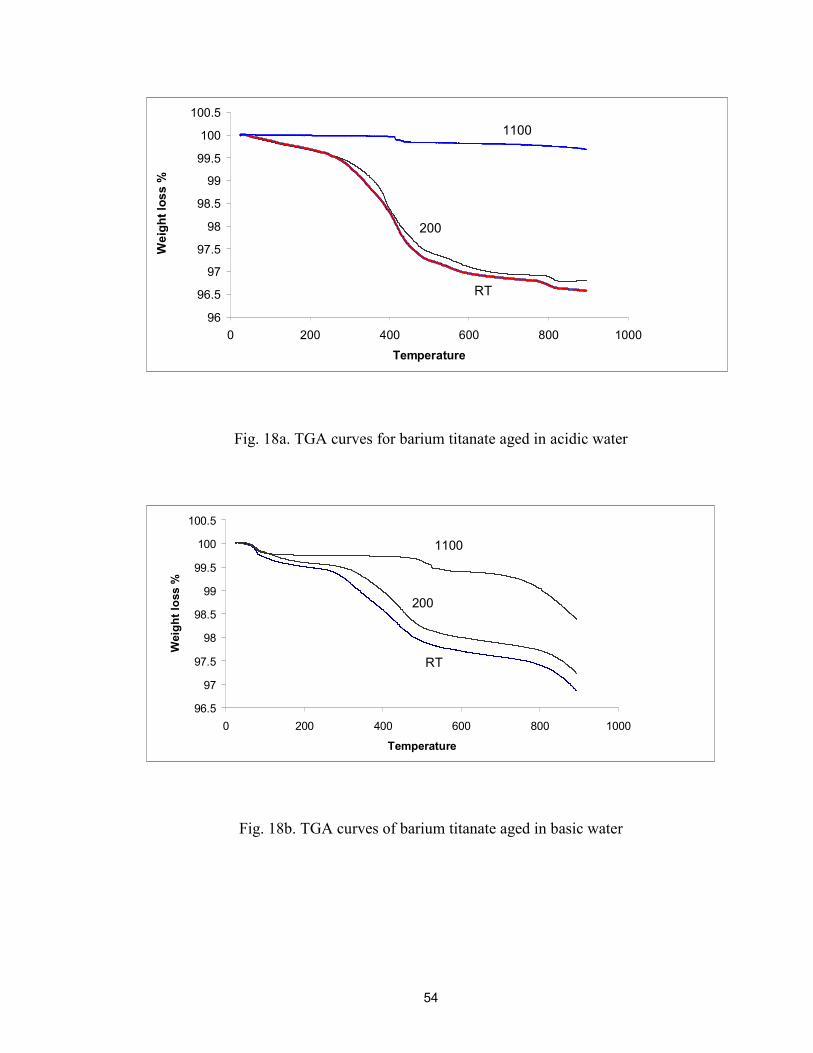
54
96
96.5
97
97.5
98
98.5
99
99.5
100
100.5
0 200 400 600 800 1000
Temperature
Weight loss %
1100
RT
200
Fig. 18a. TGA curves for barium titanate aged in acidic water
96.5
97
97.5
98
98.5
99
99.5
100
100.5
0 200 400 600 800 1000
Temperature
Weight loss %
1100
RT
200
Fig. 18b. TGA curves of barium titanate aged in basic water

55
Table 3. Amount of lattice OH content with respect to temperature aged in acidic and basic waters based on TGA results.
Acidic water Basic water
RT 0.602 % RT 1.989 %
200 ºC 0.577 % 200 ºC 1.887 %
1100 ºC 0.183 % 1100 ºC 0.312 %
Similarly the dielectric constants of all the six samples that were aged in different
pH waters were being determined using castor oil as the binder phase. Then the dielectric
constant results were plotted against temperature and lattice OH content that are shown in
Fig. 20 and Fig. 21 respectively. The dielectric constant values of samples aged in acidic
water give higher values due to smaller amount of OH content present in them when
compared to the samples aged in basic water. The loss factor for both acidic and basic
waters was increased by a very small amount. It was observed that there was an excess
weight loss in the powder aged in basic water. The reason for this behavior was the
instability on the surface of the particle. There was a definite amount of carbonate as well
as OH present on the surface when compared to the powder aged in acidic water.
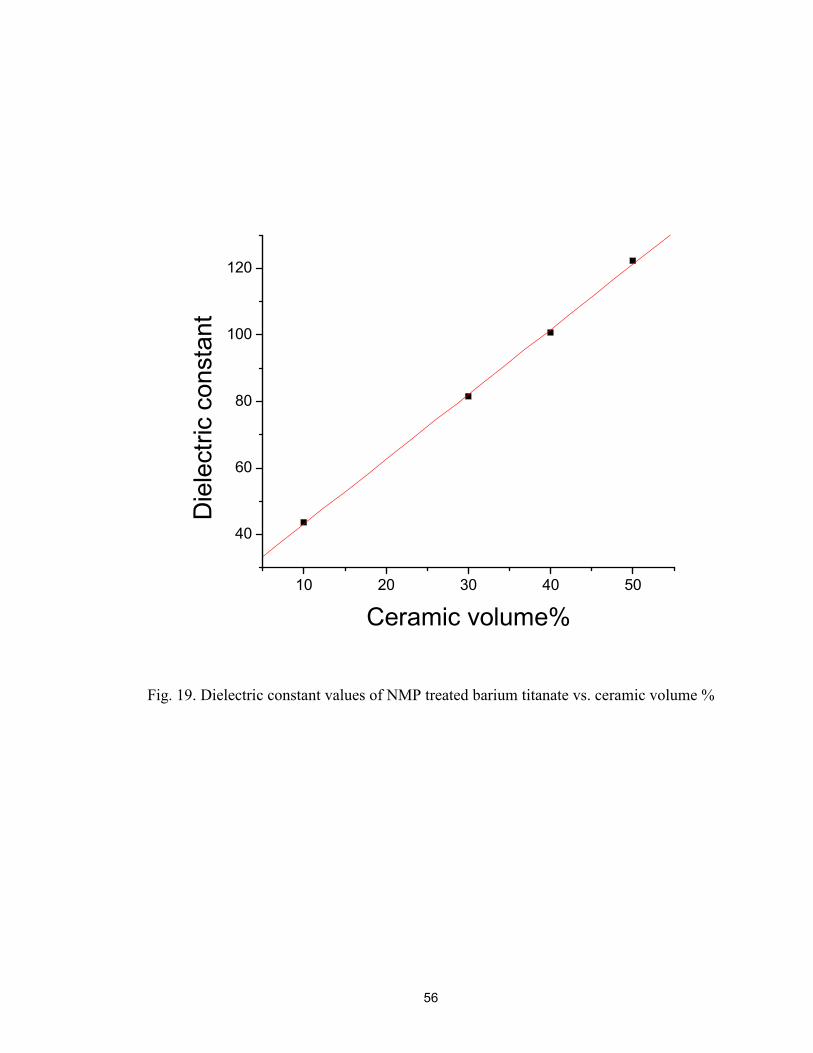
56
10 20 30 40 50
40
60
80
100
120
Dielectric constant
Ceramic volume%
Fig. 19. Dielectric constant values of NMP treated barium titanate vs. ceramic volume %

57
0 200 400 600 800 1000 1200
160
180
200
220
240
260
280
300
Dielectric constant
Temperature C
Fig. 20a. Dielectric constant values of barium titanate aged in acidic water as a function of calcining temperature

58
0 200 400 600 800 1000 1200
160
180
200
220
240
260
280
300
Dielectric constant
Temperature C
Fig. 20b. Dielectric constant values of barium titanate aged in basic water as a function of calcining temperature

59
0.1 0.2 0.3 0.4 0.5 0.6 0.7
160
180
200
220
240
260
280
OH content (%)
Dielectric constant
0.00
0.05
0.10
0.15
0.20
0.25
Loss fa
ctor
Fig. 21a. Dielectric properties of barium titanate aged in acidic water with increasing OH content

60
0.0 0.5 1.0 1.5 2.0 2.5
140
160
180
200
220
240
260
OH content (%)
Dielectric constant
0.00
0.05
0.10
0.15
0.20
0.25
Loss fa
ctor
Fig. 21b. Dielectric properties of barium titanate aged in basic water with increasing OH content

61
The summary of the results is tabulated in Table 4.
Table 4. Variations in OH content, dielectric constant and dielectric loss values with respect to different pH treatments of barium titanate powder.
BT treatments Calcined
temperature
Lattice
OH %
Dielectric
constant (K)
Loss
factor
% increase in K
of NMP treated
powder (291)
25 0.67 162 0.05 44
200 0.58 180 0.04 38
Acidic water
1100 0.15 273 0.03 6
25 2.1 156 0.05 46
200 1.9 170 0.05 41
Basic water
1100 0.35 258 0.04 11
Conclusions
Barium titanate treated with NMP contains a lower concentration of lattice
hydroxyl group, resulting in a small lattice strain. The tetragonality in the hydrothermal
barium titanate particles is restored by a one-step chemical treatment. The lattice
hydroxyls in barium titanate were effectively extracted by the NMP treatment. As
hypothesized, the lattice hydroxyl release is the reason of the tetragonality recovery. This
method can be considered as a complementary treatment to promote the phase transition
of cubic barium titanate and to synthesize tetragonal ferroelectric nanoparticles.
62
XRD confirms the tetragonality with the peak split at 45º and c/a ratio is obtained
as 1.0078. FTIR investigations of hydrothermal barium titanate particles revealed a
spectrum with a broad OH band in the wave number range of 2600 - 3600 cm−1,
indicating the presence of a significant concentration of surface OH groups in the film. A
sharply-defined peak at 2931 cm−1, attributed to lattice OH species, was also found. The
apparent amount of lattice OH content was reported to be 0.35% for barium titanate
powder treated with NMP at 200ºC for 24 hr. The simulation experiment adds value to
the above statement as barium titanate calcined at 1100ºC in both acidic and basic waters
show similar values which clearly indicates that elimination of OH initiates the
tetragonality in a cubic barium titanate. Dielectric studies provide strong evidence to the
hypothesis made as the dielectric constant of NMP treated barium titanate powder
particle is 291, 64% higher than the value of as-received barium titanate, 177 and the loss
factor was observed to constant at 0.03. Hence, extraction of hydroxyl ions, in particular
the lattice OH, increases the dielectric constant of the powder.

63
REFERENCES
1. D. C. Dube and S. J. Jang, Proc. Symp. Ceram. Dielectr. 8 (1985) 315. 2. D. Pozar, Microwave Engg. (Addison-Wesley, Massachusetts, 1990) 313.
3. S. K. Bhattacharya and R. R. Tummala, J. Mater. Sci. Mater. Electron. 11 (2000)
253.
4. Y. Rao, S. Ogitani, P. Kohl and C. P. Wong, Proc. Elec. Components and Technology. (2000) 183.
5. B. A. Schutzberg, C. Huang, S. Ramesh and E. P. Giannelis, Proc. Elec.
Components and Technology. (2000) 1564.
6. S. Ogitani, S. A. Bidstrup-Allen and P. A. Kohl, IEEE Trans. Advanced Packaging 23 (2000) 313.
7. S. D. Cho, S. Y. Lee, J. G. Hyun and K. W. Paik, Mat. Sci. Eng. B110 (2004)
233.
8. S. D. Cho, S. Y. Lee, J. G. Hyun and K. W. Paik, Mat. Sci: Elec. 16 (2005) 77.
9. N. G. Devaraju, B. I. Lee, E. S. Kim, Microelec. Engg. 82 (2005) 71.
10. T. Yamada, T. Ueda and T. Kitayama, J. Appl. Phys. 53 (1982) 4328.
11. N. Jayasundere and B. V. Smith, ibid. 73 (1993) 2462.
12. K. Mazur, Plast. Eng. 28 (1995) 539.
13. J. C. Maxwell-Garnett, Philos. Trans. R. Soc. London Ser. A, 203 (1904) 385.
14. D. K. Dasgupta and K. Doughty, Thin Solid Films, 158 (1988) 93.
15. D. Stauffer, A. Aharony, Introduction to percolation theory. Taylor & Francis, 1991.
16. M. Sahimi, Application of percolation theory. Taylor & Francis, 1994.
17. B. Sareni, L. Krahenbuhl, and A. Beroual, J. Appl. Phys., 85 (1997) 2375.
18. G. W. Milton, J. Appl. Phys., 52 (1981) 5286.

64
19. R. Waser, Integr. Ferroelectr. 15 (1997) 39.
20. G. Arlt, D. Henning and G. De With, ibid. 58 (1985) 1619.
21. S. Wada, H. Yasuno, T. Hoshina, S-M. Nam, H. Kakemoto, T. Tsurumi, Jpn. J.
Appl. Phys. 42 (2003) 6188.
22. Y. Rao, J. Qu, T. Marinis, IEEE Trans. Components and Packaging Tech., 23 (2000) 680.
23. G. Arlt, J. Mat. Sci. 25 (1990) 2655.
24. D. H. Kuo, C. C. Chang, T. Y. Su, W. K. Wang and B.Y. Lin, Mat. Chem. & Phy.
85 (2004) 201.
25. D. Sinha and P. K. C. Pillai, J. Mat. Sci. Lett., 8 (1989) 673.
26. B. I. Lee, X. Wang, S. J. Kwon, H. Maie, R. Kota, J. H. Hwang, J.G. Park, M. Hu., Microelec. Engg. 83 (2006) 463.
27. Y. Rao, C. P. Wong, J. Qu, IEEE Trans. Electronic Components & Tech.
Conference, (2000) 615.
28. S. K.Bhattacharya, P. M. Raj, D. Balaraman, H. Windlass, R. R. Tummala, Circuit World, 30/1 (2003) 31.
29. R. N. Das, M. D. Poliks, J. M. Lauffer, V. R. Markovich, “High Capacitance,
Large Area, Thin Film, Nanocomposite Based Embedded Capacitors”
30. W. Hitesh, R. P. Markondeya, D. Balaraman, S. K. Bhattacharya, R. Tummala, IEEE Trans. Electron. Pack. Man. 26 (2003) 2.
31. Y. Rao, A. Takahashi, C. P. Wong, Composites: A 34 (2003) 1113 32. J. Andresakis, T. Yamamoto, N. Biunno, Circuit World 30/1 (2003) 36 33. S. Ogitani, A. S. Bidstrup, P. Kohl, IPC conf., San Diego, (2000) 34. S. D. Cho, J. Y. Lee, K. W. Paik, Electron. Compon. Technol. Conference (2002)
504 35. N. Manish, A. C. Jeanine, S. Lawrence Jr., A. Sen., Chem.Mater. 3 (1991) 201 36. N. Halder, S. A. Das, S. K. Khan, A. Sen, H. S. Maiti, Mater. Res. Bull. 34 (1999)
545

65
37. R. Chen, X. Wang, Z. Gui, L. Ti, J.Am. Ceram. Soc, 86 (2003) 1022 38. C. Pecharroman, J. S. Moya, Adv. Mater. 12 (2000) 294 39. C. W. Nan, Prog. Mater. Sci. 37 (1993) 1 40. C. W. Nan, Phys. Rev. B 63 (2001) 176201 41. D. A. G. Bruggeman, Ann. Phys. (Leipzig) 24 (1935) 636 42. N. Jayasundere, B.V. Smith, J. Apl. Phy. 34 (1995) 6149 43. C. Pecharroman, B. F. Esteban, J. S. Moya, Adv. Mater. 13 (2001) 1541 44. J. J. Wu, D. S. McLachlan, Phys. Rev. B 56 (1997) 1236 45. J. J. Wu, D. S. McLachlan, Phys. Rev. B 58 (1998) 14880 46. C. Brosseau, J. Appl. Phys. 91 (2002) 3197 47. Y. Rao, C. P. Wong, IEEE Proc. Electron. Compon. Technol. Conf. (2002) 920 48. Z. M. Dang, Y. H. Lin, C. W. Nan, Adv. Mater. 15 (2003) 1625 49. Z. M. Dang, Y. Shen, C. W. Nan, Appl. Phys. Lett. 81(2002) 4814 50. D. Stauffer, Phys. Reports 54 (1979) 1 51. N. R. Jana and X. G. Peng, J. Am. Chem. Soc. 125 (2003) 14280 52. S. H. Chen, K. Kimura, Langmuir 15 (1999) 1075-1082. 53. B. I. Lee, X. Wang, S. J. Kwon, H. Maie, R. Kota, J. H. Hwang, J. G. Park, M.
Hu., Microelectron. Eng. 83 (2006) 463. 54. R. Kota, A. F. Ali, B. I. Lee, M. M. Sychov, Microelectron. Eng. (submitted) 55. Lai Qi, Synthesis and dielectric properties of ceramic-metal-polymer nano
composites 56. S. Li, J. A. Eastman, Z. Li, C.M. Foster, R. E. Newnham, L. E. Cross, Phys. Lett.
A (1996) 212, 341. 57. C. L. Wang, S. R.P. Smith, J. Phys.: Condens. Matter. 7 (1995) 7163. 58. B. Jiang, L. A. Bursill, Phys. Rev. B 60 (1999) 9978.

66
59. W. L. Zhong, Y. G. Wang, P. L. Zhang , B. D. Qu, Phys. Rev. B 50 (1994) 698. 60. H. Huang, C. Q. Sun, P. Hing, J. Phys.: Condens. Matter. 12 (2000) L127. 61. M. A. Pena, J. L. G. Fierro, Chem. Rev. 101 (2001) 1981. 62. A. S. Bhella, R. Guo, R. Roy, Mater. Res. Innovations, 4 (2000) 3. 63. P. K. Dutta, R. Asiaie, S. K. Akbar, W. Zhu, Chem. Mater. 6 (1994) 1542. 64. P. Duran, D. Gutierrez, J. Tartaj, C. Moure, Ceram. Int. 28 (2002) 283. 65. P. R. Arya, P. Jha, A. K. Ganguli, J. Mater. Chem.13 ( 2003) 415. 66. S. Bhattacharya, R. Tummalla, J. Mater. Sci. Mater. Electronics 11 (2000) 253. 67. D. H. Yoon, B. I. Lee, J. Ceram. Process. Res. 3 (2002) 41. 68. C. D. Chandler, C. Roger, M. H. Smith, J. Chem. Rev. 93 (1993) 1205. 69. D. Henning, M. Klee, W. Waser, Adv. Mater. 3 (1991) 334. 70. G. Arlt, D. Hennings, G. de With, J. Appl. Phys. 58 (1985) 1619. 71. I. J. Clark, T. Takeuchi, N. Ohtori, D. C. Sinclair, J. Mater. Chem. 9 (1999) 83. 72. S. Schlag, H. F. Eicke, Solid State Commun. 91 (1994) 883. 73. K. Ishikawa, K. Yoshikawa, N. Okada, Phys. Rev. B 37 (1988) 5852. 74. Y. Kobayashi, A Nishikata, T. Tanase, M. Konno, J. Sol-Gel Sci. Technol. 29
(2004) 49. 75. T. Takeuchi, M. Tabuchi, K. Ado, K. Honjo, O. Nakamura, H. Kageyama, Y.
Suyama, N. Ohtori, M. Nagasawa, J. Mater. Sci. 32 (1997) 4053. 76. L. Qi, B.I. Lee, P. Badheka, D. H. Yoon, W. D. Samuels, G. J. Exarhos, J. Eur.
Ceram. Soc. 24 (2004) 3553. 77. L. Qi, B. I. Lee, P. Badheka, L.Q Wang, P Gilmour, W. D. Samuels, G. J.
Exarhos, Mater. Lett. 59 (2005) 2794. 78. D. Hennings and S. Shreinmacher, J. Eur. Ceram. Soc. 9 (1992) 41. 79. S. Wada, T. Suzuki, and T. Noma, J. Ceram. Soc. Jpn. 103 (1995) 1220. 80. T. Noma, S. Wada, M. Yano, and T. Suzuki, J. Appl. Phys. 80 (1996) 5223.

67
81. D. F. K. Hennings, C. Metzmacher, and B.S. Schreinemacher, J. Am. Ceram. Soc.
84 (2001) 179. 82. A.T. Chien, L. Zhao, M. Colic, J.S. Speck, and F.F. Lange, J. Mater. Res. 14
(1999) 3330. 83. V. M. Fuenzalida, M. E. Pilleux, and I. Eisele, Vacuum 55 (1999) 81. 84. S. Wada, T. Suzuki, T. Noma, J. Ceram. Soc. Jpn. 104 (1996) 383. 85. T. Yamamoto, H. Niori, H. Moriwake, Jpn. J. Appl. Phys. 39 (2000) 5683. 86. E. Ciftci, M. N. Rahaman, J. Mater. Sci. 36 (2001) 4875. 87. P. Badheka, L. Qi, B. I. Lee, J. Eur. Ceram. Soc. 26 (2006) 1393 88. S. K. Patil, N. Shah, F.D. Blum, M.N. Rahaman, J. Mater. Res. 12 (2005) 3312. 89. B. I. Lee, J. Electroceramics , 3 (1999) 51 90. S. Lu, B. I. Lee, Mann, L., Mater. Lett., 43 (2000) 102 91. S. Lu, B. I. Lee, Mater. Res. Bull., 35 (2000) 1303 92. M. H. Frey, D. A. Payne, Phys. Rev., B 54 (1996) 3158