diane roy fortisbc gas regulatory affairs correspondence · pdf file ·...
TRANSCRIPT

Diane Roy Vice President, Regulatory Affairs
Gas Regulatory Affairs Correspondence
Email: [email protected]
Electric Regulatory Affairs Correspondence Email: [email protected]
FortisBC
16705 Fraser Highway
Surrey, B.C. V4N 0E8
Tel: (604) 576-7349
Cell: (604) 908-2790
Fax: (604) 576-7074
Email: [email protected]
www.fortisbc.com
October 3, 2017 British Columbia Utilities Commission 6th Floor, 900 Howe Street Vancouver, BC V6Z 2N3 Attention: Mr. Patrick Wruck, Commission Secretary and Manager, Regulatory Support Dear Mr. Wruck: Re: FortisBC Inc. (FBC)
Multi-Year Performance Based Ratemaking Plan for 2014 through 2019 approved by British Columbia Utilities Commission (the Commission) Order G-139-14 (PBR Plan) – Annual Review for 2018 Rates (the Application)
Evidentiary Update to the Application (Exhibit B-2)
On August 8, 2017, FBC filed the Application referenced above. On October 3, 2017, FBC filed its responses to information requests in the proceeding, which stated that the Company would be filing this Evidentiary Update concurrently with its responses. The following two items have resulted in changes to the Application and resulting rates effective January 1, 2018, which are reflected in this Evidentiary Update:
1. Update to AWE-BC; and
2. Updates to certain deferral account balances and amortization expense. Each of the two items is discussed in more detail below.
1. Update to AWE-BC
At the time of filing the Application, the latest available BC-AWE result was for May 2017, which was used as a placeholder for June 2017. The June AWE-BC result is now available, and is $944.56 as compared to $939.99 used in the Application as the June 2017 placeholder. During the issuance of the June AWE-BC results, Statistics Canada updated the May AWE-BC results to $939.88 as compared to $939.99, and this amount has also been updated in FBC’s I-Factor calculation.
2. Updates to Deferral Account Balances and Amortization Expense
In its response to BCUC IR 1.23.1, FBC identified a correction to one deferral account and updates to five other deferral accounts. One further correction was identified in the response
October 3, 2016 British Columbia Utilities Commission FBC PBR Annual Review for 2018 Rates – Evidentiary Update Page 2
to CEC IR 1.36.1. These changes affect the opening balances and/or amortization expense for 2018.
Summary of Impacts:
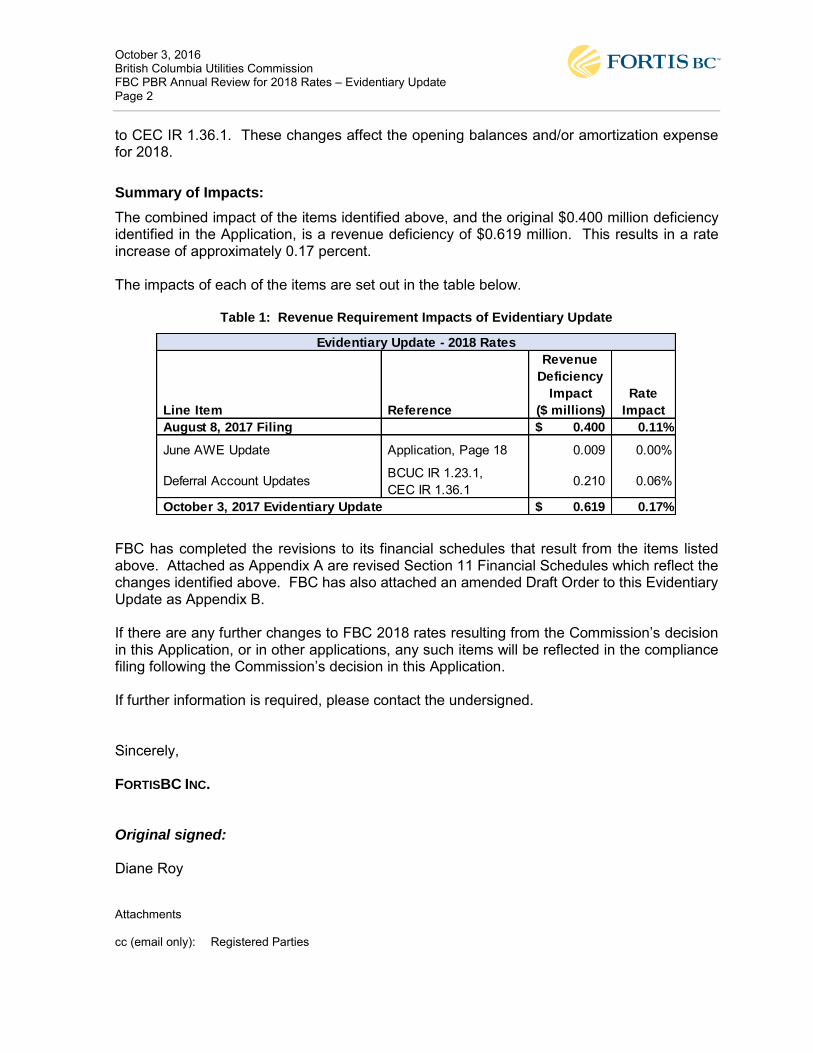
The combined impact of the items identified above, and the original $0.400 million deficiency identified in the Application, is a revenue deficiency of $0.619 million. This results in a rate increase of approximately 0.17 percent. The impacts of each of the items are set out in the table below.
Table 1: Revenue Requirement Impacts of Evidentiary Update
FBC has completed the revisions to its financial schedules that result from the items listed above. Attached as Appendix A are revised Section 11 Financial Schedules which reflect the changes identified above. FBC has also attached an amended Draft Order to this Evidentiary Update as Appendix B. If there are any further changes to FBC 2018 rates resulting from the Commission’s decision in this Application, or in other applications, any such items will be reflected in the compliance filing following the Commission’s decision in this Application. If further information is required, please contact the undersigned. Sincerely, FORTISBC INC. Original signed:
Diane Roy Attachments cc (email only): Registered Parties
Revenue
Deficiency
Impact Rate
Line Item Reference ($ millions) Impact
August 8, 2017 Filing 0.400$ 0.11%
June AWE Update Application, Page 18 0.009 0.00%
Deferral Account Updates BCUC IR 1.23.1,
CEC IR 1.36.1 0.210 0.06%
October 3, 2017 Evidentiary Update 0.619$ 0.17%
Evidentiary Update - 2018 Rates

Appendix A
REVISED FINANCIAL SCHEDULES

FORTISBC INC. October 3, 2017 Section 11
SUMMARY OF RATE CHANGE Schedule 1FOR THE YEAR ENDING DECEMBER 31, 2018($000,000s)
Line 2018No. Particulars Forecast Cross Reference
(1) (2) (3) (4)
1 VOLUME/REVENUE RELATED
2 Customer Growth and Volume 5.788
3 Change in Other Revenue (0.360) 5.428
45 POWER SUPPLY6 Power Purchases (net of customer growth and volume) (3.145) 7 Wheeling 0.243 8 Water Fees (0.120) (3.022) 9
10 O&M CHANGES11 Gross O&M Change 1.042 12 Capitalized Overhead Change (0.157) 0.886 1314 DEPRECIATION EXPENSE15 Depreciation from Net Additions 2.430 2.430 1617 AMORTIZATION EXPENSE18 CIAC from Net Additions (0.224) 19 Deferrals (5.169) (5.393) 20
21 FINANCING AND RETURN ON EQUITY
22 Financing Rate Changes (1.165)
23 Financing Ratio Changes 0.044
24 Rate Base Growth 2.467 1.345
2526 TAX EXPENSE27 Property and Other Taxes Changes 0.632 28 Other Income Taxes Changes (1.688) (1.056) 293031 Revenue Deficiency (Surplus) 0.619$ Schedule 16, Line 6, Column 43233 Revenue at Existing Rates 356.340 Schedule 16, Line 5, Column 334 Rate Change 0.17%
Evidentiary Update dated October 3, 2017

FORTISBC INC. October 3, 2017 Section 11
UTILITY RATE BASE Schedule 2FOR THE YEAR ENDING DECEMBER 31, 2018($000s)
Line 2017 2018No. Particulars Approved at Revised Rates Change Cross Reference
(1) (2) (3) (4) (5)
1 Plant in Service, Beginning 1,912,643$ 1,966,584$ 53,941$ Schedule 6.1, Line 14, Column 3
2 Opening Balance Adjustment - 11,268 11,268 Schedule 6.1, Line 14, Column 4
3 Net Additions 61,107 73,890 12,783 Schedule 6.1, Line 14, Columns 5+6+7
4 Plant in Service, Ending 1,973,750 2,051,742 77,992
5
6 Accumulated Depreciation Beginning (553,121)$ (591,854)$ (38,733)$ Schedule 7.1, Line 14, Column 5
7 Opening Balance Adjustment - - -
8 Net Additions (48,305) (43,454) 4,851 Schedule 7.1, Line 14, Columns 6+7+8+9
9 Accumulated Depreciation Ending (601,426) (635,308) (33,882)
10
11 CIAC, Beginning (176,357)$ (187,217)$ (10,860)$ Schedule 9, Line 1, Column 2
12 Opening Balance Adjustment - - -
13 Net Additions (6,027) (6,120) (93) Schedule 9, Line 1, Column 4
14 CIAC, Ending (182,384) (193,337) (10,953) 1516 Accumulated Amortization Beginning - CIAC 64,660$ 68,323$ 3,664$ Schedule 9, Line 3, Column 217 Opening Balance Adjustment - - -18 Net Additions 3,689 3,913 224 Schedule 9, Line 3, Column 419 Accumulated Amortization Ending - CIAC 68,349 72,236 3,8872021 Net Plant in Service, Mid-Year 1,253,056$ 1,281,219$ 28,162$2223 Adjustment for timing of Capital additions 2,987$ 12,644$ 9,657$24 Capital Work in Progress, No AFUDC 8,387 8,921 53425 Unamortized Deferred Charges 12,392 11,885 (507) Schedule 11, Line 12, Column 826 Working Capital 2,906 1,582 (1,325) Schedule 13, Line 15, Column 327 Utility Plant Acquistion Adjustment 5,679 5,493 (186)2829 Mid-Year Utility Rate Base 1,285,408$ 1,321,742$ 36,335$
Evidentiary Update dated October 3, 2017

FORTISBC INC. October 3, 2017 Section 11
FORMULA INFLATION FACTORS Schedule 3FOR THE YEAR ENDING DECEMBER 31, 2018($000s)
Line
No. Particulars Reference 2014 2015 2016 2017 2018 Cross Reference(1) (2) (3) (4) (5) (6) (7) (8)
1 Cost Drivers for Formulaic Capital and O&M2 CPI 0.473% 0.879% 0.980% 1.627% 1.979%3 AWE 2.277% 1.646% 2.050% 1.250% 1.473%4 Labour Split5 Non Labour 45.000% 45.000% 45.000% 45.000% 45.000%6 Labour 55.000% 55.000% 55.000% 55.000% 55.000%7 CPI/AWE (Line 2 x Line 5) + (Line 3 x Line 6) 1.465% 1.301% 1.569% 1.420% 1.701%8 Productivity Factor -1.030% -1.030% -1.030% -1.030% -1.030%9 Net Inflation Factor for Costs Line 7 + Line 8 0.435% 0.271% 0.539% 0.390% 0.671%1011 Average Customer Growth 0.326% 0.181% 0.613% 0.494% 0.629%12 Inflation Factor (1 + Line 9) x (1 + Line 11) 100.758% 100.452% 101.155% 100.886% 101.304%
Evidentiary Update dated October 3, 2017
FORTISBC INC. October 3, 2017 Section 11
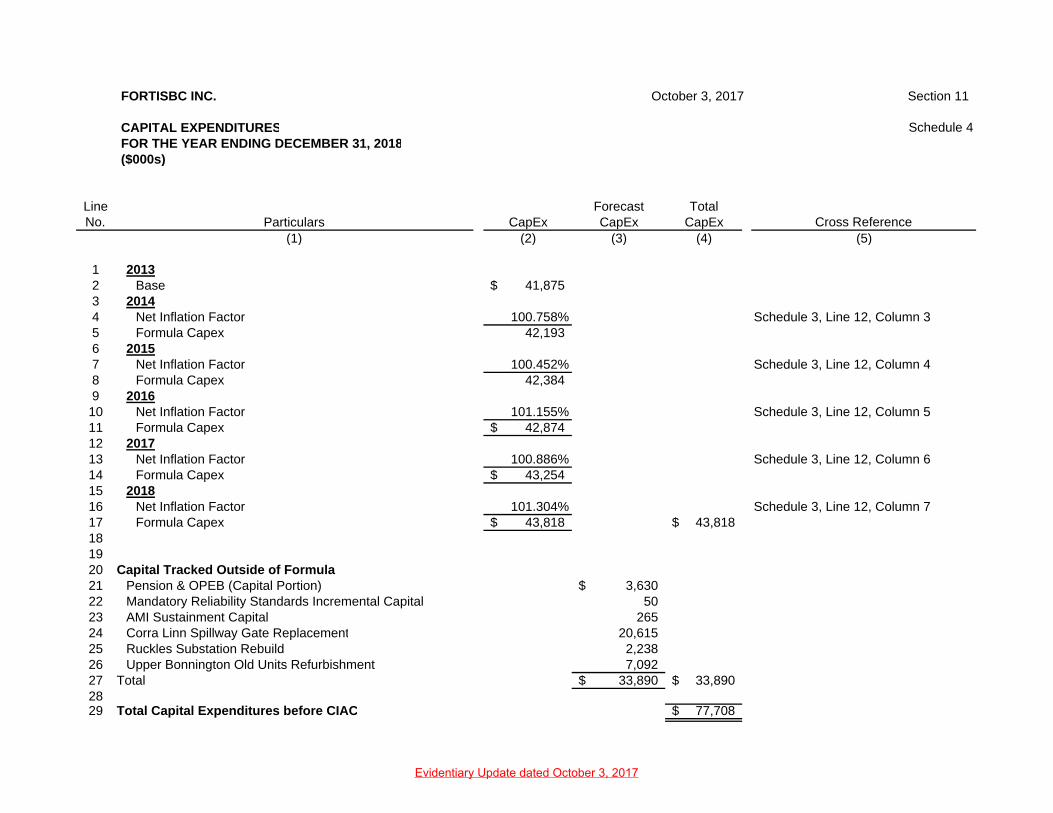
CAPITAL EXPENDITURES Schedule 4FOR THE YEAR ENDING DECEMBER 31, 2018($000s)
Line Forecast TotalNo. Particulars CapEx CapEx CapEx Cross Reference
(1) (2) (3) (4) (5)
1 20132 Base 41,875$ 3 20144 Net Inflation Factor 100.758% Schedule 3, Line 12, Column 35 Formula Capex 42,193 6 20157 Net Inflation Factor 100.452% Schedule 3, Line 12, Column 48 Formula Capex 42,384 9 201610 Net Inflation Factor 101.155% Schedule 3, Line 12, Column 511 Formula Capex 42,874$ 12 201713 Net Inflation Factor 100.886% Schedule 3, Line 12, Column 614 Formula Capex 43,254$ 15 201816 Net Inflation Factor 101.304% Schedule 3, Line 12, Column 717 Formula Capex 43,818$ 43,818$ 181920 Capital Tracked Outside of Formula21 Pension & OPEB (Capital Portion) 3,630$ 22 Mandatory Reliability Standards Incremental Capital 50 23 AMI Sustainment Capital 265 24 Corra Linn Spillway Gate Replacement 20,615 25 Ruckles Substation Rebuild 2,238 26 Upper Bonnington Old Units Refurbishment 7,092 27 Total 33,890$ 33,890$ 2829 Total Capital Expenditures before CIAC 77,708$
Evidentiary Update dated October 3, 2017

FORTISBC INC. October 3, 2017 Section 11
CAPITAL EXPENDITURES TO PLANT RECONCILIATION Schedule 5FOR THE YEAR ENDING DECEMBER 31, 2018($000s)
Line
No. Particulars 2018 Cross Reference(1) (2) (3)
1 CAPITAL EXPENDITURES23 Formula Capital Expenditures 43,818$ Schedule 4, Line 17, Column 44 Forecast Capital Expenditures 3,945 Schedule 4, Lines 21 to 23, Column 35 Total Regular Capital Expenditures 47,763$ 67 CPCN and Special Projects8 Corra Linn Spillway Gate Replacement 20,615 Schedule 4, Line 24, Column 39 Ruckles Substation Rebuild 2,238 Schedule 4, Line 25, Column 3
10 Upper Bonnington Old Units Refurbishment 7,092 Schedule 4, Line 26, Column 311 Total CPCN and Special Projects 29,945$ 1213 Total Capital Expenditures 77,708$ 141516 RECONCILIATION OF CAPITAL EXPENDITURES TO PLANT1718 Regular Capital Expenditures 47,763$ 19 Add - Capitalized Overheads 8,789 Schedule 20, Line 31, Column 420 Add - Direct Overheads 5,000 21 Add - AFUDC 692
22 Less: Removal costs (2,577) Schedule 7.1, Line 14, Column 8 - Row 30
23 Gross Capital Expenditures 59,667$
24 Change in Work in Progress -
25 Total Additions to Plant 59,667$
26
2728 CPCN and Special Projects 29,945$ 29 Add - AFUDC 2,114 30 Less: Removal costs (1,381) 31 Gross Capital Expenditures 30,678 32 Change in Work in Progress (5,391) 33 Total Additions to Plant 25,287$ 3435 Grand Total Additions to Plant 84,954$ Schedule 6.1, Line 14 , Columns 5+6
Evidentiary Update dated October 3, 2017

FORTISBC INC. October 3, 2017 Section 11
PLANT IN SERVICE CONTINUITY SCHEDULE Schedule 6FOR THE YEAR ENDING DECEMBER 31, 2018($000s)
Line Opening Bal.No. Account Particulars 12/31/17 Adjustment CPCNs Additions Retirements 12/31/18 Cross Reference
(1) (2) (3) (4) (5) (6) (7) (8) (9)
1 Hydraulic Production Plant2 330 Land Rights 962$ -$ -$ -$ -$ 962$ 3 331 Structures and Improvements 15,711 66 36 349 (15) 16,148 4 332 Reservoirs, Dams & Waterways 33,805 161 175 852 (50) 34,943 5 333 Water Wheels, Turbines and Gen. 95,943 8 3,548 44 (553) 98,990 6 334 Accessory Equipment 42,956 74 1,477 393 (456) 44,444 7 335 Other Power Plant Equipment 45,832 103 - 546 (19) 46,462 8 336 Roads, Railroads and Bridges 1,287 - - - - 1,287 9 236,495$ 412$ 5,237$ 2,184$ (1,093)$ 243,235$
10 Transmission Plant11 350 Land Rights-R/W 9,673$ 38$ -$ 202$ -$ 9,912$ 12 350.1 Land Rights-Clearing 8,903 38 - 202 - 9,142 13 353 Station Equipment 233,834 2,550 175 13,506 (227) 249,838 14 355 Poles Towers & Fixtures 108,798 647 - 3,427 (301) 112,571 15 356 Conductors and Devices 104,147 533 - 2,822 (332) 107,170 16 359 Roads and Trails 1,121 - - - - 1,121 17 466,476$ 3,807$ 175$ 20,158$ (860)$ 489,755$ 18 Distribution Plant - 19 360 Land Rights-R/W 3,604$ -$ -$ -$ -$ 3,604$ 20 360.1 Land Rights-Clearing 10,330 - - - - 10,330 21 362 Station Equipment 255,248 - - - (423) 254,825 22 364 Poles Towers & Fixtures 257,381 3,653 - 19,341 (484) 279,891 23 365 Conductors and Devices 293,544 1,090 - 5,773 (786) 299,621 24 368 Line Transformers 132,655 545 - 2,887 (1,461) 134,626 25 369 Services 9,521 - - - - 9,521 26 370 Meters 415 - - - (20) 395 27 370.1 AMI Meters 38,755 164 - 866 - 39,784 28 371 Installation on Customers' Premises 938 - - - - 938 29 373 Street Lighting and Signal System 11,921 - - - (57) 11,864 30 1,014,311$ 5,452$ -$ 28,867$ (3,231)$ 1,045,399$
Evidentiary Update dated October 3, 2017

FORTISBC INC. October 3, 2017 Section 11
PLANT IN SERVICE CONTINUITY SCHEDULE Schedule 6.1FOR THE YEAR ENDING DECEMBER 31, 2018($000s)
Line Opening Bal.No. Account Particulars 12/31/17 Adjustment CPCNs Additions Retirements 12/31/18 Cross Reference
(1) (2) (3) (4) (5) (6) (7) (8) (9)
1 General Plant2 389 Land 10,993$ -$ -$ -$ -$ 10,993$ 3 390 Structures - Frame & Iron 337 - - - - 337 4 390.1 Structures - Masonry 45,884 138 19,875 733 - 66,630 5 391 Office Furniture & Equipment 6,368 30 - 161 (521) 6,039 6 391.1 Computer Equipment 99,059 800 - 4,236 (2,600) 101,495 7 391.2 AMI Software 10,353 60 - 315 - 10,728 8 392 Transportation Equipment 27,595 380 - 2,012 (1,749) 28,238 9 394 Tools and Work Equipment 15,385 141 - 748 (495) 15,780
10 397 Communication Structures & Equipment 27,792 47 - 250 (515) 27,574 11 397.1 AMI Communications Structure & Equipment 5,535 - - 3 - 5,537 12 249,302$ 1,597$ 19,875$ 8,458$ (5,880)$ 273,351$ 1314 Total Plant in Service 1,966,584$ 11,268$ 25,287$ 59,667$ (11,064)$ 2,051,742$ 1516 Cross Reference Schedule 5 Schedule 5
Line 33 Line 25Column 2 Column 2
Evidentiary Update dated October 3, 2017

FORTISBC INC. October 3, 2017 Section 11
ACCUMULATED DEPRECIATION CONTINUITY SCHEDULE Schedule 7
FOR THE YEAR ENDING DECEMBER 31, 2018
($000s)
Line Gross Plant for Depreciation Depreciation Cost ofNo. Account Particulars Depreciation Rate 12/31/17 Expense Retirements Removal Adjustments 12/31/18 Cross Reference
(1) (2) (3) (4) (5) (6) (7) (8) (9) (10) (11)
1 Hydraulic Production Plant
2 330 Land Rights 962$ 2.60% (463)$ 25$ -$ -$ -$ (438)$
3 331 Structures and Improvements 15,813 1.29% 5,759 204 (15) (36) - 5,912
4 332 Reservoirs, Dams & Waterways 34,141 1.78% 7,020 608 (50) (899) - 6,679
5 333 Water Wheels, Turbines and Gen. 99,499 1.79% 16,250 1,781 (553) (118) - 17,360
6 334 Accessory Equipment 44,507 2.28% 11,073 1,015 (456) (57) - 11,574
7 335 Other Power Plant Equipment 45,935 2.05% 15,057 942 (19) (25) - 15,954
8 336 Roads, Railroads and Bridges 1,287 1.47% 219 19 - - - 237
9 242,144$ 54,914$ 4,593$ (1,093)$ (1,135)$ -$ 57,278$
10 Transmission Plant
11 350 Land Rights-R/W 9,711$ 0.00% (231)$ -$ -$ -$ -$ (231)$
12 350.1 Land Rights-Clearing 8,941 1.23% 2,103 110 - - - 2,213
13 353 Station Equipment 236,560 2.45% 71,459 5,796 (227) (1,215) - 75,813
14 355 Poles Towers & Fixtures 109,445 2.53% 28,777 2,769 (301) (214) - 31,031
15 356 Conductors and Devices 104,680 2.52% 22,153 2,638 (332) (177) - 24,282
16 359 Roads and Trails 1,121 2.88% 305 32 - - - 338
17 470,457$ 124,567$ 11,345$ (860)$ (1,606)$ -$ 133,446$
18 Distribution Plant
19 360 Land Rights-R/W 3,604$ 0.00% -$ -$ -$ -$ -$ -$
20 360.1 Land Rights-Clearing 10,330 1.23% 2,202 127 - - - 2,329
21 362 Station Equipment 255,248 2.57% 66,598 6,560 (423) - - 72,735
22 364 Poles Towers & Fixtures 261,033 2.67% 57,337 6,970 (484) (744) - 63,080
23 365 Conductors and Devices 294,634 2.89% 95,607 8,515 (786) (222) - 103,114
24 368 Line Transformers 133,200 2.74% 33,177 3,650 (1,461) (111) - 35,254
25 369 Services 9,521 0.50% 6,695 48 - - - 6,743
26 370 Meters 415 6.68% (314) 28 (20) - - (306)
27 370.1 AMI Meters 38,918 5.00% 1,459 1,946 - (33) - 3,372
28 371 Installation on Customers' Premises 938 0.00% 938 - - - - 938
29 373 Street Lighting and Signal System 11,921 4.65% 3,664 554 (57) - - 4,161
30 1,019,763$ 267,364$ 28,397$ (3,231)$ (1,110)$ -$ 291,419$
Evidentiary Update dated October 3, 2017

FORTISBC INC. October 3, 2017 Section 11
ACCUMULATED DEPRECIATION CONTINUITY SCHEDULE Schedule 7.1
FOR THE YEAR ENDING DECEMBER 31, 2018
($000s)
Line Gross Plant for Depreciation Depreciation Cost ofNo. Account Particulars Depreciation Rate 12/31/17 Expense Retirements Removal Adjustments 12/31/18 Cross Reference
(1) (2) (3) (4) (5) (6) (7) (8) (9) (10) (11)
1 General Plant
2 389 Land 10,993$ 0.00% (12)$ -$ -$ -$ -$ (12)$
3 390 Structures - Frame & Iron 337 0.56% 4 2 - - - 6
4 390.1 Structures - Masonry 65,898 2.77% 19,273 1,825 - (10) - 21,089
5 391 Office Furniture & Equipment 6,399 1.68% 5,186 108 (521) (2) - 4,770
6 391.1 Computer Equipment 99,859 7.21% 79,997 7,200 (2,600) (56) - 84,541
7 391.2 AMI Software 10,413 10.00% 2,433 1,041 - - - 3,474
8 392 Transportation Equipment 27,975 6.01% 6,541 1,681 (1,749) (27) - 6,447
9 394 Tools and Work Equipment 15,526 2.49% 10,248 387 (495) (10) - 10,130
10 397 Communication Structures & Equipment 27,839 5.49% 20,603 1,528 (515) (3) - 21,612
11 397.2 AMI Communications Structure & Equipment 5,535 6.67% 737 369 - - - 1,106
12 270,774$ 145,010$ 14,141$ (5,880)$ (107)$ -$ 153,164$
13
14 108 Total Accumulated Depreciation 2,003,138$ 591,854$ 58,476$ (11,064)$ (3,958)$ -$ 635,308$ 1516 Cross Reference Schedule 6.117 Line 1418 Columns 3+4+5
Evidentiary Update dated October 3, 2017

FORTISBC INC. October 3, 2017 Section 11
Schedule 8
SCHEDULE NOT APPLICABLE
Evidentiary Update dated October 3, 2017

FORTISBC INC. October 3, 2017 Section 11
CONTRIBUTIONS IN AID OF CONSTRUCTION CONTINUITY SCHEDULE Schedule 9FOR THE YEAR ENDING DECEMBER 31, 2018($000s)
LineNo. Particulars 12/31/17 Adjustment Additions Retirements 12/31/18 Cross Reference
(1) (2) (3) (4) (5) (6) (7)
1 CIAC 187,217$ -$ 6,120$ -$ 193,337$
2
3 Amortization (68,323) - (3,913) - (72,236)
45 Net CIAC 118,894$ -$ 2,207$ -$ 121,101$
Evidentiary Update dated October 3, 2017

FORTISBC INC. October 3, 2017 Section 11
Schedule 10
SCHEDULE NOT APPLICABLE
Evidentiary Update dated October 3, 2017

FORTISBC INC. October 3, 2017 Section 11
UNAMORTIZED DEFERRED CHARGES AND AMORTIZATION - RATE BASE Schedule 11FOR THE YEAR ENDING DECEMBER 31, 2018($000s)
Line Opening Bal./ Gross Less Amortization Mid-YearNo. Particulars 12/31/17 Transfer/Adj. Additions Taxes Expense 12/31/18 Average Cross Reference
(1) (2) (3) (4) (5) (6) (7) (8) (9)
1 Benefits Matching Accounts2 Demand Side Management 22,595$ -$ 7,900$ (2,054)$ (3,711)$ 24,730$ 23,662$ 3 Deferred Debt Issue Costs 4,032 - - (126) (126) 3,780 3,906 4 Preliminary and Investigative Charges1 165 - (165) - - - 83 Note 15 Right of Way Reclamation (Pine Beetle Kill) 173 - - - (173) - 87 6 Accounting Treatment of non-AMI Meters 2,163 - - - (1,082) 1,082 1,623 7 29,128$ -$ 7,735$ (2,180)$ (5,092)$ 29,591$ 29,360$ 8 Other Accounts9 Pension and OPEB Liability (17,541) - 132 - - (17,409) (17,475)
10 (17,541)$ -$ 132$ -$ -$ (17,409)$ (17,475)$ 1112 Total Rate Base Deferral Accounts 11,587$ -$ 7,867$ (2,180)$ (5,092)$ 12,182$ 11,885$ 1314 Note 1: Gross additions for Preliminary and Investigative Charges are net of transfers to Construction Work in Progress. Additions of $350,000 - transfers of $465,000 = $(165,000)
Evidentiary Update dated October 3, 2017

FORTISBC INC. October 3, 2017 Section 11
UNAMORTIZED DEFERRED CHARGES AND AMORTIZATION - NON-RATE BASE Schedule 12FOR THE YEAR ENDING DECEMBER 31, 2018($000s)
Line Opening Bal./ Gross Less Amortization Mid-YearNo. Particulars 12/31/17 Transfer/Adj. Additions Taxes Expense 12/31/18 Average Cross Reference
(1) (2) (3) (4) (5) (6) (7) (8) (9)
1 Deferral Accounts Financed at Short Term Interest Rate23 Forecast Variance Accounts4 Revenue and Power Supply(1) -$ -$ -$ -$ -$ -$ -$ 5 Flow-Through Accounts (7,102) - - - 7,102 - (3,551) 6 Pension & Other Post Retirement Benefits (OPEB) Variance (369) - - - 289 (80) (224) 7 (7,470)$ -$ -$ -$ 7,391$ (80)$ (3,775)$ 8 Benefit Matching Accounts9 2014-2019 Performance Based Ratemaking Application 493 - - - (246) 246 369
10 Annual Reviews for 2015-2019 Rates 102 - 150 (39) (102) 111 106 11 Self-Generation Policy Application, Stage II (18) - 25 (7) - - (9) 12 Net Metering Program Tariff Update 88 - - - (88) - 44 13 BCUC Residential Inclining Block Rate Report (22) - - - 22 - (11) 14 2017 Demand Side Management Expenditure Schedule Application 11 - - - (11) - 5 15 BC Hydro Application for Power Purchase Agreement with FBC (7) - - - 7 - (3) 16 Community Solar Pilot Project 130 - - - (130) - 65 17 Tariff Applications - - - - - - - 18 775$ -$ 175$ (46)$ (548)$ 357$ 566$ 19 Other Accounts20 2014-2019 Earnings Sharing Account (615)$ -$ -$ -$ 615$ -$ (307)$ 21 (615)$ -$ -$ -$ 615$ -$ (307)$ 2223 Total Deferral Accounts at Short Term Interest (7,310)$ -$ 175$ (46)$ 7,458$ 278$ (3,515)$ 2425 Financing Costs at STI (361)$ -$ (96)$ 361$ (96)$ (229)$ 2627 Note 1: Revenue and Power Supply Variances are included in the Flow-Through Accounts during the PBR Term.
Evidentiary Update dated October 3, 2017

FORTISBC INC. October 3, 2017 Section 11
UNAMORTIZED DEFERRED CHARGES AND AMORTIZATION - NON-RATE BASE cont'd Schedule 12.1FOR THE YEAR ENDING DECEMBER 31, 2018($000s)
Line Opening Bal./ Gross Less Amortization Mid-YearNo. Particulars 12/31/17 Transfer/Adj. Additions Taxes Expense 12/31/18 Average Cross Reference
(1) (2) (3) (4) (5) (6) (7) (8) (9)
1 Deferral Accounts Financed at Weighted Average Cost of Debt23 Benefit Matching Accounts4 CPCN Projects Preliminary Engineering 231$ -$ 130$ -$ -$ 361$ 296$ 5 2016 Long Term Electric Resource Plan 704 - - - (141) 563 633 6 2017 Rate Design Application 481 - 1,250 (325) - 1,406 944 7 Transmission Customer Rate Design 2 - - - (2) - 1 8 2020 Revenue Requirements 22 - 70 (39) - 53 38 9 Multi-Year DSM Expenditure Schedule 93 - 125 (33) - 185 139 10 2018 Joint Pole Use Audit - - 200 (52) (30) 118 59 11 1,533$ -$ 1,775$ (449)$ (172)$ 2,687$ 2,110$ 1213 Other Accounts14 US GAAP Pension and OPEB Transitional Obligation 2,728$ -$ (827)$ (195)$ -$ 1,706$ 2,217$ 15 Advanced Metering Infrastructure Radio-Off Shortfall 127 - 120 (31) - 216 171 16 2,855$ -$ (707)$ (226)$ -$ 1,922$ 2,388$ 171819 Total Deferral Accounts at Weighted Average Cost of Debt 4,388$ -$ 1,068$ (675)$ (172)$ 4,609$ 4,498$ 2021 Financing Costs at WACD 499$ -$ 241$ (499)$ 241$ 370$ 2223 Deferral Accounts Financed at AFUDC2425 Benefit Matching Accounts26 On Bill Financing (OBF) Participant Loans 8$ -$ (5)$ -$ -$ 4$ 6$ 2728 Total Deferral Accounts at AFUDC 8$ -$ (5)$ -$ -$ 4$ 6$ 2930 Financing Costs at AFUDC 1$ -$ 1$ (1)$ 1$ 1$ 3132 Deferral Accounts Non-Interest Bearing 50$ -$ -$ -$ -$ 50$ 50$ 3334 Total Non Rate Base Deferral Accounts (including financing) (2,725)$ -$ 1,383$ (720)$ 7,146$ 5,086$ 1,180$
Evidentiary Update dated October 3, 2017

FORTISBC INC. October 3, 2017 Section 11
WORKING CAPITAL ALLOWANCE Schedule 13FOR THE YEAR ENDING DECEMBER 31, 2018($000s)
Line 2017 2018No. Particulars Approved Forecast Change Cross Reference
(1) (2) (3) (4) (5)
1 Cash Working Capital2 Cash Working Capital 5,496$ 4,852$ (645)$ Schedule 14, Line 41, Column 534 Add: Funds Unavailable5 Customer Loans 800 430 (370) 6 Employee Loans 310 310 - 7 Uncollectible Accounts 1,520 1,700 180 8 Inventory (average monthly investment) 580 680 100 9
10 Less: Funds Available11 Average Customer Deposits (4,440) (5,150) (710) 12 Average Provincial Sales Tax (710) (690) 20 13 Average Goods and Services Tax (650) (550) 100 1415 Total 2,905$ 1,582$ (1,325)$
Evidentiary Update dated October 3, 2017
FORTISBC INC. October 3, 2017 Section 11
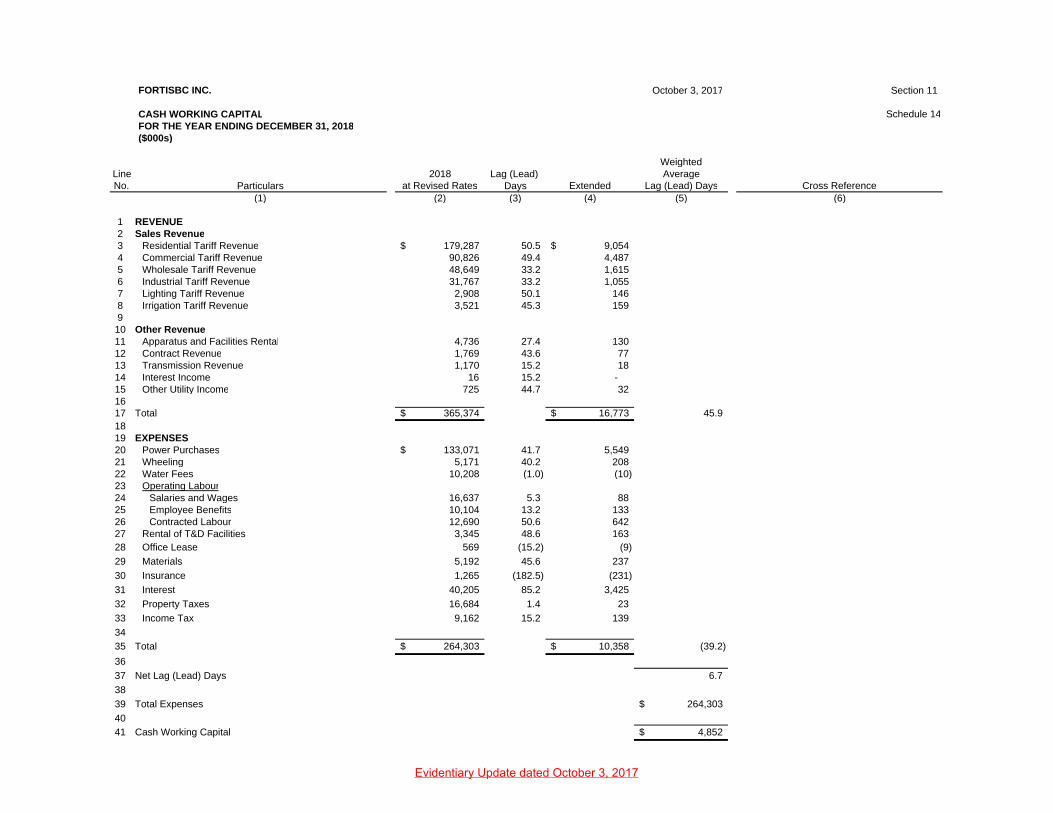
CASH WORKING CAPITAL Schedule 14FOR THE YEAR ENDING DECEMBER 31, 2018($000s)
WeightedLine 2018 Lag (Lead) AverageNo. Particulars at Revised Rates Days Extended Lag (Lead) Days Cross Reference
(1) (2) (3) (4) (5) (6)
1 REVENUE2 Sales Revenue3 Residential Tariff Revenue 179,287$ 50.5 9,054$ 4 Commercial Tariff Revenue 90,826 49.4 4,487 5 Wholesale Tariff Revenue 48,649 33.2 1,615 6 Industrial Tariff Revenue 31,767 33.2 1,055 7 Lighting Tariff Revenue 2,908 50.1 146 8 Irrigation Tariff Revenue 3,521 45.3 159 910 Other Revenue11 Apparatus and Facilities Rental 4,736 27.4 130 12 Contract Revenue 1,769 43.6 77 13 Transmission Revenue 1,170 15.2 18 14 Interest Income 16 15.2 - 15 Other Utility Income 725 44.7 32 1617 Total 365,374$ 16,773$ 45.9 1819 EXPENSES20 Power Purchases 133,071$ 41.7 5,549 21 Wheeling 5,171 40.2 208 22 Water Fees 10,208 (1.0) (10) 23 Operating Labour24 Salaries and Wages 16,637 5.3 88 25 Employee Benefits 10,104 13.2 133 26 Contracted Labour 12,690 50.6 642 27 Rental of T&D Facilities 3,345 48.6 163 28 Office Lease 569 (15.2) (9)
29 Materials 5,192 45.6 237
30 Insurance 1,265 (182.5) (231)
31 Interest 40,205 85.2 3,425
32 Property Taxes 16,684 1.4 23
33 Income Tax 9,162 15.2 139
34
35 Total 264,303$ 10,358$ (39.2)
36
37 Net Lag (Lead) Days 6.7
38
39 Total Expenses 264,303$
40
41 Cash Working Capital 4,852$
Evidentiary Update dated October 3, 2017

FORTISBC INC. October 3, 2017 Section 11
Schedule 15
SCHEDULE NOT APPLICABLE
Evidentiary Update dated October 3, 2017

FORTISBC INC. October 3, 2017 Section 11
UTILITY INCOME AND EARNED RETURN Schedule 16FOR THE YEAR ENDING DECEMBER 31, 2018($000s)
Line 2017 2018 ForecastNo. Particulars Approved at Existing Rates Revised Revenue at Revised Rates Change Cross Reference
(1) (2) (3) (4) (5) (6) (7)
1 ENERGY VOLUMES2 Sales Volume (GWh) 3,282 3,213 3,213 (69) Schedule 17, Line 9, Column 334 REVENUE5 Sales 352,389$ 356,340$ -$ 356,340$ 3,951$ Schedule 17, Line 19, Column 36 Deficiency (Surplus) 9,739 - 619 619 (9,120) 7 Total 362,128 356,340 619 356,959 (5,169) Schedule 18, Line 8, Column 589 EXPENSES10 Cost of Energy 151,472 148,450 - 148,450 (3,022) Schedule 19, Line 29, Column 311 O&M Expense (net) 48,917 49,802 - 49,802 886 Schedule 20, Line 32, Column 412 Depreciation & Amortization 55,657 52,695 - 52,695 (2,962) Schedule 21, Line 11, Column 313 Property Taxes 16,052 16,684 - 16,684 632 Schedule 22, Line 7, Column 314 Other Revenue (8,056) (8,416) - (8,416) (360) Schedule 23, Line 8, Column 315 Utility Income Before Income Taxes 98,086 97,124 619 97,742 (343) 1617 Income Taxes 10,849 9,001 161 9,162 (1,688) Schedule 24, Line 13, Column 31819 EARNED RETURN 87,237$ 88,123$ 458$ 88,581$ 1,344$ Schedule 26, Line 5, Column 7
2021 UTILITY RATE BASE 1,285,408$ 1,321,742$ 1,321,742$ 36,335$ Schedule 2, Line 29, Column 322 RATE OF RETURN ON UTILITY RATE BASE 6.79% 6.67% 6.70% -0.08% Schedule 26, Line 5, Column 6
Evidentiary Update dated October 3, 2017

FORTISBC INC. October 3, 2017 Section 11
VOLUME AND REVENUE Schedule 17FOR THE YEAR ENDING DECEMBER 31, 2018($000s)
Line 2017 2018No. Particulars Approved Forecast Change Cross Reference
(1) (2) (3) (4) (5)
1 ENERGY VOLUME SOLD (GWh)2 Residential 1,353 1,280 (73) 3 Commercial 879 912 33 4 Wholesale 587 586 (1) 5 Industrial 407 379 (28) 6 Lighting 14 15 1 7 Irrigation 40 41 1 89 Total 3,282 3,213 (69) 1011 REVENUE AT EXISTING RATES12 Residential 187,578$ 178,976$ (8,602)$ 13 Commercial 86,254 90,669 4,415 14 Wholesale 48,498 48,565 67 15 Industrial 33,501 31,712 (1,788) 16 Lighting 2,873 2,903 30 17 Irrigation 3,424 3,515 90 1819 Total 362,128$ 356,340$ (5,788)$
Evidentiary Update dated October 3, 2017

FORTISBC INC. October 3, 2017 Section 11
REVENUE AT EXISTING AND REVISED RATES Schedule 18FOR THE YEAR ENDING DECEMBER 31, 2018($000s)
2017 2018 Forecast AverageLine Approved Revenue at Effective Revenue at Number ofNo. Particulars Revenue Existing Rates Increase Revised Rates Customers GWh Cross Reference
(1) (2) (3) (4) (5) (6) (7) (8)
1 Residential 187,578$ 178,976$ 311$ 179,287$ 117,216 1,280 2 Commercial 86,254 90,669 157 90,826 15,935 912 3 Wholesale 48,498 48,565 84 48,649 6 586 4 Industrial 33,501 31,712 55 31,767 50 379 5 Lighting 2,873 2,903 5 2,908 1,559 15 6 Irrigation 3,424 3,515 6 3,521 1,090 41 78 Total 362,128$ 356,340$ 619$ 356,959$ 135,855 3,213 9
10 Effective Increase 0.17%
Evidentiary Update dated October 3, 2017
FORTISBC INC. October 3, 2017 Section 11
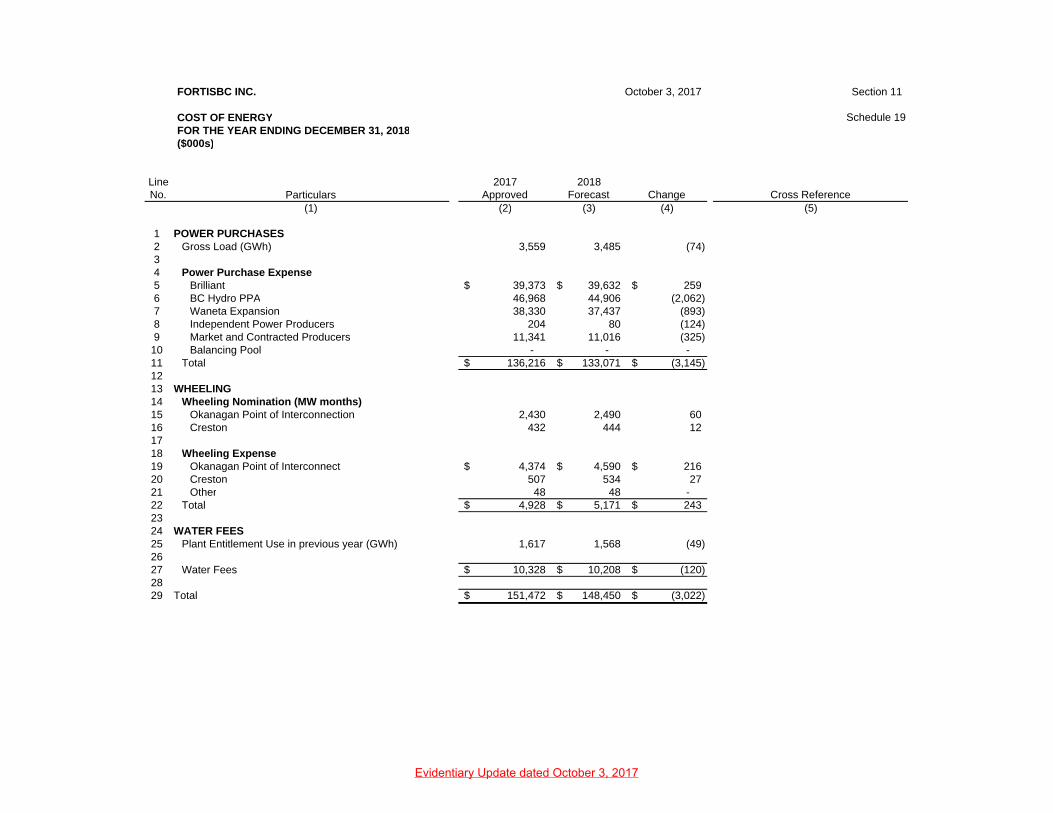
COST OF ENERGY Schedule 19FOR THE YEAR ENDING DECEMBER 31, 2018($000s)
Line 2017 2018No. Particulars Approved Forecast Change Cross Reference
(1) (2) (3) (4) (5)
1 POWER PURCHASES2 Gross Load (GWh) 3,559 3,485 (74) 34 Power Purchase Expense5 Brilliant 39,373$ 39,632$ 259$ 6 BC Hydro PPA 46,968 44,906 (2,062) 7 Waneta Expansion 38,330 37,437 (893) 8 Independent Power Producers 204 80 (124) 9 Market and Contracted Producers 11,341 11,016 (325)
10 Balancing Pool - - - 11 Total 136,216$ 133,071$ (3,145)$ 1213 WHEELING14 Wheeling Nomination (MW months)15 Okanagan Point of Interconnection 2,430 2,490 60 16 Creston 432 444 12 1718 Wheeling Expense19 Okanagan Point of Interconnect 4,374$ 4,590$ 216$ 20 Creston 507 534 27 21 Other 48 48 - 22 Total 4,928$ 5,171$ 243$ 2324 WATER FEES25 Plant Entitlement Use in previous year (GWh) 1,617 1,568 (49) 2627 Water Fees 10,328$ 10,208$ (120)$ 2829 Total 151,472$ 148,450$ (3,022)$
Evidentiary Update dated October 3, 2017

FORTISBC INC. October 3, 2017 Section 11
OPERATING AND MAINTENANCE EXPENSE Schedule 20FOR THE YEAR ENDING DECEMBER 31, 2018($000s)
Line Formula Forecast TotalNo. Particulars O&M O&M O&M Cross Reference
(1) (2) (3) (4) (5)
1 20132 Base O&M 60,159$ 3 Less: O&M tracked outside of Formula (7,810) 4 O&M Subject to Formula 52,349 5 20146 Net Inflation Factor 100.758% Schedule 3, Line 12, Column 37 Formula O&M 52,746 8 20159 Net Inflation Factor 100.452% Schedule 3, Line 12, Column 4
10 Formula O&M 52,984 11 201612 Net Inflation Factor 101.155% Schedule 3, Line 12, Column 513 Formula O&M 53,596$ 14 201715 Net Inflation Factor 100.886% Schedule 3, Line 12, Column 616 Formula Capex 54,071$ 17 201818 Net Inflation Factor 101.304% Schedule 3, Line 12, Column 719 Formula Capex 54,776$ 54,776$ 2021 O&M Tracked Outside of Formula22 Pension & OPEB (O&M Portion) 2,659$ 23 Insurance Premiums 1,265 24 Advanced Metering Infrastructure Costs/Savings (1,139) 25 Mandatory Reliability Standards Incremental O&M 1,070 26 Upper Bonnington Unit 4 Annual Inspection (40) 27 Total 3,815$ 3,815 2829 Total Gross O&M 58,591$ 3031 Capitalized Overhead - 15% of Total Gross O&M (8,789) 32 Net O&M Expense 49,802$
Evidentiary Update dated October 3, 2017

FORTISBC INC. October 3, 2017 Section 11
DEPRECIATION AND AMORTIZATION EXPENSE Schedule 21FOR THE YEAR ENDING DECEMBER 31, 2018($000s)
Line 2017 2018No. Particulars Approved Forecast Change Cross Reference
(1) (2) (3) (4) (5)
1 Depreciation2 Depreciation Expense 56,046$ 58,476$ 2,430$ Schedule 7.1, Line 14, Column 634 Amortization5 Rate Base deferrals 4,714$ 5,092$ 377$ Schedule 11, Line 12, Column 66 Non-Rate Base deferrals (1,600) (7,146) (5,546) Schedule 12.1, Line 34, Column 67 Utility Plant Acquisition Adjustment 186 186 - 8 CIAC (3,689) (3,913) (224) Schedule 9, Line 3, Column 49 (389) (5,781) (5,393)
1011 Total 55,657$ 52,695$ (2,963)$
Evidentiary Update dated October 3, 2017

FORTISBC INC. October 3, 2017 Section 11
PROPERTY AND SUNDRY TAXES Schedule 22FOR THE YEAR ENDING DECEMBER 31, 2018($000s)
Line 2017 2018No. Particulars Approved Forecast Change Cross Reference
(1) (2) (3) (4) (5)
1 Generating Plant 3,113$ 3,080$ (33)$ 2 Transmission and Distribution 6,328 6,672 344 3 Substation Equipment 3,806 3,731 (75) 4 Land and Buildings 729 1,192 463 5 1% In-Lieu of Municipal Taxes 2,076 2,009 (67) 67 Total 16,052$ 16,684$ 632$
Evidentiary Update dated October 3, 2017

FORTISBC INC. October 3, 2017 Section 11
OTHER REVENUE Schedule 23FOR THE YEAR ENDING DECEMBER 31, 2018($000s)
Line 2017 2018No. Particulars Approved Forecast Change Cross Reference
(1) (2) (3) (4) (5)
1 Apparatus and Facilities Rental 4,576$ 4,736$ 160$ 2 Contract Revenue 1,865 1,769 (96) 3 Transmission Access Revenue 1,179 1,170 (9) 4 Interest Income 24 16 (8) 5 Connection Charge 270 368 98 6 Other Recoveries 142 356 214 78 Total 8,056$ 8,416$ 360$
Evidentiary Update dated October 3, 2017

FORTISBC INC. October 3, 2017 Section 11
INCOME TAXES Schedule 24FOR THE YEAR ENDING DECEMBER 31, 2018($000s)
Line 2017 2018No. Particulars Approved Forecast Change Cross Reference
(1) (2) (3) (4) (5)
1 EARNED RETURN 87,237$ 88,581$ 1,344$ Schedule 16, Line 19, Column 52 Deduct: Interest on Debt (40,191) (40,205) (14) Schedule 26, Lines 1+2, Column 7
3 Adjustments to Taxable Income (16,167) (22,300) (6,133) Schedule 24, Line 29, Column 3
4 Accounting Income After Tax 30,878$ 26,075$ (4,803)$
5
6 1 - Current Income Tax Rate 74.00% 74.00% 0.00%
7 Taxable Income 41,728$ 35,237$ (6,491)$
8
9 Current Income Tax Rate 26.00% 26.00% 0.00%
10 Income Tax - Current 10,849$ 9,162$ (1,688)$
11
12 Previous Year Adjustment - - -
13 Total Income Tax 10,849$ 9,162$ (1,688)$
14
15
16 ADJUSTMENTS TO TAXABLE INCOME
17 Addbacks:
18 Depreciation 56,046$ 58,476$ 2,430$ Schedule 21, Line 2, Column 3
19 Amortization of Deferred Charges 3,114 (2,055) (5,169) Schedule 21, Lines 5+6, Column 320 Amortization of Utility Plant Acquisition Adjustment 186 186 - Schedule 21, Line 7, Column 321 Pension & OPEB Expense 6,806 6,289 (517) 2223 Deductions:24 Capital Cost Allowance (64,246) (66,522) (2,276) Schedule 25, Line 19, Column 625 CIAC Amortization (3,689) (3,913) (224) Schedule 21, Line 8, Column 326 Pension & OPEB Contributions (5,433) (5,594) (161) 27 Overheads Capitalized Expensed for Tax Purposes (8,632) (8,789) (156) Schedule 20, Line 31, Column 428 All Other (319) (379) (60) 29 Total (16,167)$ (22,300)$ (6,133)$
Evidentiary Update dated October 3, 2017

FORTISBC INC. October 3, 2017 Section 11
CAPITAL COST ALLOWANCE Schedule 25FOR THE YEAR ENDING DECEMBER 31, 2018($000s)
Line CCA 31/12/2017 2018 2018 31/12/2018No. Class Rate UCC Balance Adjustments Additions CCA UCC Balance
(1) (2) (3) (4) (5) (6) (7)
1 1(a) 4% 189,093 $ - $ - $ 7,564 $ 181,529 $ 2 1(b) 6% 28,851 - 598 1,749 27,700 3 2 6% 15,538 - - 932 14,606 4 3 5% 979 - - 49 930 5 6 10% 4 - - 0 3 6 8 20% 2,958 - 731 665 3,024 7 9 25% - - - - 8 10 30% 4,994 - 1,661 1,747 4,908 9 12 100% - - - - - 10 13 manual 117 - - - 117 11 14.1 5% - 164 4 160 12 17 8% 110,110 - 29,336 9,982 129,464 13 42 12% 4,732 - 199 580 4,351 14 45 45% 9 - - 4 5 15 46 30% 7,195 - - 2,158 5,036 16 47 8% 444,926 - 39,965 37,193 447,698 17 50 55% 5,197 - 3,769 3,895 5,071 1819 Total 814,702 $ - $ 76,424 $ 66,522 $ 824,603 $
Evidentiary Update dated October 3, 2017

FORTISBC INC. October 3, 2017 Section 11
RETURN ON CAPITAL Schedule 26FOR THE YEAR ENDING DECEMBER 31, 2018($000s)
2017 Average EarnedLine Approved Embedded Cost Earned ReturnNo. Particulars Earned Return Amount Ratio Cost Component Return Change Cross Reference
(1) (2) (3) (4) (5) (6) (7) (8) (9)
1 Long Term Debt 39,353$ 735,000$ 55.61% 5.20% 2.89% 38,203$ (1,150)$ Schedule 27, Line 9, Column 62 Short Term Debt 838 58,045 4.39% 3.45% 0.15% 2,003 1,164 3 Common Equity 47,046 528,697 40.00% 9.15% 3.66% 48,376 1,330 45 Total 87,237$ 1,321,742$ 100.00% 6.70% 88,581$ 1,345$ 67 Cross Reference Schedule 2
Line 29Column 3
2018
Evidentiary Update dated October 3, 2017

FORTISBC INC. October 3, 2017 Section 11
EMBEDDED COST OF LONG TERM DEBT Schedule 27FOR THE YEAR ENDING DECEMBER 31, 2018($000s)
AverageLine Issue Maturity Principal Interest InterestNo. Particulars Date Date Outstanding Rate Expense Cross Reference
(1) (2) (3) (4) (5) (6) (7)
1 Series G 28/08/1993 28/08/2023 25,000$ 8.800% 2,200$ 2 Series I 01/12/1997 01/12/2021 25,000 7.810% 1,953 3 Series 1 - 05 09/11/2005 09/11/2035 100,000 5.600% 5,600 4 Series 1 - 07 04/07/2007 04/07/2047 105,000 5.900% 6,195 5 MTN - 09 02/06/2009 02/06/2039 105,000 6.100% 6,405 6 MTN - 10 24/11/2010 24/11/2050 100,000 5.000% 5,000 7 MTN - 14 28/10/2014 28/10/2044 200,000 4.000% 8,000 8 MTN - 17 (forecast) 01/09/2017 01/09/2047 75,000 3.800% 2,850 9 Total 735,000$ 38,203$ 1011 Average Embedded Cost 5.20%
Evidentiary Update dated October 3, 2017

Appendix B
REVISED DRAFT ORDER

File XXXXX | file subject 1 of 2
ORDER NUMBER
G-xx-xx
IN THE MATTER OF the Utilities Commission Act, RSBC 1996, Chapter 473
and
FortisBC Inc.
Annual Review of 2018 Rates
BEFORE: [Panel Chair]
Commissioner Commissioner
on Date
ORDER
WHEREAS: A. On September 15, 2014, the British Columbia Utilities Commission (Commission) issued its Decision and
Order G-139-14 approving for FortisBC Inc. (FBC) a Multi-Year Performance Based Ratemaking (PBR) Plan for 2014 through 2019 (the PBR Decision). In accordance with the PBR Decision, FBC is to conduct an Annual Review process to set rates for each year;
B. By letter dated July 24, 2017, FBC proposed a regulatory timetable for its annual review for 2018 rates;
C. By Order G-116-17 dated July 27, 2017, the Commission established the Regulatory Timetable for the annual review for 2018 rates which included the anticipated date for FBC to file its annual review materials, the deadline for intervener registration, one round of information requests, a workshop, FBCs response to undertakings requested at the workshop, and written final and reply arguments;
D. On August 10, 2017, FBC submitted its Annual Review for 2018 Rates Application materials (Application);
E. On October 3, 2017, FBC submitted an Evidentiary Update to its Annual Review for 2018 Rates Application materials (Evidentiary Update);
F. The Commission has reviewed the Application and evidence filed in the proceeding and makes the following determinations.
NOW THEREFORE pursuant to sections 59 to 61 of the Utilities Commission Act, the Commission orders as follows:
Order G-xx-xx
File XXXXX | file subject 2 of 2
1. FortisBC Inc.’s (FBC) application for a 0.17 percent rate increase to be applied to all components of rates for all customer classes is approved, effective January 1,2018;
2. FBC is approved to establish the following three non-rate base deferral accounts and is approved to accrue financing charges on the three non-rate base deferral accounts based on FBC’s weighted average cost of debt:
Multi-Year DSM Expenditure Schedule regulatory proceeding, with an amortization period to be proposed in a future Annual Review;
2020 Revenue Requirement regulatory proceeding, with an amortization period to be proposed in a future Annual Review; and
2018 Joint Use Pole Audit with a five year amortization period beginning in 2018.
3. FBC is approved to establish the following two non-rate base deferral accounts with a one-year amortization period, and is approved to accrue financing charges on the two non-rate base deferral accounts based on FBC’s short-term interest rate:
Community Solar Pilot Project regulatory proceeding; and
Tariff Applications.
4. Z-factor treatment for the 2018 incremental operations and maintenance expenses and capital expenditures related to Mandatory Reliability Standards Assessment Reports No. 8 and 10 is approved.
DATED at the City of Vancouver, in the Province of British Columbia, this (XX) day of (Month Year). BY ORDER (X. X. last name) Commissioner
Deleted: 0.11