diamond zoysiagrass response and seedhead control using
TRANSCRIPT
Clemson University Clemson University
TigerPrints TigerPrints
All Theses Theses
December 2019
Diamond Zoysiagrass Response and Seedhead Control Using Diamond Zoysiagrass Response and Seedhead Control Using
Plant Growth Regulators Plant Growth Regulators
Silas Ledford Clemson University, [email protected]
Follow this and additional works at: https://tigerprints.clemson.edu/all_theses
Recommended Citation Recommended Citation Ledford, Silas, "Diamond Zoysiagrass Response and Seedhead Control Using Plant Growth Regulators" (2019). All Theses. 3207. https://tigerprints.clemson.edu/all_theses/3207
This Thesis is brought to you for free and open access by the Theses at TigerPrints. It has been accepted for inclusion in All Theses by an authorized administrator of TigerPrints. For more information, please contact [email protected].
DIAMOND ZOYSIAGRASS RESPONSE AND SEEDHEAD CONTROL USING PLANT GROWTH REGULATORS
A Thesis Presented to
the Graduate School of Clemson University
In Partial Fulfillment of the Requirements for the Degree
Master of Science Plant and Environmental Science
by Silas Alexander Ledford
December 2019
Accepted by: Dr. L. B. McCarty, Committee Chair
Dr. William Bridges Jr. Dr. Matthew Cutulle

ii
ABSTRACT
Golfers have steadily increased demands for putting green quality, including
distance and smoothness. ‘Diamond’ zoysiagrass has emerged as a viable C4 turfgrass to
be used by golf courses as putting greens or fairways and tees. ‘Diamond’ zoysiagrass
exhibits multiple benefits over other C4 and C3 turfgrasses, but an undesirable trait is
seedhead production.
Three studies were conducted at Clemson University from April 2018 to
November 2019 to investigate the effects of plant growth regulators (PGRs) on
‘Diamond’ zoysiagrass’ turf quality (TQ), lateral recovery and seedhead production.
Study 1 tested PGRs in a field setting on the TQ, seedhead production and root mass of a
‘Diamond’ zoysiagrass putting green. Study 2 tested PGRs on the TQ, seedhead
production, clipping and root mass of ‘Diamond’ zoysiagrass in a greenhouse setting.
Study 3 tested PGRs effects on the lateral growth of ‘Diamond’ zoysiagrass.
All three studies included treatments of trinexapac-ethyl (TE), prohexadione-
calcium (PC), paclobutrazol (PB), flurprimidol (FL), ethephon (EP) and simazine (SI).
The first study determined initial seedhead production was best predicted by 12.4 h
photoperiod but accumulated growing degree days (GDD) was also fairly accurate.
Compared to untreated, seedhead count was reduced through treatments SI and SI + TE
by 80 and 75%, respectively, during fall seasons. Treatments did not consistently increase
TQ above untreated. In fall 2018 at 14 days after treatment (DAT), SI and SI + TE
decreased TQ to 5.5 and 5.3, respectively, significantly below the untreated’s rating of 7.
iii
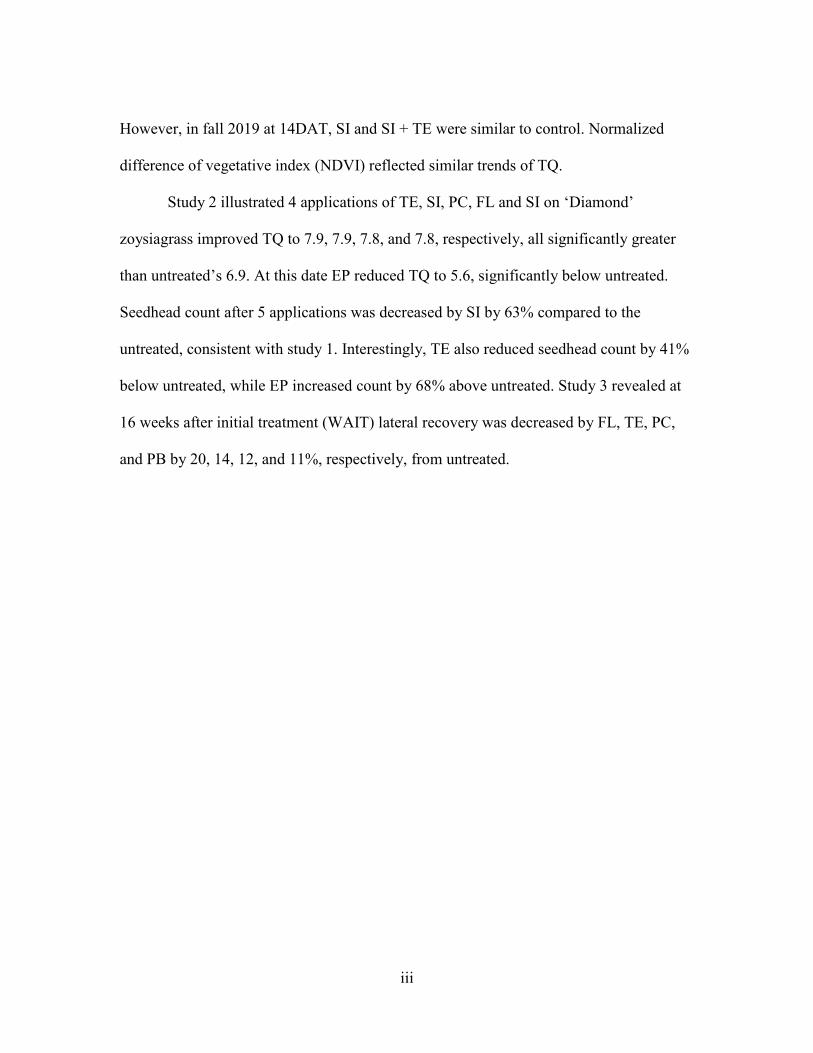
However, in fall 2019 at 14DAT, SI and SI + TE were similar to control. Normalized
difference of vegetative index (NDVI) reflected similar trends of TQ.
Study 2 illustrated 4 applications of TE, SI, PC, FL and SI on ‘Diamond’
zoysiagrass improved TQ to 7.9, 7.9, 7.8, and 7.8, respectively, all significantly greater
than untreated’s 6.9. At this date EP reduced TQ to 5.6, significantly below untreated.
Seedhead count after 5 applications was decreased by SI by 63% compared to the
untreated, consistent with study 1. Interestingly, TE also reduced seedhead count by 41%
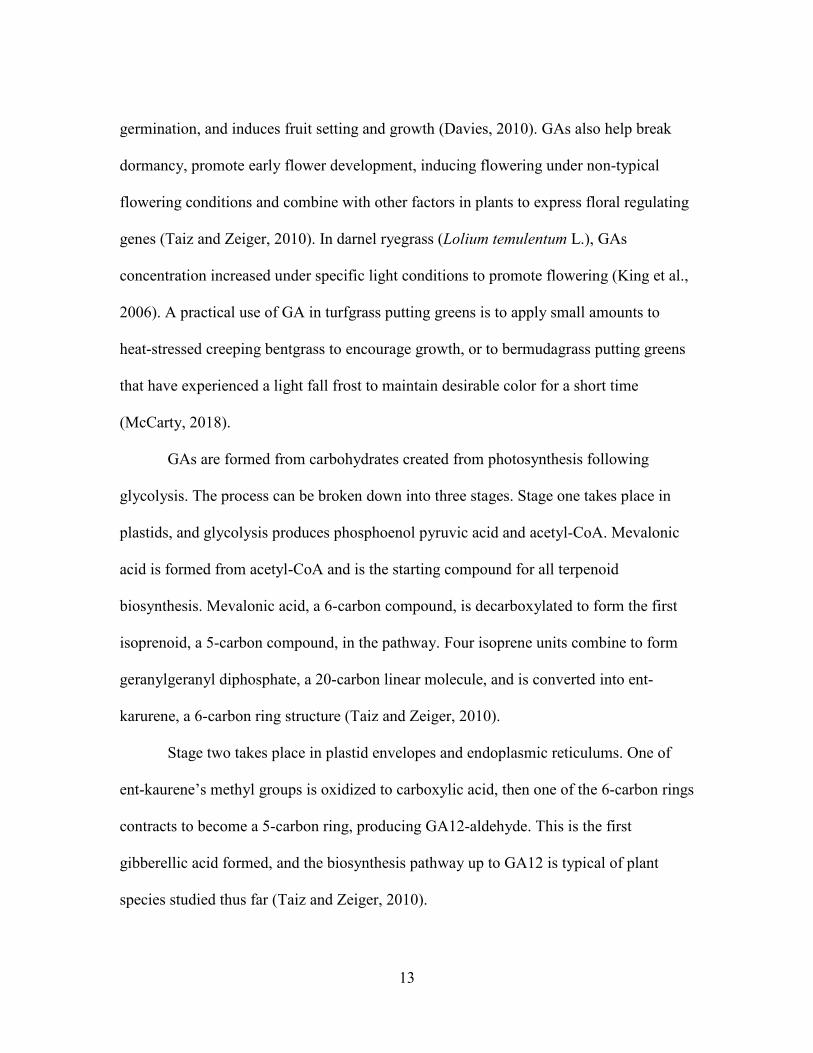
below untreated, while EP increased count by 68% above untreated. Study 3 revealed at
16 weeks after initial treatment (WAIT) lateral recovery was decreased by FL, TE, PC,
and PB by 20, 14, 12, and 11%, respectively, from untreated.

iv
DEDICATION
I dedicate this work to Mr. Gerald Harris, a family man who showed me how to
work hard and enjoy life’s blessings. I love you granddaddy and can’t wait to see you
again.

v
ACKNOWLEDGMENTS
My major professor Dr. Bert McCarty deserves the first and most gracious
acknowledgement. He gave me opportunities to learn from his experiences and
knowledge, and I will be forever thankful for his patience with a bulldawg. I consider
myself extremely blessed to have worked under such an icon in the turfgrass management
industry. I would like to thank him for funding my assistantship and research.
I also greatly appreciate Dr. Billy Bridges and Dr. Matthew Cutulle for serving on
my graduate committee. Dr. Bridges provided ample help in analyzing data and greatly
contributed to this project’s success. Dr. Cutulle gave me opportunities to learn outside
the turfgrass management field.
I am grateful for the colleagues I had during my time at Clemson. I would
especially like to thank Nate Gambrell for his help setting up trials and his advice. I
would also like to thank Philip Brown, Josh Weaver, Bobby Kerr, Jacob Taylor, and Tee
Stoudemayer for camaraderie and direction.
I also want to thank my entire family for their endless love and support of me.
Thank you for shaping my life for the better, I can only hope to repay the favor someday.
To Daly, thank you so much for sharing burdens with me. I will always remember
how your selfless love inspired me. You make me so proud.
Finally, I thank my lord and savior Jesus Christ. Without his grace on the cross I
would still be lost and without purpose.
vi
TABLE OF CONTENTS
Page
TITLE PAGE .................................................................................................................... i
ABSTRACT ..................................................................................................................... ii
DEDICATION ................................................................................................................ iii
ACKNOWLEDGMENTS .............................................................................................. iv
LIST OF TABLES ......................................................................................................... vii
LIST OF FIGURES ........................................................................................................ xi
CHAPTER
I. INTRODUCTION ......................................................................................... 1
Putting Greens .......................................................................................... 1 Zoysiagrass .............................................................................................. 1 Turfgrass Seedhead Production ............................................................... 7 Ethylene ................................................................................................. 11 Gibberellic Acid (GA) ........................................................................... 12 Turfgrass Plant Growth Regulators (PGRs) .......................................... 14 Trinexapac-ethyl (TE) ............................................................................ 18 Prohexadione calcium (PC) ................................................................... 19 Flurprimidol (FL) ................................................................................... 20 Paclobutrazol (PB) ................................................................................. 21 Ethephon (EP) ........................................................................................ 22 Simazine (SI) ......................................................................................... 24
II. ‘DIAMOND’ ZOYSIAGRASS PUTTING GREEN RESPONSE TO PLANTGROWTH REGULATORS AND SEEDHEAD CONTROL ............... 25
Materials and Methods ........................................................................... 25 Results and Discussion .......................................................................... 31
III. ‘DIAMOND’ ZOYSIAGRASS RESPONSE TO REPEAT APPLICATIONSOF PLANT GROWTH REGULATORS............................................... 53
Materials and Methods ........................................................................... 53
vii
Table of Contents (continued)
Results and Discussion .......................................................................... 57
IV. ‘DIAMOND’ ZOYSIAGRASS LATERAL RECOVERY FROM REPEATAPPLICATIONS OF PLANT GROWTH REGULATORS ................. 65
Materials and Methods ........................................................................... 65 Results and Discussion .......................................................................... 68
CONCLUSION .............................................................................................................. 71
REFERENCES .............................................................................................................. 80
Page

viii
LIST OF TABLES
Table Page
1. Treatments and rates for ‘Diamond’ zoysiagrass putting green seedheadcontrol and response to plant growth regulators study .......................... 27
2. Analysis of variance (ANOVA) table of a randomized complete block designfor turf quality (TQ) and normalized difference of vegetative index (NDVI) in ‘Diamond’ zoysiagrass putting green seedhead control and response to plant growth regulators study ............................................. 28
3. Analysis of variance (ANOVA) table of a randomized complete block designfor seedhead coverage and seedhead count in ‘Diamond’ zoysiagrass putting green seedhead control and response to plant growth regulators study ....................................................................................................... 29
4. Analysis of variance (ANOVA) table of a randomized complete block designfor root mass count in ‘Diamond’ zoysiagrass putting green seedhead control and response to plant growth regulators study. ......................... 29
5. Initial seedhead emergence dates for ‘Diamond’ zoysiagrass putting green, .accumulated growing degree days (GDD) and photoperiod of Clemson, SC during 2018 and 2019 ...................................................................... 32
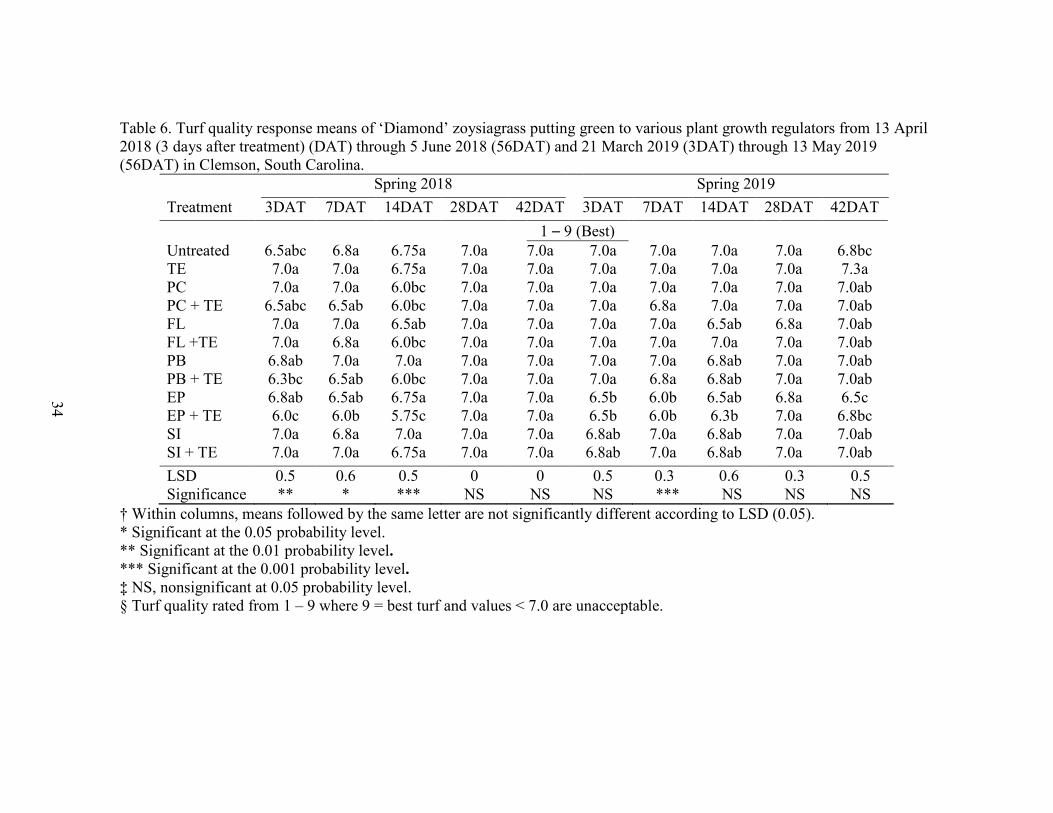
6. Turf quality response means of ‘Diamond’ zoysiagrass putting green tovarious plant growth regulators from 13 April 2018 (3DAT) through 5 June 2018 (56DAT) and 21 March 2019 (3DAT) through 13 May 2019 (56DAT) in Clemson, South Carolina ................................................... 34
7. Turf quality response means of ‘Diamond’ zoysiagrass putting green tovarious plant growth regulators from 9 September 2018 (3DAT) through 1 November 2018 (56DAT) and 12 September 2019 (3DAT) through 4 November 2019 (56DAT) in Clemson, South Carolinas .................... 35
8. Contrasts of turf quality response means of ‘Diamond’ zoysiagrass puttinggreen to plant growth regulator (PGR) treatments combined with trinexapac-ethyl (–) vs. PGRs alone (+) from 10 April 2018 through 4 November 2019 from 3 to 56 days after treatment (DAT) in Clemson, South Carolina ....................................................................................... 36

ix
List of Tables (Continued) Table Page
9. Normalized difference of vegetative index response means of ‘Diamond’Zoysiagrass putting green to various plant growth regulators from 13 April 2018 (3DAT) through 5 June 2018 (56DAT) and 21 March 2019 (3DAT) through 13 May 2019 (56DAT) in Clemson, South Carolina. .............. 38
10. Normalized difference of vegetative index response means of ‘Diamond’zoysiagrass putting green to various plant growth regulators from 9 September 2018 (3DAT) through 1 November 2018 (56DAT) and 12 September 2019 (3DAT) through 4 November 2019 (56DAT) in Clemson, South Carolina ....................................................................................... 39
11. Contrasts of normalized difference of vegetative index means of ‘Diamond’zoysiagrass putting green to plant growth regulator (PGR) treatments combined with trinexapac-ethyl (–) vs. PGRs alone (+) from 10 April 2018 through 4 November 2019 from 3 to 56 days after treatment (DAT) in Clemson, South Carolina ................................................................... 40
12. Percentage seedhead coverage response means of ‘Diamond’ zoysiagrassputting green to various plant growth regulators from 24 April 2018 (14DAT) through 5 June 2018 (56DAT) and 1 April 2019 (14DAT) through 13 May 2019 (56 DAT) in Clemson, South Carolina .............. 42
13. Percentage seedhead coverage response means of ‘Diamond’ zoysiagrassputting green to various plant growth regulators from 20 September 2018 (14DAT) through 1 November 2018 (56DAT) and 23 September 2019 (14DAT) through 4 November 2019 (56DAT) in Clemson, South Carolina ....................................................................................... 43
14. Contrasts of percentage seedhead coverage means of ‘Diamond’ zoysiagrassputting green to plant growth regulator (PGR) treatments combined with trinexapac-ethyl (–) vs. PGRs alone (+) from 24 April 2018 through 4 November 2019 from 14 to 56 days after treatment (DAT) in Clemson, South Carolina ....................................................................................... 44
15. Seedhead count response means of ‘Diamond’ zoysiagrass putting green tovarious plant growth regulators from 24 April 2018 (14DAT) through 5 June 2018 (56 DAT) and 1 April 2019 (14DAT) through 13 May 2019 (56 DAT) in Clemson, South Carolina .................................................. 47
x
List of Tables (Continued) Table Page
16. Seedhead count response means of ‘Diamond’ zoysiagrass putting green tovarious plant growth regulators from 20 September 2018 (14DAT) through 1 November 2018 (56DAT) and 23 September 2019 (14DAT) through 4 November 2019 (56DAT) in Clemson, South Carolina of means from 28 DAT 5/8/2018 ............................................................... 48
17. Contrasts of seedhead count means of ‘Diamond’ zoysiagrass putting green toplant growth regulator (PGR) treatments combined with trinexapac-ethyl (–) vs. PGRs alone (+) from 24 April 2018 through 4 November 2019 from 14 to 56 days after treatment (DAT) in Clemson, South Carolina ....................................................................................... 59
18. Root mass response means of ‘Diamond’ zoysiagrass putting green to variousplant growth regulators from 56 days after treatment 5 June 2018, 1 November 2018, 13 May 2019 and 4 November 2019 in Clemson, South Carolina ....................................................................................... 50
19. Contrasts of root mass means of ‘Diamond’ zoysiagrass putting green toplant growth regulators (PGRs) combined with trinexapac-ethyl (–) vs. PGRs alone (+) from 5 June 2018, 1 November 2018, 13 May 2019 and 4 November 2019 from 56 days after treatment (DAT) in Clemson, South Carolina ....................................................................................... 51
20. Contrast tests of various means and parameters to determine how plant growthregulators (PGRs) used in combination with trinexapac-ethyl (+) compared to PGRs (–) alone .................................................................. 52
21. Treatments and rates used in ‘Diamond’ zoysiagrass seedhead control andresponse to repeat applications of plant growth regulators study .......... 55
22. Analysis of variance (ANOVA) table of a randomized complete block designfor turfgrass quality (TQ), normalized differences of vegetative index (NDVI) and seedhead count p-values from ‘Diamond’ zoysiagrass seedhead control and response to repeat applications of plant growth regulators study ...................................................................................... 56
23.Analysis of variance (ANOVA) table of a randomized complete block designfor clipping weight and root mass p-values from ‘Diamond’ zoysiagrass seedhead control and response to repeat applications of plant growth regulators study ...................................................................................... 56

xi
List of Tables (Continued) Table Page
24. Turf quality response means of ‘Diamond’ zoysiagrass from 4 to 20 weeksafter initial treatment (WIAT) from 30 January 2019 to 22 May 2019 in Clemson, South Carolina ....................................................................... 59
25. Normalized difference of vegetative index response means of ‘Diamond’zoysiagrass over 20 weeks from 30 January 2019 to 22 May 2019 in Clemson, South Carolina ....................................................................... 60
26. Seedhead count response means of ‘Diamond’ zoysiagrass from 4 to 20 weeksafter initial treatment (WIAT) from 30 January 2019 to 22 May 2019 in Clemson, South Carolina ....................................................................... 62
27. Clipping weight response means of ‘Diamond’ zoysiagrass from 24 weeksafter initial treatment (WIAT) from 19 June 2019 in Clemson, South Carolina ....................................................................................... 63
28. Root mass response means of ‘Diamond’ zoysiagrass from 24 weeks afterinitial treatment (WIAT) from 19 June 2019 in Clemson, South Carolina ....................................................................................... 64
29. Treatments and rates used in ‘Diamond’ zoysiagrass lateral recovery usingrepeat applications of plant growth regulators study ............................. 66
30. Analysis of variance (ANOVA) table of a randomized complete block designfor lateral recovery means of ‘Diamond’ zoysiagrass lateral recovery using repeat applications of plant growth regulators study ............................. 67
31. Percentage lateral recovery response means of ‘Diamond’ zoysiagrass from 4to 40 weeks after initial treatment (WAIT) from 30 January 2019 to 9 October 2019 in Clemson, South Carolina ............................................ 70

xii
LIST OF FIGURES
Figure Page
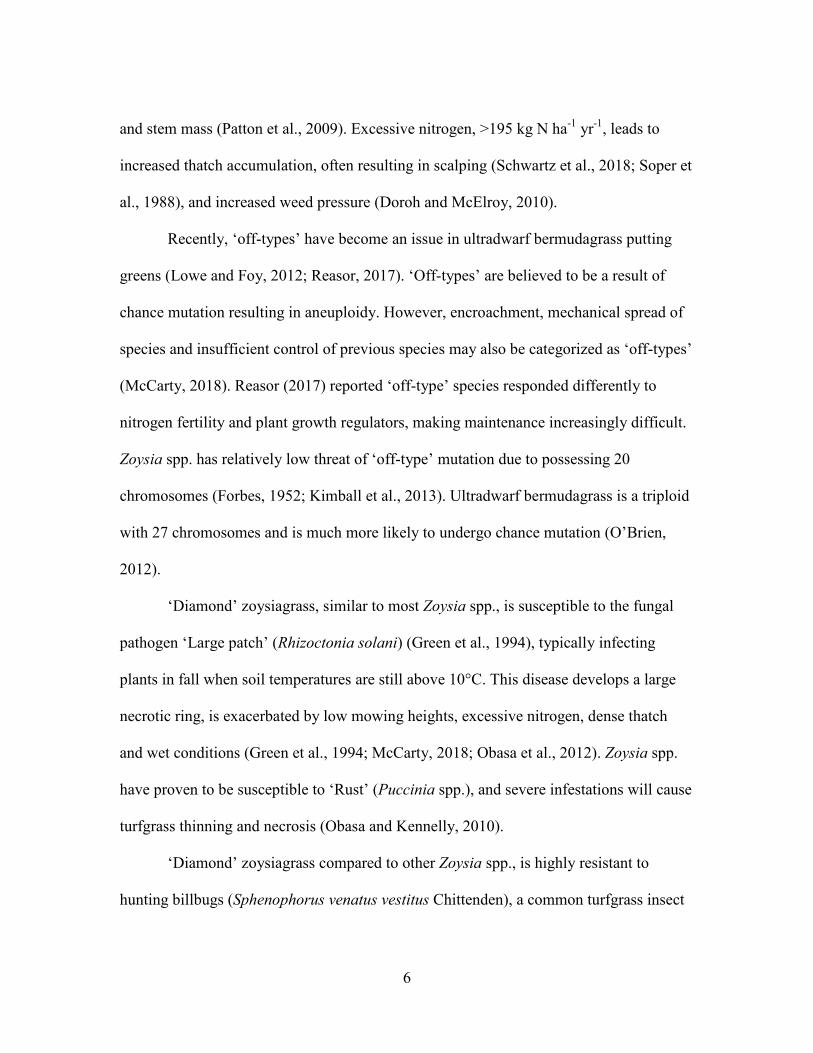
1. ‘Diamond’ zoysiagrass’ seedhead presence (red) throughout chapter 1 fieldstudy. Specific photoperiods and accumulated growing degree days are listed in Table 5 ...................................................................................... 72
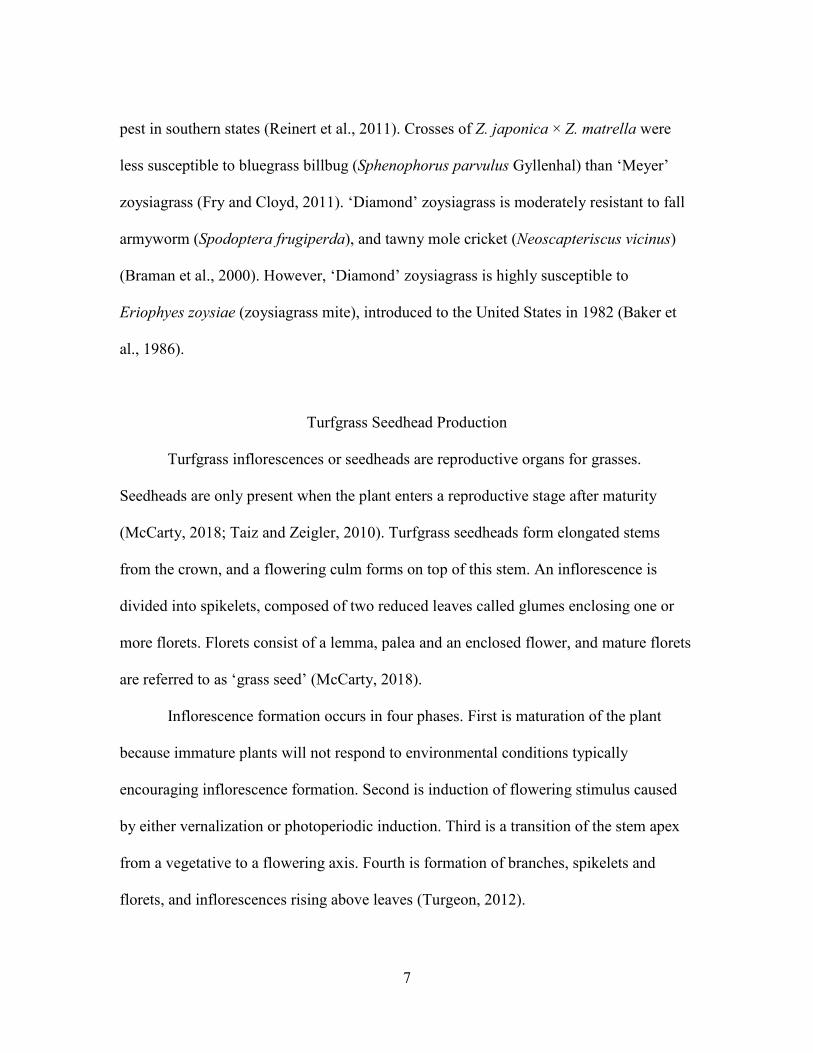
2. Severe seedhead pressure on a ‘Diamond’ zoysiagrass putting green ......... 73
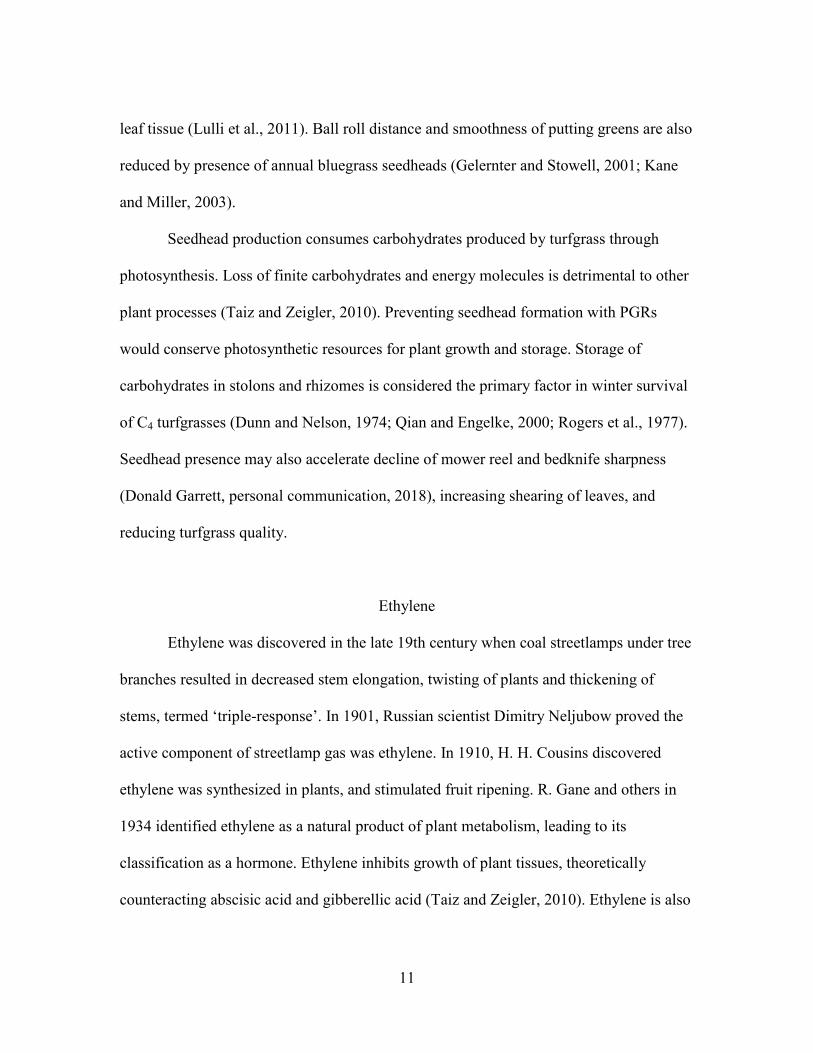
3. ‘Diamond’ zoysiagrass’ seedhead pressure likely impacts ball roll smoothnessand distance ............................................................................................ 74
4. Initial seedhead emergence in ‘Diamond’ zoysiagrass with young lightcolored seedheads .................................................................................. 75
5. 4 November 2019 (56DAT) treatments containing simazine (dark green)stand out from all other treatments with abundant light colored seedheads ............................................................................................... 76
6. A seedhead count untreated control sample from 1 November 2018(56DAT) ....................................................................................................... 77
7. Ethephon treated ‘Diamond’ zoysiagrass (left) after 4 sequential treatmentsfrom chapter 3, with abundant seedhead production and wider leaf blades than untreated (right).............................................................................. 78
8. ‘Diamond’ zoysiagrass (left) and ‘Tifeagle’ bermudagrass (right) lateralgrowth differences after similar duration in greenhouse ....................... 79

1
CHAPTER ONE
INTRODUCTION
Putting Greens
Golf course putting greens are intensively managed turfgrass systems with
delicate agronomic challenges. Golfers’ demands for increased putting distances or
“speed” lead to low mowing heights, plant growth regulator use, regular sand topdressing
and lightweight rolling to increase ball roll distance, and smoothness (Fagerness and
Yelverton, 2001; Hartwiger et al., 2001; McCarty et al., 2011; McCullough et al., 2005b).
Putting greens until 1960 were constructed with native soils or mixtures of native soil,
sand and organic matter in a 1:1:1 ratio before the United States Golf Association
(USGA) released methods for putting green construction (Ferguson, 1965; Holmes,
1967). This rootzone of a precise mixture of textured sands and organic matter over pea
gravel and drain tiles creates a perched water table (Ferguson, 1965; USGA 2018).
Benefits of this method include rapid drainage, minimal soil compaction, nutritional
consistencies, water management predictability and avoidance of native soil pests
(Hummel, 1993; O’Brien and Oatis, 2018; USGA, 2018).
Zoysiagrass
Zoysiagrass (Zoysia spp.) is a warm season or C4 turfgrass utilized on golf
courses, home lawns, sports fields and commercial landscapes throughout the transition
zone (McCarty, 2018). Common zoysiagrass species are Zoysia japonica and Z. matrella

2
(Patton et al., 2017), but Zoysia tenuifolia, Z. pacifica, Z. minima have attractive qualities
used to breed new varieties (Chandra et al., 2017; Engelke and Anderson, 2003; Kimball
et al., 2013). Zoysia spp. have a larger adaptable range than other C4 grasses due to
excellent tolerances of shade, freezing temperatures and photosynthetically active tissue
at low temperatures (Engelke and Qian, 2000; Hinton et al., 2012; Rogers et al., 1977;
Sladek et al., 2009). Zoysia spp. exhibit slower lateral growth rates compared to other C4
grasses, but typically develop dense thatch layers (Dunn et al., 1981; Fry and Dernoeden,
1987; McCarty, 2018).
Z. matrella or ‘Manilagrass’, was introduced to the United States by Charles V.
Piper, who originally collected it in 1912 from a Philippine Islands’ seashore
environment (USDA Bureau of Plant Industry, 1915; Patton et al., 2017). ‘Diamond’
zoysiagrass (Zoysia matrella (L.) Merr.) was originally collected by Dr. Milton C.
Engelke in 1982 from Asia (Murray and Engelke, 1983). ‘Diamond’ zoysiagrass was
evaluated at Texas A&M Agrilife Research and Extension center in Dallas, Texas, and
was patent registered in 2002 (Engelke, 1998; Engelke et al., 2002).
‘Diamond’ zoysiagrass utilizes stoloniferous and rhizomatous growth with
extremely high tiller density (Trappe et al., 2011), a desirable trait for sod production
(Engelke et al., 2002; Lulli et al., 2011), and preventing weed species colonization.
‘Diamond’ zoysiagrass has a very fine leaf texture and tolerates mowing heights less than
2.5 mm (Menchyk et al., 2012), making it suitable for golf course putting greens (Patton
et al., 2017).
Patton et al. (2004) reported Zoysia spp. establishment from seed is difficult, as
3
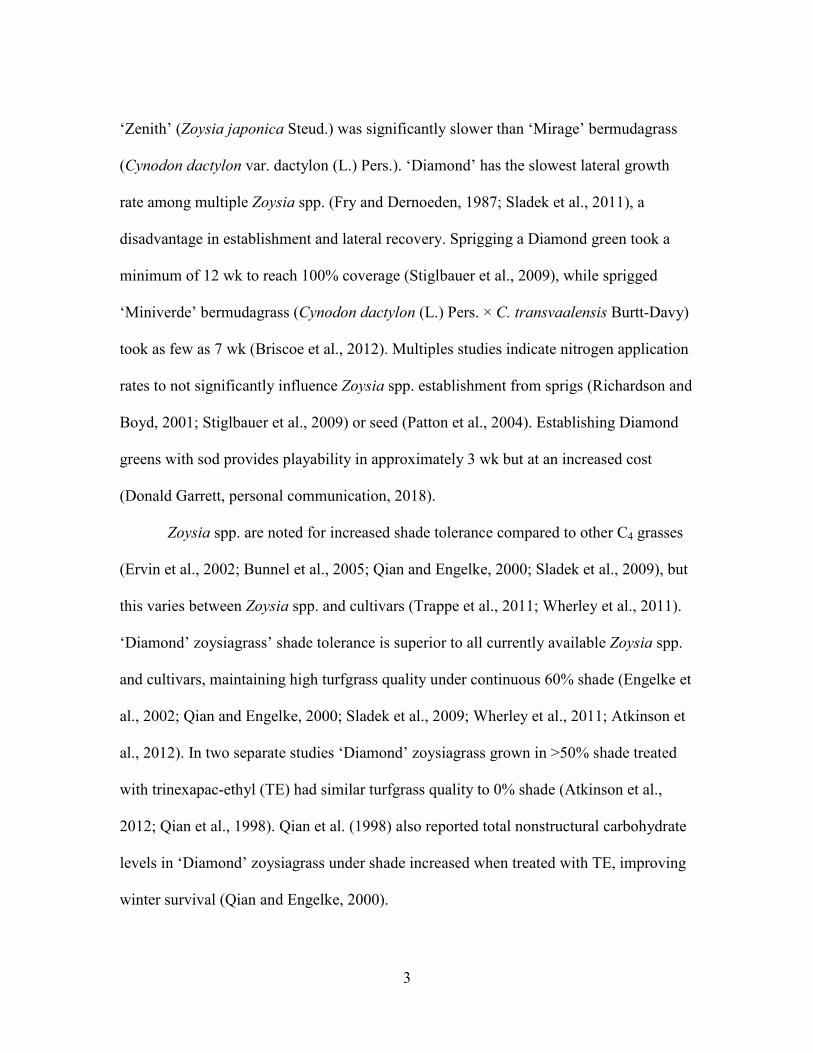
‘Zenith’ (Zoysia japonica Steud.) was significantly slower than ‘Mirage’ bermudagrass
(Cynodon dactylon var. dactylon (L.) Pers.). ‘Diamond’ has the slowest lateral growth
rate among multiple Zoysia spp. (Fry and Dernoeden, 1987; Sladek et al., 2011), a
disadvantage in establishment and lateral recovery. Sprigging a Diamond green took a
minimum of 12 wk to reach 100% coverage (Stiglbauer et al., 2009), while sprigged
‘Miniverde’ bermudagrass (Cynodon dactylon (L.) Pers. × C. transvaalensis Burtt-Davy)
took as few as 7 wk (Briscoe et al., 2012). Multiples studies indicate nitrogen application
rates to not significantly influence Zoysia spp. establishment from sprigs (Richardson and
Boyd, 2001; Stiglbauer et al., 2009) or seed (Patton et al., 2004). Establishing Diamond
greens with sod provides playability in approximately 3 wk but at an increased cost
(Donald Garrett, personal communication, 2018).
Zoysia spp. are noted for increased shade tolerance compared to other C4 grasses
(Ervin et al., 2002; Bunnel et al., 2005; Qian and Engelke, 2000; Sladek et al., 2009), but
this varies between Zoysia spp. and cultivars (Trappe et al., 2011; Wherley et al., 2011).
‘Diamond’ zoysiagrass’ shade tolerance is superior to all currently available Zoysia spp.
and cultivars, maintaining high turfgrass quality under continuous 60% shade (Engelke et
al., 2002; Qian and Engelke, 2000; Sladek et al., 2009; Wherley et al., 2011; Atkinson et
al., 2012). In two separate studies ‘Diamond’ zoysiagrass grown in >50% shade treated
with trinexapac-ethyl (TE) had similar turfgrass quality to 0% shade (Atkinson et al.,
2012; Qian et al., 1998). Qian et al. (1998) also reported total nonstructural carbohydrate
levels in ‘Diamond’ zoysiagrass under shade increased when treated with TE, improving
winter survival (Qian and Engelke, 2000).
4
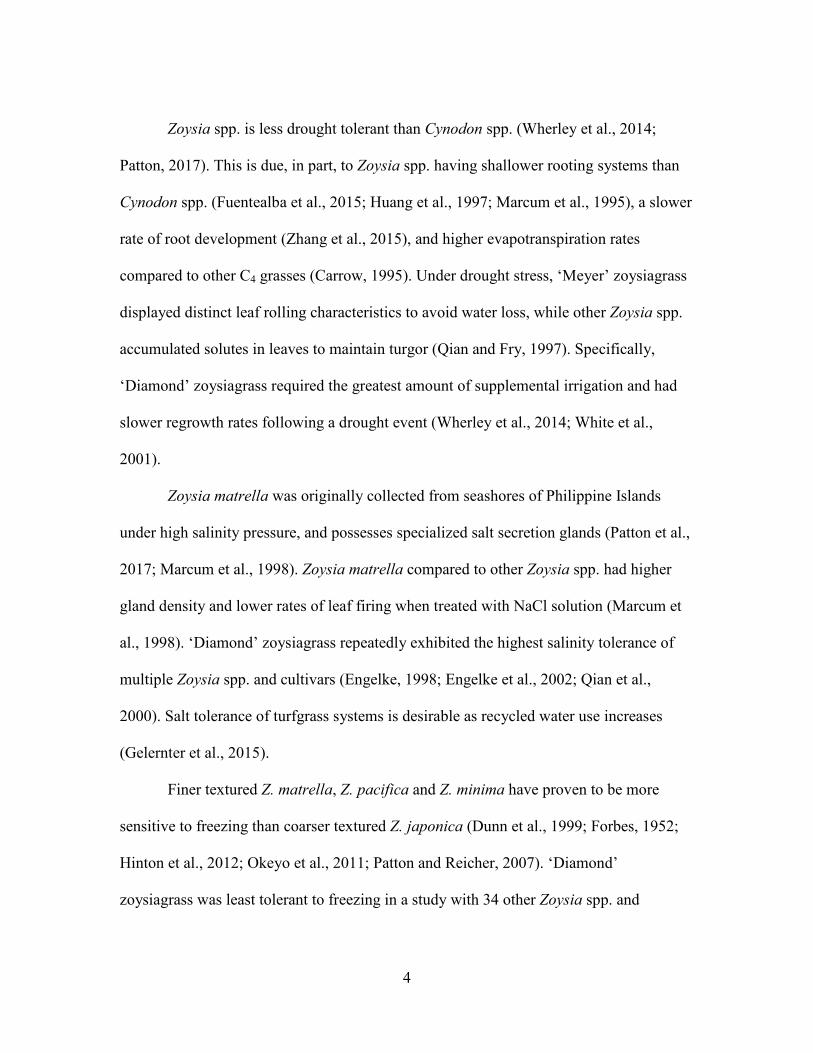
Zoysia spp. is less drought tolerant than Cynodon spp. (Wherley et al., 2014;
Patton, 2017). This is due, in part, to Zoysia spp. having shallower rooting systems than
Cynodon spp. (Fuentealba et al., 2015; Huang et al., 1997; Marcum et al., 1995), a slower
rate of root development (Zhang et al., 2015), and higher evapotranspiration rates
compared to other C4 grasses (Carrow, 1995). Under drought stress, ‘Meyer’ zoysiagrass
displayed distinct leaf rolling characteristics to avoid water loss, while other Zoysia spp.
accumulated solutes in leaves to maintain turgor (Qian and Fry, 1997). Specifically,
‘Diamond’ zoysiagrass required the greatest amount of supplemental irrigation and had
slower regrowth rates following a drought event (Wherley et al., 2014; White et al.,
2001).
Zoysia matrella was originally collected from seashores of Philippine Islands
under high salinity pressure, and possesses specialized salt secretion glands (Patton et al.,
2017; Marcum et al., 1998). Zoysia matrella compared to other Zoysia spp. had higher
gland density and lower rates of leaf firing when treated with NaCl solution (Marcum et
al., 1998). ‘Diamond’ zoysiagrass repeatedly exhibited the highest salinity tolerance of
multiple Zoysia spp. and cultivars (Engelke, 1998; Engelke et al., 2002; Qian et al.,
2000). Salt tolerance of turfgrass systems is desirable as recycled water use increases
(Gelernter et al., 2015).
Finer textured Z. matrella, Z. pacifica and Z. minima have proven to be more
sensitive to freezing than coarser textured Z. japonica (Dunn et al., 1999; Forbes, 1952;
Hinton et al., 2012; Okeyo et al., 2011; Patton and Reicher, 2007). ‘Diamond’
zoysiagrass was least tolerant to freezing in a study with 34 other Zoysia spp. and

5
cultivars (Patton and Reicher, 2007), warranting use of covers for putting greens in the
transition zone (Anderson et al., 2002; Goatley et al., 2005). Experimental hybrids of
finer textured Zoysia spp. with coarser Z. japonica have proven to have desirable freezing
tolerance (Chandra et al., 2017; Fry et al. 2017). Zoysia spp. possess marginally better
freezing tolerance over bermudagrass cultivars (Anderson et al., 2002; Hinton et al.,
2012; Patton and Reicher, 2007). Compared to Cynodon spp., Zoysia spp. were up to 8
times more photosynthetically active at temperatures where only 12% green color tissue
remained (Rogers et al., 1977), a desirable trait to tolerate cooler climates.
Zoysia spp. is often mistaken to possess low traffic tolerance but has a similar
traffic tolerance to Cynodon spp. (Trappe et al., 2011). Finer textured Zoysia spp.
recovery time from divots were slowest (Karcher et al., 2005), consistent with previous
lateral growth rate studies (Fry and Dernoeden, 1987; Sladek et al., 2009). Trappe et al.
(2011) reported ‘Diamond’ zoysiagrass had lower divot severity than most cultivars,
requiring the most lateral force to shear. The dense canopy of ‘Diamond’ zoysiagrass and
high lignin content (Lulli et al., 2011) likely prevent traffic damage.
Zoysia spp. maintains acceptable turfgrass quality with reduced nitrogen fertility
(Schwartz et al., 2018). Dunn et al. (1995) and Soper et al. (1988) noted 98 kg N ha-1 yr-1
to be sufficient for Zoysia spp., but in climates with longer growing seasons, 171 kg N ha-
1 yr-1 was needed to provide acceptable quality (Schwartz et al., 2018). Ball roll distance
and surface firmness of ‘Diamond’ zoysiagrass putting greens were consistently reduced
when nitrogen rates exceeded 73.5 kg N ha-1 yr-1 (Menchyk et al., 2014). Zoysia spp.
responds more positively to urea nitrogen sources vs. nitrate, resulting in increased root
6
and stem mass (Patton et al., 2009). Excessive nitrogen, >195 kg N ha-1 yr-1, leads to
increased thatch accumulation, often resulting in scalping (Schwartz et al., 2018; Soper et
al., 1988), and increased weed pressure (Doroh and McElroy, 2010).
Recently, ‘off-types’ have become an issue in ultradwarf bermudagrass putting
greens (Lowe and Foy, 2012; Reasor, 2017). ‘Off-types’ are believed to be a result of
chance mutation resulting in aneuploidy. However, encroachment, mechanical spread of
species and insufficient control of previous species may also be categorized as ‘off-types’
(McCarty, 2018). Reasor (2017) reported ‘off-type’ species responded differently to
nitrogen fertility and plant growth regulators, making maintenance increasingly difficult.
Zoysia spp. has relatively low threat of ‘off-type’ mutation due to possessing 20
chromosomes (Forbes, 1952; Kimball et al., 2013). Ultradwarf bermudagrass is a triploid
with 27 chromosomes and is much more likely to undergo chance mutation (O’Brien,
2012).
‘Diamond’ zoysiagrass, similar to most Zoysia spp., is susceptible to the fungal
pathogen ‘Large patch’ (Rhizoctonia solani) (Green et al., 1994), typically infecting
plants in fall when soil temperatures are still above 10°C. This disease develops a large
necrotic ring, is exacerbated by low mowing heights, excessive nitrogen, dense thatch
and wet conditions (Green et al., 1994; McCarty, 2018; Obasa et al., 2012). Zoysia spp.
have proven to be susceptible to ‘Rust’ (Puccinia spp.), and severe infestations will cause
turfgrass thinning and necrosis (Obasa and Kennelly, 2010).
‘Diamond’ zoysiagrass compared to other Zoysia spp., is highly resistant to
hunting billbugs (Sphenophorus venatus vestitus Chittenden), a common turfgrass insect
7
pest in southern states (Reinert et al., 2011). Crosses of Z. japonica × Z. matrella were
less susceptible to bluegrass billbug (Sphenophorus parvulus Gyllenhal) than ‘Meyer’
zoysiagrass (Fry and Cloyd, 2011). ‘Diamond’ zoysiagrass is moderately resistant to fall
armyworm (Spodoptera frugiperda), and tawny mole cricket (Neoscapteriscus vicinus)
(Braman et al., 2000). However, ‘Diamond’ zoysiagrass is highly susceptible to
Eriophyes zoysiae (zoysiagrass mite), introduced to the United States in 1982 (Baker et
al., 1986).
Turfgrass Seedhead Production
Turfgrass inflorescences or seedheads are reproductive organs for grasses.
Seedheads are only present when the plant enters a reproductive stage after maturity
(McCarty, 2018; Taiz and Zeigler, 2010). Turfgrass seedheads form elongated stems
from the crown, and a flowering culm forms on top of this stem. An inflorescence is
divided into spikelets, composed of two reduced leaves called glumes enclosing one or
more florets. Florets consist of a lemma, palea and an enclosed flower, and mature florets
are referred to as ‘grass seed’ (McCarty, 2018).
Inflorescence formation occurs in four phases. First is maturation of the plant
because immature plants will not respond to environmental conditions typically
encouraging inflorescence formation. Second is induction of flowering stimulus caused
by either vernalization or photoperiodic induction. Third is a transition of the stem apex
from a vegetative to a flowering axis. Fourth is formation of branches, spikelets and
florets, and inflorescences rising above leaves (Turgeon, 2012).

8
Vernalization is a low temperature required by some plants to initiate flowering.
A range of 0-10°C is required for some C3 grasses to initiate flowering, while higher
night temperatures of 12-18°C will delay their flowering. C4 plants only initiate flowering
when night temperatures are above 12-16°C (Turgeon, 2012; McCarty, 2018).
Photoperiod or day length is a primary factor for some plants to initiate flowering.
Plants depend on phytochrome, a protein kinase within leaves, to signal photoperiod. Red
light converts an inactive form of phytochrome to an active form, and far-red light
converts an active form back to an inactive form. Phytochrome drives responses
including ‘florigen’ protein formation in leaves, which transports to apical meristems to
induce flowering (Taiz and Zeiger, 2010).
C3 turfgrasses are typically long-day plants (LDP), which tend to flower in late
spring to summer when nights become shorter than a critical duration of darkness. C4
turfgrasses are typically short-day plants (SDP), which tend to flower in late summer to
fall when nights exceed a critical duration of darkness. Day-neutral plants do not require
specific day lengths and will flower as soon as they are mature. Annual bluegrass (Poa
annua L.) and Cynodon spp. are believed to be day-neutral (Johnson and White, 1997;
McCarty, 2018).
Orientation of spikelets and rachillas differ among turfgrasses. Spikelets may lack
individual stalks and attach directly to the main axis in spike inflorescences (McCarty,
2018). Wheat (Tritichum spp.) and barley (Hordeum spp.) form spike inflorescences.
Spikelets with individual unbranched stalks from the main axis are raceme
inflorescences. St. Augustinegrass (Stenotaphrum secundatum (Walt.) Kuntza),

9
zoysiagrass, bahiagrass (Paspalum notatum Flugge) and centipedegrass (Eremochloa
ophiuroides (Munro) Hack) form a raceme inflorescence. Spikelets may branch from
individual stalks attached to the main axis to create panicle inflorescences. Bluegrasses
(Poa spp.), creeping bentgrass (Agrostis stoloniferia L.) and tall fescue (Lolium
arundinacea (Schreb.) Darbysh.) form panicle inflorescences (McCarty, 2018).
Stamens, male portions of flowers, typically are formed of pollen bearing anthers
and supporting filaments. Female portions are termed pistil, typically formed of a single
ovary and two stigmas and styles. Transfer of pollen from anthers to stigmas is termed
‘pollination’. Most grasses self-pollinate, but cross-pollination allows transfer of genetic
material (Kimball et al., 2013). Once pollen contacts stigmas, a pollen tube grows
through styles and into ovules within ovaries, and two sperm nuclei are released. A one
sperm nucleus conjoins with an egg to create a zygote, and the other conjoins with two
polar nuclei to form an endosperm cell, termed ‘double fertilization’. Zygotes form
embryos, and endosperm cells develop into endosperms becoming food sources for
embryos during germination. Kentucky bluegrass is able to perform apomixis, an asexual
reproduction process where male and female gametes do not fuse. These seeds will have
an identical genetic makeup to female parents, and true-to-type seed can be produced
(Turgeon, 2012).
Zoysia matrella produces seedheads, similar to other Zoysia spp. (Forbes, 1952;
McCarty, 2018; Patton et al., 2018; Youngner, 1961). Zoysia spp. form aesthetically
unpleasing seedheads in both spring and fall (McCullough et al., 2017), while ‘Meyer’
typically only forms seedheads in spring (Daniels and Nicoludis, 2019; Patton et al.,

10
2018).
Two separate greenhouse experiments indicated a minimum of 27°C resulted in
maximum seedhead production in Zoysia spp., including Z. matrella (Forbes, 1952;
Youngner, 1961). These experiments also indicated photoperiods between 8 and 10 h
triggered seedhead production, while 12 h photoperiods yielded no seedhead formation.
Nakamae and Nakamura (1984) reported reductions in light and nitrogen lead to
increased seedhead production. Yeam et al. (1984) determined a minimum of twelve
nodes in the upright culm was required before Z. matrella would flower.
McCullough et al. (2017) recorded ‘Diamond’ zoysiagrass’ initial seedhead
production in field using photoperiod and accumulated growing degree days (GDD) (base
10°C) for the calendar year to determine emergence factors. Initial seedhead production
ranged from 167 to 196 GDD and 1949 to 2230 GDD in spring and fall, respectively.
Photoperiod ranged from 12.7 to 12.9 h in both spring and fall (McCullough et al., 2017).
Over two years, GDD was determined to be a more accurate predictor of initial seedhead
formation in spring, but photoperiod was a more accurate predictor in fall (McCullough
et al., 2017). Similar GDD methods have been applied to annual bluegrass to predict
seedhead formation (Calhoun, 2010). Timing is crucial for cost effectiveness, planning
and duration, as applied products must be absorbed by turfgrass before seedhead
inhibition to be effective (McCarty, 2018).
‘Diamond’ zoysiagrass’ ball roll distance is typically less than ultradwarf
bermudagrass greens (Donald Garrett, personal communication, 2018; Menchyk et al.,
2014), likely due to resistance from upright growth and high lignin content in Z. matrella
11
leaf tissue (Lulli et al., 2011). Ball roll distance and smoothness of putting greens are also
reduced by presence of annual bluegrass seedheads (Gelernter and Stowell, 2001; Kane
and Miller, 2003).
Seedhead production consumes carbohydrates produced by turfgrass through
photosynthesis. Loss of finite carbohydrates and energy molecules is detrimental to other
plant processes (Taiz and Zeigler, 2010). Preventing seedhead formation with PGRs
would conserve photosynthetic resources for plant growth and storage. Storage of
carbohydrates in stolons and rhizomes is considered the primary factor in winter survival
of C4 turfgrasses (Dunn and Nelson, 1974; Qian and Engelke, 2000; Rogers et al., 1977).
Seedhead presence may also accelerate decline of mower reel and bedknife sharpness
(Donald Garrett, personal communication, 2018), increasing shearing of leaves, and
reducing turfgrass quality.
Ethylene
Ethylene was discovered in the late 19th century when coal streetlamps under tree
branches resulted in decreased stem elongation, twisting of plants and thickening of
stems, termed ‘triple-response’. In 1901, Russian scientist Dimitry Neljubow proved the
active component of streetlamp gas was ethylene. In 1910, H. H. Cousins discovered
ethylene was synthesized in plants, and stimulated fruit ripening. R. Gane and others in
1934 identified ethylene as a natural product of plant metabolism, leading to its
classification as a hormone. Ethylene inhibits growth of plant tissues, theoretically
counteracting abscisic acid and gibberellic acid (Taiz and Zeigler, 2010). Ethylene is also

12
inhibits lateral bud development, root growth, and cell elongation; It slows cell
differentiation, promotes leaf abscission, influences some plant defense responses, and is
responsible for flower induction in some plants (Davies, 2010).
Ethylene is synthesized in all higher plants from methionine in most tissues,
especially during times of stress. Adenosine triphosphate and methionine result in S-
adenosyl methionine (SAM) and a loss of three phosphates. SAM then produces 1-
aminocyclopropane-1-carboxylic acid (ACC) via the ACC-synthase enzyme. ACC
combined with oxygen and the ACC-oxidase enzyme produces ethylene (Taiz and
Zeiger, 2010). Some PGRs such as ethephon (EP) stimulate ethylene production in plant
to slow growth or reduce seedhead production (McCarty, 2018).
Gibberellic Acid
Gibberellic acids (GAs) were first discovered by Japanese scientists in rice plants
in the 1930s via the pathogenic fungus, Gibberella fujikuroi. This disease caused rice
plants to grow excessively tall leading to lodging and reduced seed production. By
culturing the fungi, scientists were able to obtain impure crystals, a mix of three
gibberellins, with plant growth-promoting activity. In the 1950s, scientists separated and
characterized three different gibberellins, naming them gibberellin A1, gibberellin A2,
and gibberellin A3. Gibberellin A3 was determined to be the general component in plants
and could be commercially produced for applications (Taiz and Zeigler, 2010).
GAs primarily incite cell division and elongation in plants. GAs are also
responsible for induction of seed germination, production of enzymes during seed
13
germination, and induces fruit setting and growth (Davies, 2010). GAs also help break
dormancy, promote early flower development, inducing flowering under non-typical
flowering conditions and combine with other factors in plants to express floral regulating
genes (Taiz and Zeiger, 2010). In darnel ryegrass (Lolium temulentum L.), GAs
concentration increased under specific light conditions to promote flowering (King et al.,
2006). A practical use of GA in turfgrass putting greens is to apply small amounts to
heat-stressed creeping bentgrass to encourage growth, or to bermudagrass putting greens
that have experienced a light fall frost to maintain desirable color for a short time
(McCarty, 2018).
GAs are formed from carbohydrates created from photosynthesis following
glycolysis. The process can be broken down into three stages. Stage one takes place in
plastids, and glycolysis produces phosphoenol pyruvic acid and acetyl-CoA. Mevalonic
acid is formed from acetyl-CoA and is the starting compound for all terpenoid
biosynthesis. Mevalonic acid, a 6-carbon compound, is decarboxylated to form the first
isoprenoid, a 5-carbon compound, in the pathway. Four isoprene units combine to form
geranylgeranyl diphosphate, a 20-carbon linear molecule, and is converted into ent-
karurene, a 6-carbon ring structure (Taiz and Zeiger, 2010).
Stage two takes place in plastid envelopes and endoplasmic reticulums. One of
ent-kaurene’s methyl groups is oxidized to carboxylic acid, then one of the 6-carbon rings
contracts to become a 5-carbon ring, producing GA12-aldehyde. This is the first
gibberellic acid formed, and the biosynthesis pathway up to GA12 is typical of plant
species studied thus far (Taiz and Zeiger, 2010).

14
Stage three takes place in cytosols, where GA12-aldehyde is converted into
biologically active 19-carbon GAs: GA4 or GA1. Three important enzymes in this stage
are grouped and labeled dioxygenases and utilize 2-oxoglutarate as a co-substrate and
Fe+2 as a co-factor (Taiz and Zeiger, 2010).
Multiple plant growth regulators (PGRs) target gibberellic acid biosynthesis to
slow plant growth. These chemistries differ in their site and therefore timing of inhibition
in the pathway. Plant uptake mechanisms, duration in plant tissues and soil half-lives of
these growth regulators also vary (Rademacher, 2000).
Turfgrass Plant Growth Regulators (PGRs)
PGRs are defined as any compound, synthetic or natural, that alters plant growth
or development; including hormones, herbicides, growth inhibitors and biostimulants
(Kreuser, 2015). PGRs are commonly used by turfgrass managers to slow undesirable
vertical growth of turfgrass to reduce mowing frequency and clipping volume (Fagerness
and Yelverton, 2000; Johnson, 1990). PGRs are used to improve turfgrass health
(Atkinson et al., 2012), density (Fagerness et al., 2002), rooting (McCullough et al. 2006;
McCarty et al., 2011), color (Fagerness and Yelverton, 2000), reduce nitrogen
requirements (Kreuser and Soldat, 2012), and suppress seedheads (Askew, 2017; Brosnan
et al., 2012; Haguewood et al., 2013; Johnson and Murphy, 1995; Johnson and Murphy,
1996; Kane and Miller, 2003; McCullough et al., 2011; Patton et al., 2018; Woosley et
al., 2003).
Class A and B PGRs are gibberellin biosynthesis inhibitors (Kreuser et al., 2015).

15
Class A inhibitors include trinexapac-ethyl (TE) and prohexadione-calcium (PC) and
inhibit gibberellin synthesis later in the biosynthesis pathway. These chemistries are
acylcyclohexanediones and structurally similar to aforementioned 2-oxoglutaric acid,
allowing these PGRs to block GA metabolism. The primary target is 3beta, needed for
the conversion of inactive GA20 to highly plant active GA1 (Evans et al., 1999;
Rademacher, 2000). This inhibition of GA1 formation results in an accumulation of
GA20, causing rapid growth suppression (Kreuser and Soldat, 2011; Rademacher, 2000;
Reasor et al., 2018).
TE and PC are absorbed primarily through leaf tissue and crowns of turfgrass
plants, with 80% absorption occurring within one hour, and compounds are readily
transported throughout plants (Fagerness and Penner, 1998b; Rademacher, 2000). TE and
PC half-lives are several hours in soil, and multiple weeks in plants, depending on air
temperature and growth habits (Beasley et al., 2005; Evans et al., 1999; Kreuser and
Soldat, 2011; Rademacher, 2000; Reasor et al., 2018).
Class B inhibitors such as paclobutrazol (PB) and flurprimidol (FL) inhibit
gibberellin biosynthesis earlier in the formation steps than class A inhibitors. FL is a
pyrimidine compound and PB is a triazole-type compound. Both chemistries block
cytochrome P450-dependent monooxygenases. This inhibits oxidation of ent-kaurene to
ent-kaurenoic acid, and therefore reduces formation of biologically active GAs
(Rademacher, 2000).
FL and PB are not readily absorbed by leaf tissue or turfgrass crowns, but instead
are translocated acropetally from root absorption. Irrigation or rainfall after treatment is

16
required for these chemistries to reach roots for uptake (Anonymous, 2013; Anonymous,
2018b). Class B PGRs have half-lives of multiple months in soil, and are slow to initially
regulate but have longer periods of regulation than class A PGRs (Diesburg and
Christians, 1989; Kreuser, 2018; Kreuser and Soldat, 2011; Rademacher, 2000; Reasor et
al., 2018). Class B inhibitors may have seedhead suppression capabilities, primarily on
annual bluegrass (Bigelow et al., 2007; Fagerness and Penner, 1998a; Johnson and
Murphy, 1995; Johnson and Murphy, 1996; Woosley et al., 2003).
Class C PGRs are cell division inhibitors, and include mefluidide, maleic
hydrazide and amidochlor (Kreuser, 2015). Class C PGRs are more phytotoxic and their
duration of growth suppression is shorter than class A and B PGRs, requiring more
frequent applications (Diesburg and Christians, 1989; Haguewood et al., 2013).
Class D PGRs are herbicides used at less than lethal rates. Examples of class D
compounds used for turfgrass growth suppression and seedhead control are glyphosate
and imazapic (Kreuser, 2015; McCarty, 2018). Specific concentrations of must be used to
effectively control growth without causing severe phytotoxicity or plant death.
Class E PGRs are phytohormones with no effect on gibberellin biosynthesis, and
includes ethephon (EP) (Kreuser, 2015). EP is foliar absorbed, and which is quickly
converted to ethylene. Ethylene is a natural signal of injury or stress and interferes with
growth processes (McCarty, 2018; McCullough and Sidhu, 2014; Taiz and Zeigler,
2010).
Lastly, Class F PGRs are natural growth regulators. Compounds in this category
include natural plant hormones and commercial biostimulant products utilizing their
17
qualities, such as seaweed extract providing cytokinins (Kreuser, 2015; Zhang and Ervin,
2004).
Various PGRs’ effects on ‘Diamond’ zoysiagrass’ phytotoxicity or seedhead
suppression has not been fully investigated (McCullough et al., 2017; Menchyk et al.,
2014). TE has been a primary focus of PGR studies on ‘Diamond’ zoysiagrass (Atkinson
et al., 2012; Qian and Engelke, 1999) but few studies have analyzed seedhead
suppression (Patton et al., 2018). PB and EP have all proven to reduce annual bluegrass
seedhead production and growth, mostly in creeping bentgrass (Askew, 2017;
Haguewood et al., 2013; Johnson and Murphy, 1995; Johnson and Murphy 1996; Kane
and Miller, 2003; Patton et al., 2018; Woosley et al., 2003) but none of these PGRs’
effects on ‘Diamond’ zoysiagrass’ seedhead production have been reported. Simazine
(SI) has been observed to reduce seedhead production in ‘Diamond’ zoysiagrass when
applied as a pre-emergent herbicide (Donald Garrett, personal communication, 2018).
Imazapic and imazamox suppressed ‘Meyer’ zoysiagrass and ‘Zenith’ zoysiagrass
seedhead formation >90% but phytotoxicity is common (Brosnan et al., 2012).
McCullough et al. (2014) reported flucarbazone-sodium reduced seashore paspalum
seedheads >80%. Older chemistries such as maleic hydrazide, mefluidide and amidochlor
were not included in this study due to modern putting green standards, chemistries being
taken off the market, and shorter durations of these chemistries in plants (Diesburg and
Christians. 1989; Gaussoin et al., 1997).
18
Trinexapac-ethyl (TE)
Trinexapac-ethyl is a class A gibberellin biosynthesis inhibiting PGR, and is
currently considered turfgrass industry’s standard PGR (Kreuser, 2015). Primo Maxx
(Syngenta, Greensboro, NC) is produced in liquid form containing 11.3% TE
(Anonymous, 2015).
Fagerness and Penner (1998b) reported TE was 94% leaf sheath absorbed, 70%
leaf blade absorbed, and 5% root absorbed by Kentucky bluegrass (Poa pratensis L.)
within 24 h, with foliar absorption mostly taking place within 1 h. This study also found
roots translocated only 50% of absorbed chemistry, while sheaths readily translocated TE
acropetally to foliar tissue, and leaf blades retained or translocated TE to other foliar
tissue (Fagerness and Penner, 1998b).
TE is commonly utilized to inhibit vertical shoot growth, shorten internode
lengths and increase ball roll distances on putting surfaces (McCullough et al., 2006;
McCullough et al., 2007; McCarty et al., 2011). However, Menchyk et al. (2014) found
TE applied to ‘Diamond’ zoysiagrass did not significantly increase ball roll distance
across various nitrogen regiments, possibly due to insufficient rates. TE reduced ‘Tifway’
bermudagrass (Cynodon dactylon (L.) Pers. × C. transvaalensis Burtt-Davy) vertical
shoot growth while promoting lateral growth (Fagerness et al., 2002). TE positively
affects turfgrass rooting (Beasley et al., 2005; McCarty et al., 2011), total nonstructural
carbohydrate levels (Qian et al., 1998), and cell density in turfgrass leaves, possibly
leading to increased traffic tolerance (Heckman et al. 2005).
TE reduced tissue production but a ‘rebound effect’ of growth may occur after TE

19
had been fully metabolized in ‘Tifway’ bermudagrass (Fagerness and Yelverton, 2000)
and in creeping bentgrass (Kreuser and Soldat, 2011). Trinexapac-acid, the plant-active
form of TE, was significantly reduced in Kentucky bluegrass and creeping bentgrass by
increased air temperatures (Beasley et al. 2005). Studies have developed GDD models for
TE on creeping bentgrass putting greens (Kreuser and Soldat, 2011) and on ultradwarf
bermudagrass putting greens (Reasor et al., 2018) to achieve efficient season long growth
suppression and prevent a ‘rebound effect’.
TE applications to ‘Diamond’ zoysiagrass reduce elongation and prevent scalping
in shade environments significantly improved turfgrass quality (Atkinson et al., 2012;
Qian et al., 1998). This interaction is vital as ‘Diamond’ zoysiagrass is commonly utilized
in high shade conditions where ultradwarf bermudagrass greens are not viable (Bunnel et
al., 2005). Ervin et al. (2002) reported ‘Meyer’ density was also increased by using TE in
shade conditions. TE is also commonly paired with other PGRs to mitigate undesirable
phytotoxicity (Bigelow et al., 2007; Haguewood et al., 2013; Kane and Miller, 2003). TE
is ineffective for controlling annual bluegrass seedhead production (Fagerness et al.
1998a), and Qian (1998) observed TE visually increased ‘Diamond’ zoysiagrass’
seedhead production.
Prohexadione calcium (PC)
Prohexadione calcium is a class A gibberellin biosynthesis inhibiting PGR, most
similar to TE. Anuew (Nufarm Americas, Alsip, IL) is produced in an extruded granule
formula with 27.5% PC (Anonymous, 2018a).

20
Prohexadione calcium is quickly absorbed through leaves and crown and is then
readily translocated throughout the plant (Evans et al., 1999). PC was reported to
suppress creeping bentgrass growth for nearly identical GDD as TE at multiple
application rates (Kreuser, 2015; Kreuser and Soldat, 2011). Beam (2004) reported shoot
growth reduction from PC was comparable to TE in bermudagrass, Kentucky bluegrass,
perennial ryegrass (Lolium perenne L.) and zoysiagrass at varying rates. Beam (2004)
also reported repeat PC treatments reduced annual bluegrass greater than 50% and was
equivalent to PB at 3, 6, 8 and 17 wk after treatment. In ultradwarf bermudagrass putting
greens, Reasor et al. (2018) reported PC’s peak suppression was 95 GDD while TE’s
peak was 172 GDD, a more rapid plant response to PC. However, duration of growth
suppression was 216-230 GDD for TE and 120-126 GDD for PC, revealing reduced
longevity (Reasor et al., 2018). Minor differences are likely due to PC’s active acid form
being present once calcium is dissolved in water and is primarily acropetally translocated.
Conversely, ester TE is translocated systemically to roots before being metabolized to its
active acid form and then translocating acropetally (Beam and Askew, 2007).
Flurprimidol (FL)
Flurprimidol is a class B gibberellic acid biosynthesis inhibitor. Cutless (SePRO,
Carmel, IN) contains 16% FL and is produced as a micro-emulsion concentrate liquid
(Anonymous, 2018b). FL is primarily crown and root absorbed and is translocated
acropetally to foliage, requiring irrigation or rainfall to be effective (Anonymous, 2018b).
Multiple studies found FL provides an increase in turfgrass color and density,

21
while reducing vegetative growth in bermudagrass for up to 8 wk (Johnson, 1992;
Johnson, 1994; Totten et al., 2006). Lowe and Whitwell (1999) reported FL reduced the
height of bermudagrass and bahiagrass by 33% and 25%, respectively. Increasing FL
rates on creeping bentgrass and annual bluegrass increased chlorophyll content (Gaussoin
et al., 1997). FL also reduced annual bluegrass in creeping bentgrass fairways (Bigelow
et al., 2007) and putting greens (Johnson and Murphy, 1995; Johnson and Murphy, 1996).
FL applied to Kentucky bluegrass reduced growth by 16% on average and peak growth
suppression was observed 10 wk after treatment, an increased longevity over class A
PGRs (Diesburg and Christians, 1989; Kreuser and Soldat, 2011).
McCullough et al. (2005a) reported FL had 43% root mass reduction in
‘Champion’ bermudagrass putting greens and McCarty et al. (2011) reported a 25%
reduction of root length density in ‘Tifeagle’ bermudagrass. Bunnell (2003) reported FL
decreased perennial ryegrass and Kentucky bluegrass seed production
Paclobutrazol (PB)
Paclobutrazol is a class B gibberellin biosynthesis inhibitor. Trimmit (Syngenta,
Greensboro, NC) is produced in a suspension concentrate formulation with 22.9% PB
(Anonymous, 2013). PB is primarily crown and root absorbed, requiring irrigation or
rainfall to be available to plants (Anonymous, 2013).
Paclobutrazol reduced bermudagrass growth up to 5 wk after a single application
(Johnson, 1990). PB reduced bermudagrass height by 30%, but only reduced bahiagrass
height by 5% (Lowe and Whitwell, 1999). Suppression from PB outlasted TE in

22
Kentucky bluegrass (Beasley and Branham, 2007; Diesburg and Christians, 1989). Peak
suppression for Kentucky bluegrass treated with PB was 5 wk after treatment (Diesburg
and Christians, 1989). A GDD (base of 0°C) model for PB on creeping bentgrass putting
greens found increasing rates impacted growth suppression levels, but duration was only
marginally extended (Kreuser et al., 2018). Kreuser et al. (2018) also reported the highest
labeled rate of PB to be much more effective in reducing clipping yield than the highest
labeled high rate of TE. Combinations of each chemistry at half rates did not hasten
suppression or minimize ‘rebound effect’ but provided the greatest clipping yield
reductions. PB did not reduce root biomass of creeping bentgrass (Fagerness and
Yelverton, 2001) or ‘Tifeagle’ bermudagrass putting greens (McCullough et al., 2005a),
but severely reduced root length in Kentucky bluegrass (Beasley and Branham, 2007).
Flowering and growth of annual bluegrass is reduced following applications of
PB, and is a common method to slowly reduce annual bluegrass populations in creeping
bentgrass putting greens (Johnson and Murphy, 1995; Johnson and Murphy, 1996;
Woosley et al., 2003). King et al., (2006) reported PB prevented flowering in darnel
ryegrass.
Ethephon (EP)
Ethephon is a class E phytohormone PGR. Proxy (Bayer, Research Triangle Park,
NC) is produced as a liquid and contains 21.7% EP (Anonymous, 2018c). EP is foliar
absorbed by plants and combines with water to produce ethylene gas. Ethylene gas
inhibits growth by reducing hypocotyl elongation, and selectively aborts flowering

23
(McCullough and Sidhu, 2014; Serek and Reid, 2000).
McCullough (2017) reported ‘Diamond’ zoysiagrass possessed a higher tolerance
to EP than both bermudagrass and seashore paspalum. EP applied to bermudagrass
reduced plant height, increased rooting under drought stress, and increased tillering, but
caused necrosis and chlorotic striping (Shatters et al., 1998). Ervin and Ok (2001)
reported ‘Meyer’ zoysiagrass treated with EP and TE had similar growth suppression
responses. However, studies have also documented EP is not as effective in reducing
shoot growth as class A and B PGRs and may widen leaf blades (Diesburg and
Christians, 1989; McCullough et al., 2006; McCullough et al., 2005c).
Ethephon applications reduced root length density of perennial ryegrass (Jiang
and Fry, 1998), dry root mass in creeping bentgrass (McCullough et al., 2006), and root
length and mass of ‘Tifeagle’ bermudagrass putting greens (McCullough et al. 2005c).
These results raise concerns of EP use on putting greens, especially during or leading up
to periods of plant stress.
Fall applications of EP to ‘Meyer’ zoysiagrass suppressed seedhead formation the
following spring, suggesting residual effects (Patton et al., 2018). A similar interaction
was reported by Askew (2017) in creeping bentgrass where winter applied EP increased
annual bluegrass control in spring. EP reduces seedheads and growth of annual bluegrass,
encouraging creeping bentgrass to spread into void areas (Gelernter and Stowell, 2001;
Haguewood et al., 2013; Kane and Miller; 2003; McCullough and Sidhu, 2014).
Turfgrass managers combine EP with class A PGRs to reduce phytotoxicity while

24
retaining seedhead inhibition traits (Haguewood et al., 2013).
Simazine (SI)
Simazine is a photosystem II inhibiting herbicide, classified as a class D PGR.
Princep 4L (Syngenta, Greensboro, NC) is formulated as a liquid and contains 41.9% SI
(Anonymous, 2014). SI is primarily root absorbed by plants, requiring irrigation or
rainfall to become available to plants (Cobb and Reade, 2011).
SI is commonly used for pre-emergence, early post-emergence and establishment
weed control in C4 turfgrass systems (McElroy and Martins, 2013). SI inhibits electron
flow along photosystem II (PSII), specifically the ‘Hill reaction’ (Cobb and Reade,
2011). This results in active oxygen species causing membrane protein damage and slow
plant death. Weeds must be exposed to sunlight for simazine’s active form to become
effective (Cobb and Reade, 2011). It is common for metabolism resistance of SI to occur
through higher concentrations of cytochrome P450 monooxygenase family of enzymes
(Cobb and Reade, 2011) and a single gene mutation of a protein in PSII complexes can
create target site resistance to PSII inhibitors (Kelly et al., 1999).
Fry et al. (1986) reported SI had varying effects on Zoysia spp. plug roots during
establishment but SI increased stolon production. SI has proven effective for controlling
many problematic turfgrass weeds (Fry et al., 1986; McElroy and Martins, 2013), but
annual bluegrass has developed resistance (Hutto et al., 2004). SI applied to Poaceae
species increased yields, protein content, and nitrate reductase activity (Ries and Wert,
1972; Ries et al., 1970; Tweedy and Ries, 1967).

25
CHAPTER TWO
‘DIAMOND’ ZOYSIAGRASS (Zoysia matrella (L.) Merr.) PUTTING GREEN SEEDHEAD CONTROL AND RESPONSE TO PLANT GROWTH REGULATORS
Introduction
‘Diamond’ zoysiagrass (Zoysia matrella (L.) Merr.) has become an increasingly
popular choice for putting greens. Its C4 physiology is able to withstand drought and heat
stress more efficiently than C3 species used for putting greens. ‘Diamond’ zoysiagrass
when compared to other C4 species used for putting greens has superb shade tolerance
(Atkinson et al., 2012; Qian et al., 1998). However, ‘Diamond’ zoysiagrass typically
produces seedheads in spring and fall on putting greens and create undesirable aesthetics,
affect ball roll smoothness and possibly distance. Cultural practices to remove seedheads
such as grooming, brushing and increased mowing frequency are not completely effective
(Personal communication Donald Garrett, 2018). Plant growth regulators applied to
annual bluegrass have reduced seedhead production while maintaining high turfgrass
quality.
Materials and Methods
A field experiment was conducted from April 2018 to November 2019 on a
‘Diamond’ zoysiagrass practice green at the Walker Golf Course at Clemson University.
A first objective of this study was to evaluate methods for predicting initial seedhead
emergence. Second and third objectives were to determine if turf quality (TQ) and
normalized difference of vegetative index (NDVI) decreased in response to various PGRs
previously undocumented at putting green heights. Fourth and fifth objectives were to

26
determine if PGRs decreased seedhead percent coverage and seedhead count. A sixth
objective was to determine if PGR applications reduced root mass.
This ‘Diamond’ zoysiagrass green was established in June 2013 from sod over a
converted creeping bentgrass green with USGA soil mix originally constructed in 1995
(Donald Garrett, personal communication). Sunrise-sunset times and temperature data
were collected and used to calculate photoperiod and accumulated growing degree days
(GDD) during the study (NOAA; Sunrise Sunset). Plots were not re-randomized from
year 1 to 2, as research reported fall applications to influence spring seedhead production
(Patton et al., 2018). Treatments were applied once in each spring and fall using a
pressurized CO2 backpack boom sprayer with a carrier volume 189.5 L/ha through 8003
flat fan nozzles (Tee jet, Spraying Systems Co., Roswell, GA). Overhead irrigation
equivalent to 1.25 cm was applied 4 h after treatment to incorporate root absorbed PGRs.
Rates for treatments were derived from Zoysia spp. with higher mowing heights,
ultradwarf bermudagrass and observational research (L.B. McCarty, personal
communication, 2018; Donald Garrett, personal communication, 2018). Treatments
(Table 1) included trinexapac-ethyl (TE), paclobutrazol (PB), ethephon (EP), simazine
(SI), flurprimidol (FL) and prohexadione-calcium (PC). Separate treatments of each PGR
+ TE were included to observe phytotoxicity effects. All treatments also included a non-
ionic surfactant (NIS) (Harrell’s SprayMAX, Lakeland, FL) at a 0.25% volume volume-1
rate.

27
Table 1. Treatments and rates for ‘Diamond’ zoysiagrass putting green seedhead control and response to plant growth regulators study. Treatmenta Standard Rate (lb a.i. acre-1) Metric Rate (g a.i. ha-1) Untreated – – TE (Primo Maxx 1L) 0.0366 41 PB (Trimmit 2SC) 0.0598 67 PB + TE 0.0598 + 0.0366 67 + 41 EP (Proxy 2L) 3.0816 3,454 EP + TE 3.0816 + 0.0366 3,454 + 41 SI (Princep 4L) 0.8922 1,000 SI + TE 0.8922 + 0.0366 1,000 + 41 PC (Anuew 27.5WP) 0.1035 116 PC + TE 0.1035 + 0.0366 116 + 41 FL (Cutless MEC 1L) 0.0834 93.5 FL + TE 0.0834 + 0.0366 93.5 + 41
a All treatments also included a NIS at a 0.25% volume volume-1 rate. Plots were mowed daily by Walker Golf Course staff from 2.54 to 3.175 mm.
Solid tine aerification, vertical mower grooming, and topdressing were all performed
uniformly throughout this study. Core aeration was performed using 1.27 cm tines with
2.54 x 2.54 cm spacing on 25 June 2018 and 21 June 2019. Fertilization was applied via
foliar application equivalent to 9.8 g N m-2 month-1 during rating dates. Fungicide
applications were applied uniformly across plots, but no plant growth regulating products
were applied during rating dates.
Statistical Design
Statistical design was randomized complete block with four replications and
repeated observations at different rating dates. Data were then subjected to an overall
ANOVA (Tables 2, 3 and 4) to determine treatment effects across all rating dates and any
treatment by rating date interactions. Since treatment by rating date interactions were
significant, rating data were subjected to ANOVA at each individual rating date to assess
28
treatment effects. Means were separated using Fisher’s protected LSD at a significance
level of 0.05. Due to the variability of soil data, root mass means were deemed significant
below 0.1, increasing chance for type I errors. Treatment and timing effects were also
studied with contrasts to more confidently determine treatment effects by reducing total
chances for type I error. Data were analyzed using JMP Pro 14.1 software (SAS Institute
Inc.; Cary, NC, USA).
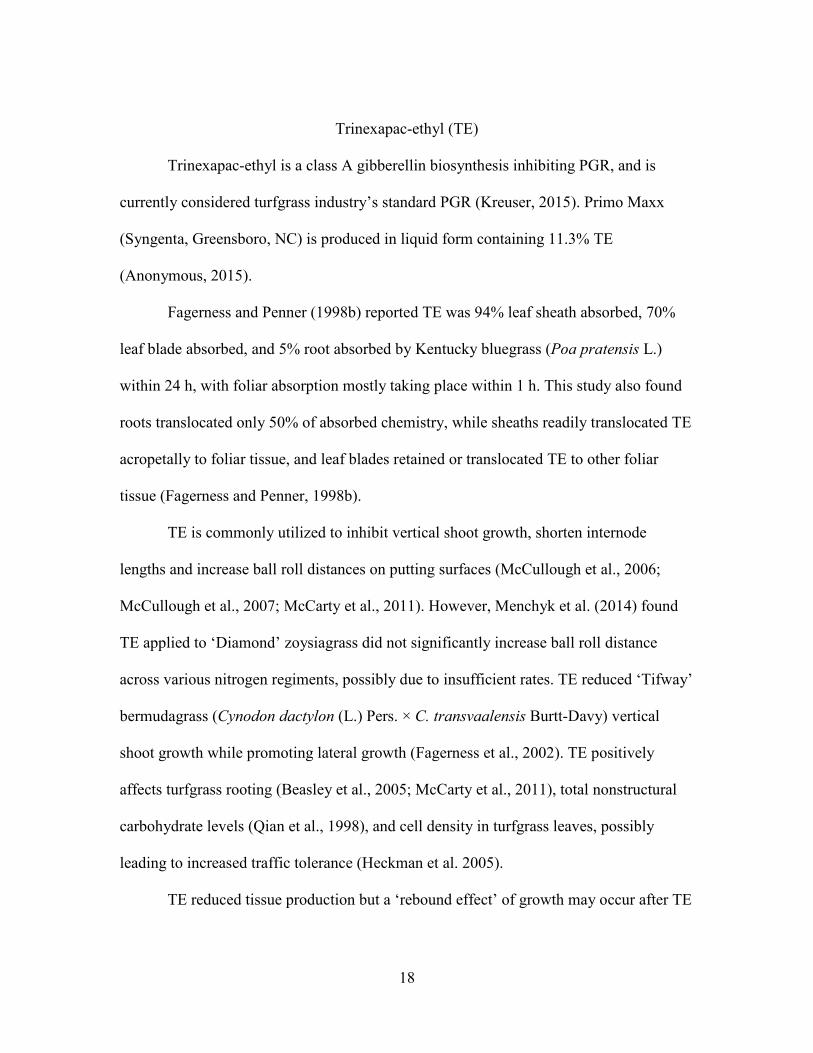
Table 2. Analysis of variance (ANOVA) table of a randomized complete block design for turf quality (TQ) and normalized difference of vegetative index (NDVI) in ‘Diamond’ zoysiagrass putting green seedhead control and response to plant growth regulators study. Source of Variation dfa TQ NDVI Treatment 11 *** NS Block Error 3 NS NS Treatment x Block Error 33 NS * Season 3 *** *** Rating Date (Season) 16 *** *** Treatment x Season 33 *** *** Treatment x Rating Date (Season) 176 *** * Error 685 Corrected Total 959
a Degrees of freedom * Significant at the 0.05 probability level. *** Significant at the 0.001 probability level. ‡ NS, nonsignificant at 0.05 probability level.
29
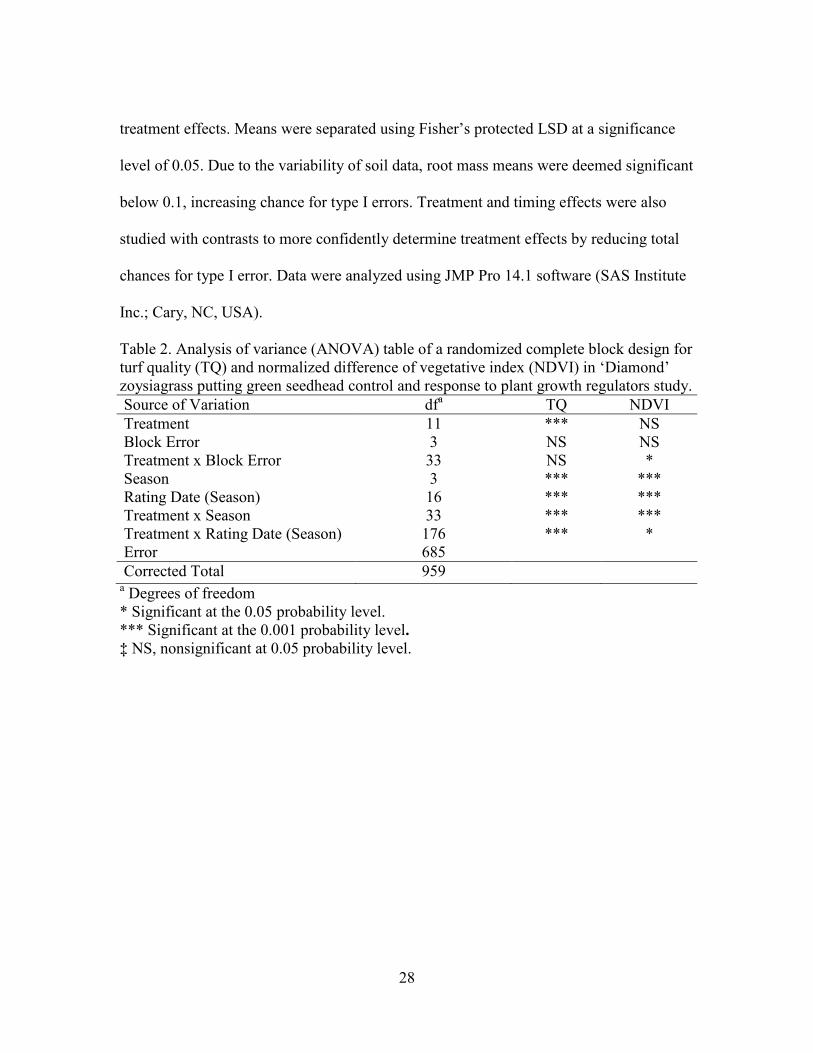
Table 3. Analysis of variance (ANOVA) table of a randomized complete block design for seedhead coverage and seedhead count in ‘Diamond’ zoysiagrass putting green seedhead control and response to plant growth regulators study. Source of Variation dfa Seedhead Coverage Seedhead Count Treatment 11 *** *** Block Error 3 NS NS Treatment x Block Error 33 NS NS Season 3 *** *** Rating Date (Season) 12 *** *** Treatment x Season 33 *** *** Treatment x Rating Date (Season) 132 *** *** Error 540 Corrected Total 767
a Degrees of freedom *** Significant at the 0.001 probability level. ‡ NS, nonsignificant at 0.05 probability level. Table 4. Analysis of variance (ANOVA) table of a randomized complete block design for root mass count in ‘Diamond’ zoysiagrass putting green seedhead control and response to plant growth regulators study. Source of Variation dfa Root Mass Treatment 11 NS Block Error 3 NS Treatment x Block Error 33 NS Season 3 *** Treatment x Season 33 NS Error 108 Corrected Total 191
a Degrees of freedom *** Significant at the 0.001 probability level. ‡ NS, nonsignificant at 0.1 probability level.
Measurements
Initial seedhead production was scouted in untreated control plots and recorded
each season. These dates were related to the photoperiod for that day, defined as hours
between initial sunrise and full sunset in Clemson, SC (SS, 2019). Dates were also
compared to the accumulated growing degree days (GDD) (base 10°C) calculated using
the equation,

30
DD = (𝑀𝑀𝑀𝑀𝑀𝑀 𝑇𝑇𝑇𝑇𝑇𝑇𝑇𝑇 + 𝑀𝑀𝑀𝑀𝑀𝑀𝑀𝑀𝑇𝑇𝑀𝑀𝑇𝑇 𝑇𝑇𝑇𝑇𝑇𝑇𝑇𝑇)
2− 10
where max and minimum temperatures were collected from NOAA using Clemson
University’s station (NOAA, 2019). Turf quality (TQ) ratings were made on a 1 to 9
scale, with 9 being dense dark green grass and 1 being completely dead grass. Quality
ratings below 7 were considered unacceptable for putting surfaces. Normalized difference
of vegetative index (NDVI) was measured with a Field Scout TCM 500 NDVI Turf Color
Meter (Spectrum Technologies, Bridgend, United Kingdom). Three random samples
were taken within each plot and averaged. These values range from 0 – 0.999, and NDVI
is calculated using the formula
NDVI = R780 − R670R780 + R670
where R780 and R670 are designated as the measured reflectance of near-infrared
radiation (780 nm) and visible red radiation (670 nm) (Bremer et al. 2011; Trenholm et
al. 1999). TQ and NDVI were rated 3, 7, 14, 28, and 42 days after treatment (DAT).
Seedhead coverage was estimated as a percentage where 0 was no coverage and 100 was
entire plot coverage. Seedheads were also counted within a 7 x 7 cm random sample
within each plot. Seedhead percent coverage and counts were rated 14, 28, 42, and
56DAT. Three random 2.54 cm core samples of 10 cm depth were harvested from each
plot and combined at 56DAT. Roots were severed uniformly below thatch and separated.
Roots were then dried for 72 h at 60°C, and root mass was determined via loss by
ignition in a muffle furnace at 525°C (Snyder and Cisar, 2000).

31
Results and Discussion
Seedhead Emergence
In Clemson, SC initial seedhead emergence was observed in spring 2018 at 158
GDD, and in spring 2019 at 110 GDD. In fall 2018, initial emergence was at 2433 GDD
and in fall 2019, initial emergence was at 2372 GDD (Figure 1; Table 5). These results
are reasonably similar to findings by McCullough (2017), who reported initial emergence
in fairway height ‘Diamond’ zoysiagrass at 167 and 196 GDD in two spring seasons and
1949 and 2230 GDD in two fall seasons. Differences in height of cut likely attributed to
variations between studies. GDD proved to be a consistent metric to predict seedhead
emergence.
In Clemson, SC initial emergence occurred when photoperiod was 12.4 h in
spring 2018 and 12.4 h in spring 2019. Initial emergence occurred when photoperiod was
12.3 h in fall 2018, and 12.4 h in fall 2019. These results also support McCullough et al.
(2017) who reported initial emergence at 12.8 h in spring and fall. Again, differences in
height of cut likely influenced seedhead emergence timing. Photoperiod proved to be a
simpler and consistent metric to predict initial seedhead emergence in this study (Figure
1; Table 5).
Peak fall seedhead production was more consistent in density and duration,
observed in seedhead count. Fall seedheads were most abundant when photoperiod was
between 11 and 12 h. Fall seedheads were somewhat persistent through winter months in
a dormant state and may become initial spring seedheads (data not shown). Spring

32
seedheads were sporadic and lacked overall density. Managers can use these metrics to
time applications.
Table 5. Initial seedhead emergence dates for ‘Diamond’ zoysiagrass putting green, accumulated growing degree days (GDD) and photoperiod of Clemson, SC during 2018 and 2019. Initial Seedhead Emergencea Accumulated GDD (Base 10°C)b Photoperiodc 26 March 2018 158 12.4 17 September 2018 2433 12.3 27 March 2019 110 12.4 16 September 2019 2444 12.4 a First date a seedhead was observed in control plots. b Sum of GDD from 1 January until date of emergence. c Photoperiod on date of emergence.
Turf Quality
Turf quality (TQ) had a significant date by treatment interaction, p-value <0.0001,
warranting focus on individual dates (Tables 6 and 7). In spring 2018 at 7DAT, EP + TE
decreased TQ to 6, significantly below all treatments. At 14DAT, PC, PC + TE, FL + TE,
and PB + TE, all decreased TQ to 6, and EP + TE decreased TQ to 5.75, all significantly
below untreated. Decreases in quality were due to discoloration and reductions in density.
Results were not fully replicated in spring 2019, where at 7DAT, only EP and EP + TE
significantly decreased to 6. No treatment significantly increased TQ over untreated
during spring seasons.
In fall 2018, SI and SI + TE caused significant reductions. At 3DAT, SI and SI +
TE decreased to 6, while EP + TE decreased to 6.8 compared to 7 for the untreated. At
7DAT, SI, SI + TE, and EP + TE decreased to 5.5, 5.3, and 6.5, respectively, compared to
7.3 for the untreated. At 14DAT, SI and SI + TE decreased to 6 and 5.3, respectively,

33
compared to 7 for the untreated. At 28DAT, SI + TE decreased to 6.3 compared to 7 for
the untreated. In fall 2019 at 3DAT, SI and SI + TE decreased to 6 compared to 7.3 for
the untreated. At 7DAT, SI and SI + TE were similar to control, a stark difference from
2018.
Contrast tests were performed to determine effects of combinations of TE and
PGRs. TQ was significantly higher for PGRs without the addition of TE in spring 2018 at
3, 7, and 14DAT, in fall 2018 at 14DAT, and in fall 2019 at 7DAT (Table 8). TQ was
never significantly higher across all PGRs with the addition of TE.
Irrigation was unavailable to be applied exactly 4 h after treatment in 2018 due to
golfers utilizing the area, and application conditions for 2019 were milder. Irrigation was
deferred to 12 h after treatment. These factors ultimately increased phytotoxicity and
thinning of SI containing treatments in 2018. This illustrates the importance of thorough
and prompt incorporation of soil absorbed treatments. These results establish reasonable
rates for these PGRs to be used on Z. matrella putting greens. No treatment increased TQ
over untreated during the present study, but spring and fall timings are likely be less
responsive to PGRs than summer months. The addition of TE to alternative PGRs never
significantly improved TQ, likely providing excessive regulation.
Further research should investigate reduced rates and multiple applications to
prevent phytotoxicity of SI. Application intervals and increased rates during summer
months should also be studied for impacts on ball roll distance, clipping yield and TQ.
34
Table 6. Turf quality response means of ‘Diamond’ zoysiagrass putting green to various plant growth regulators from 13 April 2018 (3 days after treatment) (DAT) through 5 June 2018 (56DAT) and 21 March 2019 (3DAT) through 13 May 2019 (56DAT) in Clemson, South Carolina.
Spring 2018 Spring 2019 Treatment 3DAT 7DAT 14DAT 28DAT 42DAT 3DAT 7DAT 14DAT 28DAT 42DAT 1 – 9 (Best) Untreated 6.5abc 6.8a 6.75a 7.0a 7.0a 7.0a 7.0a 7.0a 7.0a 6.8bc TE 7.0a 7.0a 6.75a 7.0a 7.0a 7.0a 7.0a 7.0a 7.0a 7.3a PC 7.0a 7.0a 6.0bc 7.0a 7.0a 7.0a 7.0a 7.0a 7.0a 7.0ab PC + TE 6.5abc 6.5ab 6.0bc 7.0a 7.0a 7.0a 6.8a 7.0a 7.0a 7.0ab FL 7.0a 7.0a 6.5ab 7.0a 7.0a 7.0a 7.0a 6.5ab 6.8a 7.0ab FL +TE 7.0a 6.8a 6.0bc 7.0a 7.0a 7.0a 7.0a 7.0a 7.0a 7.0ab PB 6.8ab 7.0a 7.0a 7.0a 7.0a 7.0a 7.0a 6.8ab 7.0a 7.0ab PB + TE 6.3bc 6.5ab 6.0bc 7.0a 7.0a 7.0a 6.8a 6.8ab 7.0a 7.0ab EP 6.8ab 6.5ab 6.75a 7.0a 7.0a 6.5b 6.0b 6.5ab 6.8a 6.5c EP + TE 6.0c 6.0b 5.75c 7.0a 7.0a 6.5b 6.0b 6.3b 7.0a 6.8bc SI 7.0a 6.8a 7.0a 7.0a 7.0a 6.8ab 7.0a 6.8ab 7.0a 7.0ab SI + TE 7.0a 7.0a 6.75a 7.0a 7.0a 6.8ab 7.0a 6.8ab 7.0a 7.0ab LSD 0.5 0.6 0.5 0 0 0.5 0.3 0.6 0.3 0.5 Significance ** * *** NS NS NS *** NS NS NS
† Within columns, means followed by the same letter are not significantly different according to LSD (0.05). * Significant at the 0.05 probability level. ** Significant at the 0.01 probability level. *** Significant at the 0.001 probability level. ‡ NS, nonsignificant at 0.05 probability level. § Turf quality rated from 1 – 9 where 9 = best turf and values < 7.0 are unacceptable.
34

35
Table 7. Turf quality response means of ‘Diamond’ zoysiagrass putting green to various plant growth regulators from 9 September 2018 (3DAT) through 1 November 2018 (56DAT) and 12 September 2019 (3DAT) through 4 November 2019 (56DAT) in Clemson, South Carolina.
Fall 2018 Fall 2019 Treatment 3DAT 7DAT 14DAT 28DAT 42DAT 3DAT 7DAT 14DAT 28DAT 42DAT 1 – 9 (Best) Untreated 7.0a 7.3a 7.0ab 7.0a 7.0a 7.3ab 7.0b 7.0a 7.0a 7.0a TE 7.0a 7.3a 7.3a 7.0a 7.0a 7.0ab 7.0b 7.0a 7.0a 7.0a PC 7.0a 7.3a 7.0ab 7.0a 7.0a 7.5a 7.0b 7.0a 7.0a 7.0a PC + TE 7.0a 7.3a 6.0cd 7.0a 7.0a 7.3ab 7.0b 7.0a 7.0a 7.0a FL 7.0a 7.0a 7.0ab 6.8a 7.0a 7.0ab 7.5a 7.0a 7.0a 7.0a FL +TE 7.0a 7.3a 6.0cd 6.8a 7.0a 7.3ab 7.0b 7.0a 7.0a 7.0a PB 7.0a 7.0a 7.0ab 7.0a 7.0a 7.5ab 7.5a 7.0a 7.0a 7.0a PB + TE 7.0a 7.0a 6.3bc 7.0a 7.0a 7.3ab 7.0b 7.0a 7.0a 7.0a EP 7.0a 6.8ab 7.3a 7.0a 7.0a 7.0ab 7.0b 7.0a 7.0a 7.0a EP + TE 6.8b 6.5b 7.0ab 6.8ab 7.0a 6.8b 7.0b 7.0a 7.0a 7.0a SI 6.0c 5.5c 6.0cd 6.8ab 7.0a 6.0c 7.0b 7.0a 7.0a 7.0a SI + TE 6.0c 5.3c 5.3d 6.3b 7.0a 6.0c 6.8b 6.8b 6.8b 7.0a LSD 0.2 0.6 0.8 0.5 0 0.7 0.3 0.2 0.2 0 Significance *** *** *** NS NS *** *** NS NS NS
† Within columns, means followed by the same letter are not significantly different according to LSD (0.05). *** Significant at the 0.001 probability level. ‡ NS, nonsignificant at 0.05 probability level. § Turf quality rated from 1 – 9, where 9 = best turf and values < 7.0 are unacceptable.
35
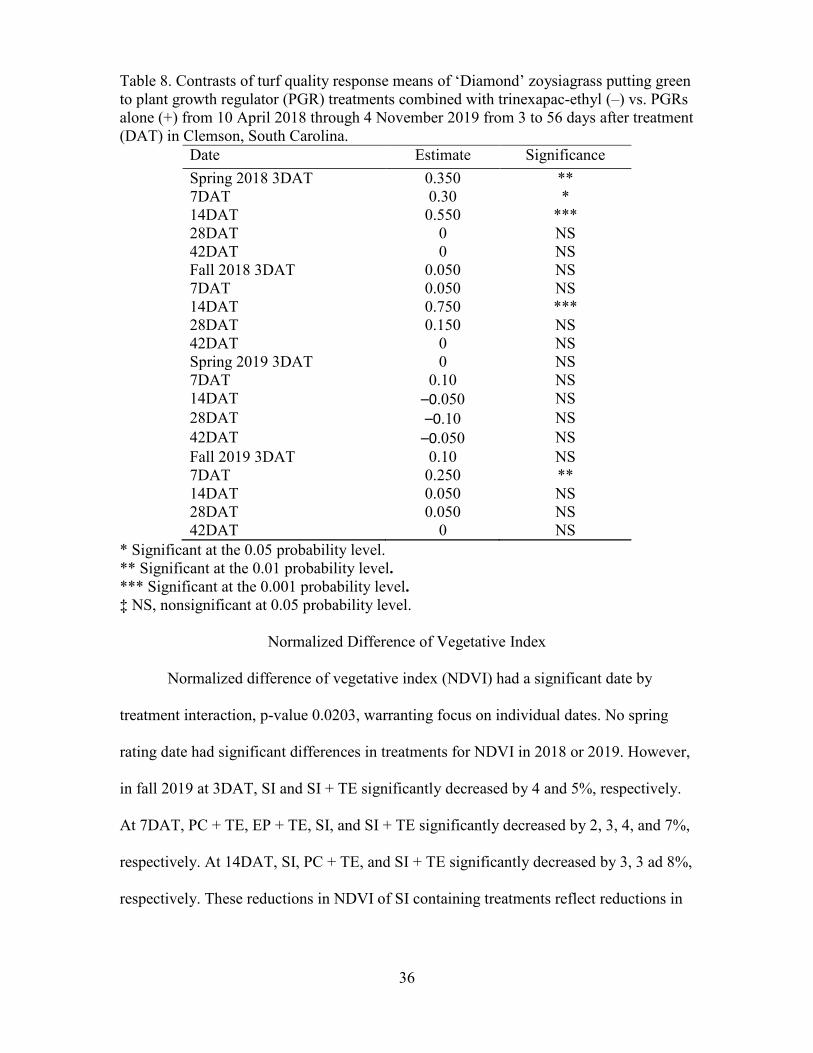
36
Table 8. Contrasts of turf quality response means of ‘Diamond’ zoysiagrass putting green to plant growth regulator (PGR) treatments combined with trinexapac-ethyl (–) vs. PGRs alone (+) from 10 April 2018 through 4 November 2019 from 3 to 56 days after treatment (DAT) in Clemson, South Carolina.
Date Estimate Significance Spring 2018 3DAT 0.350 ** 7DAT 0.30 * 14DAT 0.550 *** 28DAT 0 NS 42DAT 0 NS Fall 2018 3DAT 0.050 NS 7DAT 0.050 NS 14DAT 0.750 *** 28DAT 0.150 NS 42DAT 0 NS Spring 2019 3DAT 0 NS 7DAT 0.10 NS 14DAT –0.050 NS 28DAT –0.10 NS 42DAT –0.050 NS Fall 2019 3DAT 0.10 NS 7DAT 0.250 ** 14DAT 0.050 NS 28DAT 0.050 NS 42DAT 0 NS
* Significant at the 0.05 probability level. ** Significant at the 0.01 probability level. *** Significant at the 0.001 probability level. ‡ NS, nonsignificant at 0.05 probability level.
Normalized Difference of Vegetative Index
Normalized difference of vegetative index (NDVI) had a significant date by
treatment interaction, p-value 0.0203, warranting focus on individual dates. No spring
rating date had significant differences in treatments for NDVI in 2018 or 2019. However,
in fall 2019 at 3DAT, SI and SI + TE significantly decreased by 4 and 5%, respectively.
At 7DAT, PC + TE, EP + TE, SI, and SI + TE significantly decreased by 2, 3, 4, and 7%,
respectively. At 14DAT, SI, PC + TE, and SI + TE significantly decreased by 3, 3 ad 8%,
respectively. These reductions in NDVI of SI containing treatments reflect reductions in

37
2018 TQ ratings. In fall 2019 at 7DAT, PC + TE and SI + TE significantly decreased by
2 and 4%, respectively. At 14DAT, FL + TE, EP + TE, PC + TE, and SI + TE
significantly decreased by 3, 4, 4, and 6%, respectively.
Contrast tests illustrated NDVI was greater for PGRs alone in spring 2018 at 7
and 14DAT, in fall 2018 at 14 and 28DAT, and in fall 2019 at 14DAT. Addition of TE to
other PGRs more consistently reduced NDVI, likely from over regulating growth.
These results illustrate these PGRs were able to be applied during early spring and
fall seasons without drastic reductions in color, spring ‘greenup’ or winter survival.
Treatments containing SI reduced NDVI in fall 2018 and 2019, but this period was
significantly shorter in 2019 with thorough incorporation with irrigation. No treatments
were able to significantly improve color over untreated.
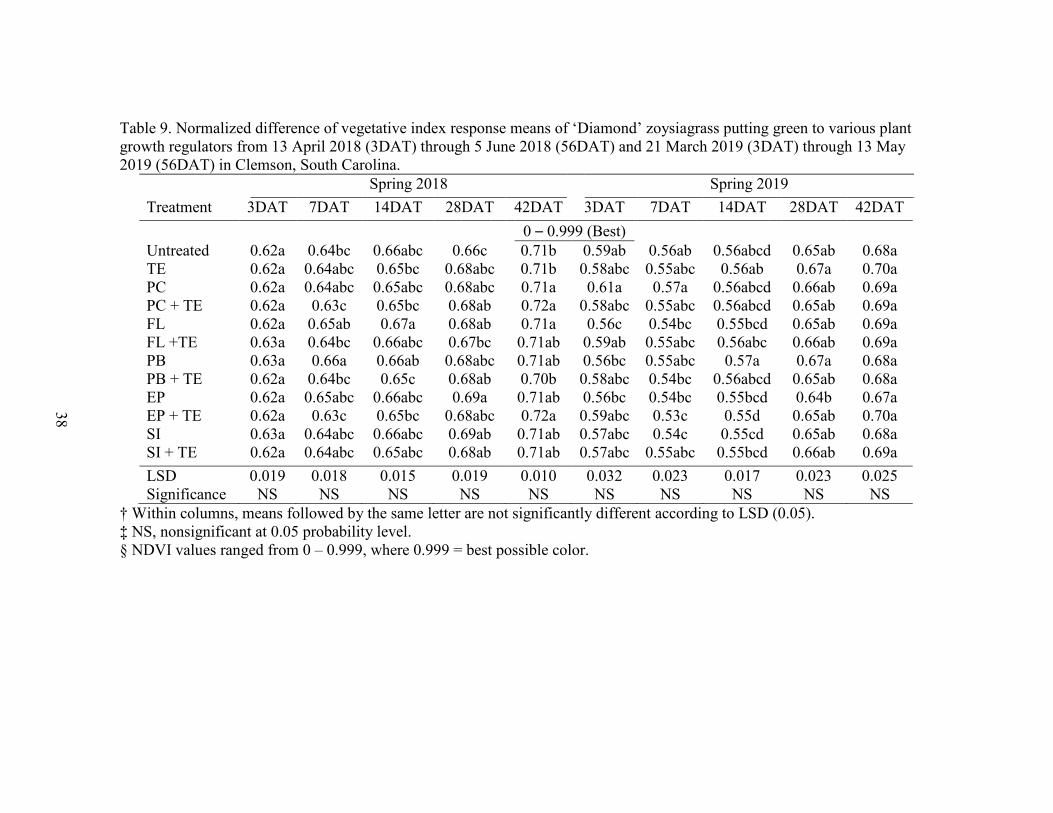
38
Table 9. Normalized difference of vegetative index response means of ‘Diamond’ zoysiagrass putting green to various plant growth regulators from 13 April 2018 (3DAT) through 5 June 2018 (56DAT) and 21 March 2019 (3DAT) through 13 May 2019 (56DAT) in Clemson, South Carolina.
Spring 2018 Spring 2019 Treatment 3DAT 7DAT 14DAT 28DAT 42DAT 3DAT 7DAT 14DAT 28DAT 42DAT 0 – 0.999 (Best) Untreated 0.62a 0.64bc 0.66abc 0.66c 0.71b 0.59ab 0.56ab 0.56abcd 0.65ab 0.68a TE 0.62a 0.64abc 0.65bc 0.68abc 0.71b 0.58abc 0.55abc 0.56ab 0.67a 0.70a PC 0.62a 0.64abc 0.65abc 0.68abc 0.71a 0.61a 0.57a 0.56abcd 0.66ab 0.69a PC + TE 0.62a 0.63c 0.65bc 0.68ab 0.72a 0.58abc 0.55abc 0.56abcd 0.65ab 0.69a FL 0.62a 0.65ab 0.67a 0.68ab 0.71a 0.56c 0.54bc 0.55bcd 0.65ab 0.69a FL +TE 0.63a 0.64bc 0.66abc 0.67bc 0.71ab 0.59ab 0.55abc 0.56abc 0.66ab 0.69a PB 0.63a 0.66a 0.66ab 0.68abc 0.71ab 0.56bc 0.55abc 0.57a 0.67a 0.68a PB + TE 0.62a 0.64bc 0.65c 0.68ab 0.70b 0.58abc 0.54bc 0.56abcd 0.65ab 0.68a EP 0.62a 0.65abc 0.66abc 0.69a 0.71ab 0.56bc 0.54bc 0.55bcd 0.64b 0.67a EP + TE 0.62a 0.63c 0.65bc 0.68abc 0.72a 0.59abc 0.53c 0.55d 0.65ab 0.70a SI 0.63a 0.64abc 0.66abc 0.69ab 0.71ab 0.57abc 0.54c 0.55cd 0.65ab 0.68a SI + TE 0.62a 0.64abc 0.65abc 0.68ab 0.71ab 0.57abc 0.55abc 0.55bcd 0.66ab 0.69a LSD 0.019 0.018 0.015 0.019 0.010 0.032 0.023 0.017 0.023 0.025 Significance NS NS NS NS NS NS NS NS NS NS
† Within columns, means followed by the same letter are not significantly different according to LSD (0.05). ‡ NS, nonsignificant at 0.05 probability level. § NDVI values ranged from 0 – 0.999, where 0.999 = best possible color.
38

39
Table 10. Normalized difference of vegetative index response means of ‘Diamond’ zoysiagrass putting green to various plant growth regulators from 9 September 2018 (3DAT) through 1 November 2018 (56DAT) and 12 September 2019 (3DAT) through 4 November 2019 (56DAT) in Clemson, South Carolina.
Fall 2018 Fall 2019 Treatment 3DAT 7DAT 14DAT 28DAT 42DAT 3DAT 7DAT 14DAT 28DAT 42DAT 0 – 0.999 (Best) Untreated 0.72a 0.73a 0.67ab 0.70ab 0.68ab 0.59abc 0.64ab 0.66a 0.66bcde 0.63ab TE 0.72a 0.73ab 0.67ab 0.70ab 0.69a 0.59ab 0.63abc 0.65abc 0.68ab 0.65a PC 0.72a 0.72ab 0.67ab 0.70ab 0.68a 0.59abc 0.64ab 0.65abc 0.68a 0.65ab PC + TE 0.71a 0.71bc 0.65b 0.69b 0.67b 0.57bc 0.63bc 0.64bcd 0.67abc 0.64ab FL 0.71a 0.72ab 0.67ab 0.70ab 0.69a 0.60a 0.65a 0.64abcd 0.66abcde 0.64ab FL +TE 0.72a 0.73ab 0.67ab 0.70b 0.69a 0.59abc 0.65a 0.64bcd 0.67abcd 0.64ab PB 0.71a 0.72ab 0.66ab 0.70ab 0.68ab 0.58abc 0.64ab 0.66ab 0.67abcd 0.64ab PB + TE 0.71a 0.72ab 0.66ab 0.70b 0.68ab 0.59ab 0.64ab 0.64abcd 0.65cde 0.63b EP 0.71a 0.72ab 0.68a 0.72a 0.68ab 0.59abc 0.64ab 0.65abc 0.65de 0.64ab EP + TE 0.71a 0.71bc 0.67ab 0.71ab 0.68ab 0.58abc 0.64ab 0.63cd 0.67abcde 0.63ab SI 0.69b 0.70c 0.65bc 0.70ab 0.69a 0.58abc 0.63bc 0.64abcd 0.66abcde 0.64ab SI + TE 0.69b 0.68d 0.61c 0.68b 0.68ab 0.57c 0.62c 0.62d 0.65e 0.63ab LSD 0.013 0.016 0.032 0.023 0.017 0.022 0.018 0.022 0.022 0.017 Significance *** *** * NS NS NS * * NS NS
† Within columns, means followed by the same letter are not significantly different according to LSD (0.05). * Significant at the 0.05 probability level. *** Significant at the 0.001 probability level. ‡ NS, nonsignificant at 0.05 probability level. § NDVI values ranged from 0 – 0.999, where 0.999 = best possible color.
39

40
Table 11. Contrasts of normalized difference of vegetative index means of ‘Diamond’ zoysiagrass putting green to plant growth regulator (PGR) treatments combined with trinexapac-ethyl (–) vs. PGRs alone (+) from 10 April 2018 through 4 November 2019 from 3 to 56 days after treatment (DAT) in Clemson, South Carolina.
Date Estimate Significance Spring 2018 3DAT 0.0005 NS 7DAT 0.0103 ** 14DAT 0.0096 ** 28DAT 0.0036 NS 42DAT 0.0004 NS Fall 2018 3DAT 0.0022 NS 7DAT 0.0061 NS 14DAT 0.0162 * 28DAT 0.0118 * 42DAT 0.0060 NS Spring 2019 3DAT –0.0090 NS 7DAT 0.0047 NS 14DAT –0.0010 NS 28DAT 0.0009 NS 42DAT –0.0060 NS Fall 2019 3DAT 0.0059 NS 7DAT 0.0051 NS 14DAT 0.0136 ** 28DAT 0.0027 NS 42DAT 0.0062 NS
* Significant at the 0.05 probability level. ** Significant at the 0.01 probability level. ‡ NS, nonsignificant at 0.05 probability level.
Seedhead Coverage
Seedhead coverage had a significant date by treatment interaction, p-value
<0.0001, warranting focus on individual dates.
In spring 2018, seedhead emergence occurred before treatments were applied,
negatively impacting seedhead control. However, at 14DAT in spring 2018, SI + TE
reduced coverage by 10% from untreated. At 28DAT, SI + TE, PC + TE, FL, FL + TE,
and EP reduced coverage by 8% from untreated, while SI and EP + TE reduced coverage

41
by 10% from untreated. In spring 2019 at 14DAT, FL, PB, PB + TE, and EP reduced
coverage by 8% from untreated.
In fall 2018, seedhead coverage was significantly different for all rating dates. In
fall 2018 at 14DAT, SI + TE reduced coverage by 23% from untreated, while EP
increased coverage by 15% over untreated. At 28DAT, SI, SI + TE, and EP reduced
coverage by 38, 38 and 18%, respectively, from untreated. At 42DAT, SI and SI + TE
reduced coverage by 38 and 35%, respectively, from untreated. At 56DAT, SI and SI +
TE reduced coverage by 35 and 23%, respectively, from untreated.
In fall 2019 at 28DAT, SI and SI + TE both reduced coverage by 8% from
untreated, while PC + TE and FL + TE increased coverage by ~8%, over untreated. At
42DAT, SI, SI + TE, EP, and FL reduced coverage by 46, 41, 18, and 15%, respectively,
from untreated. At 56DAT, SI and SI + TE reduced coverage by 40 and 35%,
respectively, from untreated, while PC + TE and FL + TE increased coverage by 18 and
15%, respectively, over untreated.
Contrast tests illustrated seedhead coverage in fall 2018 at 14DAT increased by
14% with the addition of TE to other PGRs. This effect needs further evaluation to be
supported.

42
Table 12. Percentage seedhead coverage response means of ‘Diamond’ zoysiagrass putting green to various plant growth regulators from 24 April 2018 (14DAT) through 5 June 2018 (56DAT) and 1 April 2019 (14DAT) through 13 May 2019 (56DAT) in Clemson, South Carolina.
Spring 2018 Spring 2019 Treatment 14DAT 28DAT 42DAT 56DAT 14DAT 28DAT 42DAT 56DAT 0 – 100% coverage plot-1 Untreated 25.0abc 10.0a 0a 0a 0a 12.5a 0a 0a TE 30.0ab 10.0a 0a 0a 0a 12.5a 0a 0a PC 22.5bcd 2.5bc 0a 0a 0a 12.5a 0a 0a PC + TE 25.0abc 5.0abc 0a 0a 0a 7.5ab 0a 0a FL 20.0cd 2.5bc 0a 0a 0a 5.0b 0a 0a FL +TE 32.5a 2.5bc 0a 0a 0a 10.0ab 0a 0a PB 22.5bcd 5.0abc 0a 0a 0a 5.0b 0a 0a PB + TE 22.5bcd 7.5ab 0a 0a 0a 5.0b 0a 0a EP 20.0cd 2.5bc 0a 0a 0a 5.0b 0a 0a EP + TE 20.0cd 0c 0a 0a 0a 7.5ab 0a 0a SI 17.5cd 0c 0a 0a 0a 7.5ab 0a 0a SI + TE 15.0d 2.5bc 0a 0a 0a 10.0ab 0a 0a LSD 9.4 6.6 0 0 0 6.8 0 0 Significance * * NS NS NS NS NS NS
† Within columns, means followed by the same letter are not significantly different according to LSD (0.05). * Significant at the 0.05 probability level. ‡ NS, nonsignificant at 0.05 probability level. § Seedhead coverage percentage was determined visually by the portion of the plot with visible seedheads, where lower percentages are desirable.
42

43
Table 13. Percentage seedhead coverage response means of ‘Diamond’ zoysiagrass putting green to various plant growth regulators from 20 September 2018 (14DAT) through 1 November 2018 (56DAT) and 23 September 2019 (14DAT) through 4 November 2019 (56DAT) in Clemson, South Carolina.
Fall 2018 Fall 2019 Treatment 14DAT 28DAT 42DAT 56DAT 14DAT 28DAT 42DAT 56DAT 0 – 100% coverage plot-1 Untreated 32.5bc 37.5bc 55.0a 65.0ab 0a 7.5bc 47.5a 45.0c TE 22.5cd 37.5bc 40.0a 70.0a 0a 5.0cd 37.5abc 55.0abc PC 40.0abc 52.5ab 42.5a 65.0ab 0a 13.8ab 45.0a 56.3abc PC + TE 32.5bc 60.0a 52.5a 67.5ab 0a 16.3a 37.5abc 62.5a FL 52.5ab 35.0bc 42.5a 60.0b 0a 13.8ab 32.5bc 52.5abc FL +TE 35.0bc 30.0cd 45.0a 67.5ab 0a 15.0a 42.5ab 60.0ab PB 40.0abc 30.0cd 42.5a 62.5ab 0a 13.8ab 47.5a 48.8bc PB + TE 27.5cd 32.5cd 55.0a 65.0ab 0a 7.5bc 40.0abc 51.3abc EP 57.5a 20.0d 45.0a 65.0ab 0a 5.0cd 30.0c 46.3c EP + TE 37.5abc 35.0cd 47.5a 65.0ab 0a 7.5bc 40.0abc 48.8bc SI 20.0cd 0e 12.5b 30.0c 0a 0d 1.25d 5.0d SI + TE 10.0d 0e 15.0b 37.5c 0a 0d 6.25d 10.0d LSD 20.1 17.3 15.3 9.6 0 6.7 11.3 11.6 Significance ** *** *** *** NS *** ** ***
† Within columns, means followed by the same letter are not significantly different according to LSD (0.05). ** Significant at the 0.01 probability level. *** Significant at the 0.001 probability level. ‡ NS, nonsignificant at 0.05 probability level. § Seedhead coverage percentage was determined visually by the portion of the plot with visible seedheads, where lower percentages are desirable.
43

44
Table 14. Contrasts of percentage seedhead coverage means of ‘Diamond’ zoysiagrass putting green to plant growth regulator (PGR) treatments combined with trinexapac-ethyl (–) vs. PGRs alone (+) from 24 April 2018 through 4 November 2019 from 14 to 56 days after treatment (DAT) in Clemson, South Carolina.
Date Estimate Significance Spring 2018 14DAT –2.5 NS 28DAT –1.0 NS 42DAT 0 NS 56DAT 0 NS Fall 2018 14DAT –4.0 NS 28DAT 13.5 ** 42DAT –6.0 NS 56DAT –4.0 NS Spring 2019 14DAT 0 NS 28DAT –2.5 NS 42DAT 0 NS 56DAT 0 NS Fall 2019 14DAT 0 NS 28DAT –2.0 NS 42DAT –2.0 NS 56DAT –4.8 NS
** Significant at the 0.01 probability level. ‡ NS, nonsignificant at 0.05 probability level.
Seedhead Count
Seedhead count results had a significant date by treatment interaction, p-value
<0.0001, warranting focus on individual dates.
In spring 2018, seedhead production began before treatments were applied on 10
April, likely reducing treatment effectiveness. However, in spring 2018 at 14DAT, SI +
TE and EP + TE reduced count by 47 and 40%, respectively, from untreated.
Spring 2019 treatments were applied earlier, 18 March but this season was cooler
than 2018 and may explain reduced seedhead production. Accumulated GDD at 10 April
2018 was 211, while 10 April 2019 was 175 (data not shown). These increased

45
temperatures early in the season may have initiated earlier seedhead production.
However, GDD at 14 May were 465 in 2018 and 500 in 2019. Recent findings report
spring seedhead reductions from fall applications of EP (Patton et al., 2018), but poor
seedhead production in spring 2019 lead to the current study being unable to support
these findings.
In fall 2018 at 28DAT, SI and SI + TE decreased count by 97 and 98% from
untreated, respectively, while PC increased count by 62% from untreated. At 42DAT, SI
and SI + TE decreased count by 75 and 70% from untreated, respectively. At 56DAT, SI
and SI + TE decreased count by 41 and 35% from untreated, respectively.
In fall 2019 at 28DAT, SI and SI + TE decreased count by 100 and 98% from
untreated, respectively. At 42DAT, SI and SI + TE both decreased count by 98% from
untreated. At 56DAT, SI and SI + TE decreased count by 96 and 92% from untreated,
respectively.
In fall 2018 at 14DAT, contrast tests illustrated PGRs combined with TE reduced
seedhead counts by 3 per sample over PGRs alone. The inconsistency of these findings
indicates TE alone or in combination is not a sufficient seedhead reduction tool.
Seedhead control was most effectively achieved with treatments containing SI.
All other treatments were unable to reduce seedhead count below untreated. Turfgrass
managers should utilize SI to provide significantly less seedhead production for a large
portion of the production period. Reapplication may be useful to extending control past
56DAT.

46
Further research should also be conducted using other chemistries than those in
this study for seedhead control. Studies should investigate different application dates and
re-application intervals to maximize seedhead control.

47
Table 15. Seedhead count response means of ‘Diamond’ zoysiagrass putting green to various plant growth regulators from 24 April 2018 (14DAT) through 5 June 2018 (56DAT) and 1 April 2019 (14DAT) through 13 May 2019 (56DAT) in Clemson, South Carolina. Spring 2018 Spring 2019 Treatment 14DAT 28DAT 42DAT 56DAT 14DAT 28DAT 42DAT 56DAT count 7x7 cm-sample-1 Untreated 25.0ab 1.3ab 0a 0a 0a 1.0a 1.0a 1.3a TE 28.0a 1.3ab 0a 0a 0a 1.8a 0.8ab 1.8a PC 19.8abc 1.3ab 0a 0a 0a 1.8a 0.3ab 0.3a PC + TE 21.3abc 1.3ab 0a 0a 0a 0.8a 0.8ab 0.3a FL 17.5bc 0.5ab 0a 0a 0a 2.0a 0.8ab 1.0a FL +TE 29.0a 1.3ab 0a 0a 0a 1.8a 0b 1.3a PB 21.5abc 1.8a 0a 0a 0a 0.8a 0.3ab 1.0a PB + TE 18.3bc 1.5ab 0a 0a 0a 1.0a 0.5ab 1.0a EP 21.3abc 0.5ab 0a 0a 0a 1.8a 0.5ab 0.3a EP + TE 15.0c 0.8ab 0a 0a 0a 0.3a 0.8ab 0.8a SI 15.5bc 0.3b 0a 0a 0a 1.0a 0b 1.8a SI + TE 13.3c 0.8ab 0a 0a 0a 2.0a 1.0a 1.3a LSD 9.7 1.3 0 0 0 2.0 1.0 1.5 Significance * NS NS NS NS NS NS NS
† Within columns, means followed by the same letter are not significantly different according to LSD (0.05). * Significant at the 0.05 probability level. ‡ NS, nonsignificant at 0.05 probability level. § Seedheads were counter in each sample, where lower counts are desirable.
47
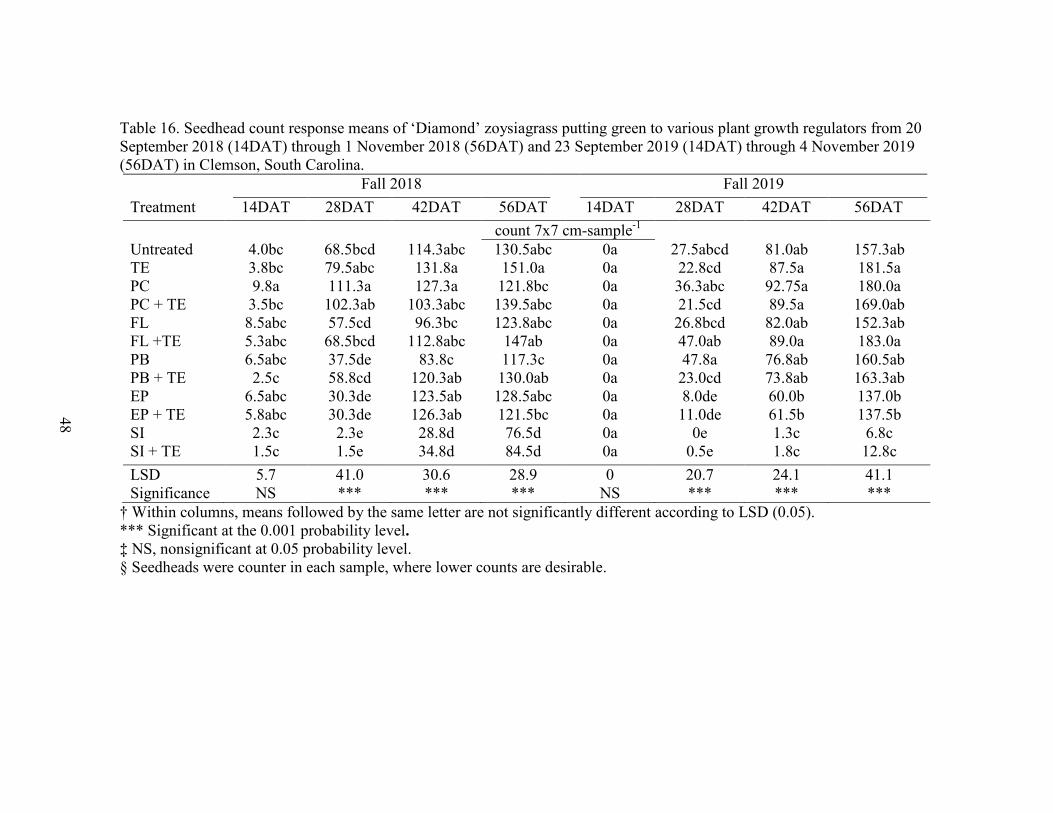
48
Table 16. Seedhead count response means of ‘Diamond’ zoysiagrass putting green to various plant growth regulators from 20 September 2018 (14DAT) through 1 November 2018 (56DAT) and 23 September 2019 (14DAT) through 4 November 2019 (56DAT) in Clemson, South Carolina.
Fall 2018 Fall 2019 Treatment 14DAT 28DAT 42DAT 56DAT 14DAT 28DAT 42DAT 56DAT count 7x7 cm-sample-1 Untreated 4.0bc 68.5bcd 114.3abc 130.5abc 0a 27.5abcd 81.0ab 157.3ab TE 3.8bc 79.5abc 131.8a 151.0a 0a 22.8cd 87.5a 181.5a PC 9.8a 111.3a 127.3a 121.8bc 0a 36.3abc 92.75a 180.0a PC + TE 3.5bc 102.3ab 103.3abc 139.5abc 0a 21.5cd 89.5a 169.0ab FL 8.5abc 57.5cd 96.3bc 123.8abc 0a 26.8bcd 82.0ab 152.3ab FL +TE 5.3abc 68.5bcd 112.8abc 147ab 0a 47.0ab 89.0a 183.0a PB 6.5abc 37.5de 83.8c 117.3c 0a 47.8a 76.8ab 160.5ab PB + TE 2.5c 58.8cd 120.3ab 130.0ab 0a 23.0cd 73.8ab 163.3ab EP 6.5abc 30.3de 123.5ab 128.5abc 0a 8.0de 60.0b 137.0b EP + TE 5.8abc 30.3de 126.3ab 121.5bc 0a 11.0de 61.5b 137.5b SI 2.3c 2.3e 28.8d 76.5d 0a 0e 1.3c 6.8c SI + TE 1.5c 1.5e 34.8d 84.5d 0a 0.5e 1.8c 12.8c LSD 5.7 41.0 30.6 28.9 0 20.7 24.1 41.1 Significance NS *** *** *** NS *** *** ***
† Within columns, means followed by the same letter are not significantly different according to LSD (0.05). *** Significant at the 0.001 probability level. ‡ NS, nonsignificant at 0.05 probability level. § Seedheads were counter in each sample, where lower counts are desirable.
48
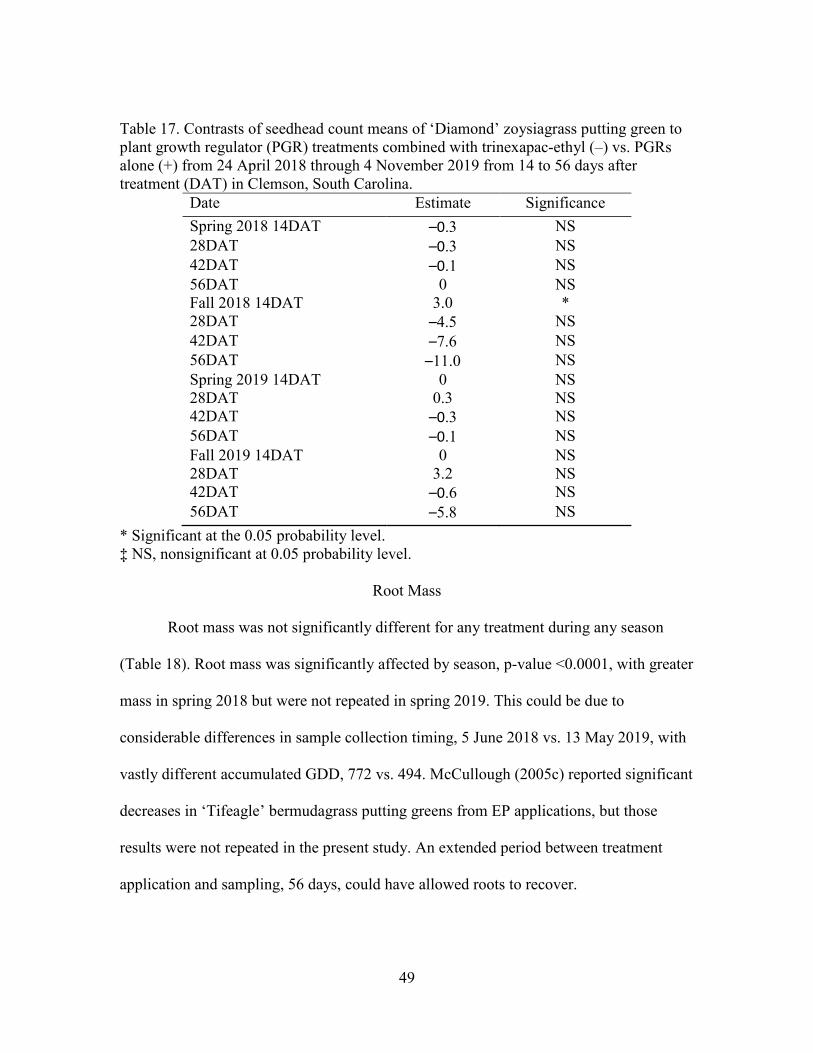
49
Table 17. Contrasts of seedhead count means of ‘Diamond’ zoysiagrass putting green to plant growth regulator (PGR) treatments combined with trinexapac-ethyl (–) vs. PGRs alone (+) from 24 April 2018 through 4 November 2019 from 14 to 56 days after treatment (DAT) in Clemson, South Carolina.
Date Estimate Significance Spring 2018 14DAT –0.3 NS 28DAT –0.3 NS 42DAT –0.1 NS 56DAT 0 NS Fall 2018 14DAT 3.0 * 28DAT –4.5 NS 42DAT –7.6 NS 56DAT –11.0 NS Spring 2019 14DAT 0 NS 28DAT 0.3 NS 42DAT –0.3 NS 56DAT –0.1 NS Fall 2019 14DAT 0 NS 28DAT 3.2 NS 42DAT –0.6 NS 56DAT –5.8 NS
* Significant at the 0.05 probability level. ‡ NS, nonsignificant at 0.05 probability level.
Root Mass
Root mass was not significantly different for any treatment during any season
(Table 18). Root mass was significantly affected by season, p-value <0.0001, with greater
mass in spring 2018 but were not repeated in spring 2019. This could be due to
considerable differences in sample collection timing, 5 June 2018 vs. 13 May 2019, with
vastly different accumulated GDD, 772 vs. 494. McCullough (2005c) reported significant
decreases in ‘Tifeagle’ bermudagrass putting greens from EP applications, but those
results were not repeated in the present study. An extended period between treatment
application and sampling, 56 days, could have allowed roots to recover.

50
Table 18. Root mass response means of ‘Diamond’ zoysiagrass putting green to various plant growth regulators from 56 days after treatment 5 June 2018, 1 November 2018, 13 May 2019 and 4 November 2019 in Clemson, South Carolina.
2018 2019 Treatment Spring Fall Spring Fall g root mass plot-sample-1 Untreated 0.56b 0.49a 0.52a 0.49a TE 0.70ab 0.47a 0.59a 0.49a PC 0.77a 0.51a 0.56a 0.53a PC + TE 0.75ab 0.52a 0.56a 0.53a FL 0.86a 0.51a 0.47a 0.51a FL +TE 0.75ab 0.51a 0.56a 0.53a PB 0.77a 0.49a 0.56a 0.54a PB + TE 0.83a 0.48a 0.58a 0.49a EP 0.70ab 0.53a 0.53a 0.43a EP + TE 0.84a 0.49a 0.56a 0.47a SI 0.74ab 0.48a 0.59a 0.52a SI + TE 0.67ab 0.50a 0.49a 0.52a LSD 0.20 0.12 0.14 0.15 Significance NS NS NS NS
† Within columns, means followed by the same letter are not significantly different according to LSD (0.1). ‡ NS, nonsignificant at 0.1 probability level. § Root mass was determined via loss by ignition of samples which included 3 random 1.27 cm cores combined per plot, where higher weights are desirable.
50

51
Table 19. Contrasts of root mass means of ‘Diamond’ zoysiagrass putting green to plant growth regulators (PGRs) combined with trinexapac-ethyl (–) vs. PGRs alone (+) from 5 June 2018, 1 November 2018, 13 May 2019 and 4 November 2019 from 56 days after treatment in Clemson, South Carolina.
Date Estimate Significance Spring 2018 –0.0010 NS Fall 2018 0.0255 NS Spring 2019 –0.008 NS Fall 2019 –0.004 NS
‡ NS, nonsignificant at 0.1 probability level.
Contrasts
Contrast tests of means were performed to determine the effects of PGRs alone (-)
and PGRs in combination with TE (Table 20). Spring TQ was lower than fall, and this
was confirmed with spring NDVI being lower than fall. Both spring and fall seasons had
higher TQ when PGRs were not combined with TE, and this is supported by fall NDVI
being higher for PGRs alone.
Seedhead coverage and count were drastically higher for fall than spring, and
neither metric was significantly impacted by presence or lack of TE with other PGRs.
Seedhead coverage and count were greater in 2018 than 2019, likely due to fall 2019
14DAT having negligible seedhead presence.
These results emphasize seedhead control is more pertinent in fall than spring.
This also offers flexibility with rates and other products as TQ and NDVI were greater in
fall than spring. Treatment with TE or combinations with TE were unable to reduce
seedhead production.
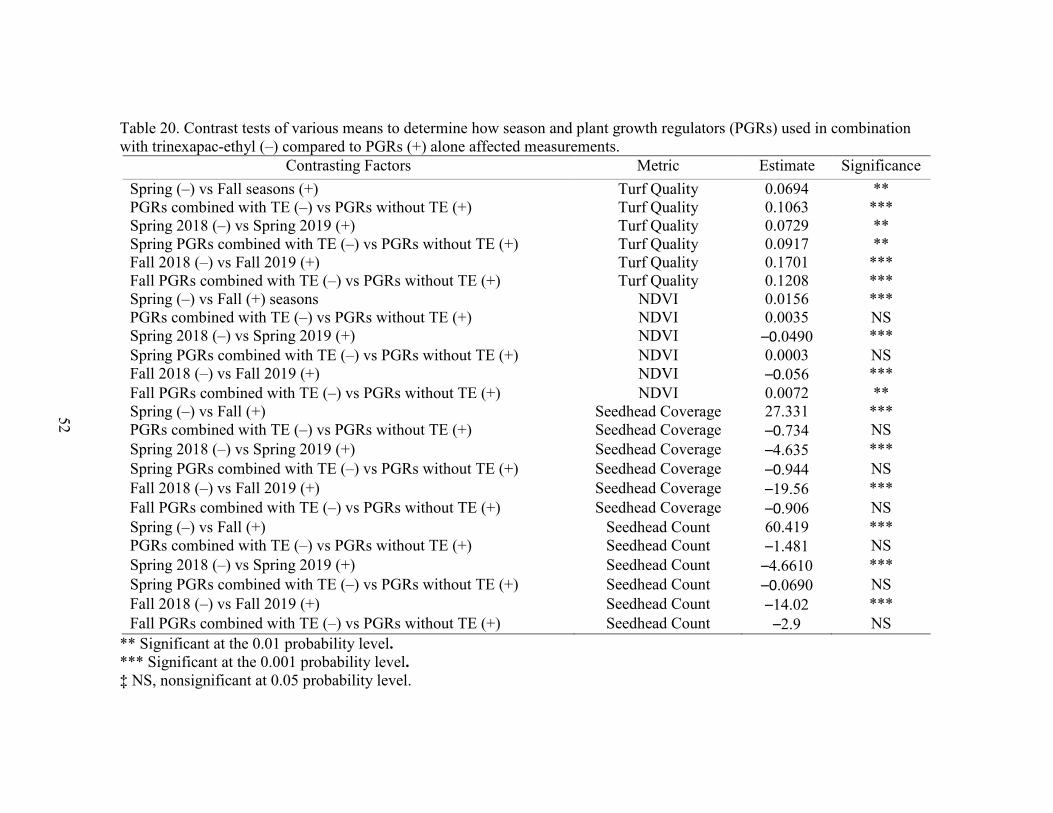
52
Table 20. Contrast tests of various means to determine how season and plant growth regulators (PGRs) used in combination with trinexapac-ethyl (–) compared to PGRs (+) alone affected measurements.
Contrasting Factors Metric Estimate Significance Spring (–) vs Fall seasons (+) Turf Quality 0.0694 ** PGRs combined with TE (–) vs PGRs without TE (+) Turf Quality 0.1063 *** Spring 2018 (–) vs Spring 2019 (+) Turf Quality 0.0729 ** Spring PGRs combined with TE (–) vs PGRs without TE (+) Turf Quality 0.0917 ** Fall 2018 (–) vs Fall 2019 (+) Turf Quality 0.1701 *** Fall PGRs combined with TE (–) vs PGRs without TE (+) Turf Quality 0.1208 *** Spring (–) vs Fall (+) seasons NDVI 0.0156 *** PGRs combined with TE (–) vs PGRs without TE (+) NDVI 0.0035 NS Spring 2018 (–) vs Spring 2019 (+) NDVI –0.0490 *** Spring PGRs combined with TE (–) vs PGRs without TE (+) NDVI 0.0003 NS Fall 2018 (–) vs Fall 2019 (+) NDVI –0.056 *** Fall PGRs combined with TE (–) vs PGRs without TE (+) NDVI 0.0072 ** Spring (–) vs Fall (+) Seedhead Coverage 27.331 *** PGRs combined with TE (–) vs PGRs without TE (+) Seedhead Coverage –0.734 NS Spring 2018 (–) vs Spring 2019 (+) Seedhead Coverage –4.635 *** Spring PGRs combined with TE (–) vs PGRs without TE (+) Seedhead Coverage –0.944 NS Fall 2018 (–) vs Fall 2019 (+) Seedhead Coverage –19.56 *** Fall PGRs combined with TE (–) vs PGRs without TE (+) Seedhead Coverage –0.906 NS Spring (–) vs Fall (+) Seedhead Count 60.419 *** PGRs combined with TE (–) vs PGRs without TE (+) Seedhead Count –1.481 NS Spring 2018 (–) vs Spring 2019 (+) Seedhead Count –4.6610 *** Spring PGRs combined with TE (–) vs PGRs without TE (+) Seedhead Count –0.0690 NS Fall 2018 (–) vs Fall 2019 (+) Seedhead Count –14.02 *** Fall PGRs combined with TE (–) vs PGRs without TE (+) Seedhead Count –2.9 NS
** Significant at the 0.01 probability level. *** Significant at the 0.001 probability level. ‡ NS, nonsignificant at 0.05 probability level.
52
53
CHAPTER THREE
‘DIAMOND’ ZOYSIAGRASS (Zoysia matrella (L.) Merr.) SEEDHEAD CONTROL AND RESPONSE TO REPEAT APPLICATIONS OF PLANT GROWTH
REGULATORS
Introduction
‘Diamond’ zoysiagrass (Zoysia matrella (L.) Merr.) putting green response to the
plant growth regulator TE has been previously documented (Atkinson et al. 2012; Qian et
al., 1998; Menchyk et al., 2014). However, alternative plant growth regulators (PGRs)
such as PC, FL, PB and EP do not have labeled use rates for zoysiagrass putting greens.
Repeat applications of plant growth regulators are often used to reduce clipping yield and
increase ball roll distances. Concerns when using PGRs are turfgrass quality, clipping
reduction, and possible rooting consequences. Repeat applications may also impact
‘Diamond’ zoysiagrass seedhead production.
Materials and Methods
An experiment was conducted from January 2019 to June 2019 at Clemson
University Greenhouse Complex in Clemson, SC. This study’s objectives were to
determine if PGRs repeatedly applied reduced seedhead production, turf quality (TQ),
normalized difference of vegetative index (NDVI), clipping weight and root mass.
‘Diamond’ zoysiagrass plugs 10.8 cm diameter and 15 cm depth were harvested
in October 2018 from the nursery green at Walker Golf Course at Clemson University,
which was originally constructed in June 2014 from sod over a converted creeping
bentgrass green with USGA soil mix originally constructed in 1995 (personal

54
communication with Don Garrett, 2018). Plugs were established in 15 cm diameter and
15 cm depth pots with USGA greens mix of 85 sand:15 peatmoss by volume (USGA,
2018). Plants were maintained with approximately 14 h photoperiod and a light intensity
of 500 µmol m-2 s-1, with day/night temperatures maintained near 28/19°C.
Due to no labeled use rates for zoysiagrass putting greens, use rates were derived
from alternative zoysiagrass species with higher mowing heights, ultradwarf
bermudagrass greens, and previous observational research (L.B. McCarty, personal
communication, 2018; Donald Garrett, personal communication, 2018). Treatments were
applied using an enclosed spray chamber (DeVries Manufacturing, Hollandale, MN) on a
4 wk interval beginning 2 January 2019 and included trinexapac-ethyl (TE),
paclobutrazol (PB), ethephon (EP), simazine (SI), flurprimidol (FL) and prohexadione
calcium (PC) (Table 21). All treatments also included a non-ionic surfactant (NIS)
(Harrell’s SprayMAX, Lakeland, FL) at 0.25% volume volume-1. Foliar fertilization
using Grigg Gary’s Green 18-3-4 (Brandt Consolidated Inc. Springfield, IL) at 4.9 g N m-
2 was also included in each application including untreated control plots. Pots were left to
dry for 4 h after treatment application to satisfy leaf and sheath absorbed PGRs, then
irrigated with 1.27 cm water to satisfy requirements for root absorbed PGRs. Pots were
not mown after 2 January 2019 for seedhead counting and clipping measurement
purposes. Pots were watered as needed to prevent wilting.

55
Table 21. Treatments and rates used in ‘Diamond’ zoysiagrass seedhead control and response to repeat applications of plant growth regulators study. Treatment a Standard Rate (lb a.i. acre-1) Metric Rate (g a.i. ha-1) Untreated – – TE (Primo Maxx 1MEC) 0.0366 41 PB (Trimmit 2SC) 0.0598 67 EP (Proxy 2L) 3.0816 3,454 SI (Princep 4L) 0.8922 1,000 PC (Anuew 27.5WP) 0.1035 116 FL (Cutless MEC 1.3L) 0.0834 93.5
a All treatments also included a NIS at a 0.25% volume volume-1 rate, and 4.9 g N m-2.
Statistical Design
Statistical design was randomized complete block with four blocks and two
repetitions. Data were subjected to an overall ANOVA (Tables 22 and 23) to determine
treatment effects across all rating dates and any treatment by rating date interactions.
Since treatment by rating date interactions were often significant, the rating data were
subjected to ANOVA at each rating date to assess treatment effects. Means were further
studied using Fisher’s protected LSD at a significance level of 0.05. Due to the variability
of soil data, root mass measurements were deemed significant below 0.1. Data were
analyzed using JMP Pro 14.1 software (SAS Institute Inc.; Cary, NC, USA).

56
Table 22. Analysis of variance (ANOVA) table of a randomized complete block design for turfgrass quality (TQ), normalized difference of vegetative index (NDVI) and seedhead count p-values from ‘Diamond’ zoysiagrass seedhead control and response to repeat applications of plant growth regulators study. Source of Variation dfa TQ NDVI Seedhead Count Treatment 6 * ** *** Block (Repetition) Error 3 NS NS NS Treatment x Block (Repetition) Error 18 * * NS Repetition 1 NS NS NS Treatment x Repetition 6 NS NS NS Date 4 * *** *** Treatment x Date 24 *** ** *** Error 217 Corrected Total 279 a Degrees of freedom * Significant at the 0.05 probability level. ** Significant at the 0.01 probability level. *** Significant at the 0.001 probability level. ‡ NS, nonsignificant at the 0.05 probability level. Table 23. Analysis of variance (ANOVA) table of a randomized complete block design for clipping weight and root mass p-values from ‘Diamond’ zoysiagrass seedhead control and response to repeat applications of plant growth regulators study. Source of Variation dfa Clipping Mass Root Mass Treatment 6 *** NS Block (Repetition) Error 3 NS NS Treatment x Block (Repetition) Error 18 NS *** Repetition 1 NS NS Treatment x Repetition 6 NS * Error 21 Corrected Total 55
a Degrees of freedom * Significant at the 0.05 probability level. *** Significant at the 0.001 probability level. ‡ NS, nonsignificant at the 0.05 probability level for Clipping Mass, and at the 0.1 probability level for Root Mass.
Measurements
All ratings were made at 4 wk intervals beginning 30 January 2019, or 4 weeks
after initial treatment (WAIT). TQ was rated on a 1 to 9 scale with 9 being dense dark
green grass and 1 being completely dead grass. TQ ratings below 7 were considered to be

57
unacceptable. NDVI were rated with a Field Scout TCM 500 NDVI Turf Color Meter
(Spectrum Technologies, Bridgend, United Kingdom). These values range from 0 – .999,
and NDVI is calculated using the formula
NDVI = R780 − R670R780 + R670
where R780 and R670 are designated as the measured reflectance of near-infrared
radiation (780 nm) and visible red radiation (670 nm) (Bremer et al. 2011; Trenholm et
al. 1999). Seedheads were counted per pot. These ratings concluded 20WAIT. Clipping
and root mass were collected 24WAIT. Clippings were removed with shears 3 mm above
soil surface. Clippings were oven dried at 60°C for 72 h and weighed. Roots were
harvested below the thatch layer, washed of soil, dried at 60°C for 72 h and weighed.
Results and Discussion
Turf Quality
For TQ a significant treatment by date effect occurred, p-value <0.0001,
warranting focus on individual dates. No treatment by repetition effect was observed so
results were combined.
All plots’ had TQ ratings of 7 at 0WAIT. TE steadily improved TQ with
improved density and color with TQ of 8 at 20WAIT (Table 24). This supports Atkinson
(2012) and Qian et al. (1998) who reported significant increases in TQ with TE
applications. PC improved color and density similar to TE, with TQ of 7.9 at 20WAIT.
FL also increased color and density, with a TQ of 7.8, but at 20WAIT had a decrease in
TQ to 7.4 due to slight phytotoxicity (Table 24). SI at 16WAIT was similar to TE, PC

58
and FL with TQ of 7.9, possessing a dark green color. However, by 20WAIT SI was
slightly decreased, 7.9 to 7.5, due to reduced density when compared to all other
treatments (Table 24). This illustrated SI had negligible growth regulation properties and
is supported in clipping mass (Table 27).
Due to severe phytotoxicity, PB at 8, 12, 16, and 20WAIT had TQ of 7.4, 6.8, 6.8
and 7.0 at these weeks, significantly less than TE, PC, FL, and SI (Table 24). Reductions
in TQ by FL at 20WAIT and PB at 8WAIT on could be due to longer suppression periods
reported by Kreuser et al. (2018), and repeat applications resulted in excessive regulation.
EP at 8 and 12WAIT had TQ of 6.5, significantly less than TE, PC, FL, and SI. At 16 and
20WAIT, EP had the lowest TQ of 5.6 and 5.5, respectively. This was due to yellowing
turfgrass color, reduced density and visibly widening of leaf blades (data not shown).
This supports Dernoeden (1984) and Diesburg and Christians (1989) who reported
increased internode length and widening of leaf blades from EP applications.
Applications of TE, PC, FL, and SI had increased TQ over untreated at all rating
dates besides 4WAIT (Table 24). These rates would be deemed safe for ‘Diamond’
zoysiagrass greens during peak season, but mowing factors need to be considered.
Increased TQ from SI applications contrasts results from chapter 2 field applications,
possibly due to more effective movement of chemistry off the leaves to the rootzone. PB
provided increased density, but lower rates and intervals should be used for ‘Diamond’
zoysiagrass. EP is not a suitable PGR for ‘Diamond’ zoysiagrass greens due to decreased
density, undesirable color and leaf blade widening.

59
Further research should investigate dose responses for desirable PGRs to
determine thresholds for intervals and rates. Studies should also be repeated in peak
growing season field settings with regular mowing.
Table 24. Turf quality response means of ‘Diamond’ zoysiagrass from 4 to 20 weeks after initial treatment (WIAT) from 30 January 2019 to 22 May 2019 in Clemson, South Carolina.
Treatment 4WAIT 8WAIT 12WAIT 16WAIT 20WAIT 1 – 9 Untreated 7.3bc 6.9b 6.8b 6.9b 6.8d TE 7.6ab 7.8a 7.8a 7.9a 8.0a PC 7.5abc 7.6a 7.6a 7.8a 7.9ab FL 7.9a 7.8a 7.6a 7.8a 7.4bc PB 7.4bc 6.8b 6.8b 7.0b 7.0cd EP 7.1c 6.5b 6.5b 5.6c 5.5e SI 7.4bc 7.8a 7.6a 7.9a 7.5abc LSD 0.5 0.7 0.6 0.5 0.5 Significance NS *** *** *** ***
† Within columns, means followed by the same letter are not significantly different according to LSD (0.05). *** Significant at the 0.001 probability level. ‡ NS, nonsignificant at the 0.05 probability level. § Turf quality rated from 1 – 9 where 9 = best turf and values < 7.0 are unacceptable.
Normalized Difference of Vegetative Index
NDVI had a significant treatment by date effect, p-value 0.0026, warranting focus
on individual dates. No treatment by repetition effect was observed so results were
combined.
An overall date effect across repetitions occurred as NDVI was increased at 4 and
8WAIT, but slowly declined to 20WAIT, similar to TQ (Table 25). At 16WAIT, SI
increased NDVI by 5% over untreated. At 20 WAIT, TE and EP had 6 and 3% reductions
from untreated. PC, FL and PB were statistically similar to untreated at all dates.

60
EP decreased both TQ and NDVI, illustrating a loose correlation between TQ and
NDVI. In contrast, TE increased TQ but reduced NDVI. SI increased TQ and NDVI.
Differences in density between treatments may have an effect on differences in NDVI.
Table 25. Normalized difference of vegetative index response means of ‘Diamond’ zoysiagrass over 20 weeks from 30 January 2019 to 22 May 2019 in Clemson, South Carolina.
Treatment 4WAIT 8WAIT 12WAIT 16WAIT 20WAIT 0 – 0.999 (best) Untreated 0.731ab 0.748ab 0.707abc 0.708b 0.719ab TE 0.736ab 0.737b 0.683c 0.701b 0.679c PC 0.733ab 0.735b 0.689bc 0.710ab 0.697bc FL 0.752a 0.759a 0.723ab 0.714ab 0.701bc PB 0.727b 0.760a 0.713abc 0.690b 0.695bc EP 0.717b 0.735b 0.714abc 0.684b 0.691c SI 0.729b 0.760a 0.741a 0.741a 0.739a LSD 0.021 0.021 0.038 0.032 0.027 Significance NS * NS * *
† Within columns, means followed by the same letter are not significantly different according to LSD (0.05). * Significant at the 0.05 probability level. ‡ NS, nonsignificant at the 0.05 probability level. § NDVI values ranged from 0 – 0.999, where 0.999 = best possible color.
Seedhead Count
Seedhead count had a significant treatment by date effect, p-value <0.0001,
warranting focus on individual dates. No treatment by repetition effect was observed so
results were combined.
At 12WAIT, EP had a 115% increase in seedhead count from untreated, and was
significantly greater than all treatments besides PC and FL (Table 26). At 16WAIT, SI
reduced count by 93% from untreated. At 16WAIT, EP increased count by 336% from
untreated. At 16WAIT, TE and PC decreased count by 46 and 43% from untreated,
61
respectively. At 20WAIT, SI decreased count by 63% from untreated. At 20WAIT, TE
had a 41% decrease from untreated, and was statistically similar to SI. At 20WAIT, PB
and EP increased count by 31 and 67% from untreated, respectively. FL and PC were
never significantly different from untreated.
Bunnell (2003) reported FL reduced seedhead production in perennial ryegrass
and Kentucky bluegrass, but these findings were not repeated on ‘Diamond’ zoysiagrass.
King et al. (2006) reported PB to decrease Lolium temulentum seedhead production, but
the present study did not have similar results on ‘Diamond’ zoysiagrass. Multiple studies
of EP applications to annual bluegrass provided seedhead reductions (Gelernter and
Stowell, 2001; Haguewood et al., 2013; Kane and Miller; 2003; McCullough and Sidhu,
2014), but these results were not repeated in this study with ‘Diamond’ zoysiagrass. TE
reductions in seedhead count were inconsistent with results from Chapter 2, possibly due
to repeat applications. Qian et al. (1998) noted TE visually increased seedhead production
in ‘Diamond’ zoysiagrass. No previous reports have observed TE or SI providing
seedhead control on ‘Diamond’ zoysiagrass.
Further research should investigate effectiveness of TE and PC repeat applications
to reduce seedhead production in field settings. Research should also investigate similar
herbicides to SI to reduce seedhead production to prevent herbicide resistance by weeds.
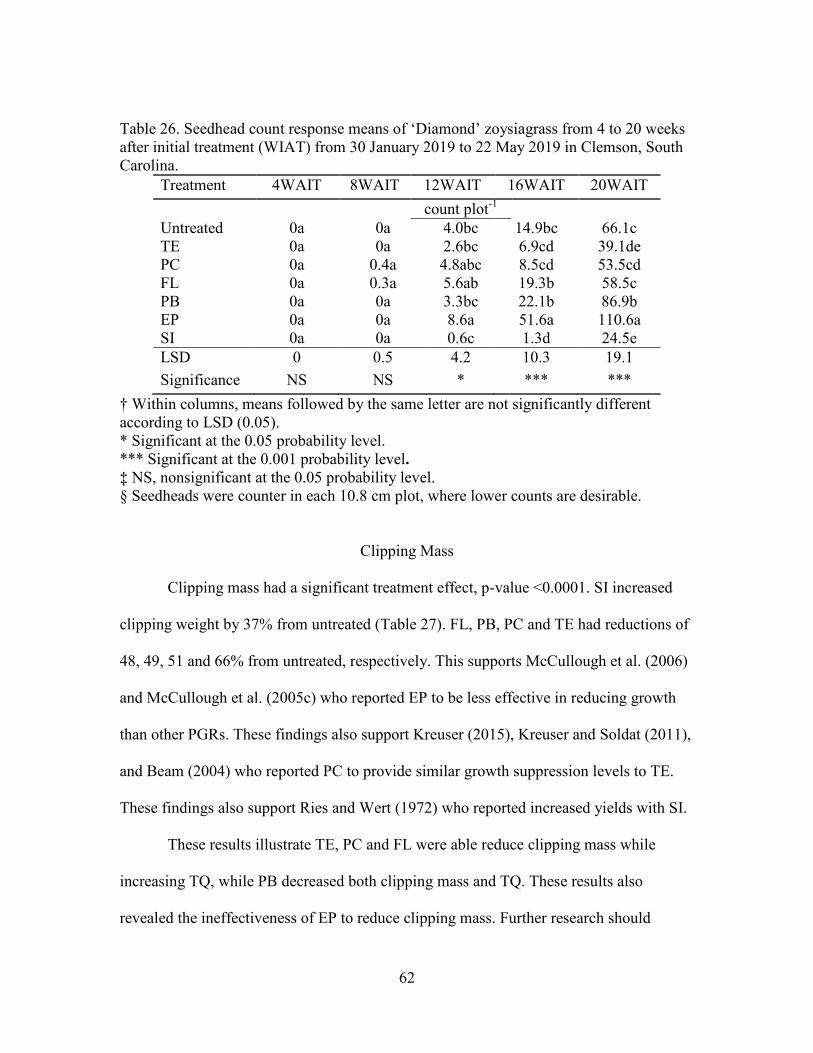
62
Table 26. Seedhead count response means of ‘Diamond’ zoysiagrass from 4 to 20 weeks after initial treatment (WIAT) from 30 January 2019 to 22 May 2019 in Clemson, South Carolina.
Treatment 4WAIT 8WAIT 12WAIT 16WAIT 20WAIT count plot-1 Untreated 0a 0a 4.0bc 14.9bc 66.1c TE 0a 0a 2.6bc 6.9cd 39.1de PC 0a 0.4a 4.8abc 8.5cd 53.5cd FL 0a 0.3a 5.6ab 19.3b 58.5c PB 0a 0a 3.3bc 22.1b 86.9b EP 0a 0a 8.6a 51.6a 110.6a SI 0a 0a 0.6c 1.3d 24.5e LSD 0 0.5 4.2 10.3 19.1 Significance NS NS * *** ***
† Within columns, means followed by the same letter are not significantly different according to LSD (0.05). * Significant at the 0.05 probability level. *** Significant at the 0.001 probability level. ‡ NS, nonsignificant at the 0.05 probability level. § Seedheads were counter in each 10.8 cm plot, where lower counts are desirable.
Clipping Mass
Clipping mass had a significant treatment effect, p-value <0.0001. SI increased
clipping weight by 37% from untreated (Table 27). FL, PB, PC and TE had reductions of
48, 49, 51 and 66% from untreated, respectively. This supports McCullough et al. (2006)
and McCullough et al. (2005c) who reported EP to be less effective in reducing growth
than other PGRs. These findings also support Kreuser (2015), Kreuser and Soldat (2011),
and Beam (2004) who reported PC to provide similar growth suppression levels to TE.
These findings also support Ries and Wert (1972) who reported increased yields with SI.
These results illustrate TE, PC and FL were able reduce clipping mass while
increasing TQ, while PB decreased both clipping mass and TQ. These results also
revealed the ineffectiveness of EP to reduce clipping mass. Further research should

63
investigate a GDD model for Z. matrella putting greens similar to Reasor et al. (2018)
and Kreuser et al. (2018) using TE and PC.
Table 27. Clipping mass response means of ‘Diamond’ zoysiagrass from 24 weeks after initial treatment (WIAT) from 19 June 2019 in Clemson, South Carolina.
Treatment 24WAIT g plot-1 Untreated 2.94b TE 0.99c PC 1.43c FL 1.54c PB 1.49c EP 2.78b SI 4.03a LSD 0.69 Significance ***
† Within columns, means followed by the same letter are not significantly different according to LSD (0.05). *** Significant at the 0.001 probability level. ‡ NS, nonsignificant at the 0.05 probability level. § Root mass was determined via loss by ignition of roots removed below thatch, where higher weights are desirable.
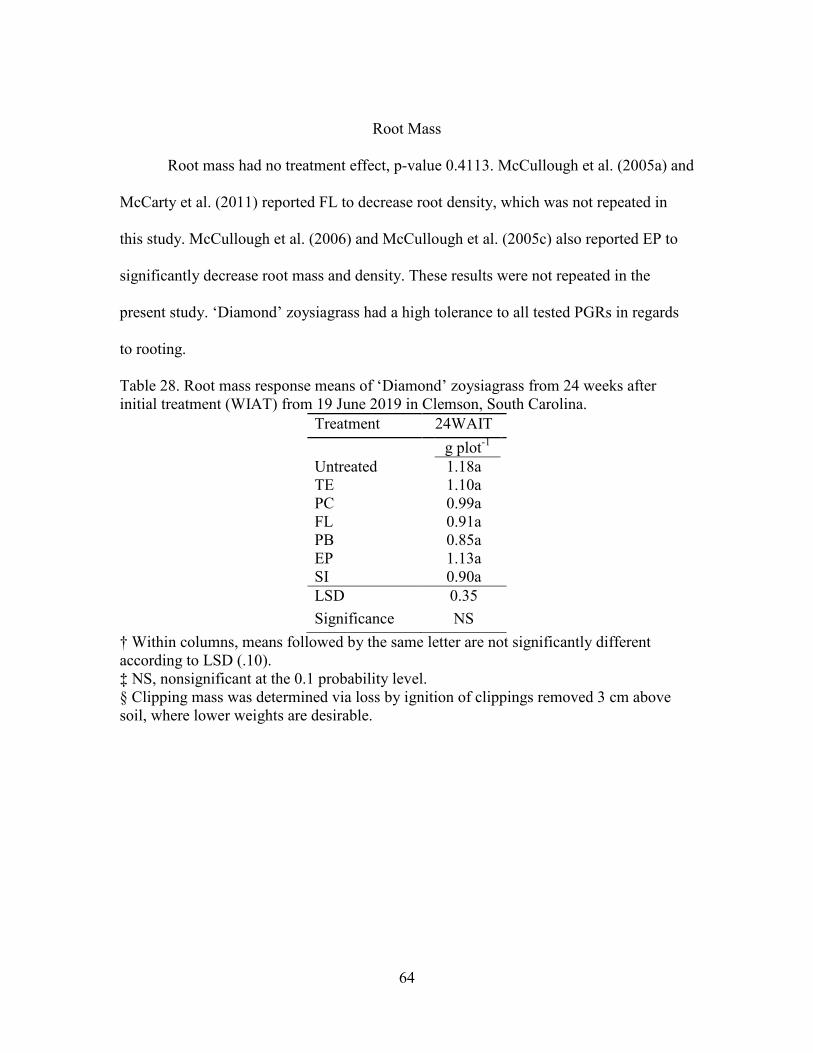
64
Root Mass
Root mass had no treatment effect, p-value 0.4113. McCullough et al. (2005a) and
McCarty et al. (2011) reported FL to decrease root density, which was not repeated in
this study. McCullough et al. (2006) and McCullough et al. (2005c) also reported EP to
significantly decrease root mass and density. These results were not repeated in the
present study. ‘Diamond’ zoysiagrass had a high tolerance to all tested PGRs in regards
to rooting.
Table 28. Root mass response means of ‘Diamond’ zoysiagrass from 24 weeks after initial treatment (WIAT) from 19 June 2019 in Clemson, South Carolina.
Treatment 24WAIT g plot-1 Untreated 1.18a TE 1.10a PC 0.99a FL 0.91a PB 0.85a EP 1.13a SI 0.90a LSD 0.35 Significance NS
† Within columns, means followed by the same letter are not significantly different according to LSD (.10). ‡ NS, nonsignificant at the 0.1 probability level. § Clipping mass was determined via loss by ignition of clippings removed 3 cm above soil, where lower weights are desirable.

65
CHAPTER FOUR
‘DIAMOND’ ZOYSIAGRASS (Zoysia matrella (L.) Merr.) LATERAL RECOVERY USING REPEAT APPLICATIONS OF PLANT GROWTH REGULATORS
Introduction
‘Diamond’ zoysiagrass (Zoysia matrella (L.) Merr) has proven to be extremely
slow to recover from lateral growth (Sladek et al., 2009). This is an undesirable trait for
turfgrasses, as cultural practices and traffic damage will take longer to recover from
surface damage such as ball marks, environmental stresses or traffic. ‘Diamond’
zoysiagrass putting greens should be core aerified at minimum once season-1 to reduce
thatch development (McCarty, 2018). Lateral recovery from aerification is a nuisance to
turfgrass managers and golfers, and factors in recovery time may include plant growth
regulators (PGRs).
Materials and Methods
A study was conducted from January 2019 to October 2019 at Clemson
University Greenhouse Complex in Clemson, SC with the objective to determine if PGRs
applied repeatedly reduced lateral growth. ‘Diamond’ zoysiagrass plugs 10.8 cm diameter
and 15 cm depth were harvested in October 2018 from a nursery green at Walker Golf
Course, which was originally constructed in June 2014 from sod over a converted
creeping bentgrass green with USGA soil mix originally constructed in 1995 (personal
communication with Don Garrett, 2018). Plugs were established in 15 cm diameter and
15 cm depth pots with USGA greens mix of 85 sand:15 peatmoss by volume (USGA,

66
2018). Plants were maintained with 14 h photoperiod and a light intensity of 500 µmol m-
2 s-1, with day/night temperatures maintained near 28/19°C.
A 3.75 cm diameter and 5 cm depth core was removed from each plug and filled
with USGA greens mix on 2 January 2019 (USGA, 2018). Treatments were applied using
an enclosed spray chamber (DeVries Manufacturing, Hollandale, MN) on a 4 wk interval
beginning 2 January 2019 and included trinexapac-ethyl (TE), paclobutrazol (PB),
ethephon (EP), simazine (SI), flurprimidol (FL) and prohexadione calcium (PC) (Table
29). All treatments also included a non-ionic surfactant (NIS) (Harrell’s SprayMAX,
Lakeland, FL) at a 0.25% volume volume-1 rate. Foliar fertilization using Grigg Gary’s
Green 18-3-4 (Brandt Consolidated Inc. Springfield, IL) at 4.9 g N m-2 was also included
in each application including untreated control plots. Pots were left to dry for 4 h after
treatment application to satisfy leaf and sheath absorbed PGRs, then irrigated with 1.27
cm water to satisfy requirements for root absorbed PGRs. Pots were mowed weekly at 5
mm using shears and watered as needed to prevent wilt.
Table 29. Treatments and rates used in ‘Diamond’ zoysiagrass lateral recovery using repeat applications of plant growth regulators study. Treatmenta Standard Rate (lb a.i. acre-1) Metric Rate (g a.i. ha-1) Untreated – – TE (Primo Maxx 1MEC) 0.0366 41 PB (Trimmit 2SC) 0.0598 67 EP (Proxy 2L) 3.0816 3,454 SI (Princep 4L) 0.8922 1,000 PC (Anuew 27.5WP) 0.1035 116 FL (Cutless MEC 1.3L) 0.0834 93.5
a All treatments also included a NIS at a 0.25% volume volume-1 rate, and liquid fertilizer at 4.9 g N m-2.

67
Statistical Design
Statistical design was a randomized complete block with two repetitions and four
blocks and repeated observations at different rating dates. Data were subjected to an
overall ANOVA (Table 30) to determine treatment effects across all rating dates and any
treatment by rating date interactions. Since treatment by rating date interactions were
significant, rating data were subjected to ANOVA at each rating date to assess treatment
effects. All measurements besides root mass were further studied using Fisher’s protected
LSD at a significance level of 0.05. Data were analyzed using JMP Pro 14.1 software
(SAS Institute Inc.; Cary, NC, USA).
Table 30. Analysis of variance (ANOVA) table of a randomized complete block design for lateral recovery means of ‘Diamond’ zoysiagrass lateral recovery using repeat applications of plant growth regulators study.
Source of Variation dfa Lateral Recovery Rate Treatment 6 *** Block (Repetition) Error 3 ** Treatment x Block (Repetition) Error 18 *** Repetition 1 NS Treatment x Repetition 6 NS Date 9 *** Treatment x Date 54 *** Error 441 Corrected Total 538
a Degrees of freedom ** Significant at the 0.01 probability level. *** Significant at the 0.001 probability level. ‡ NS, nonsignificant at the 0.05 probability level.

68
Measurements
Lateral recovery was rated by percent lateral recovery every 4 wk beginning 30
January 2019 using a grid intersect count from a circular wire grid 3.81 cm diameter and
210 countable squares. Percent lateral recovery was determined using the formula
% 𝐿𝐿𝑀𝑀𝐿𝐿𝑇𝑇𝐿𝐿𝑀𝑀𝐿𝐿 𝑅𝑅𝑇𝑇𝑅𝑅𝑅𝑅𝑅𝑅𝑇𝑇𝐿𝐿𝑅𝑅 = ′ℎ𝑀𝑀𝐿𝐿𝑖𝑖′ 𝑇𝑇𝑇𝑇𝐿𝐿 𝑇𝑇𝐿𝐿𝑅𝑅𝐿𝐿 ÷ 210
where when green leaf tissue is present in a square it is counted a ‘hit’ and sand is not
(Atkinson, 2010).
Results and Discussion
Lateral Recovery
Lateral recovery had significant date by treatment effect, p-value <0.0001,
warranting focus on individual dates. No repetition effect was detected, so data were
combined. Lateral recovery from initial treatment to 4WAIT was more rapid than any 4
wk period during this study, all treatments having recovered at least 40% by this date
(Table 31). This is due to leaves utilizing horizontal growth to capture light more
efficiently, and subsequently intersecting outermost grid squares. However, stolons and
rhizomes were slower to develop and fully recover in all treatments, illustrated by first
treatments to reach 95% recovery taking 16WAIT and 100% recovery taking 24WAIT.
At 16WAIT, EP was the first treatment to reach 95% recovery (Table 31). This
supports McCullough et al. (2005c) who reported EP was not effective in suppressing
growth. At 20WAIT, untreated and SI reached 95% recovery. This supports Fry et al.
(1986) who reported SI increased tillering. At 24WAIT, PB reached 95% recovery, the
most rapid lateral recovery rate of gibberellic acid inhibiting compounds. At 28WAIT,
69
PC, TE and FL reached 95% recovery. At 16 and 20WAIT, PC and TE were significantly
more recovered than FL, and at 24WAIT, PC was significantly more recovered than FL.
These findings support multiple studies that found gibberellic acid inhibiting PGRs
decreased internode length and growth rates.
This study displayed an undesirable trait of ‘Diamond’ zoysiagrass. Low nitrogen
rates likely exacerbated slow recovery time, but gibberellic acid inhibiting compounds,
FL, PB, PC, and TE, all significantly slowed lateral recovery time from untreated at
multiple dates. These results suggest field managers cease using class A and B PGR
during core aerification or recovery situations. Future research should investigate if
nitrogen fertility and biostimulants hasten lateral recovery.

70
Table 31. Percentage lateral recovery response means of ‘Diamond’ zoysiagrass from 4 to 40 weeks after initial treatment (WIAT) from 30 January 2019 to 9 October 2019 in Clemson, South Carolina.
WAIT Treatment 4 8 12 16 20 24 28 32 36 40 0 – 100% Lateral Recovery Untreated 48.7a 58.2ab 82.0a 91.6a 97.0a 98.8ab 100a 100a 100a 100a TE 41.7bc 49.2c 67.6c 77.3b 85.2c 88.3de 95.4c 97.7c 99.2b 100a PC 40.1c 48.8c 68.2c 80.0b 86.9bc 92.0cd 96.8bc 98.3bc 99.3b 100a FL 47.4ab 54.4bc 65.1c 71.8c 80.5d 87.0e 95.2c 98.4bc 99.6ab 100a PB 48.5ab 58.9ab 74.3b 80.5b 91.4b 94.7bc 98.5ab 99.3ab 100a 100a EP 47.7ab 61.5a 84.0a 96.0a 99.8a 100a 100a 100a 100a 100a SI 49.7a 63.9a 84.5a 91.6a 98.2a 99.6a 100a 100a 100a 100a LSD 6.9 7.0 6.1 5.0 4.5 4.4 1.9 1.3 0.6 0 Significance * *** *** *** *** *** *** ** * NS
† Within columns, means followed by the same letter are not significantly different according to LSD (0.05). * Significant at the 0.05 probability level. ** Significant at the 0.01 probability level. *** Significant at the 0.001 probability level. ‡ NS, nonsignificant at the 0.05 probability level. § Percent lateral recovery was determined by counting grid intersections, and higher values are desirable.
70

71
CONCLUSION
‘Diamond’ zoysiagrass has many attractive qualities for turfgrass managers
looking for an alternative to ultradwarf bermudagrass or creeping bentgrass putting
greens. High shade tolerance compared to bermudagrass and greater heat and disease
tolerance compared to bentgrass can reduce inputs required to maintain acceptable turf
quality. However, ‘Diamond’ zoysiagrass cannot provide exceptional putting distances,
but smoothness of roll can be compromised by seedhead presence (data not shown).
Treating ‘Diamond’ zoysiagrass with SI can provide effective and nearly season-
long control, proven by success in both greenhouse and field trials. Treating with EP and
PB resulted in increased seedhead production in greenhouse trials but was not replicated
in the field. No treatment improved TQ or NDVI over untreated in the field, but
greenhouse results had significant improvements in density with TE, PC, FL and PB
applications. These results warrant research into regular applications in field settings,
especially during summer months. Lateral recovery was decreased from treatment with
TE, PC, FL and PB. These results support ceasing PGR use during aerification to reduce
lateral recovery time.
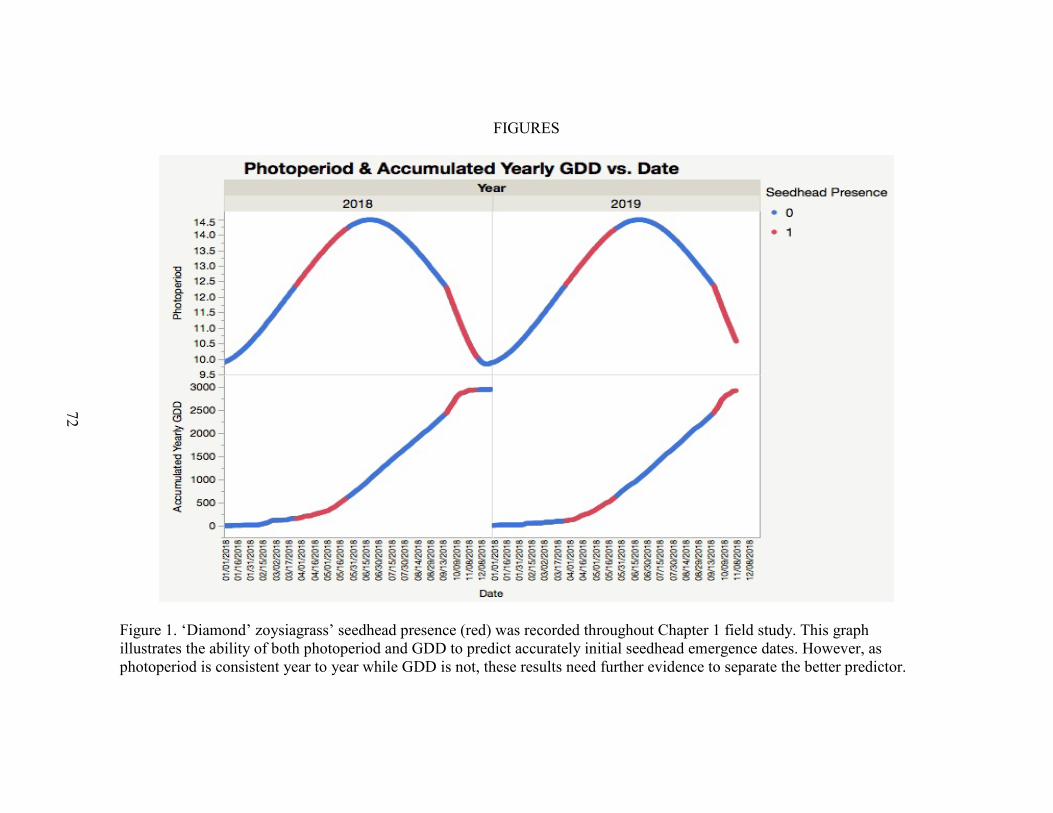
72
FIGURES
Figure 1. ‘Diamond’ zoysiagrass’ seedhead presence (red) was recorded throughout Chapter 1 field study. This graph illustrates the ability of both photoperiod and GDD to predict accurately initial seedhead emergence dates. However, as photoperiod is consistent year to year while GDD is not, these results need further evidence to separate the better predictor.
72

73
Figure 2. During fall seasons severe seedhead pressure on ‘Diamond’ zoysiagrass putting greens may impact quality of cut or ball roll smoothness and distances. This area had not been mowed in 2 weeks to observe ‘Diamond’ zoysiagrass at collar height. This reduction in mowing allowed seedheads to flourish and mature, showing mowing is a cultural practice somewhat sufficient in reducing seedhead pressure..
73

74
Figure 3. ‘Diamond’ zoysiagrass’ seedhead presence impacts ball roll smoothness and distance. These seedheads typically protrude from the canopy, creating inconsistencies in height and texture that a seedhead-free surface would lack.
74

75
Figure 4. Initial seedhead emergence in ‘Diamond’ zoysiagrass results young light colored seedheads, while mature seedheads are a purple-red color
75

76
Figure 5. On 4 November 2019 (56DAT) treatments containing simazine (dark green) compared to all other treatments with abundant light colored seedheads. Seedhead control for this duration is very unusual and desirable for turfgrass managers.
76

77
Figure 6. A seedhead count untreated control sample from 4 November 2019 (56DAT).
77

78
Figure 7. Ethephon treated ‘Diamond’ zoysiagrass (left) compared to untreated (right) after 4 sequential treatments from Chapter 3. Ethephon treatments caused increased seedhead production, visibly wider leaf blades, and undesirable color.
78
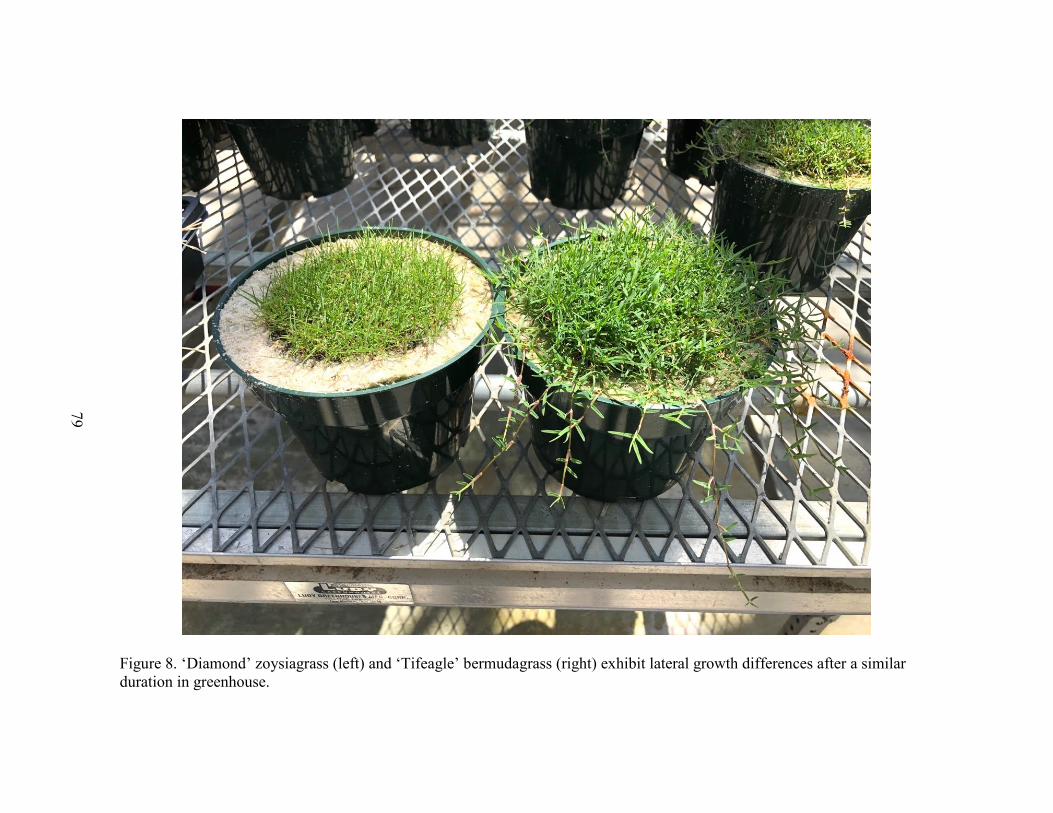
79
Figure 8. ‘Diamond’ zoysiagrass (left) and ‘Tifeagle’ bermudagrass (right) exhibit lateral growth differences after a similar duration in greenhouse.
79

80
REFERENCES
Anderson, J.A., C.M. Taliaferro, and D.L. Martin. 2002. Freeze tolerance of bermudagrasses. Crop Sci. 42:975-977. Anonymous, 2018a. Anuew plant growth regulator product label. Nufarm, Alsip, IL. Anonymous, 2018b. Cutless MEC plant growth regulator product label. SePro, Carmel, IN. Anonymous, 2018c. Proxy plant growth regulator product label. Bayer, Research Triangle Park, NC. Anonymous, 2015. Primo Maxx plant growth regulator product label. Syngenta, Greensboro, NC. Anonymous, 2014. Princep Liquid herbicide product label. Syngenta, Greensboro, NC. Anonymous, 2013. Trimmit 2SC plant growth regulator product label. Syngenta, Greensboro, NC. Askew, S.D. 2017. Plant growth regulators applied in winter improve annual bluegrass (poa annua) seedhead suppression on golf greens. Weed Technol. 31:701-713. Atkinson, J. 2010. Response of warm season turfgrasses to reduced light environments. MS diss., Clemson Univ., Clemson, SC. Atkinson, J.L., L.B. McCarty, H. Liu, J. Faust, and J.E. Toler. 2012. ‘Diamond’ zoysiagrass golf green response to reduced light environments with the use of trinexapac-ethyl. Agron. J. 104:847-852. Baker, E.W., T. Kono, and N.R. O'Neill. 1986. Eriophyes zoysiae (acari: Eriophyidae), a new species of eriophyid mite on zoysiagrass. Int. J. Acarol. 12:3-6. Beam, J.B. 2004. Prohexadione calcium for turfgrass management and poa annua control and molecular assessment of the acetolactate synthase gene in poa annua. Ph.D. diss., Virginia Polytechnic Institute and State University, Blacksburg, VA.

81
Beam, J.B., and S.D. Askew. 2007. Fate of prohexadione calcium in annual bluegrass (poa annua) and three turfgrasses. Weed Sci. 55:541-545. Beasley, J.S., and B.E. Branham. 2007. Trinexapac-ethyl and paclobutrazol affect kentucky bluegrass single-leaf carbon exchange rates and plant growth. Crop Sci. 47:132-138. Beasley, J.S., B.E. Branham, and L.M. Ortiz-Ribbing. 2005. Trinexapac-ethyl affects kentucky bluegrass root architecture. HortScience 40:1539-1542. Bigelow, C.A., G.A. Hardebeck, and B.T. Bunnell. 2007. Monthly flurprimidol applications reduce annual bluegrass populations in a creeping bentgrass fairway. App. Turfgrass Sci. doi:10.1094/ATS-2007-0508-02-RS Bommert, P., and C. Whipple. 2017. Grass inflorescence architecture and meristem determinacy. Seminars in cell & developmental biology 79:37-47. Braman, S.K., R.R. Duncan, W.W. Hanna, and W.G. Hudson. 2000. Evaluation of turfgrasses for resistance to mole crickets (orthoptera: Gryllotalpidae). HortScience 35:665-668. Bremer, D.J., H. Lee, K. Su, and S.J. Keeley. 2010. Relationships between normalized
degree of vegetative index and visual quality in cool-season turfgrass: II Factors affecting NDVI and its component reflectance. Crop Sci. 51:2219-2227.
Briscoe, K., G. Miller, S. Brinton, D. Bowman, and C. Peacock. 2012. Evaluation of ‘Miniverde’ bermudagrass and ‘Diamond’ zoysiagrass putting green establishment using granular fertilizer applications. HortScience 47:943-947. Brosnan, J.T., G.K. Breeden, M.T. Elmore, A.J. Patton, and D.V. Weisenberger. 2012. Zoysiagrass seedhead suppression with imidazolinone herbicides. Weed Technol. 26:708-713. Bunnell, B. T. 2003. Summary of Cutless 50WP turfgrass growth regulator research on creeping bentgrass and perennial ryegrass/Kentucky bluegrass fairways. SePRO Corp. Web page: www.SePRO.com/documents/cutlessbunnell.pdf. Bunnell, B.T., L.B. McCarty, and W.C. Bridges Jr. 2005. Evaluation of three bermudagrass cultivars and meyer japanese zoysiagrass grown in shade. Int. Turfgrass Soc. Res. Jour. 10:826-833.

82
Calhoun, R.N. 2010. Growing degree-days as a method to characterize germination, flower pattern, and chemical flower suppression of a mature annual bluegrass (poa annua var reptans (hauskins) timm) fairway in michigan. Ph.D. diss., Michigan State University, East Lansing, MI. Carrow, R.N. 1995. Drought resistance aspects of turfgrasses in the southeast: Evapotranspiration and crop coefficients. Crop Sci. 35:1685-1690. Chandra, A., S. Milla-Lewis, and Q. Yu. 2017. An overview of molecular advances in zoysiagrass. Crop Sci. 57:81. Cobb, A.H., and J.P. Reade. 2011. Herbicides and plant physiology. John Wiley & Sons, Chichester, UK. Daniels, J., and Z. Nicoludis. 2019. The Ins and Outs of Zoysiagrass Fairway Management. U.S. Golf Assoc. Green Sec. Rec. 57:1-6. Davies, P.J. 2010. The plant hormones: Their nature, occurrence, and functions. p. 1-15. The plant hormones: Their nature, occurrence, and functions. Plant hormones. Springer, New York, NY. Dernoeden, P.H. 1984. Four-year response of a kentucky bluegrass-red fescue turf to plant growth retardants. Agron. J. 76:807-813. Diesburg, K.L., and N.E. Christians. 1989. Seasonal application of ethephon, flurprimidol, mefluidide, paclobutrazol, and amidochlor as they affect kentucky bluegrass shoot morphogenesiscky. Crop Sci. 29:841-847. Doroh, M.C., and J.S. McElroy. 2010. Evaluation of various cultural practices on zoysiagrass competitiveness with bermudagrass. App. Turfgrass Sci. 7:0. Dunn, J.H., and C.J. Nelson. 1974. Chemical changes occurring in three bermudagrass turf cultivars in relation to cold hardiness. Agron. J. 66:28-31. Dunn, J.H., S.S. Bughrara, M.R. Warmund, and B.F. Fresenburg. 1999. Low temperature tolerance of zoysiagrasses. HortScience 34:96-99.

83
Dunn, J.H., D.D. Minner, B.F. Fresenburg, S.S. Bughrara, and C.H. Hohnstrater. 1995. Influence of core aerification, topdressing, and nitrogen on mat, roots, and quality of ‘Meyer’ zoysiagrass. Agron. J. 87:891-894. Dunn, J.H., K.M. Sheffer, and P.M. Halisky. 1981. Thatch and quality of meyer zoysia in relation to management. Agron. J. 73:949-952. Engelke, M. C. 1998. U.S. Patent Application No. 08/851,979. Engelke, M.C., P.F. Colbaugh, J.A. Reinert, K.B. Marcum, R.H. White, B. Ruemmele, and S.J. Anderson. 2002. Registration of ‘Diamond’ zoysiagrass. Crop Sci. 42:304-305. Ervin, E.H., and C. Ok. 2001. Influence of plant growth regulators on suppression and quality of ‘Meyer’ zoysiagrass. J. Environ. Horticulture 19:57-60. Ervin, E.H., C.H. Ok, B.S. Fresenburg, and J.H. Dunn. 2002. Trinexapac-ethyl restricts shoot growth and prolongs stand density of 'Meyer' zoysiagrass fairway under shade. HortScience 37:502-505. Evans, J.R., R.R. Evans, C.L. Regusci, and W. Rademacher. 1999. Mode of action, metabolism, and uptake of BAS 125W, prohexadione-calcium. HortScience 34:1200-1201. Fagerness, M.J., and F.H. Yelverton. 2000. Tissue production and quality of ‘Tifway’ bermudagrass as affected by seasonal application patterns of trinexapac-ethyl. Crop Sci. 40:493-497. Fagerness, M.J., and D. Penner. 1998a. Evaluation of V-10029 and trinexapac-ethyl for annual bluegrass seedhead suppression and growth regulation of five cool-season turfgrass species. Weed Technol. 12:436-440. Fagerness, M.J., and D. Penner. 1998b. 14C-trinexapac-ethyl absorption and translocation in kentucky bluegrass. Crop Sci. 38:1023-1027. Fagerness, M.J., and F.H. Yelverton. 2001. Plant growth regulator and mowing height effects on seasonal root growth of penncross creeping bentgrass. Crop Sci. 41:1901-1905.
84
Fagerness, M.J., F.H. Yelverton, D.P. Livingston, and T.W. Rufty. 2002. Temperature and trinexapac-ethyl effects on bermudagrass growth, dormancy, and freezing tolerance. Crop Sci. 42:853-858. Ferguson, M.H. 1965. After five years: The green section specifications for a putting green. U.S. Golf Assoc. Green Sec. Rec. 3:1-7. Forbes, I. 1952. Chromosome numbers and hybrids in zoysia. Agron. J. 44:194-199. Fry, J.D., and P.H. Dernoeden. 1987. Growth of zoysiagrass from vegetative plugs in response to fertilizers. Journal of the American Society for Horticultural Science (USA). Fry, J.D., and R.A. Cloyd. 2011. Zoysiagrass genotypes differ in susceptibility to the bluegrass billbug, sphenophorus parvulus. HortScience 46:1314-1316. Fry, J.D., A. Chandra, D. Genovesi, K. Morris, and M. Xiang. 2017. Winter injury of fine-textured interspecific zoysia hybrids in the upper transition zone of the USA. International Turfgrass Society Research Journal 13:601-603. Fry, J.D., P.H. Dernoeden, and J.J. Murray. 1986. Establishment and rooting of zoysiagrass (zoysia japonica) as affected by preemergence herbicides. Weed Sci. 34:413-418. Fuentealba, M. P., J. Zhang, K.E. Kenworthy, J.E. Erickson, J. Kruse, and L.E. Trenholm. 2015. Root development and profile characteristics of bermudagrass and zoysiagrass. HortScience 50:1429-1434. Gelernter, W., and L.J. Stowell. 2001. Advances in poa seedhead management. Golf Course Management 69:49-53. Gelernter, W.D., L.J. Stowell, M.E. Johnson, C.D. Brown, and J.F. Beditz. 2015. Documenting trends in water use and conservation practices on US golf courses. Crop, Forage & Turfgrass Management 1:1-10. Goatley, J.M., V.L. Maddox, D.L. Lang, R.E. Elmore, and B.R. Stewart. 2005. Temporary covers maintain fall bermudagrass quality, enhance spring greenup, and increase stem carbohydrate levels. HortScience 40:227-231.
85
Green, D.E., J.D. Fry, J.C. Pair, and N.A. Tisserat. 1994. Influence of management practices on rhizoctonia large patch disease in zoysiagrass. HortScience 29:186- 188. Haguewood, J.B., E. Song, R.J. Smeda, J.Q. Moss, and X. Xiong. 2013. Suppression of annual bluegrass seedheads with mefluidide, ethephon, and ethephon plus trinexapac-ethyl on creeping bentgrass greens. Agron. J. 105:1832-1838. Hartwiger, C.E., C.H. Peacock, J.M. DiPaola, and D.K. Cassel. 2001. Impact of light- weight rolling on putting green performance. Crop Sci. 41:1179-1184. Hinton, J. D., D. P. Livingston, G.L. Miller, C.H. Peacock, and T. Tuong. 2012. Freeze tolerance of nine zoysiagrass cultivars using natural cold acclimation and freeze chambers. HortScience 47:112-115. Holmes, J. 1967. Putting green construction. U.S. Golf Assoc. Green Sec. Rec. 4:13-15. Howieson, M.J., and N.E. Christians. 2006. Mower sharpness and creeping bentgrass quality of cut. Iowa State University Research Farms Progress Reports 1026. Huang, B., R.R. Duncan, and R.N. Carrow. 1997. Drought-resistance mechanisms of seven warm-season turfgrasses under surface soil drying: II. root aspects. Crop Sci. 37:1863-1869. Hummel, N.W. 1993. Rationale for the revisions of the USGA green construction specifications. U.S. Golf Assoc. Green Sec. Rec. 31:7-21. Hutto, K.C., G.E. Coats, and J.M. Taylor. 2004. Annual bluegrass (poa annua) resistance to simazine in mississippi. Weed Technol. 18:846-849. Jiang, H. and J. Fry. 1998. Drought responses of perennial ryegrass treated with plant growth regulators. HortScience 33:270-273. Johnson, B.J. 1974. Herbicide influence on rate of establishment of warm-season turfgrasses. Proceedings of the Second International Turfgrass Research Conference, 1974. p. 365-371.

86
Johnson, B.J. 1990. Response of bermudagrass (cynodon spp.) cultivars to multiple plant growth regulator treatments. Weed Technol. 4:549-554. Johnson, B.J., and T.R. Murphy. 1995. Effect of paclobutrazol and flurprimidol on suppression of poa annua spp. reptans in creeping bentgrass (agrostis stolonifera) greens. Weed Technol. 9:182-186. Johnson, B.J., and T.R. Murphy. 1996. Suppression of a perennial subspecies of annual bluegrass (poa annua spp. reptans) in a creeping bentgrass (agrostis stolonifera) green with plant growth regulators. Weed Technol. 10:705-709. Johnson, P.G., and D.B. White. 1997. Flowering responses of selected annual bluegrass genotypes under different photoperiod and cold treatments. Crop Sci. 37:1543- 1547. Kane, R., and L. Miller. 2003. Field testing plant growth regulators and wetting agents for annual bluegrass seedhead suppression. U.S. Golf Assoc. Green Sec. Rec. 31:21-26. Karcher, D.E., M.D. Richardson, J.W. Landreth, and J.H. McCalla. 2005. Recovery of zoysiagrass varieties from divot injury. Applied Turfgrass Science. doi:10.1094/ATS-2005-0728-01-RS Kelly, S.T., G.E. Coats, and D.S. Luthe. 1999. Mode of resistance of triazine-resistant annual bluegrass (poa annua). Weed Technol. 13:747-752. Kimball, J.A., M. Zuleta, K.E. Kenworthy, V.G. Lehman, K.R. Harris-Shultz, and S. Milla-Lewis. 2013. Genetic relationships in zoysia species and the identification of putative interspecific hybrids using simple sequence repeat markers and inflorescence traits. Crop Sci. 53:285-295. King, R.W., T. Moritz, L.T. Evans, J. Martin, C.H. Andersen, C. Blundell, I. Kardailsky, and P.M. Chandler. 2006. Regulation of flowering in the long-day grass lolium temulentum by gibberellins and the flowering locus T gene. Plant Physiol. 141:498-507. Kreuser, W.C. 2015. Effective use of plant growth regulators on golf putting greens. U.S. Golf Assoc. Green Sec. Rec. 53:1-10.

87
Kreuser, W.C., and D.J. Soldat. 2011. A growing degree day model to schedule trinexapac-ethyl applications on agrostis stolonifera golf putting greens. Crop Sci. 51:2228-2236. Kreuser, W. C., and D. J. Soldat. 2012. Frequent Trinexapac-ethyl Applications Reduce Nitrogen Requirements of Creeping Bentgrass Golf Putting Greens. Crop Sci. 52:1348-1357. Kreuser, W.C., G.R. Obear, D.J. Michael, and D.J. Soldat. 2018. Growing degree-day models predict the performance of paclobutrazol on bentgrass golf putting greens. Crop Sci. 58:1402-1408. Kreuser, W.C., J.R. Young, and M.D. Richardson. 2017. Modeling performance of plant growth regulators. Agricultural & Environmental Letters 2:170001. Lowe, T., and J. Foy. 2012. Off-types in ultradwarf putting greens. U.S. Golf Assoc. Green Sec. Rec. 50:1-5. Lulli, F., L. Guglielminetti, N. Grossi, R. Armeni, S. Stefanini, and M. Volterrani. 2011. Physiological and morphological factors influencing leaf, rhizome and stolon tensile strength in C4 turfgrass species. Functional Plant Biology 38:919-926. Marcum, K.B., S.J. Anderson, and M.C. Engelke. 1998. Salt gland ion secretion: A salinity tolerance mechanism among five zoysiagrass species. Crop Sci. 38:806- 810. Marcum, K.B., M.C. Engelke, S.J. Morton, and R.H. White. 1995. Rooting characteristics and associated drought resistance of zoysiagrasses. Agron. J. 87:534-538. McCarty, L.B. 2018. Golf Turf Management. CRC Press, Boca Raton, FL. McCarty, L.B., T.G. Willis, J.E. Toler, and T. Whitwell. 2011. ‘TifEagle’ bermudagrass response to plant growth regulators and mowing height. Agron. J. 103:988-994. McCullough, P.E., and S.S. Sidhu. 2014. Ethephon absorption and transport associated with annual bluegrass inflorescence suppression. Crop Sci. 54:845-850.
88
McCullough, P.E., H. Liu, and L.B. McCarty. 2005a. Dwarf bermudagrass responses to flurprimidol and paclobutrazol. HortScience 40:1549-1551. McCullough, P.E., H. Liu, and L.B. McCarty. 2005b. Mowing operations influence creeping bentgrass putting green ball roll following plant growth regulator applications. HortScience 40:471-474. McCullough, P.E., H. Liu, L.B. McCarty, and J.E. Toler. 2006. Ethephon and trinexapac- ethyl influence creeping bentgrass growth, quality, and putting green performance. Applied Turfgrass Science 3:0. McCullough, P.E., H. Liu, L.B. McCarty, and J.E. Toler. 2007. Trinexapac-ethyl application regimens influence growth, quality, and performance of bermudagrass and creeping bentgrass putting greens. Crop Sci. 47:2138-2144. McCullough, P. E., L.B. McCarty, H. Liu, and T. Whitwell. 2005c. Response of ‘TifEagle’ bermudagrass (Cynodon dactylon x C. transvaalensis) to ethephon and trinexapac-ethyl. Weed Technol. 19:251-254. McCullough, P.E., W. Nutt, T.R. Murphy, and P. Raymer. 2011. Seashore paspalum seedhead control and growth regulation with flazasulfuron and trinexapac-ethyl. Weed Technol. 25:64-69. McCullough, P.E., J. Yu, and S.M. Williams. 2017. Seedhead development of three warm-season turfgrasses as influenced by growing degree days, photoperiod, and maintenance regimens. International Turfgrass Society Research Journal 13:321- 329. McElroy, J.S., and D. Martins. 2013. Use of herbicides on turfgrass. Planta Daninha 31:455-467. Menchyk, N., D.G. Bielenberg, S. Martin, C. Waltz, H. Luo, F. Bethea, and H. Liu. 2014. Nitrogen and trinexapac-ethyl applications for managing ‘Diamond’ zoysiagrass putting greens in the transition zone, US. HortScience 49:1076-1080. Murray, J.J., and M.C. Engelke. 1983. Exploration for zoysiagrass in eastern asia. U.S. Golf Assoc. Green Sec. Rec. 21:8-12.
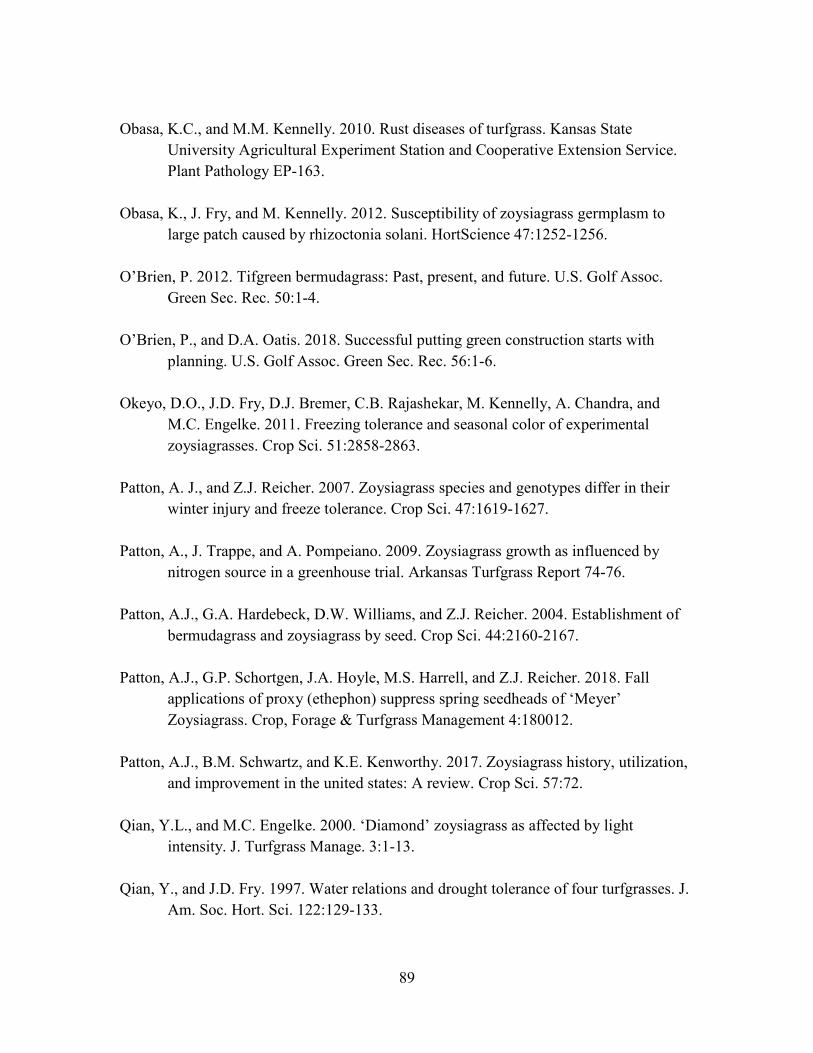
89
Obasa, K.C., and M.M. Kennelly. 2010. Rust diseases of turfgrass. Kansas State University Agricultural Experiment Station and Cooperative Extension Service. Plant Pathology EP-163. Obasa, K., J. Fry, and M. Kennelly. 2012. Susceptibility of zoysiagrass germplasm to large patch caused by rhizoctonia solani. HortScience 47:1252-1256. O’Brien, P. 2012. Tifgreen bermudagrass: Past, present, and future. U.S. Golf Assoc. Green Sec. Rec. 50:1-4. O’Brien, P., and D.A. Oatis. 2018. Successful putting green construction starts with planning. U.S. Golf Assoc. Green Sec. Rec. 56:1-6. Okeyo, D.O., J.D. Fry, D.J. Bremer, C.B. Rajashekar, M. Kennelly, A. Chandra, and M.C. Engelke. 2011. Freezing tolerance and seasonal color of experimental zoysiagrasses. Crop Sci. 51:2858-2863. Patton, A. J., and Z.J. Reicher. 2007. Zoysiagrass species and genotypes differ in their winter injury and freeze tolerance. Crop Sci. 47:1619-1627. Patton, A., J. Trappe, and A. Pompeiano. 2009. Zoysiagrass growth as influenced by nitrogen source in a greenhouse trial. Arkansas Turfgrass Report 74-76. Patton, A.J., G.A. Hardebeck, D.W. Williams, and Z.J. Reicher. 2004. Establishment of bermudagrass and zoysiagrass by seed. Crop Sci. 44:2160-2167. Patton, A.J., G.P. Schortgen, J.A. Hoyle, M.S. Harrell, and Z.J. Reicher. 2018. Fall applications of proxy (ethephon) suppress spring seedheads of ‘Meyer’ Zoysiagrass. Crop, Forage & Turfgrass Management 4:180012. Patton, A.J., B.M. Schwartz, and K.E. Kenworthy. 2017. Zoysiagrass history, utilization, and improvement in the united states: A review. Crop Sci. 57:72. Qian, Y.L., and M.C. Engelke. 2000. ‘Diamond’ zoysiagrass as affected by light intensity. J. Turfgrass Manage. 3:1-13. Qian, Y., and J.D. Fry. 1997. Water relations and drought tolerance of four turfgrasses. J. Am. Soc. Hort. Sci. 122:129-133.

90
Qian, Y. L., M.C. Engelke, and M.J.V. Foster. 2000. Salinity effects on zoysiagrass cultivars and experimental lines. Crop Sci. 40:488-492. Qian, Y.L., M.C. Engelke, M. Foster, and S. Reynolds. 1998. Trinexapac-ethyl restricts shoot growth and improves quality of ‘Diamond' zoysiagrass under shade. HortScience 33:1019-1022. Rademacher, W. 2000. Growth retardants: Effects on gibberellin biosynthesis and other metabolic pathways. Annual Review of Plant Biology 51:501-531. Reasor, E.H. 2017. Evaluation of off-type grasses in interspecific hybrid bermudagrass (cynodon dactylon (L.) pers. x C. transvaalensis burtt-davy) putting greens. Ph.D. diss., Univ. of Tennessee, Knoxville, TN. Reasor, E.H., J.T. Brosnan, J.P. Kerns, W.J. Hutchens, D.R. Taylor, J.D. McCurdy, D.J. Soldat, and W.C. Kreuser. 2018. Growing degree day models for plant growth regulator applications on ultradwarf hybrid bermudagrass putting greens. Crop Sci. 58:1801-1807. Reinert, J.A., M.C. Engelke, and J.J. Heitholt. 2011. Hunting billbug (coleoptera: Curculionidae) resistance among zoysiagrass (zoysia spp) cultivars. Fla. Entomol. 613-621. Richardson, M.D., and J.W. Boyd. 2001. Establishing zoysia japonica from sprigs: Effects of topdressing and nitrogen fertility. HortScience 36:377-379. Ries, S.K., and V. Wert. 1972. Simazine-induced nitrate absorption related to plant protein content. Weed Sci. 20:569-572. Ries, S.K., O. Moreno, W.F. Meggitt, C.J. Schweizer, and S.A. Ashkar. 1970. Wheat seed protein: Chemical influence on and relationship to subsequent growth and yield in michigan and mexico. Agron. J. 62:746-748. Rogers, R.A., J.H. Dunn, and C.J. Nelson. 1977. Photosynthesis and cold hardening in zoysia and bermudagrass. Crop Sci. 17:727-732.
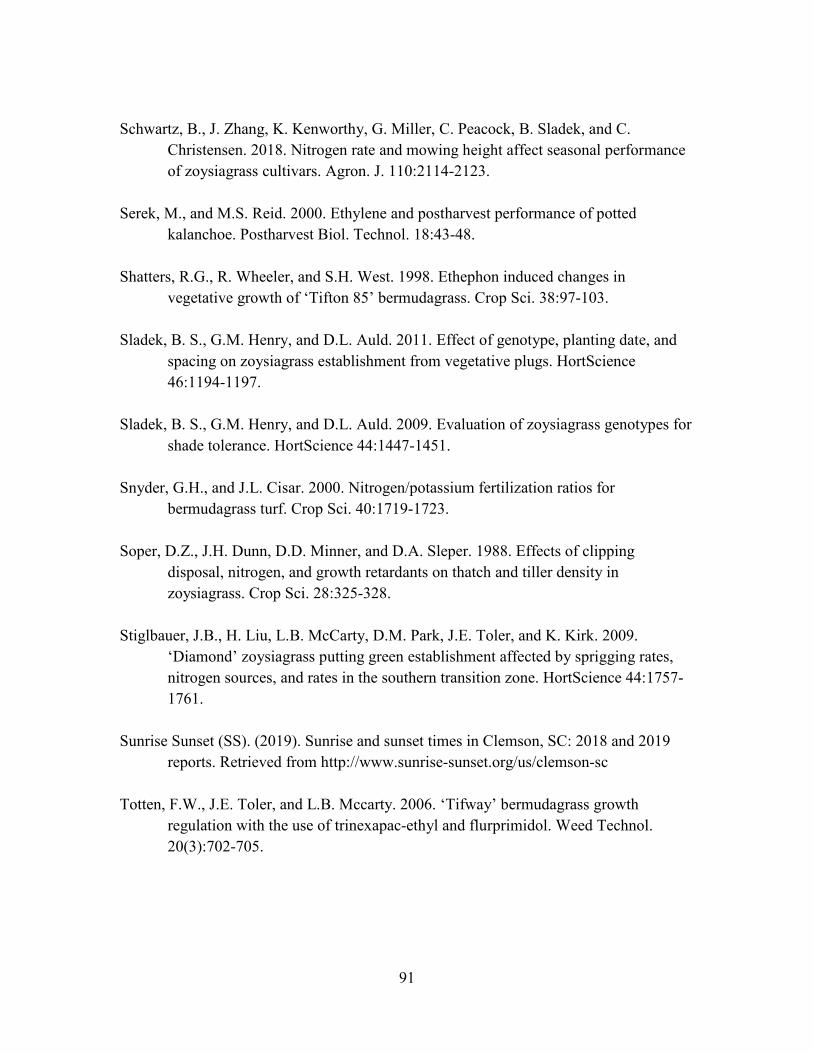
91
Schwartz, B., J. Zhang, K. Kenworthy, G. Miller, C. Peacock, B. Sladek, and C. Christensen. 2018. Nitrogen rate and mowing height affect seasonal performance of zoysiagrass cultivars. Agron. J. 110:2114-2123. Serek, M., and M.S. Reid. 2000. Ethylene and postharvest performance of potted kalanchoe. Postharvest Biol. Technol. 18:43-48. Shatters, R.G., R. Wheeler, and S.H. West. 1998. Ethephon induced changes in vegetative growth of ‘Tifton 85’ bermudagrass. Crop Sci. 38:97-103. Sladek, B. S., G.M. Henry, and D.L. Auld. 2011. Effect of genotype, planting date, and spacing on zoysiagrass establishment from vegetative plugs. HortScience 46:1194-1197. Sladek, B. S., G.M. Henry, and D.L. Auld. 2009. Evaluation of zoysiagrass genotypes for shade tolerance. HortScience 44:1447-1451. Snyder, G.H., and J.L. Cisar. 2000. Nitrogen/potassium fertilization ratios for bermudagrass turf. Crop Sci. 40:1719-1723. Soper, D.Z., J.H. Dunn, D.D. Minner, and D.A. Sleper. 1988. Effects of clipping disposal, nitrogen, and growth retardants on thatch and tiller density in zoysiagrass. Crop Sci. 28:325-328. Stiglbauer, J.B., H. Liu, L.B. McCarty, D.M. Park, J.E. Toler, and K. Kirk. 2009. ‘Diamond’ zoysiagrass putting green establishment affected by sprigging rates, nitrogen sources, and rates in the southern transition zone. HortScience 44:1757- 1761. Sunrise Sunset (SS). (2019). Sunrise and sunset times in Clemson, SC: 2018 and 2019
reports. Retrieved from http://www.sunrise-sunset.org/us/clemson-sc
Totten, F.W., J.E. Toler, and L.B. Mccarty. 2006. ‘Tifway’ bermudagrass growth regulation with the use of trinexapac-ethyl and flurprimidol. Weed Technol. 20(3):702-705.

92
Trappe, J., A.J. Patton, and M. Richardson. 2009. Clipping yield and scalping tendency differ for bermudagrass and zoysiagrass cultivars. Arkansas Turf. Rpt. 2008 56:153-157.
Trappe, J.M., D.E. Karcher, M.D. Richardson, and A.J. Patton. 2011. Shade and traffic tolerance varies for bermudagrass and zoysiagrass cultivars. Crop Sci. 51:870-877.
Trenholm, L.E., R.N. Carrow, and R.R. Duncan. 1999. Relationship of multispectral radiometry data to qualitative data in turfgrass research. Crop Sci. 39:763-769.
Turgeon, A.J. 2012. Turfgrass Management. Prentice Hall, Upper Saddle River, NJ.
Tweedy, J.A., and S.K. Ries. 1967. Effect of simazine on nitrate reductase activity in corn. Plant Physiol. 42:280-282.
USDA Bureau of Plant Industry. 1915. Inventory of seeds and plants imported by the office of foreign seed and plant introduction during the period from October 1 to December 31, 1912. Inventory No. 33; Nos 34340 to 34727. U. S. Gov. Print. Office, Washington, DC.
U.S. Golf Association (USGA) Green Section Staff. 2018. USGA recommendations for a method of putting green construction. U.S. Golf Assoc. Green Sec. Rec.. http://archive.lib.msu.edu/tic/usgamisc/monos/2018recommendationsmethodputtinggreen.pdf (accessed 18 Nov. 2018).
Wherley, B.G., P. Skulkaew, A. Chandra, A.D. Genovesi, and M.C. Engelke. 2011. Low- input performance of zoysiagrass (zoysia spp.) cultivars maintained under dense
tree shade. HortScience 46:1033-1037.
Wherley, B., J. Heitholt, A. Chandra, and P. Skulkaew. 2014. Supplemental irrigation requirements of zoysiagrass and bermudagrass cultivars. Crop Sci. 54:1823-1831.
White, R.H., M.C. Engelke, S.J. Anderson, B.A. Ruemmele, K.B. Marcum, and G.R. Taylor. 2001. Zoysiagrass water relations. Crop Sci. 41:133-138.
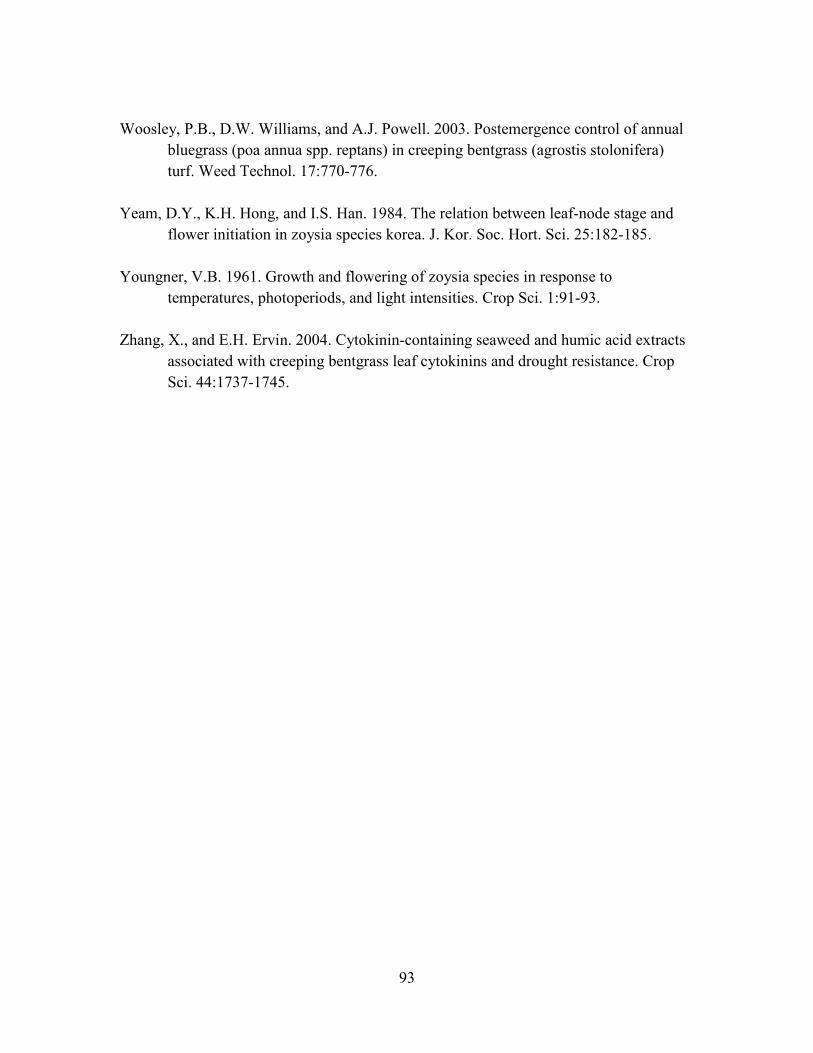
93
Woosley, P.B., D.W. Williams, and A.J. Powell. 2003. Postemergence control of annual bluegrass (poa annua spp. reptans) in creeping bentgrass (agrostis stolonifera) turf. Weed Technol. 17:770-776. Yeam, D.Y., K.H. Hong, and I.S. Han. 1984. The relation between leaf-node stage and flower initiation in zoysia species korea. J. Kor. Soc. Hort. Sci. 25:182-185. Youngner, V.B. 1961. Growth and flowering of zoysia species in response to temperatures, photoperiods, and light intensities. Crop Sci. 1:91-93. Zhang, X., and E.H. Ervin. 2004. Cytokinin-containing seaweed and humic acid extracts associated with creeping bentgrass leaf cytokinins and drought resistance. Crop Sci. 44:1737-1745.