diallel analysis of some quantitative traits in gossypium ...6)/pjb41(6)3009.pdf · pak. j. bot.,...
TRANSCRIPT

Pak. J. Bot., 41(6): 3009-3022, 2009.
DIALLEL ANALYSIS OF SOME QUANTITATIVE TRAITS IN GOSSYPIUM HIRSUTUM L.
NAQIB ULLAH KHAN1, GUL HASSAN2, KHAN BAHADAR MARWAT2,
FARHATULLAH1, MOULA BUX KUMBHAR3, AISHA PARVEEN1, UMM-E-AIMAN1, MUHAMMAD ZAFARULLAH KHAN4 AND ZAHOOR AHMAD SOOMRO3
1Department of Plant Breeding and Genetics, NWFP Agricultural University Peshawar, Pakistan, 2Department of Weed Science, NWFP Agricultural University Peshawar, Pakistan,
3Department of Plant Breeding and Genetics, Sindh Agriculture University Tandojam, Pakistan, 4Department of Extension Education and Communication, NWFP Agricultural University
Peshawar, Pakistan.
Abstract
Genetic analysis was studied in a 6x6 diallel cross following Hayman’s diallel approach and Mather’s concept of D (additive), H (dominance) genetic components of variation in F1 and F2 hybrids in a randomized complete block design in upland cotton during 2003-05 at the Agricultural Research Institute, Dera Ismail Khan, Pakistan. Additive-dominance model was used for validation of data and design with the intention to decipher the inheritance pattern; gene action and correlation involved in seed cotton yield and yield contributing traits (boll weight and bolls number) and staple length. Genotypes mean values differed significantly (p≤0.01) for all the traits. The scaling tests used fully satisfy the pre-requisites of additive-dominance model and the traits i.e., boll weight and staple length in F1 generation showed complete adequacy. All other traits in both generations did not satisfy the assumptions and makes the additive-dominance model partially adequate for the data. Additive component (D) was found significant for boll weight and staple length in both generations and in F1s bolls per plant. Dominance components (H1, H2) were also found significant for all the traits in F1s and non-significant in F2 generation. In F1s the additive gene action was somewhat partial, while in F2s most of traits were controlled by additive gene action with some contradictions between genetic components of variance and Wr/Vr graphs about expression of inheritance. On the basis of transgressive segregation, the selection made in the cv. CIM-1100 F2 population indicated possibilities of prompt and effective improvement in the said traits. Introduction
The success of cotton breeding programme is primarily based on the choice and use of promising parental lines for hybridization, followed by selection for favorable genes and gene complexes in homozygous lines. Therefore, information regarding genetic variability and its components provides dependable tools to the breeder for crop improvement. Such information is also useful for hybrid cotton programme. The quasi total of the breeding studies in various crops have emphatically established that the per se production performance of genotypes do not provide dependable basis for their productivity in cross combinations. Thus crossing in a diallel fashion is the dependable and effective technique for identification and choice of superior genotypes. Consequently, like plant breeding, the identification and use of genotypes with better desirable genetic components of variance is a continuous pre-requisite for synthesis of physiologically efficient and genetically superior genotypes showing promise for increased production per unit area under a given set of environments.
In quantitative genetics to achieve these objectives, a comprehensive study of assumptions of additive-dominance model, genetic mechanism and genetic components of variation which control the various plant characters in genotypes under different

NAQIB ULLAH KHAN ET AL.,
3010
environmental conditions has been advocated by a large number of eminent scientists like Hayman (1954), Mather & Jinks (1982), Tang et al., (1993, 1996), Husaain et al., (1998, 1999a & b), McCarty et al., (1996, 2004a & b), Khan (2003), Mei et al., (2006), Wu et al., (2006), Khan et al., (2007) and many others on different species of agricultural crops like cotton, wheat and tobacco etc.
Additive-dominance model can direct plant breeder about the validation of data and design, and after that legalization of data, then the D, H genetic components of variation can be studied to see the inheritance pattern of the traits. The present studies also embody genetic analysis involving gene action and type of inheritance (genetic components of variation and Wr/Vr graphs) implicated, after validation of data with three scaling tests (t2 test, regression analysis and arrays analysis of variance) used under additive-dominance model for seed cotton yield, yield contributing traits (bolls per plant and boll weight) and staple length in a 6x6 complete diallel cross of Gossypium hirsutum L., in F1 and F2 generations. Though the inferences drawn here, in a strict sense, apply to the genotypes involved, but since these genotypes more or less represent a sample of the material available for cotton breeding work, so the findings may also be viewed in a broader sense. Materials and Methods Plant material and experimental design: Experiments comprising of a crossing block, F1 and F2 populations of upland cotton (Gossypium hirsutum L.), were conducted and maintained over a three years of period (2003-2005) at the Agricultural Research Institute, Dera Ismail Khan, Pakistan. Dera Ismail Khan lies between 31°, 50′ North latitude and 70°, 50′ East longitude. Breeding material comprised of 6 different Gossypium hirsutum genotypes having broad genetic base and varied by date of release, pedigree, seedcotton and fiber yield as well as fiber and oil quality traits. The cultivars comprising of CIM-109, CIM-240, CIM-1100, FH-682, BH-36 and CRIS-9 were hand sown in a non-replicated crossing block during May, 2003. Each cultivar plot consisted of five rows, 27 m in length with a plant and rows spacing of 60 and 100 cm to facilitate hand emasculation and crossing. All the cultivars were crossed in a complete diallel fashion. The F1 populations were planted in 2004 using half of the seed produced in the previous season for F2 seed production. The experiment having 30 hybrids (including reciprocals) of F1s and F2s 6x6 complete diallel cross along with 6 parents were hand sown in randomized complete block (RCB) design during May 2005. In F1s, each genotype was planted in a single row measuring 3.30 m, with three replications, while in F2s, the plant population was increased and each genotype was planted in four rows, each of 6.30 m length, with four replications. The plants and rows were 30 and 75 cm, respectively. All the recommended cultural practices and inputs including fertilizer, hoeing, irrigation and pest control were applied same for all the entries from sowing till the harvesting and the crop was grown under uniform conditions to minimize environmental variability to the maximum possible extent. Picking was made during the months of November-December every year on single plant basis and ginning was done with 8 saw-gins. Traits measurement and statistical analyses: The data were recorded on bolls per plant, boll weight, seed cotton yield per plant and fiber length. The staple length was studied through High Volume Instrument (HVI) at Central Cotton Research Institute (CCRI) Multan, Pakistan. All the data were subjected to analysis of Variance (ANOVA) technique using Mstatc computer software for all the traits to test the null hypothesis of no differences between various F1 as well as among F2 hybrid population and their parental lines.
DIALLEL ANALYSIS OF SOME TRAITS IN GOSSYPIUM HIRSUTUM 3011
Diallel analyses: After ANOVA, the data were tested through additive-dominance model which requires the computations of the variance (Vr) of the components of each array and array parent-offspring covariance (Wr). Scaling test was made through regression analysis, arrays analysis of variance (Wr+Vr and Wr-Vr) and t2 test to see the adequacy of additive-dominance model for the said data. Diallel theory was developed by Hayman (1954) using Mather’s concept of D, H components of variation for additive and dominance variances, respectively (as D used for additive variance instead of A and H1 and H2 for dominance components of variance instead of D). The recent development about this technique has been described in detail by Mather & Jinks (1982) and genetic components of variation were estimated following that method of diallel analysis. In F2 population the formulas were modified to calculate the components of variance as proposed by Verhalen & Murray (1969) and Verhalen et al., (1971) provided in the book titled “Biometrical Methods in Quantitative Genetic Analysis” by Singh & Chaudhary (1979). Six genetic components of variation, their ratios along with standard error and correlation coefficient were estimated as follows: D = Additive genetic variance means variance of the parents. H1= Dominance variance means covariance between the parents and the arrays. H2= H1 {1-(u-v) 2}, where u and v are the proportions of positive and negative genes, in
the parents. F = Mean of Fr values over arrays, where Fr is the covariance of additive and dominance
effects in a single array. F is positive where dominant genes are more frequent than recessive.
h2= Dominance effect (as algebraic sum over all loci in heterozygous phase in all crosses). When frequency of dominant and recessive alleles is equal, then H1 = H2 = h2. Significance of h2 confirms that dominance is unidirectional.
E = Expected environmental component of variation;
nsreplicatio of Number ] d.f.
Reps.S.S. + S.S.Error[ = E
From these estimates, the following genetic ratios were determined. F1 = √H1/D, F2 = √¼H1/D: denotes average degree of dominance, if the value of this ratio
is zero, there is no dominance; If it is greater than zero but less than 1, there is partial dominance; and if it is greater than 1, it denotes over-dominance.
H2/4H1: denotes the proportion of genes with positive and negative effects in the parents, and if the ratio is equal to 0.25, indicates symmetrical distribution of positive and negative genes.
F1= √4DH1+F/√4DH1-F, F2 = ¼√4DH1+½F/¼√4DH1-½F: denotes the ratio of dominant and recessive genes in the parents, if the ratio is 1, the dominant and recessive genes in the parents are in equal proportion; if it is less than 1, it indicates an excess of recessive genes; but being greater than 1, it indicates excess of dominant genes.
h2/H2: denotes the number of gene groups/genes, which control the character and exhibit dominance.
n)Y(-)Y(
n)X(-)X(
nY)X)((-XY
=(r)tCoefficien nCorrelatio2222 ∑∑
×∑∑
∑∑∑
Negative value of correlation coefficient (r) indicates dominant genes, while if its value
is positive then recessive genes are responsible for the phenotypic expression of the trait.
NAQIB ULLAH KHAN ET AL.,
3012
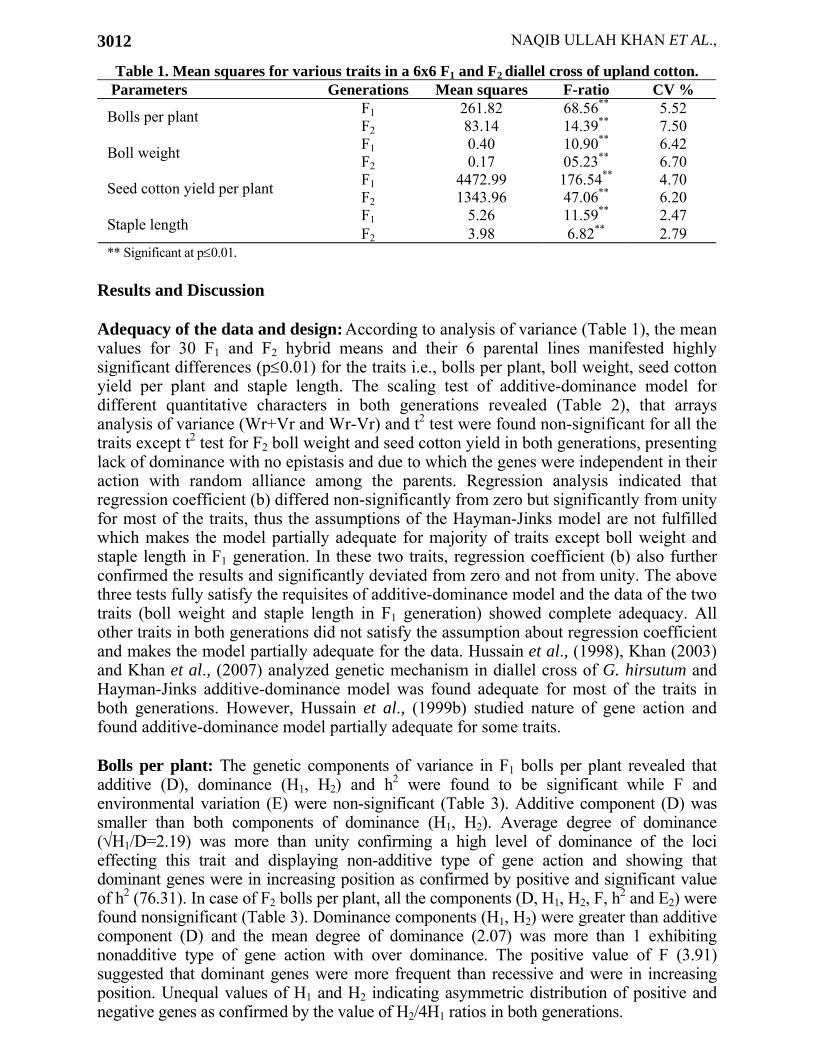
Table 1. Mean squares for various traits in a 6x6 F1 and F2 diallel cross of upland cotton. Parameters Generations Mean squares F-ratio CV %
F1 261.82 68.56** 5.52 Bolls per plant F2 83.14 14.39** 7.50 F1 0.40 10.90** 6.42 Boll weight F2 0.17 05.23** 6.70 F1 4472.99 176.54** 4.70 Seed cotton yield per plant F2 1343.96 47.06** 6.20 F1 5.26 11.59** 2.47 Staple length F2 3.98 6.82** 2.79
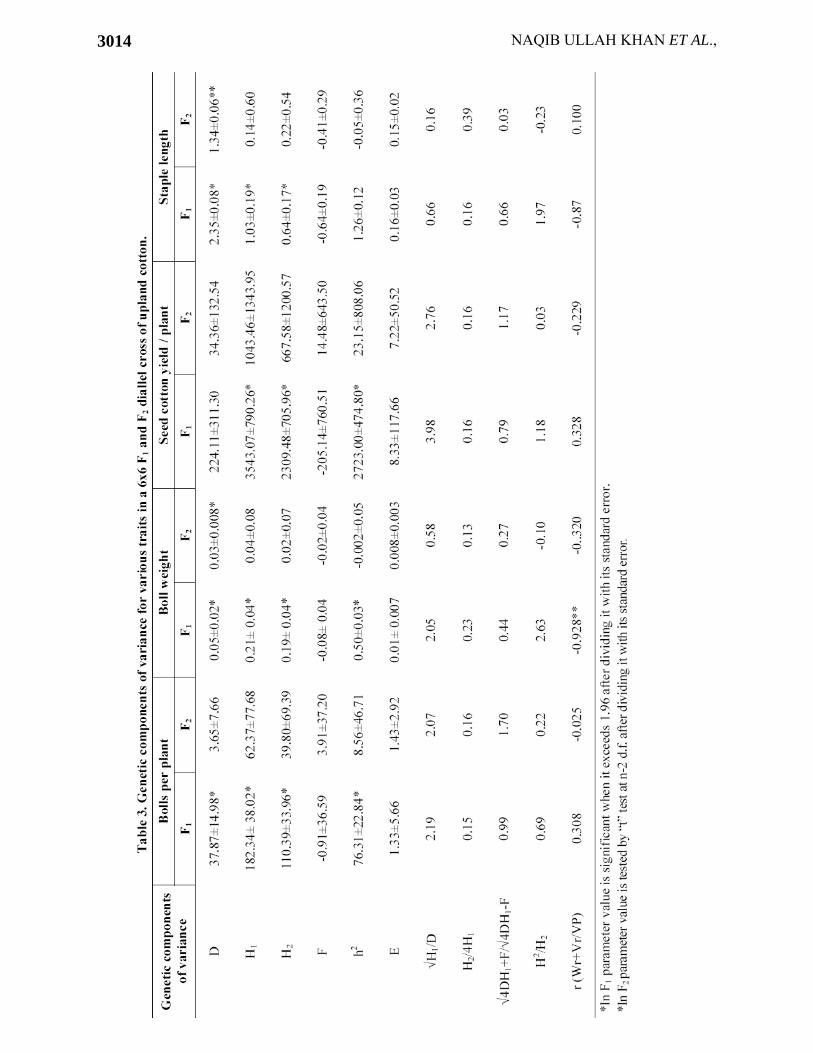
** Significant at p≤0.01. Results and Discussion Adequacy of the data and design: According to analysis of variance (Table 1), the mean values for 30 F1 and F2 hybrid means and their 6 parental lines manifested highly significant differences (p≤0.01) for the traits i.e., bolls per plant, boll weight, seed cotton yield per plant and staple length. The scaling test of additive-dominance model for different quantitative characters in both generations revealed (Table 2), that arrays analysis of variance (Wr+Vr and Wr-Vr) and t2 test were found non-significant for all the traits except t2 test for F2 boll weight and seed cotton yield in both generations, presenting lack of dominance with no epistasis and due to which the genes were independent in their action with random alliance among the parents. Regression analysis indicated that regression coefficient (b) differed non-significantly from zero but significantly from unity for most of the traits, thus the assumptions of the Hayman-Jinks model are not fulfilled which makes the model partially adequate for majority of traits except boll weight and staple length in F1 generation. In these two traits, regression coefficient (b) also further confirmed the results and significantly deviated from zero and not from unity. The above three tests fully satisfy the requisites of additive-dominance model and the data of the two traits (boll weight and staple length in F1 generation) showed complete adequacy. All other traits in both generations did not satisfy the assumption about regression coefficient and makes the model partially adequate for the data. Hussain et al., (1998), Khan (2003) and Khan et al., (2007) analyzed genetic mechanism in diallel cross of G. hirsutum and Hayman-Jinks additive-dominance model was found adequate for most of the traits in both generations. However, Hussain et al., (1999b) studied nature of gene action and found additive-dominance model partially adequate for some traits. Bolls per plant: The genetic components of variance in F1 bolls per plant revealed that additive (D), dominance (H1, H2) and h2 were found to be significant while F and environmental variation (E) were non-significant (Table 3). Additive component (D) was smaller than both components of dominance (H1, H2). Average degree of dominance (√H1/D=2.19) was more than unity confirming a high level of dominance of the loci effecting this trait and displaying non-additive type of gene action and showing that dominant genes were in increasing position as confirmed by positive and significant value of h2 (76.31). In case of F2 bolls per plant, all the components (D, H1, H2, F, h2 and E2) were found nonsignificant (Table 3). Dominance components (H1, H2) were greater than additive component (D) and the mean degree of dominance (2.07) was more than 1 exhibiting nonadditive type of gene action with over dominance. The positive value of F (3.91) suggested that dominant genes were more frequent than recessive and were in increasing position. Unequal values of H1 and H2 indicating asymmetric distribution of positive and negative genes as confirmed by the value of H2/4H1 ratios in both generations.

DIALLEL ANALYSIS OF SOME TRAITS IN GOSSYPIUM HIRSUTUM 3013
NAQIB ULLAH KHAN ET AL.,
3014

DIALLEL ANALYSIS OF SOME TRAITS IN GOSSYPIUM HIRSUTUM 3015
Fig. 1a. Wr/Vr graph for F1 bolls per plant. Fig. 1b. Wr/Vr graph for F2 bolls per plant.
Table 4. Fr (Covariance of additive and dominance effects in a single array) values of different cultivars for various traits in a 6x6 F1 and F2 diallel cross of upland cotton.
Fr values
Bolls per plant Boll weight Seed cotton yield/plant Staple length Cultivars
F1 F2 F1 F2 F1 F2 F1 F2 CIM-109 -15.63 8.38 -0.21 0.009 -293.72 111.48 -1.03 -0.79 CIM-240 71.84 31.94 0.03 -0.02 1057.31 433.57 -2.77 0.62 CIM-1100 -124.43 -16.89 0.11 0.02 -953.86 -162.92 2.89 -0.48 FH-682 27.02 -25.29 0.01 -0.09 165.18 -524.01 0.21 -0.92 BH-36 45.29 13.17 -0.07 -0.03 217.55 183.87 -0.94 -0.56 CRIS-9 -9.56 12.14 -0.33 -0.02 -1423.31 44.90 -2.18 -0.36 Mean Fri. -0.91 3.91 -0.08 -0.02 -205.14 14.48 -0.64 -0.41
The Wr/Vr graph (Fig. 1a) and Fr values (covariance of additive and dominance effects in a single array) for F1 bolls per plant (Table 4), the regression line cuts the Wr axis below the origin on negative side which also suggests overdominance type of gene action. Khan et al., (2005) also mentioned predominance of nonadditive gene action for the inheritance of said trait. The distribution of array points along the regression line conceive that CIM-240, BH-36 and FH-682, having maximum and positive Fr values (Table 4) and being nearer to the origin, contain maximum dominant genes, while CIM-1100, CIM-109 and CRIS-9, being farther and possessing minimum and negative Fr values (Table 4), had maximum recessive genes. In F2s, the Wr/Vr graph (Fig. 1b) and Fr values (Table 4) for bolls per plant revealed additive type of gene action with partial dominance controlling the inheritance pattern of the said trait as the regression line passed positively though Wr above the origin, but it was not confirmed by components of variance (Table 3). This contradiction in graphic representation and components of variance appeared to be due to residual heterozygosity in the parents (Hayman, 1954; Tahir et al., 1995; Khan, 2003). From the position of array points along the regression line, it was noted that CIM-240, BH-36, CRIS-9 and CIM-109 having maximum and

NAQIB ULLAH KHAN ET AL.,
3016
positive Fr values (Table 4) and being nearer to the origin contain the maximum dominant genes, while FH-682 and CIM-1100 being farther and possessing minimum and negative Fr values, had maximum recessive genes. Positive correlation coefficient (r=0.308) between (Wr+Vr) and parental means (y) enunciated that parents having recessive genes (Fig. 1a) were responsible for increased bolls per plant in F1 generation. In F2s, negative correlation coefficient (r=-0.025) between (Wr+Vr) and mid parental value showed that the parents possessing maximum dominant genes (Fig. 1b) were responsible for decreased bolls per plant in F2 generation, which clearly confirmed the results of F1 generation (Table 3).
Bolls per plant is an important yield component and according to degree of dominance, Wr/Vr graphs and correlation coefficient in both generations, revealed that bolls per plant was governed by non-additive type of gene action and selections in such promising hybrids can be used in hybrid cotton production for increased bolls per plant. Moreover, selection in top performing hybrids can also be studied in segregating generations because according to Wr/Vr graphs the cultivars having recessive genes were responsible for increased bolls per plant. The results are in quite corroboration to the findings of Hassan et al., (1999), Khan (2003) and Mei et al., (2006) who concluded that bolls per plant was nonadditively controlled and contributed large dominance effects. However, Ahmad et al., (1996), Ahmad et al., (1997), Hussain et al., (1998, 1999a), Subhan et al., (2001) and Khan et al., (2009) had noticed additive type of gene action for the inheritance of bolls number. Such different findings could be attributed to genotypic and environmental differences between various studies. Boll weight: The genetic components of variance (D, H1, H2 and h2) were significant while F and E were non-significant for F1 boll weight (Table 3). Both H1 and H2 were greater than additive component (D) and the genetic parameter (√H1/D=2.05) was also more than 1 presenting dominance. The negative but non-significant value of F (-0.08) cannot justify the recessive genes with increasing position due to positive and significant value of h2 (0.50). Regarding F2s, the additive (D) component was significant while other components like H1, H2, F, h2 and E2 were non-significant for boll weight (Table 3). The mean degree of dominance (0.58) was less than 1 displaying additive type of gene action. F with non-significant negative value (-0.02) revealed that the recessive genes were more frequent than dominant and were in decreasing position as confirmed by h2 (-0.002). Asymmetric values of H1 and H2 indicating random distribution of positive and negative genes and as confirmed by H2/4H1 ratios in both generations.
The relationship of Wr/Vr in Fig. 2a and Fr values (Table 4) for F1 boll weight, showed that the regression line cutting the Wr axis below the origin revealed nonadditive type of gene action with overdominance. It was also observed that cultivars CIM-1100, CIM-240 and FH-682 seem to possess most of the dominant genes because of their nearest position to the origin and having maximum Fr values, while the varieties CRIS-9, CIM-109 and BH-36 mostly had recessive genes for boll weight by yielding minimum Fr values and being farthest from the origin. In F2s, the Wr/Vr graph (Fig. 2b) and Fr values (Table 4) for boll weight indicated that regression line intercepted the Wr axis above the origin and denoted additive type of gene action with partial dominance controlling the inheritance pattern of this character. It was noticed that CIM-1100 and CIM-109 possessed maximum dominant genes by virtue of their nearest position to the origin and maximum Fr values, while cultivars FH-682, BH-36, CRIS-9 and CIM-240 being away from the origin and having least Fr values had the recessive genes.

DIALLEL ANALYSIS OF SOME TRAITS IN GOSSYPIUM HIRSUTUM 3017
Fig. 2a. Wr/Vr graph for F1 boll weight. Fig. 2b. Wr/Vr graph for F2 boll weight. Significant negative correlation coefficient (r=-0.928) between (Wr+Vr) and parental
means (Table 3) established that the parents containing dominant genes (Fig. 2a) were responsible for increased boll weight in F1 generation; hence, indication of hybrid performance. The present results are in conformity with Ahmad et al., (1996) and Tang et al., (1996) as they noticed nonadditive type of gene action with overdominance for boll weight. In F2s, negative correlation coefficient (r=-0.320) between (Wr+Vr) and parental means (Table 3) articulated that some of the parents containing dominant genes (Fig. 2b) were responsible for decreased boll weight, while the recessive genes were responsible for increased boll weight in F2 generation. As compared to F2, the boll weight was nonadditive in F1 but due to segregation it became additive as confirmed by degree of dominance, significant value of D and nonsignificant values of H1, H2 components. Boll weight is an important yield component and through simple selection the genotypes can be improved for the said trait and can be maintained in progenies of desirable hybrids. Presence of high additive effects indicates that a significant advancement can be made in yield contributing traits like boll weight and boll number (Ashraf & Ahmad, 2000). Luckett et al., (1989) also mentioned that analysis of genetic components and parameters indicated that additive effects were substantial for boll weight. Hussain et al., (1998), Hassan et al., (1999a), McCarty et al., (2004a & b) and Wu et al., (2006) also have mentioned additive variance. However, Ahmad et al., (1997) and Iqbal et al., (2005) noticed nonadditive type of gene action for the said trait. The contradictory findings may be due to different factors like different breeding material and the climatic conditions under which the experiments were conducted. The results in F2 generation are in close harmony with the findings of McCarty et al., (1996), Ahmad et al., (1997) and Subhan et al., (2000) as they also observed additive type of gene action with partial dominance for boll weight. Seed cotton yield per plant: Regarding genetic components of variance, the additive (D), F and E were non-significant which may be due to significant dominance components (H1, H1) and h2 as well (Table 3). Dominance components dominated the additive component and the mean degree of dominance (√H1/D=3.98) was found more than 1 suggested dominance type of gene action. The nonsignificant negative value of F (-205.14) cannot confirm the excess of recessive genes with increasing position due to positive and significant value of h2. In F2s, all the components of variance D, H1, H2, F, h2 and E2 were non-significant for seed cotton yield (Table 3). Dominance components
NAQIB ULLAH KHAN ET AL.,
3018
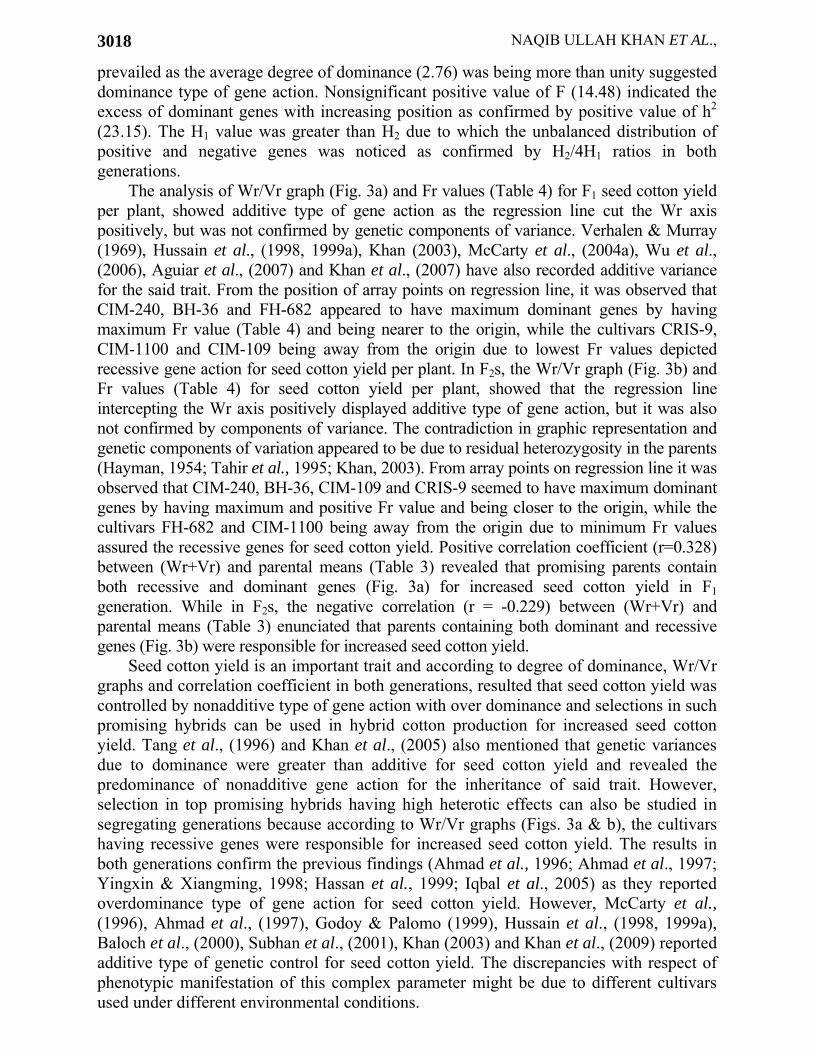
prevailed as the average degree of dominance (2.76) was being more than unity suggested dominance type of gene action. Nonsignificant positive value of F (14.48) indicated the excess of dominant genes with increasing position as confirmed by positive value of h2 (23.15). The H1 value was greater than H2 due to which the unbalanced distribution of positive and negative genes was noticed as confirmed by H2/4H1 ratios in both generations.
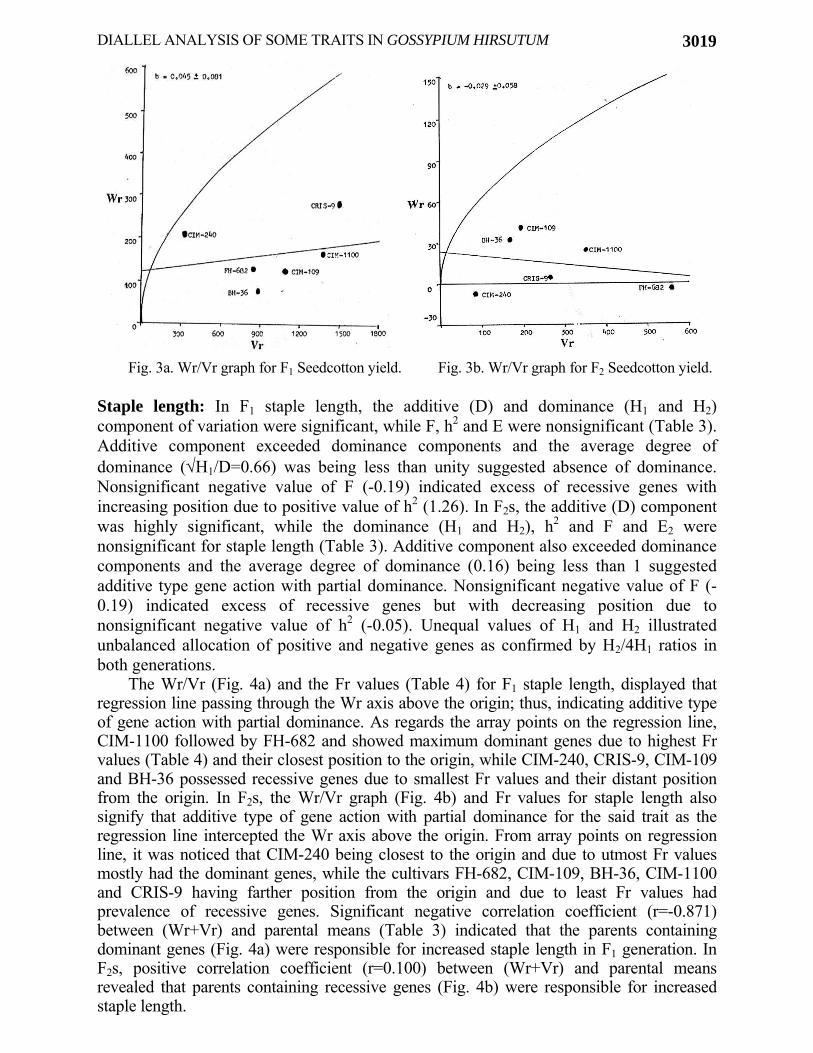
The analysis of Wr/Vr graph (Fig. 3a) and Fr values (Table 4) for F1 seed cotton yield per plant, showed additive type of gene action as the regression line cut the Wr axis positively, but was not confirmed by genetic components of variance. Verhalen & Murray (1969), Hussain et al., (1998, 1999a), Khan (2003), McCarty et al., (2004a), Wu et al., (2006), Aguiar et al., (2007) and Khan et al., (2007) have also recorded additive variance for the said trait. From the position of array points on regression line, it was observed that CIM-240, BH-36 and FH-682 appeared to have maximum dominant genes by having maximum Fr value (Table 4) and being nearer to the origin, while the cultivars CRIS-9, CIM-1100 and CIM-109 being away from the origin due to lowest Fr values depicted recessive gene action for seed cotton yield per plant. In F2s, the Wr/Vr graph (Fig. 3b) and Fr values (Table 4) for seed cotton yield per plant, showed that the regression line intercepting the Wr axis positively displayed additive type of gene action, but it was also not confirmed by components of variance. The contradiction in graphic representation and genetic components of variation appeared to be due to residual heterozygosity in the parents (Hayman, 1954; Tahir et al., 1995; Khan, 2003). From array points on regression line it was observed that CIM-240, BH-36, CIM-109 and CRIS-9 seemed to have maximum dominant genes by having maximum and positive Fr value and being closer to the origin, while the cultivars FH-682 and CIM-1100 being away from the origin due to minimum Fr values assured the recessive genes for seed cotton yield. Positive correlation coefficient (r=0.328) between (Wr+Vr) and parental means (Table 3) revealed that promising parents contain both recessive and dominant genes (Fig. 3a) for increased seed cotton yield in F1 generation. While in F2s, the negative correlation (r = -0.229) between (Wr+Vr) and parental means (Table 3) enunciated that parents containing both dominant and recessive genes (Fig. 3b) were responsible for increased seed cotton yield.
Seed cotton yield is an important trait and according to degree of dominance, Wr/Vr graphs and correlation coefficient in both generations, resulted that seed cotton yield was controlled by nonadditive type of gene action with over dominance and selections in such promising hybrids can be used in hybrid cotton production for increased seed cotton yield. Tang et al., (1996) and Khan et al., (2005) also mentioned that genetic variances due to dominance were greater than additive for seed cotton yield and revealed the predominance of nonadditive gene action for the inheritance of said trait. However, selection in top promising hybrids having high heterotic effects can also be studied in segregating generations because according to Wr/Vr graphs (Figs. 3a & b), the cultivars having recessive genes were responsible for increased seed cotton yield. The results in both generations confirm the previous findings (Ahmad et al., 1996; Ahmad et al., 1997; Yingxin & Xiangming, 1998; Hassan et al., 1999; Iqbal et al., 2005) as they reported overdominance type of gene action for seed cotton yield. However, McCarty et al., (1996), Ahmad et al., (1997), Godoy & Palomo (1999), Hussain et al., (1998, 1999a), Baloch et al., (2000), Subhan et al., (2001), Khan (2003) and Khan et al., (2009) reported additive type of genetic control for seed cotton yield. The discrepancies with respect of phenotypic manifestation of this complex parameter might be due to different cultivars used under different environmental conditions.
DIALLEL ANALYSIS OF SOME TRAITS IN GOSSYPIUM HIRSUTUM 3019
Fig. 3a. Wr/Vr graph for F1 Seedcotton yield. Fig. 3b. Wr/Vr graph for F2 Seedcotton yield.
Staple length: In F1 staple length, the additive (D) and dominance (H1 and H2) component of variation were significant, while F, h2 and E were nonsignificant (Table 3). Additive component exceeded dominance components and the average degree of dominance (√H1/D=0.66) was being less than unity suggested absence of dominance. Nonsignificant negative value of F (-0.19) indicated excess of recessive genes with increasing position due to positive value of h2 (1.26). In F2s, the additive (D) component was highly significant, while the dominance (H1 and H2), h2 and F and E2 were nonsignificant for staple length (Table 3). Additive component also exceeded dominance components and the average degree of dominance (0.16) being less than 1 suggested additive type gene action with partial dominance. Nonsignificant negative value of F (-0.19) indicated excess of recessive genes but with decreasing position due to nonsignificant negative value of h2 (-0.05). Unequal values of H1 and H2 illustrated unbalanced allocation of positive and negative genes as confirmed by H2/4H1 ratios in both generations.
The Wr/Vr (Fig. 4a) and the Fr values (Table 4) for F1 staple length, displayed that regression line passing through the Wr axis above the origin; thus, indicating additive type of gene action with partial dominance. As regards the array points on the regression line, CIM-1100 followed by FH-682 and showed maximum dominant genes due to highest Fr values (Table 4) and their closest position to the origin, while CIM-240, CRIS-9, CIM-109 and BH-36 possessed recessive genes due to smallest Fr values and their distant position from the origin. In F2s, the Wr/Vr graph (Fig. 4b) and Fr values for staple length also signify that additive type of gene action with partial dominance for the said trait as the regression line intercepted the Wr axis above the origin. From array points on regression line, it was noticed that CIM-240 being closest to the origin and due to utmost Fr values mostly had the dominant genes, while the cultivars FH-682, CIM-109, BH-36, CIM-1100 and CRIS-9 having farther position from the origin and due to least Fr values had prevalence of recessive genes. Significant negative correlation coefficient (r=-0.871) between (Wr+Vr) and parental means (Table 3) indicated that the parents containing dominant genes (Fig. 4a) were responsible for increased staple length in F1 generation. In F2s, positive correlation coefficient (r=0.100) between (Wr+Vr) and parental means revealed that parents containing recessive genes (Fig. 4b) were responsible for increased staple length.

NAQIB ULLAH KHAN ET AL.,
3020
Fig. 4a. Wr/Vr graph for F1 Staple length. Fig. 4b. Wr/Vr graph for F2 Staple length.
The staple length was found additive in both generations as confirmed by degree of
dominance and Wr/Vr graphs. The significant value of additive component (D) and nonsignificant values of dominance components (H1, H2) in promising F2 hybrids and for the trait as a whole is also encouraging; hence, stability in additive variance per consequence the staple length can be increased through simple selection. The present results are in agreement with those of Verhalen & Murray (1969), Tang et al., (1993), Ahmad et al., (1996), Hussain et al., (1998, 1999a), Ashraf & Ahmad (2000), Baloch et al., (2000), Subhan et al., (2000), Khan (2003), Wu et al., (2006) and Aguiar et al., (2007) who also recorded additive type of gene action with partial dominance for staple length. Same type of variances have been recorded for staple length and hence, after selection in promising F2 hybrids, improvement can be made in this trait through segregating generations (Tang et al., 1993; McCarty et al., 1996; Hussain et al., 1999a; McCarty et al., 2004a & b; Khan, 2003; Khan et al., 2007). However, the findings of Ahmad et al., (1997) and Hassan et al., (1999) were not in line with present results as they mentioned that nonadditive type of gene action was responsible for inheritance of staple length. The differences with respect to phenotypic manifestation of the staple length might be due to different cultivars used under different agro-climatic conditions. Conclusion
Additive and dominance components were found significant for majority of the traits but dominance components were nonsignificant in F2 generation. In F1s the additive gene action was somewhat partial, while in F2s most of traits were controlled by additive gene action. On the basis of observed transgressive segregation, the selection made in the cv. CIM-1100 F2 population indicated possibilities of prompt and effective improvement in the seed cotton yield and yield attributing traits.
References Aguiar, P.A.D., J.C.V. Penna, E.C. Freire and L.C. Melo. 2007. Diallel analysis of upland cotton
cultivars. Crop Breed. & Appl. Biotech., 7: 353-359. Ahmad, R.T., I.A. Khan and M. Zubair. 1997. Diallel analysis for seed-cotton yield and its
contributing traits in Upland cotton (G. hirsutum L.). Ind. J. Agri. Sci., 67: 583-585. Ahmad, S., M.D. Khan, M. Hassan, L. Ali and L.H. Akhtar. 1996. Exploration of varietal
differences for some economic and quality characters in cotton (G. hirsutum L.). Pak. J. Pl. Sci., 2: 101-107.

DIALLEL ANALYSIS OF SOME TRAITS IN GOSSYPIUM HIRSUTUM 3021
Ashraf, M. and S. Ahmad. 2000. Genetic effects for yield components and fibre characteristics in upland cotton (Gossypium hirsutum L.) cultivated under salinized (NaCl) conditions. Agronomie, 20: 917-926.
Baloch, M.J., A.R. Lakho, H.U. Bhutto. A.M. Memon, G.N. Panhwar and A.H. Soomro. 2000. Estimates of combining ability and genetic parameters for yield and fibre traits in Upland cotton. Pak. J. Biol. Sci., 3: 1183-1186.
Godoy, A.S. and G.A. Palomo. 1999. Genetic analysis of earliness in Upland cotton (G. hirsutum L.). II. Yield and lint percentage. Neophyte, 105: 161-166.
Hassan, G., G. Mahmood, N.U. Khan and A. Razzaq. 1999. Combining ability and heterobeltiotic estimates in a diallel cross of cotton (G. hirsutum L.). Sarhad J. Agric., 15: 563-568.
Hayman, B.I. 1954. The theory and analysis of diallel crosses. Genetics, 39: 789-809. Hussain, B., A.A. Ghaffari, M.A. Amin and M.A. Khan. 1999a. Genetic Analysis of some
agronomic traits in cotton. J. Agric. Res., 37: 1-8. Hussain, B., M.A. Amin and M.A. Khan. 1998. Assessment of genetic mechanism in some
important quantitative parameters in G. hirsutum L. J. Agric. Res., 36: 313-319. Hussain, B., M.A. Amin and M.A. Khan. 1999b. Quantitative inheritance in cotton. J. Agric. Res.,
37: 109-115. Iqbal, M., R.S.A. Khan, K. Hayat and N.L. Khan. 2005. Genetic variation and combining ability for
yield and fiber traits among cotton F1 hybrid population. J. Biol. Sci., 5: 713-716. Khan, N.U. 2003. Genetic analysis, combining ability and heterotic studies for yield, its
components, fiber and oil quality traits in upland cotton (G. hirsutum L.). Ph.D Dissertation, Sindh Agric. Univ. Tandojam, Pakistan.
Khan, N.U., G. Hassan, M.B. Kumbhar and S.H. Ghaloo. 2005. Combining ability analysis for morphological and yield traits in intra G. hirsutum crosses. SAARC J. Agric., 3: 211-232.
Khan, N.U., G. Hassan, M.B. Kumbhar, A. Parveen, U. Aiman, W. Ahmad, S.A. Shah and S. Ahmad. 2007. Gene action of seed traits and oil content in upland cotton (G. hirsutum L.). Sabrao J. Breed. & Genet., 39: 17-30.
Khan, N.U., G. Hassan, M.B. Kumbhar, K.B. Marwat, M.A. Khan, A. Parveen, U. Aiman and M. Saeed. 2009. Combining ability analysis to identify suitable parents for heterosis in seed cotton yield, its components and lint % in upland cotton. Ind. Crops & Prod., 29: 108-115.
Luckett, D.J. 1989. Diallel analysis of yield components, fibre quality and bacterial blight resistance using spaced plants of cotton. Euph., 44: 11-20.
Mather, K. and J.L. Jinks. 1982. Biometrical Genetics (3rd Ed.) Chapman and Hall Ltd. London, UK, pp. 396.
McCarty, J.C., J.N. Jenkins and J. Wu. 2004a. Primitive accession derived germplasm by cultivar crosses as sources for cotton improvement: I. Phenotypic values and variance components Crop Sci., 44: 1226-1230
McCarty, J.C., J.N. Jenkins and J. Wu. 2004b. Primitive accession derived germplasm by cultivar crosses as sources for cotton improvement. II. Genetic effects and genotypic values. Crop Sci., 44: 1231-1235.
McCarty, J.C., J.N. Jenkins, B. Tang and C.E. Watson. 1996. Genetic analysis of primitive cotton germplasm accessions. Crop Sci., 36: 581-585.
Mei, Y.J., Z.H. Ye and Z. Li-Li. 2006. Genetic analysis for F1 yield traits with conditional approach in island cotton (Gossypium barbadense L.). Acta Gene. Sin., 33: 841-850.
Singh, R.K. and B.D. Chaudhary. 1979. Biometrical Methods in Quantitative Genetic Analysis. Kalyani Publishers Ludhiana & New Delhi, India. pp. 102-142.
Subhan, M., H.U. Khan and R. Ahmad. 2000. Comparison of the gene action controlling metric characters in Upland cotton (G. hirsutum L.). Pak. J. Biol. Sci., 3: 2087-2090.
Subhan, M., H.U. Khan and R. Ahmad. 2001. Population analysis of some agronomic and technological characteristics of Upland cotton (G. hirsutum L.) using diallel analysis. Pak. J. Biol. Sci., 1: 120-123.
Tahir, M.S., K. Alam, M.A. Chowdhry and J. Ahmad. 1995. Diallel analysis of some morpho-physiological traits in bread wheat (T. aestivum L.). Gomal Univ. J. Res., 15: 45-51.

NAQIB ULLAH KHAN ET AL.,
3022
Tang, B., J.N. Jenkins, C.E. Watson, J.C. McCarty and R.G. Creech. 1996. Evaluation of genetic variances, heritabilities, and correlation for yield and fiber traits among cotton F2 hybrid populations. Euph., 91: 315-322.
Tang, B., J.N. Jenkins, J.C. McCarty and C.E. Watson. 1993. F2 hybrids of host plant germplasm and cotton cultivars. 2. Heterosis and combining ability for fiber properties. Crop Sci., 33: 706-710.
Verhalen, L.M. and J.C. Murray. 1969. A diallel analysis of several fiber properties traits in upland cotton (G. hirsutum L.). Crop Sci., 9: 311-315.
Verhalen, L.M., R.C. Morrison, B.A. Al-Rawi, K.C. Fein and J.C. Murray. 1971. A diallel analysis of several agronomic traits in upland cotton for various characters of cotton (G hirsutum L.). Crop Sci., 11: 92-96.
Wu, J., J.N. Jenkins, J.C. McCarty and D. Wu. 2006. Variance component estimation using the additive, dominance, and additive x additive model when genotypes vary across environments. Crop Sci., 46: 174-179.
Yingxin, L.I. and H. Xiangming. 1998. Research on the combining ability and inheritance of 12 economic traits in upland cotton. China Cotton, 25: 9-11.
(Received for publication 20 July 2008)