diagnostics on gigabit speed serdes video...
TRANSCRIPT

Diagnostics on Gigabit Speed SerDesVideo Links
Master’s thesis in Master Programme Systems, Control and Mechatronics
SIMON LEHTONEN
Department of Signals and SystemsCHALMERS UNIVERSITY OF TECHNOLOGYGothenburg, Sweden 2017


Master’s thesis 2017:XX
Diagnostics on Gigabit Speed SerDes Video Links
SIMON LEHTONEN
Department of Signals and SystemsDivision of Communication Systems
Chalmers University of TechnologyGothenburg, Sweden 2017

Diagnostics on Gigabit Speed SerDes Video LinksSIMON LEHTONEN
© SIMON LEHTONEN, 2017.
Supervisor: Henrik Fagrell, CEO, Ph.D, Diadrom Systems ABAdvisor: Anver Hisham Unnichiriyath Siddique, Ph.D Student, Department ofSignals and SystemsExaminer: Thomas Eriksson, Professor, Department of Signals and Systems
Master’s Thesis 2017:XXDepartment of Signals and SystemsDivision of Communication SystemsChalmers University of TechnologySE-412 96 GothenburgTelephone +46 31 772 1000
Typeset in LATEXGothenburg, Sweden 2017
iv

Diagnostics on Gigabit Speed SerDes Video LinksSIMON LEHTONENDepartment of Signals and SystemsChalmers University of Technology
AbstractThe fast paced development of Advanced Driver Assistance Systems (ADAS) inthe automotive industry, boost the demand for ways of ensuring safe and reliablesystems. With the increased data speed of video links, connecting the high resolu-tion cameras with their Electrical Control Units (ECU), ADAS are becoming moresensitive to electromagnetic disturbances. Due to this sensitivity, the conditions ofvideo links in the car should be investigated continuously to ensure the safety andreliability.
The outcome of this thesis is the concept Simons Video Interference Check(SIVIC), which is designed to be a technique for diagnostics on video links. TheSIVIC concept is able to continuously record video link quality data, detect trendsof deteriorating behaviour, detect and distinguish multiple types of disturbances aswell as detect video link failures. The SIVIC concept was implemented as a proof ofconcept tested on two different test rigs based on the technology Gigabit MultimediaSerial Link (GMSL). One of the test rigs contained a parking assist camera, whichis developed to be included in a vehicle and representing a real system used in theautomotive industry. The video link failure detection was tested by real world testsin a lab at Research Institute of Sweden (RISE) and all other functionality weretested by using software. The SIVIC concept proves how a software module can beused to detect and predict data link failure of high speed automotive video links.
Keywords: ADAS, ASIL, SIVIC, CML, EMC, GMSL, SerDes, LVDS, UART
v


AcknowledgementsI would like to express my gratitude to Diadrom for providing me with the oppor-tunity to perform my master’s thesis at their company in a welcoming and inspiringenvironment. A special thanks to my supervisor Henrik Fagrell, Jonas Hellberg,Andreas Larsen and Tobias Rasmusson for your valuable input and support duringthe process. I would also like to thank Mikael Seger at RISE for letting me use theirlab and equipment and Matthew Coleman at Maxim Integrated for supplying mewith hardware and helping me with the test rigs.
My academic supervisor Anver Hisham has been very helpful in giving mefeedback on my report and I would like to thank him for that.
Simon Lehtonen, Gothenburg, 06 207
vii


Abbreviations
ADAS Advanced Driver-Assistance SystemsASIL Automotive Safety Integrity LevelCML Current Mode LogicCSV Comma Separated ValuesECU Electronic Control UnitEMC Electromagnetic CompatibilityEMI Electromagnetic InterferenceGMSL Gigabit Multimedia Serial LinkHDMI High-Definition Multimedia InterfaceLVDS Low Voltage Differential SignallingOSI Open Systems InterconnectionPRBS Pseudo Random Bit SequenceSerDes Serializer/ DeserializerSIVIC Simon’s Video Interference CheckSTP Shielded Twister PairUART Universal Asynchronous Reciever/TransmitterUSB Universal Serial Bus
ix

Contents
List of Figures xii
List of Tables xiii
1 Introduction 11.1 Purpose . . . . . . . . . . . . . . . . . . . . . . . . . . . . . . . . . . 21.2 Research question . . . . . . . . . . . . . . . . . . . . . . . . . . . . . 21.3 Delimitations . . . . . . . . . . . . . . . . . . . . . . . . . . . . . . . 2
2 Research Methodology 32.1 Design Science Research . . . . . . . . . . . . . . . . . . . . . . . . . 32.2 Literature Studies and Experiments . . . . . . . . . . . . . . . . . . . 4
3 Technical Background 53.1 GMSL . . . . . . . . . . . . . . . . . . . . . . . . . . . . . . . . . . . 53.2 CML . . . . . . . . . . . . . . . . . . . . . . . . . . . . . . . . . . . . 63.3 SerDes communication . . . . . . . . . . . . . . . . . . . . . . . . . . 73.4 UART . . . . . . . . . . . . . . . . . . . . . . . . . . . . . . . . . . . 73.5 Equalization and Preemphasis . . . . . . . . . . . . . . . . . . . . . . 83.6 Eye Pattern/Eye Diagram . . . . . . . . . . . . . . . . . . . . . . . . 83.7 Diagnostics . . . . . . . . . . . . . . . . . . . . . . . . . . . . . . . . 93.8 OSI Model . . . . . . . . . . . . . . . . . . . . . . . . . . . . . . . . . 103.9 EMC and EMI . . . . . . . . . . . . . . . . . . . . . . . . . . . . . . 113.10 Disturbances in an automotive environment . . . . . . . . . . . . . . 11
4 The SIVIC Concept 124.1 The Run Module . . . . . . . . . . . . . . . . . . . . . . . . . . . . . 124.2 The Shutdown Module . . . . . . . . . . . . . . . . . . . . . . . . . . 13
5 Proof of Concept 145.1 The Run Module Implementation . . . . . . . . . . . . . . . . . . . . 14
5.1.1 Read and write register data over UART . . . . . . . . . . . . 145.1.1.1 Write register . . . . . . . . . . . . . . . . . . . . . . 155.1.1.2 Read register . . . . . . . . . . . . . . . . . . . . . . 15
5.1.2 Usage profiles . . . . . . . . . . . . . . . . . . . . . . . . . . . 155.1.3 The implementation of signal data recording . . . . . . . . . . 165.1.4 Fault detection . . . . . . . . . . . . . . . . . . . . . . . . . . 18
x

Contents
5.1.5 Remedy link defects . . . . . . . . . . . . . . . . . . . . . . . 195.2 The Shutdown Module Implementation . . . . . . . . . . . . . . . . . 20
5.2.1 Calculations for analysis . . . . . . . . . . . . . . . . . . . . . 205.2.2 Trend analysis . . . . . . . . . . . . . . . . . . . . . . . . . . . 215.2.3 PRBS test and analysis . . . . . . . . . . . . . . . . . . . . . . 215.2.4 Thresholds for link quality . . . . . . . . . . . . . . . . . . . . 225.2.5 Warn when no longer dependable video link . . . . . . . . . . 22
6 Evaluation 236.1 Test Environment . . . . . . . . . . . . . . . . . . . . . . . . . . . . . 23
6.1.1 Test rig: parking assist camera . . . . . . . . . . . . . . . . . 236.1.2 Test rig: evaluation boards . . . . . . . . . . . . . . . . . . . . 256.1.3 GMSL built in error generation . . . . . . . . . . . . . . . . . 276.1.4 Transient disturbance injection at RISE . . . . . . . . . . . . 28
6.2 Tests for Evaluation . . . . . . . . . . . . . . . . . . . . . . . . . . . 296.2.1 Read and write register data over UART . . . . . . . . . . . . 296.2.2 Usage profiles . . . . . . . . . . . . . . . . . . . . . . . . . . . 296.2.3 Recording of parameter data during an active video link . . . 296.2.4 Fault detection . . . . . . . . . . . . . . . . . . . . . . . . . . 296.2.5 Effect of transient disturbances using RISE equipment . . . . 306.2.6 Temporarily remedy link defects . . . . . . . . . . . . . . . . . 306.2.7 Calculation for analysis . . . . . . . . . . . . . . . . . . . . . . 306.2.8 Trend analysis . . . . . . . . . . . . . . . . . . . . . . . . . . . 316.2.9 PRBS test and analysis . . . . . . . . . . . . . . . . . . . . . . 316.2.10 Thresholds for link quality . . . . . . . . . . . . . . . . . . . . 326.2.11 Warn when no longer dependable video link . . . . . . . . . . 32
6.3 Test Results . . . . . . . . . . . . . . . . . . . . . . . . . . . . . . . . 33
7 Discussion 36
8 Conclusion 39
9 Bibliography 40
A Appendix 1 I
xi

List of Figures
2.1 Design science research methodology [1]. . . . . . . . . . . . . . . . . 3
3.1 GMSL block diagram from a camera application. MAX9271 is theSerializer device and MAX9282A is the deserializer device in thispicture. The picture is from [2]. . . . . . . . . . . . . . . . . . . . . . 5
3.2 Typical structure of a CML transmitter and reciever from [3]. . . . . 63.3 Overview of SerDes using 8n/10b encoding from [4]. . . . . . . . . . . 73.4 UART data frame with start and stop bit from [5]. . . . . . . . . . . 83.5 Eye pattern diagram from [6]. . . . . . . . . . . . . . . . . . . . . . . 93.6 The OSI model from [7]. . . . . . . . . . . . . . . . . . . . . . . . . . 10
5.1 GMSL-UART protocol from [8]. . . . . . . . . . . . . . . . . . . . . . 145.2 Data Frame description. . . . . . . . . . . . . . . . . . . . . . . . . . 21
6.1 Overview of parking assist camera hardware. . . . . . . . . . . . . . . 246.2 Parking assist camera test rig. . . . . . . . . . . . . . . . . . . . . . . 256.3 Overview of evaluation board hardware. . . . . . . . . . . . . . . . . 266.4 Evaluation Boards Test Rig. . . . . . . . . . . . . . . . . . . . . . . . 276.5 Overview of evaluation board hardware with injected disturbances. . 28
A.1 Pulse A2-1 Contact Break and Bounce from [9]. . . . . . . . . . . . . IA.2 Pulse A2-1 in detail. Contact Break and Bounce from [9]. . . . . . . . IA.3 Pulse A2-2 Contact Break from [9]. . . . . . . . . . . . . . . . . . . . IIA.4 Pulse A2-2 Contact Bounce (Voltage) from [9]. . . . . . . . . . . . . . IIA.5 Pulse A2-2 Contact Bounce (Current) from [9]. . . . . . . . . . . . . IIA.6 Pulse timing sequence from [9]. T = 50 ms. (M2) . . . . . . . . . . . IIIA.7 Resulting transient sequence from [9]. T = 50 ms. . . . . . . . . . . . IIIA.8 Pulse Burst timing sequence from [9]. T = 50 ms. (M3) . . . . . . . . IIIA.9 Resulting transient Burst from [9]. T = 50 ms. . . . . . . . . . . . . . III
xii

List of Tables
5.1 Structure of parameter information structs. . . . . . . . . . . . . . . . 165.2 Data structure for storing internal data. . . . . . . . . . . . . . . . . 175.3 Data structure for storing external data. . . . . . . . . . . . . . . . . 18
6.1 Built in error generation functionality in MAX96705. . . . . . . . . . 276.2 Final result of all tests. . . . . . . . . . . . . . . . . . . . . . . . . . . 336.3 Result of Fault detection test using built in disturbance Feature. . . . 346.4 Effect of the induced transient errors on the evaluation board test rig
by equipment at RISE. . . . . . . . . . . . . . . . . . . . . . . . . . . 346.5 Effect of the induced transient errors on parking assist camera test
rig by equipment at RISE. . . . . . . . . . . . . . . . . . . . . . . . . 346.6 Result of calculation for analysis tests. . . . . . . . . . . . . . . . . . 356.7 Result of trend analysis tests. . . . . . . . . . . . . . . . . . . . . . . 35
xiii

1Introduction
All major car manufacturers are focusing on developing autonomous driving anddeveloping active safety features to include in their future car models. This meansthe need for data links for cameras and displays is rapidly increasing. A handfulof high end cars in today’s market are already equipped with more simple versionsof autonomous driving components and these features are rapidly becoming morecommon for manufacturers to offer as an addition while selling a car.
These systems enables great capabilities but also bring forth some issues. Acommon question asked by people in the industry is about the responsibility in caseof an accident, and there is no definite answer for that. For now, the driver ofthe car is liable for the possible accidents. But in the future, with changes in theregulations, the responsibility might shift to the car manufacturers. We have to waitand see.
Safety is a main focus in these systems and there are standards such asISO26262 [10] which contains requirements for how the electrical, electronic andsoftware should be developed for building safe systems. These standards are highlyimportant while developing autonomous driving systems, especially since the com-plexity of them is ever increasing. The manufacturers must be able to guaranteethat every part of the system is working properly and must ensure the safety. Thisthesis is about the system safety, and covering all parts of the system. This alsoincludes the high speed data links between the subsystems and camera applications.There is also a belief that the high speed video link is overlooked. The camera is oneof the main sensors used for autonomous drive and it is crucial to know its perfor-mance. Therefore diagnosis of the data link performance is necessary. The camerasystems are however covered in the ASIL requirements, hence the manufacturersof high speed data links have included functionalities enabling further diagnosticapplications [11].
With the increased usage of high resolution cameras, the need for data linkscapable of handling large amount of streamed digital video data has grown. Themanufacturers strive to minimize the cost and are required to fullfill standards suchas ISO26262 [10], steering them to use automotive specific video interface solutionsinstead of common consumer video interfaces such as High-Definition MultimediaInterface (HDMI). There is no shortage of video interface solutions and all of themoffer something which is worth considering while selecting one. It is common forthese interfaces to be based on current mode logic (CML) in the physical layer, whichtransmit the video data over a serial link by using a serializer and deserializer. Thisis called SerDes interfaces [11].
Inova Semiconductors APIX, Maxim Integrateds GMSL and Texas Instru-
1

1. Introduction
ments FPD-link are all similar versions of SerDes interfaces designed to be imple-mented in an automotive environment. All of these SerDes interfaces contain threemain components, a video channel, a control channel and power transmission to thecamera or display. All of these components can be transferred over a single fourwire or two wire shielded twisted pair (STP) cable which brings down the costs andavoid any need for multiple cables. In other solutions, three separate cables maybe needed for the same purpose. Both Inova Semiconductor and Maxim Integratedhave announced that as of the year of 2017, they are going to release new versionsof these protocols. Both of these are specific to handle link speeds up to 12 Gbit/senabling even more advanced sensors in the future at the cost of being more sensitiveto the disturbances.
This thesis uses hardware based on the Gigabit Multimedia Serial Link (GMSL)protocol. The main reason for this, is that Diadrom System AB already had an es-tablished connection with Maxim Integrated and also some evaluation boards fromthem. Due to the time constraints, the scope of this thesis is limited to only onetechnology.
1.1 PurposeThe purpose of this thesis is to explore if it is possible to build a diagnosing softwarefor analysis of high speed data links in future vehicles. The need for this kind ofsoftware will also be investigated.
1.2 Research questionThe main research question is:
• How can a software module using SerDes signals detect and predict data linkfailure.
By narrowing the problem the following topics are considered;• What kind of disturbances occur in a car that will affect the high speed data
links?• Is it possible to inflict disturbances on a CML link in a lab environment that
would emulate the real life disturbance behaviour?
1.3 Delimitations• The thesis only consider GMSL based data links from the semiconductor man-
ufacturer Maxim Integrated [12].• The thesis will only consider the built in fault detection parameters in the
GMSL serializers and deserializers while collecting and analyzing data.• The thesis only focuses on creating a software to use on the test hardware.
The software is not built to be implemented in a car, instead it is to be seenas a proof of concept.
2

2Research Methodology
2.1 Design Science ResearchThis thesis project is realized based on the design science research [1] which is aniterative methodology for applying research on information systems. This methodcontains five steps which are revisited throughout the project, which are depicted infigure 2.1.
Figure 2.1: Design science research methodology [1].
The first step in this method is called Awareness of the problem. Here the researcherbecomes knowledgeable about an interesting topic which is then formulated into aproposal for a new research endeavor.
The second step in this method is called Suggestion. Here the researcher usestheir current knowledge to form an experimental design with the purpose of solvingthe problem from the previous iteration. This design can be modified in futureiterations depending on how the project evolves.
The third step in this method is called Development. Here the researcher im-plements the experimental design and creates an artifact based on it. The researcheroften gains new knowledge during the implementation and it is possible to return tothe previous steps for further improvement of the proposal and experimental plan
3
2. Research Methodology
based on the recently gained insights.The fourth step in this method is called Evaluation. Here the researcher eval-
uates if the artifact developed in the previous step solves the research problem fromstep one. Possible deviations from the proposal have to be noted and explained. Ifthe researcher is unsatisfied with the result it is possible to go back to the previoussteps to reform and improve the proposal and experimental plan. These adjustmentsare based on the new knowledge gained by the researcher during the course of theproject.
In the final step Conclusion, the researcher studies the results of the researchproject and evaluates if it can be generalized and applied to similar situations. Theresearcher also analyses the results to see if it can be the basis of a proposal for afuture research endeavour.
2.2 Literature Studies and ExperimentsTo follow the methodology according to the design science research [1], the researcherhas to have knowledge about the topic at hand. To develop an understanding forthe area of low voltage differential signalling (LVDS) based communication andadvanced diagnostics, it is necessary to carry out literature studies in these subjectareas. The initial part of this thesis project contains literature studies on topicssuch as advanced diagnostics, LVDS, Universal Asynchronous Receiver/Transmitter(UART), Electromagnetic Compatibility (EMC) and disturbances in an automotiveenvironment. This has built a foundation of knowledge which was later used todevelop an experimental design in the suggestion step as well as implementation inthe development step of the design science research method.
Literature studies are not enough to completely understand something. It isoften helpful to perform some experiments on a system to study its behaviour.Parallel to the literature studies in the initial steps of the thesis project, someexperiments on the test hardware were also issued. These experiments were helpfulin creating a viable set of requirements for the suggestion phase of the design scienceresearch in section 2.1.
Experiments were also used in the evaluation phase for evaluating the qualityof the artifact generated in the development phase as well as for collecting a dataset used during the development of the artifact.
4

3Technical Background
3.1 GMSLIn the year 2008 Maxim Integrated [13] released Gigabit Multimedia Serial Link(GMSL) as a communication link for video applications in the automotive industry.GMSL is based on SerDes technology which means that it uses a serializer on thetransmitter side and a deserializer on the receiving side. It is specifically designed tobe used for Advanced Driver Assistance Systems (ADAS) and Camera MonitoringSystems (CMS) purposes [12]. It is able to provide video transfer speeds up to 3Gbit/s and it uses a STP or coaxial cables which are both inexpensive and veryrobust for EMC disturbances. On the physical layer of the OSI model GMSL usesCML.
Figure 3.1: GMSL block diagram from a camera application. MAX9271 is theSerializer device and MAX9282A is the deserializer device in this picture. The
picture is from [2].
GMSL includes a simplex video channel based on SerDes 8b10b and a duplexcontrol channel based on UART or I2C. The control channel is used for reading
5

3. Technical Background
and writing registers in both the serializer and deserializer devices. Even thoughthe video data is simplex, the control channel can send data both ways. GMSLis able to include both the video channel and the control channel on a single STPcable, moreover it is also able to supply a device with power over the same link.This is a key selling point for this system since the car manufacturers always striveto cut down the cost and weight. The serializer scrambles the video data with theforward control data and transmit them in the same frame. On the receiving end,the deserializer de-scrambles and decodes the data, then separates it into video dataand the control channel data again [8].
3.2 CMLCurrent Mode Logic (CML) is a widely used standard for serial signaling on physicallayer devices for data speeds more than 1 Gbit/s [3]. CML uses differential signalingand the transmitter includes a differential pair with a 50Ω resistor on each line. Ithas a voltage swing of 800 mV and is able to reach high data rates because of theoutput transistors being constant in the active region which enables fast switching.
The 50Ω resistors also add termination of the source while driving transmissionlines with 50Ω resistance. This limits the possible reflections in the transmission[3]. Figure 3.2 presents a simple diagram of a typical CML communication system.
Figure 3.2: Typical structure of a CML transmitter and reciever from [3].
6

3. Technical Background
3.3 SerDes communicationSerializer/Deserializer (SerDes) are devices used to transmit a parallel bit streamover one or a few high speed differential serial links by converting it into a serialbit stream [4]. The transmitter side of the communication houses the serializerand is responsible for compressing the parallel bit streams before sending over thedifferential serial link(s). The receiving end houses a deserializer and restores theserial bit stream into parallel bit streams again.
There exists multiple varieties of SerDes interfaces that use different clock im-plementations [14]. However, only SerDes using 8b/10b encoding will be coveredin this thesis. The encoding 8b/10b works by adding two bits to each data bytecreating a 10 bits symbol. The extra bits are used to make sure that the differencebetween the number of ones and zeros stays within the requested range for a chargebalanced data stream [15]. Figure 3.3 illustrates the basics of a SerDes communica-tion using 8b/10b encoding where two extra bits are added to the data byte beforethe transmission and then removed before deserializing the data byte.
Figure 3.3: Overview of SerDes using 8n/10b encoding from [4].
SerDes interfaces are widely used in automotive video applications and semiconduc-tor manufacturers such as Maxim Integrated [13], Inova Semiconductors [16] andTexas Instruments [17] all have thier own versions which are called GMSL, APIXand FPD-Link respectively. They are all based on CML technology and consist ofa video channel and an embedded control channel [11].
3.4 UARTUniversal Asynchronous Receiver/Transmitter (UART) is a protocol for serial com-munication used in computers and other electronics. UART uses SerDes and sinceit is asynchronous, i.e., it is not dependent on a clock signal from the receiver, in-stead the timings of the communication are decided right before the transmissionof the data [18]. UART uses start and stop bits to each data frame which marksthe beginning and end of each word. The start bit notifies the receiver that a dataframe is to be sent and synchronizes the clocks of the receiver and transceiver whichenables the communication. At the end of the transmission, the stop bit notifies thereceiver that the transmission has been completed. If the receiver does not obtain
7

3. Technical Background
a stop bit, it labels the transmitted data as faulty and discards it. A loss of a stopbit could be due to asynchronous clocks or external disturbances [18].
Since UART synchronizes the clocks of the devices with each data frame, thetransmission line can be idle when there is no data.
Figure 3.4: UART data frame with start and stop bit from [5].
3.5 Equalization and PreemphasisEqualization and Preemphasis are tools for compensating for signal deterioration[19]. Preemphasis is processing on the transmitting side and equalization is pro-cessing on the receiving side. Both are basically ways of filtering the signal tocompensate for the signal deterioration caused by the cable, thereby lowering thebit error rate [20].
3.6 Eye Pattern/Eye DiagramEye pattern measurements is a tool for measuring how good a link is at transferringdata at the physical layer of the OSI model [21]. An eye diagram is formed by takingthe sum of the samples from the high speed digital signal and superimposing the oneand zero bits and the associated transition measurements such as rise and fall times.Eye patterns can be used to measure jitter on the link as well as data reflectionscaused by inadequate termination. It is the opening of the eye which determines thelink quality. For optimal performance it would be 100% open, and when the link isexposed to disturbances, the opening will decrease making it harder for the systemto distinguish the rise and fall edges of the signal.
Figure 3.5 is an example of how an eye pattern diagram might look like. Thehorizontal eye opening is used for measuring the amount of jitter in the signal. Thewider the horizontal eye opening is, the less jitter is in the signal. Jitter can alsobe measured by looking at the thickness of the line of signals. The vertical eyeopening is used for measuring the difference between one and zero bits. The widerthe vertical eye opening is, the easier it is to detect the difference between ones andzeros [6].
8

3. Technical Background
Figure 3.5: Eye pattern diagram from [6].
3.7 DiagnosticsDiagnostics from a software developer’s perspective covers development, mainte-nance and upgrading of software components. A diagnostic software for an aftermarket implementation could include functions for reading and writing error codes,built in tests for verification, calibration and software download [16]. Diagnosticscover many areas and in the automotive industry there is a large demand for diag-nostic solutions in order to verify that all safety requirements and regulations arecovered. The application ADAS require some diagnostic components in order tofulfill the requirements set by standards such as ISO26262 [10].
9

3. Technical Background
3.8 OSI ModelThe Open System Interconnection-model (OSI) was developed to define a unifiedway for communication between computers and other electrical devices. It covershow devices should communicate with each other, ways of ensuring correct datarate as well as ensuring that the data is received by the intended recipient [7]. TheOSI model consists of 7 layers wherein the user interactions occurs in the top layer,known as the application layer. The bottom layer, the physical layer, is where theelectrical signalling occurs. The OSI model covers the entire range of computercommunications and Figure 3.6 presents the different layers of the OSI model witha brief description of each layer.
Figure 3.6: The OSI model from [7].
10

3. Technical Background
3.9 EMC and EMIThe concept of Electromagnetic compatibility (EMC) and Electromagnetic interfer-ence (EMI) should be first reviewed before moving on to the specifics of disturbancesthat affect CML interfaces.
All implementations of electrical systems and equipment are influenced by thetwo elements of EMC; emission and susceptibility. Both electrical systems and equip-ment radiate electromagnetic energy themselves and also pick up electromagneticenergy from other sources. During this process, errors may occur in the circuitrythat may lead to system failure. EMC is thus an important part of the electricalsystem design for limiting the emissions and susceptibility.
There are mainly two types of emitted interference: continuous interferenceand transient interference. Continuous interference covers signal sources which mayemit EMI for long periods of time, but often at a low magnitude. Some examplesof these disturbance sources could be television, radio receivers, medical equipment,computers and cellphones. On the other hand, transient disturbances are short,large magnitude disturbances which could be generated by, lightning, electrostaticdischarges or electrical motors. Electrical motors often causes repetitive short burstpulses.
Since electronic equipment are ubiquitous in the modern world, it is essentialthat all electrical systems are designed to radiate as little electromagnetic energy aspossible to reduce the impact of these systems on one another. There are regulatorybodies who develop standards and guidelines regarding for EMC requirements. Someof them are IEC, CISPR, FCC, and ISO. ISO regulations and requirements for theautomotive industry are the most relevant for this thesis.
Cars have a total emission limit which must be fulfilled by all systems together.It requires extensive testing as well as EMC limited designs for each subsystem.
3.10 Disturbances in an automotive environmentA modern car contains a vast network of microprocessor circuits and sensors withcommunication links in between. These electrical systems create radiated and con-ducted emissions which they are also susceptible to. EMC is thus an importanttopic while designing these systems in order to make them work and to follow theregulations stated by standards such as CISPR25. Hybrid and electrical vehiclescontain even more disturbance sources than a conventional car.
The electrical systems are designed to handle these transient and continuousdisturbances and should be able to work without being affected by the surroundingsystems. However, if there are malfunctions on some systems, for example, a brokenshield of a data link, the emissions could corrupt the transmitted data and causeerrors in that way.
11

4The SIVIC Concept
In this chapter, Simon’s Video Interference Check (SIVIC) concept will be presented.This concept is the result of an extensive literature study covering diagnostics of highspeed video link implementations in an automotive environment. The SIVIC conceptconsists of a set of requirements, which when they are met, provides a solution tothe research question stated in section 1.2. To meet these requirements, a generaldiagnostic software (from now on called the SIVIC application) for GMSL videolinks is developed. This software could in future be the basis for building a carspecific implementation for similar purposes. The requirements are a result of thesuggestion and development step in the design science research explained in section2.1.
The electronic control units (ECU) used in cars often have a very limited per-formance leaving no room to make advanced calculations during normal operations.As a diagnostic component for high speed video links could be quite memory andprocessing heavy, a solution could be to extract the more advanced tasks to be ex-ecuted at some other place or time. For the SIVIC concept, the more advancedtasks will be performed after shutdown of the video link, simulating the shutdownof a car. Since the normal tasks and operations of the ECU is not running aftershutdown, the SIVIC application is able to use more hardware processors. This sep-arates the SIVIC concept into two modules, the run module which encapsulates themore simple and more time critical requirements which can be performed during anormal link operation, and the shutdown module which contains the more advancedrequirements.
4.1 The Run ModuleThe run modules main tasks is to continuously extract and record data for futureuse in the shutdown module and to detect critical faults on the video link. The fol-lowing requirements describes the content in the run module of the SIVIC concept.
The SIVIC application shall be able to meet the following requirements:• REQ 1: Read and write register data to both the serializer and deserializer
side of the communication.
• REQ 2: Work of different test rigs.
• REQ 3: Continuously record internal and external parameters for diagnosticpurposes.
12

4. The SIVIC Concept
• REQ 4: Structure and store the recorded internal and external data.
• REQ 5: Detect both internal and external issues and critical faults by lookingthe recorded parameter data.
• REQ 6: Take actions to temporarily remedy link defects.
4.2 The Shutdown ModuleThe shutdown module’s main tasks is to use the data recorded by the run module tomake statistical analysis and find trends of video link performance. The followingrequirements describes the content in the shutdown module of the SIVIC concept.
The SIVIC application shall be able to meet the following requirements:• REQ 7: Make statistical analysis of recorded data.• REQ 8: Use statistical analysis for detecting trends.• REQ 9: Initiate built in test sequences during power down and compare the
results with the previous test sequences.• REQ 10: Determine thresholds for link quality.• REQ 11: Warn when the link quality is no longer trustworthy.
13

5Proof of Concept
This chapter describes the implementation of the SIVIC application developed tomeet the requirements of the SIVIC Concept. This chapter represents the develop-ment phase of the design science research methodology mentioned in section 2.1.
5.1 The Run Module ImplementationThis section covers the implementation of the SIVIC application to fulfill the re-quirements of the run module.
5.1.1 Read and write register data over UARTRequirement 1 in the SIVIC concept in section 4.1 states that the SIVIC applicationshall be able to read and write data to both the serializer and deserializer side ofthe communication. This requires communication between a computer and theserializer-deserializer circuits. The included control channel in GMSL, based onUART allows this to take place. By using the duplex UART protocol, it is possibleto read and write messages to the registers of both serializer and deserializer circuits.
This functionality is the the base of the SIVIC concept. It enables both datacollection for future analysis and immediate fault detection. Figure 5.1 presents howthe data packets are structured while writing and reading data from registers usingUART on GMSL. Each byte in the data frame is structured as a UART data frameaccording to Figure 3.4.
Figure 5.1: GMSL-UART protocol from [8].
14

5. Proof of Concept
5.1.1.1 Write register
The data package for writing to a register contains 6 parts:1. Sync byte2. Device address byte3. Register address byte4. Number of bytes5. Data bytes6. Acknowledgement byte
The sync byte makes sure that both circuits are ready to send information betweeneach other. The device address byte contains the address of the device (whetherit is the serializer or deserializer) on which the operations should be carried outon. The register address byte contains the address of the start register to whichthe data should be written. Number of bytes states how many bytes of data themessage contains. Data bytes contain the actual data to be written. If there aremore than one data byte, the successive bytes will be written to the next registerafter the register with register address byte. Finally, the acknowledgement byte issent from the device where the register writing have been carried out on alertingthat the process has been successful.
5.1.1.2 Read register
The data package for reading a register contains the same six parts as the writedata package, but in a different order. Figure 5.1 displays that the first four partsof the message is the same as when writing data. The difference here is that theacknowledgment byte comes directly after the device on which the operations arebeing carried out on, has received the number of bytes of data that is going to beread. The acknowledgement byte alerts that the read request have been understoodand then the data bytes follow in the order. If there has been a request to readmore than one data byte, the readout starts at the register specified in the registeraddress byte and then reads from the next register in order.
5.1.2 Usage profilesRequirement 2 in section 4.1 in the SIVIC concept states that the SIVIC applicationshall be able to work on different test rigs. To meet this requirement the SIVICapplication will have a usage profile for each test rig containing the test rig specificsettings and parameter information. These usage profiles is used in the other partsof the SIVIC application to specify which parameters can be recorded and whatother information is available to process. They are also used during every activesession of the video links to verify that everything is up and running correctly.
Parameter information
Each parameter in the usage profile will have an information struct related to it.Table 5.1 describes how this information struct could look like for two differentparameters. This struct contains information about its whereabouts such as the
15

5. Proof of Concept
type of content it is based on and to which usage profile it belongs to. There aremainly two different kind of data types, counter and toggle. The toggle data typeconsists of one bit which can be either 1 or 0. This is to flag when an unexpectedevent happens, such as too many packets have been re-transmitted, hence the maxre-transmission flag is set to 1. The counter data type on the other hand containsmultiple bits to include a larger set of numbers, often one byte. For the examplein table 5.1 the decoding error parameter is a counter which calculates the amountof detected bit errors since the last time the register was read. This can be a valuebetween 0 and 255.
Table 5.1: Structure of parameter information structs.
Information Bit error Max retransmissionParameter name: Bit error Max retransmissionSource: Deserializer SerializerRegister: 0x0D 0x16Type: Counter ToggleBytes: 1 1Bit: N/A 6Default: 0 0Min: 0 0Max: 255 1Data type: Integer IntegerUsage profile: PAC PAC
5.1.3 The implementation of signal data recordingRequirement 3 and 4 in section 4.1 in the SIVIC concept states that the SIVICapplication shall be able to continuously record internal and external parametersfor diagnostic purposes, structure the data and then store it. Since the parametercontents is going to be revisited during future analysis and evaluation, an externaldata storage implementation is used. The commonly used comma separated value(CSV) file type is chosen as it is a good way to store data in a structured way.
The parameter recording function operates continuously when the video linkis active. It receives a usage profile as explained in section 5.1.2 as an argumentwhich contains the parameters that are possible to read for out as well as containinginformation describing each of these parameters. The parameters are then monitoredone by one, and when the contents of a parameter has been recorded, the moduleshifts its focus to the subsequent parameter listed in the usage profile. When thelast parameter stated in the usage profile has been reached, the module starts overagain with the first one and continues until the video link is turned off.
To start the recording of a parameter, the parameter recording function loadsa struct as described in table 5.1 containing the associated information essential tobuilding a structured data log. By using the address and device information in thestruct, the module is able to read out the content of the parameter according tothe method explained in section 5.1.1.2. This content alone is not enough to make
16

5. Proof of Concept
future analysis since there are some other system status values which also shouldbe incorporated to the recorded data. These are time stamp, the active sessioncounter, timeout flag and fault detection flag. The time stamp is just a snapshotof the clock at the exact moment from when the content of the parameter was readout. This can be used to sort the data into specific increments with a very smallinterval. The active session counter is crucial for the future statistical analysis.Every time the video link is initiated, this counter is incremented by one. This givesthe possibility to sort the data into intervals from each use of the video link. This isuseful since the environment and disturbances can vary drastically depending on thewhereabouts of the car, which can change for each active session of the video link.The timeout flag is activated by the fault detection module described in section 5.1.4and is activated when the register readout according to section 5.1.1.2 has failed.The fault detection flag is also activated by the fault detection module. This isactivated when the parameter content is above a certain threshold indicating videolink failure.
When the content of the parameter has been read, and the surrounding valueshave been amassed, the recording module opens an external CSV file and appendsthis information below all the previous information stored in this file. If there areno previous recorded data, then the module creates a new file. Each parameter’scontent is logged in a separate file and table 5.2 is a sample of the recorded data ofdecoding errors. This presents the structure of how the contents are stored.
Table 5.2: Data structure for storing internal data.
Content Time Active sessioncounter
Timeoutflag
Faultdetected
0 Thu Apr 20 14:02:49 2017 1 0 00 Thu Apr 20 14:02:50 2017 1 0 023 Thu Apr 20 16:35:20 2017 2 0 020 Thu Apr 20 16:35:20 2017 2 0 0255 Fri Apr 21 10:20:10 2017 10 0 1255 Fri Apr 21 10:20:11 2017 10 0 1
External environment data can also be recorded by the choice of the user. Ex-ternal data can contain ambient temperature, barometric pressure, battery voltageand humidity. All of these parameters are recorded at the same time as the internalparameters. The environmental data is appended to the original internal data struc-ture depicted in table 5.2. Table 5.3 describes the fields which the original table willbe expanded with.
17

5. Proof of Concept
Table 5.3: Data structure for storing external data.
Ambienttemperature
Barometricpressure
Batteryvoltage Humidity
6 °C 1020 mb 12 V 68 %6 °C 1020 mb 12V 68 %6 °C 1020 mb 12 V 68 %6 °C 1020 mb 12 V 68 %15 °C 1005 mb 12 V 80 %15 °C 1005 mb 12 V 80 %
5.1.4 Fault detectionRequirements 5 in section 4.1 in the SIVIC concept states that the SIVIC applicationshall be able to detect both internal and external issues and critical faults by lookingat the recorded parameter data. This is to detect video link failure during linkoperation and thus opening up the possibility to alarm the user if the video linkis not reliable any more. To detect failure immediately, the parameters are sentthrough a fault detection process directly after they have been read from theirregister according to section 5.1.1.2, even before they are recorded and structuredaccording to section 5.1.3.
Depending on what test rig is in use, the fault detection process must beaware of the parameters to evaluate. Here the usage profile described in section 5.1.2containing parameter information is crucial for proper functionality. The parametersdiffer significantly, some indicate total video link failure while some indicate thatsomething may be wrong but the video link is still working properly. The faultscan be divided into three different communication levels. Each explained in it’s ownsection below.
Faults in the physical layer of the OSI model
The two most significant parameters for detection of critical errors contain informa-tion about cable faults and loss of video link lock. Both are of the data type toggledescribed in section 5.1.2, which means they are 0 during normal operation and 1when activated.
The cable fault parameter is activated if the cable of the video link in someway have been disconnected or shorted. If this would happen, then the video linkwould not work at all and can thus be seen as a critical fault. The video link lockparameter is activated if the serializer and deserializer looses their communicationlock due to too many errors in the communication. Video link lock means that boththe serializer and deserializer have a synchronized clock, enabling data transfer overthe video link. If there is no lock, no data can be transferred which can be seen asa critical fault.
Another parameter which contain more information about the general statusof the video link is the eye width monitor. The signal eye diagram is a tool foranalyzing the overall status of the video link. The eye width parameter is of thedata type counter described in section 5.1.2, and the parameter counter contains
18

5. Proof of Concept
information about how wide the eye diagram is compared to it being fully open.This is described in percentage. Minor faults on the video link could be discoveredthrough this parameter. If the video link is working properly and the eye width isnarrower than usual, then this could be an indication that something went wrong.Also if the eye diagram is very narrow, then critical faults have occurred.
Faults in the video link layer of the OSI model
There are also some parameters containing information which could be useful fordetection of video link faults on levels above the physical layer. In the video linklayer there are mainly three different parameters which contain information aboutthe video link status. The first parameter contains information about the numberof bit errors which have been detected on the video link. This is of the data typecounter and is basically just calculating the amount of bit errors since the last timeit has been read. This parameter can be used to detect when something may bewrong but the video link is still running. Also, if the number of bit errors detectedis greater than a certain threshold then it can be used to detect critical faults.
The second parameter detects when there has been a high number of attemptsto resend a symbol without succeeding. This is of the data type toggle and is ac-tivated if it detect high number of attempts. This can be used as an indicationof deteriorating link quality. The third parameter detects when there are largedeviations of the amount of pixels per line received over the video link. This basi-cally means the data transmission is inconsistent, therefore, can be used to indicatedeteriorating link quality. This is also of the data type toggle.
Faults in the transport layer of the OSI model
Issues can also be detected on even a higher levels of communication. If there aremany problems on the data transmission then there could be problems reading andwriting data to registers, basically because all messages contain bit errors. This isoften a problem of time, when it takes too long time to write or read the registers.If there are too many errors, then you can not deliver full write or read requests,which means the video link is not working.
5.1.5 Remedy link defects
Requirement 6 in section 4.1 in the SIVIC concept states that the SIVIC applicationshall be able to take actions to temporarily remedy link defects. This is for enablingvideo link usage until it has been repaired or replaced. Using the built in equalizationand preemphasis feature explained in section 3.5, the signal quality can be improvedby increasing the levels until the issues are decreased and the communication isworking on a good level again.
19

5. Proof of Concept
5.2 The Shutdown Module ImplementationThis section covers the implementation of the SIVIC application to fulfill the re-quirements of the shutdown module.
5.2.1 Calculations for analysisRequirement 7 in section 4.2 in the SIVIC concept states that the SIVIC applica-tion shall be able to make statistical analysis of the recorded data. To carry out thetrend analysis it is important to detect the different disturbances affecting the videolinks during each active session. Section 3.9 explains two kinds of major distur-bances; continuous and transient disturbances. For detecting these different kindsof disturbances, the data need to be analyzed in different ways.
Continuous disturbances are constantly affecting the video link which is beingexposed to it. If the disturbance level are at approximately the same level during anactive session, then the amount of bit errors generated and the measured eye widthwill be about the same level during the active session. By using the mean valueequation (5.1) on the level of bit errors and the eye width measurement, these twomean values can form a representation for severity of the continuous disturbancesduring the active session. The value x is the calculated mean value, n is the size ofthe data set and xi is each individual sample.
x =∑
i xi
n(5.1)
Transient errors are a bit harder to detect, they could appear periodically or sporad-ically. One thing high amplitude transient disturbances have in common is that theycan cause severe deviations in both bit errors and eye width measurement duringthe transient pulse. So the parameter values may vary significantly during a pulseand during normal operation. A way to measure if these transient disturbances haveoccurred during an active session of the video link is by calculating the standarddeviation according to equation (5.2) which is a measurement of the spread of therecorded parameter data. The parameter s is the calculated standard deviation, xis the mean value of the data set, xi is each individual sample and n is the size ofthe data set.
s =√∑
i(xi − x)2
n − 1 (5.2)
If the video link would be exposed to both continuous and transient errors duringan active session, then both the calculated means and standard deviation can beused together to detect this.
As external factors such as temperature and humidity could affect the perfor-mance of the video link, the mean and standard deviation can also be calculatedfor these during an active session enabling future analysis of correlation. For everyactive video link session, the amount of detected critical faults and failed registerread/ write commands are summed up for comparison to other active video linksessions.
20

5. Proof of Concept
5.2.2 Trend analysisRequirement 8 in section 4.2 in the SIVIC concept states that the SIVIC applicationshall be able use statistical analysis for trend detection. Here the mean values,standard deviations and sum of faults from section 5.2.1 are used and compared tothe corresponding values of previous active video link sessions.
Trends are often a change over time but they can come in many different shapesand sizes. To cover rapidly developed trends, trends developed over a long time andtrends which is somewhere in between these two, a method named frame analysiswas developed. A frame is basically the combined data from multiple adjacent activevideo link sessions. This data is then analyzed using the mean value equation (5.1)and standard deviation equation (5.2) to get the mean and standard deviation ofthe total frame. To cover these different trends, frames of different sizes are used.To detect rapidly developed trends, a short frame consisting of two or three activevideo link sessions are compared to the previous frame of the same size. To detectfairly developing trends, a medium frame consisting of five to seven active video linksessions are compared to the previous frame with the same size. To detect trendsdeveloped over a long time, a long frame consisting of 10 to 15 active video linkssessions are compared to the previous frame with the same size. Figure 5.2 presenthow the frames are built and differ from each other.
Figure 5.2: Data Frame description.
5.2.3 PRBS test and analysisRequirement 9 in section 4.2 in the SIVIC concept states that the SIVIC applica-tion shall be able to initiate built in test sequences during power down and comparethe result with previous test sequences. This is a good way to examine the statusof the video link after detecting deteriorating behaviour in the trend analysis. TheGMSL serializer and deserializer circuits have a built in pseudo random bit sequence(PRBS) function for performing video link tests. When activated, it switches fromthe regular video transmission mode and the serializer, instead sends a pseudo ran-dom bit stream which the deserializer analyzes and calculates the amount of detectedbit errors.
To fulfill this requirement, the SIVIC application upon detecting an inactivevideo link, starts this PRBS function for a specified duration by the user. Afterwardsit reads the register with the amount of detected bit errors and stores it in a CSV
21

5. Proof of Concept
file. The amount of detected bit errors during this test is then compared to theprevious PRBS test results. If there are any detected bit errors during this PRBStest, then the video link is probably broken.
5.2.4 Thresholds for link qualityRequirement 10 in section 4.2 in the SIVIC concept states that the SIVIC applicationmust be able to determine thresholds for link quality. This comprises thresholdsfor detected bit errors and the width of the eye diagram to detect critical faults.The user of the SIVIC application shall easily be able to change these thresholds.Before every active video link session, the SIVIC application will print the currentthresholds and then the user can decide if they want to change the thresholds bywriting the new threshold values in the console. If the user does not want to changethe existing threshold, then he/she can input "no" in the console which will keep thecurrent threshold values and continue the SIVIC application.
5.2.5 Warn when no longer dependable video linkRequirement 11 in section 4.2 in the SIVIC concept states that the SIVIC applicationshall be able to warn when the link quality is no longer dependable. The PRBS testis a raw test of the serial link without any other factors weighing in. If the PRBStest detects errors, then the SIVIC application will print a message stating that theserial link is not reliable any more and should be inspected.
22

6Evaluation
In this chapter the evaluation step of the design science research was performed.Here the artifact developed during the development stage will be analyzed to see ifit solves the research problem of the thesis.
6.1 Test EnvironmentThis section discusses the hardware specifics of the test rigs as well as the disturbancesources.
6.1.1 Test rig: parking assist cameraThe main test rig used in this thesis was previously built by Diadrom as a proof ofconcept for a parking assist camera. It contains a camera with a GMSL serializer ofmodel MAX96705 [8] and an ECU with a GMSL deserializer of model MAX9288 [22].The ECU is also connected to an image grabber enabling the computer to receivethe video from the camera. Figure 6.1 shows an overview of the parking assistcamera system and how the parts are interconnected. The computer containingthe SIVIC application is connected to the MAX9288 circuit by using a UniversalSerial Bus (USB) cable for UART called FTDI. This cable is used to send read andwrite commands over the control channel of the GMSL link. The computer is alsoconnected to the image grabber with a regular USB cable in order to send the videofrom the camera to the computer. The serializer and deserializer is connected via aSTP cable which in this test rig is the high speed automotive video link. Figure 6.2depicts the parking assist camera test rig.
23

6. Evaluation
Figure 6.1: Overview of parking assist camera hardware.
This test rig allows fault detection with the following parameters: bit error detection,pixel per line error, line fault detection, loss of video link lock and max retransmissionerrors. The qualities of these parameters are explained below.
Bit error detection
This parameter stores the amount of detected bit errors on the serial link. Bit errorsare detected by using the 8b/10b encoding/decoding and the 1 bit parity.
Pixel per line error
This parameter raises a flag if the amount of pixels per line in a data enable highperiod deviate more than ±4 pixels compared to the previous pixel count. Enablingthis flag suggests that there may be disturbances on the serial link.
Line fault detection
This parameter contains information about the status of the physical serial link. Itdetects if the cable in some way is disconnected or shorted.
Loss of video link lock
This parameter raises a flag if the deserializer looses the video link lock which meansthat the serializer and deserializer is no longer in sync. The system looses video linklock when too many bit errors are detected.
24
6. Evaluation
Max retransmission errors
This parameter raises a flag if the serializer tries to resend a packet eight timeswithout succeeding over the UART control channel. This is an indication that thesystem may be exposed to disturbances.
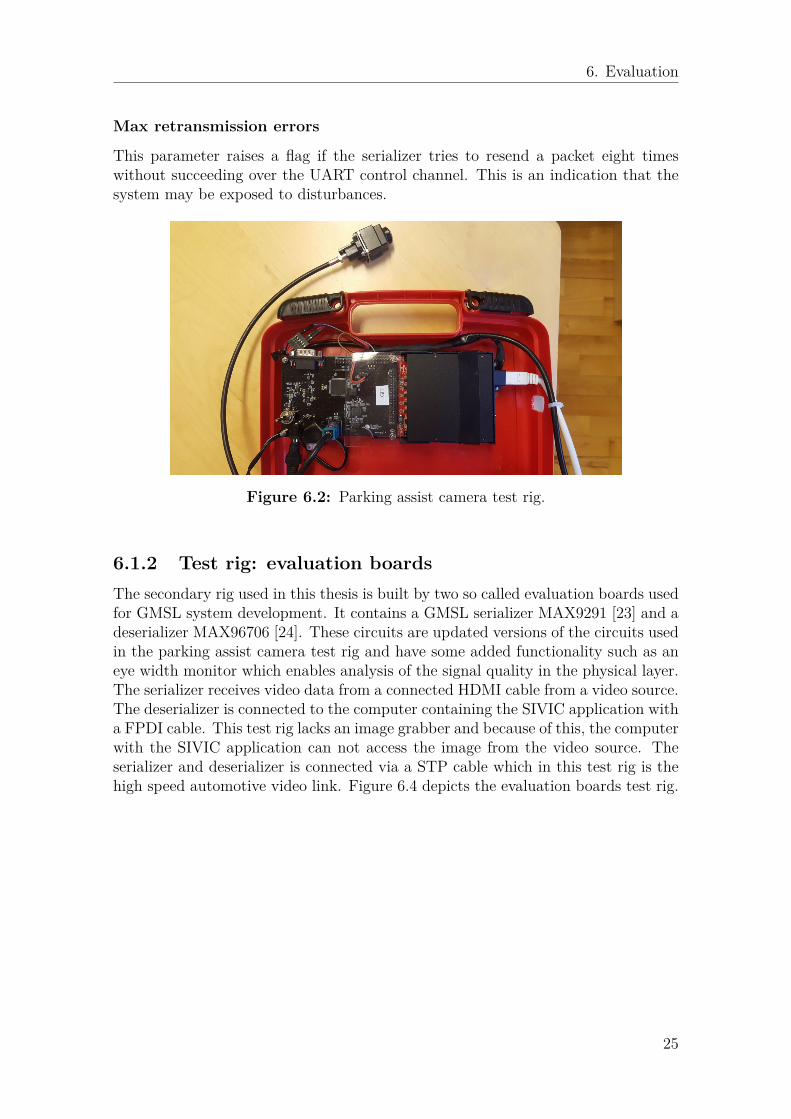
Figure 6.2: Parking assist camera test rig.
6.1.2 Test rig: evaluation boardsThe secondary rig used in this thesis is built by two so called evaluation boards usedfor GMSL system development. It contains a GMSL serializer MAX9291 [23] and adeserializer MAX96706 [24]. These circuits are updated versions of the circuits usedin the parking assist camera test rig and have some added functionality such as aneye width monitor which enables analysis of the signal quality in the physical layer.The serializer receives video data from a connected HDMI cable from a video source.The deserializer is connected to the computer containing the SIVIC application witha FPDI cable. This test rig lacks an image grabber and because of this, the computerwith the SIVIC application can not access the image from the video source. Theserializer and deserializer is connected via a STP cable which in this test rig is thehigh speed automotive video link. Figure 6.4 depicts the evaluation boards test rig.
25
6. Evaluation
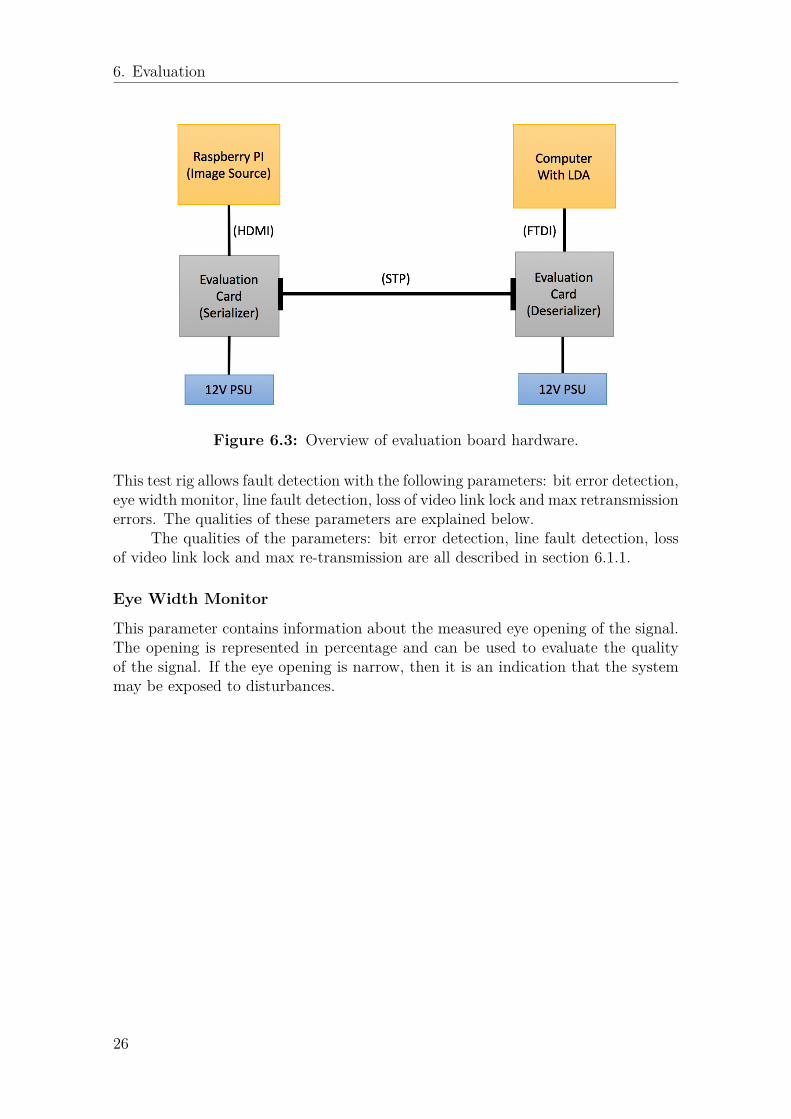
Figure 6.3: Overview of evaluation board hardware.
This test rig allows fault detection with the following parameters: bit error detection,eye width monitor, line fault detection, loss of video link lock and max retransmissionerrors. The qualities of these parameters are explained below.
The qualities of the parameters: bit error detection, line fault detection, lossof video link lock and max re-transmission are all described in section 6.1.1.
Eye Width Monitor
This parameter contains information about the measured eye opening of the signal.The opening is represented in percentage and can be used to evaluate the qualityof the signal. If the eye opening is narrow, then it is an indication that the systemmay be exposed to disturbances.
26

6. Evaluation
Figure 6.4: Evaluation Boards Test Rig.
6.1.3 GMSL built in error generationSome versions of the GMSL serializer and deserializer cards have an included er-ror generation function for performing tests on the video link. This enables thedeveloper to inflict bit errors of different magnitudes and lengths to the regulardata transmission. This is a useful feature for development of diagnostic softwaresince it enables disturbance injection on the video link without the need for externalhardware.
The serializer circuit MAX96705 [8] in the camera of the parking assist cameracontains this feature. Table 6.1 contains the settings for the error generating functioninside MAX96705. All of these settings can be combined which makes it possibleto generate 4 ∗ 4 ∗ 4 = 64 types of errors. The error generation feature is activatedby writing a message to a register in MAX96705, containing the error generationsettings combined with information used for enabling the feature. To deactivate thefeature, a message to disable the feature is sent to the same register.
Table 6.1: Built in error generation functionality in MAX96705.
Error generation rateError frequenzy 2560 bits 40,960 bits 655,360 bits 10,485,760 bits
Error generation typeError size Single-bit 2 8b/10b symb 3 8b/10b symb 4 8b/10b symb
Error generation countError quantity Continous 16 errors 128 errors 1024 errors
Periodic Error Generation enableError mode Random generation of errors Periodical generation of errors
27

6. Evaluation
6.1.4 Transient disturbance injection at RISEResearch Institute of Sweden (RISE) [25] contributed to this thesis by supplyingboth hardware and a lab environment to carry out tests for evaluation of the SIVICapplication. The hardware consists of a transient immunity test generator of modelRCB200N1 [26] and a test fixture for inducing these disturbances on the test rigs[9]. This hardware is able to conduct tests of unintended transient disturbancescaused by coupling of two adjacent wires according to the standard RI 130 [9].These disturbances are emitted by components such as electrical motors containingelectrical switching.
The standard includes two different transient pulses A2-1 and A2-2, which canbe generated in by either a pseudo random timing sequence or pseudo random bursts.These generation patterns and pulses are shown in appendix A. The different pulsescombined with the generation patterns make it possible to generate four differentkinds of transient disturbances. These are described in the standard [9].
Figure 6.5 presents how the transient generating hardware is connected tothe evaluation board test rig without including the details. It is connected to theparking assist camera test rig in the same way, over the STP cable. A copper wireconnected to the transient generator passes through the test fixture and then intothe test generator again for termination of the signal. Inside of the test fixture, thiscopper wire is positioned right next to the STP cable of the test rig in order toinduce the disturbances.
Figure 6.5: Overview of evaluation board hardware with injected disturbances.
RI 130 have a rigorous specification for how these tests should be set up and per-formed. All the steps except one is followed. The standard suggests that the shieldof a STP cable should be broken and the cable should be untwisted in order to onlyinject the transient disturbance on one of the internal cables. Unfortunately thevideo link immediately looses its functionality when the shield is broken. Insteadthe transient disturbances were injected on a unbroken STP cable.
28
6. Evaluation
6.2 Tests for EvaluationThis section includes test description for tests performed in order to evaluate thequality of the implementation of the SIVIC application.
6.2.1 Read and write register data over UARTTo evaluate if the implementation of the SIVIC application is able to fulfill require-ment 1 of the SIVIC concept, a test is done where read and write commands are sentto registers in both the serializer and deserializer. The read register functionality istested by reading the content from two different registers, one in the serializer andone in the deserializer. The result of these readouts are then compared to the con-tents specified in the data sheets to verify a correct readout. The read register testis passed if both register have been successfully read and the contents are verifiedto be correct.
The write register functionality is tested by first reading contents from twodifferent registers, one in the serializer and one in the deserializer. The reason forreading the content of these registers is to verify that they do not already containthe same message which is going to be written to them. After the verification of thecontents, a message will be written to these registers. They will then be readoutonce again and the contents is compared to the write message to verify if it has beenwritten correctly. The write register test is passed if the message were successfullywritten to the registers.
6.2.2 Usage profilesTo evaluate if the implementation of the SIVIC application is able to fulfill require-ment 2 of the SIVIC concept, a test is conducted where the user switches betweenthe test rigs and writes only one command to the SIVIC application to specify whattest rig is in use. The test is passed if the SIVIC application is able to change all therelevant settings for setting up the different test rigs by only receiving one commandby the user.
6.2.3 Recording of parameter data during an active videolink
To evaluate if the implementation of the SIVIC application is able to fulfill re-quirements 3 and 4 of the SIVIC concept, a test where the video link is active for 30seconds and all fault detection parameters is recorded and stored. The test is passedif the SIVIC application is able to record and store all fault detection parametersassociated to the test rig in use according to the structure described in section 5.1.3.
6.2.4 Fault detectionTo evaluate if the implementation of the SIVIC application is able to fullfill require-ment 5 of the SIVIC concept, a test where the worst disturbance possible to generate
29

6. Evaluation
with the built in error generation feature explained in 6.1.3 is injected in the parkingassist camera test rig. This disturbance generates continuous errors of four 8b/10bsymbols every 2560 bit periodically for 30 seconds. The test is passed if the SIVICapplication is able to use the fault detection implementation to detect the criticalfaults during this test.
6.2.5 Effect of transient disturbances using RISE equipmentTo evaluate how the disturbances generated by the equipment described in section6.1.4 affect the GMSL link and also see how the fault detection implementationworks with real life disturbances, a series of tests were performed. These are nottests to fullfill any requirements of the SIVIC concept. It is instead used to evaluatehow the test rigs are affected by the injected real life disturbances by using the faultdetection implementation. There will be four tests where the different transientdisturbances explained in 6.1.4 will be injected on the video link during an activevideo link session. There will also be a test where the shield of the video link isbroken during an active video link session.
The test 1 will expose the video link with pulse A2-1 in a pseudo random timingsequence during an active session. Test 2 will also use the A2-1 pulse but changethe sequence to pseudo random bursts. Similarly, test 3 will use the A2-2 pulse ina pseudo random timing sequence and test 4 will use the pulse A2-2 with pseudorandom bursts. These four tests combined cover the range of the transient inducingequipment. Test 5 would check how the SIVIC application handles a broken shieldof the video link cable during an active video link session. Since the goal of thesetests are not to fullfill any requirements, there is no pass or fail.
6.2.6 Temporarily remedy link defectsTo evaluate if the implementation of the SIVIC application is able to fullfill require-ment 6 of the SIVIC concept, a test where the test rigs are exposed to continuouserrors of two 8b/10b symbols every 10,485,760 bit periodical by using the built inerror generation functionality. The test is passed if the SIVIC application is able touse equalization and pre-emphasis to make the serial link more robust and decreasesthe amount of bit errors.
6.2.7 Calculation for analysisTo evaluate if the implementation of the SIVIC application is able to fullfill require-ment 7 of the SIVIC concept, a series of tests will be performed to analyze if thestatistical analysis implementation is able to detect and differentiate between con-tinuous and transient disturbances. The Built in error generation feature describedin section 6.1.3 will be used to generate the disturbances. To test the continuousdisturbance detection, an error sequence that has the error frequency four 8b/10bsymbol errors in every 10,485,760 bit, generated continuously in a periodical patternwill be introduced on the video link.
To test the transient disturbance detection, an error sequence that forms antransient disturbance is built by inducing two 8b/10b symbols every 2560 bit for
30

6. Evaluation
16 times. This is one transient pulse and will be inflicted on the video link twotimes during a start up. To tests if the SIVIC application is able to detect if thesystem is exposed to both continuous and transient disturbances at the same time,the first and second test will be combined into a third test. The tests are passedif it is possible to distinguish transient and continuous disturbances by using thestatistical methods described in section 5.2.1.
6.2.8 Trend analysisTo evaluate if the implementation of the SIVIC application is able to fullfill require-ment 8 of the SIVIC concept, a series of tests will be performed to analyze if thetrend analysis implementation is able to detect fast, slow and medium changingtrends. The built in error generation feature described in 6.1.3 is used to generatethe disturbances.
To test rapidly developing tests, a test sequence divided into two parts isintroduced. The first part includes two active video link sessions in a consecutiveorder, forming a short frame with a disturbance of 1 bit error every 10,485,760 bitcontinuously over both sessions. The second part also contains two active videolink sessions in a consecutive order but they all are exposed to a slightly worsedisturbance. They are all exposed to a disturbance of four 8b/10b symbols in every10,485,760 bit continuously in a periodical pattern.
To test fairly developing trends, a test sequence almost exactly like the test forfast trends are introduced. The only difference is that, this test uses five consecutiveactive video link sessions in a row instead of two, forming a medium frame.
To test trends developed over a long time, a test sequence almost exactly likethe test for fairly developing trends are introduced. the only difference is that thistest uses ten consecutive active video link sessions in a row instead of five, forminga long frame. The tests are passed if the SIVIC application is able to detect anincrease in disturbances over the frames.
6.2.9 PRBS test and analysisTo evaluate if the implementation of the SIVIC application is able to fullfill require-ment 9 of the SIVIC concept, a test where transient disturbances will be injectedon the high speed video link during a PRBS test. The transient disturbance will begenerated by the equipment in the lab at RISE and will consist of a A2-1 pulse inpseudo random burst sequence. The test is passed if the SIVIC application succeedswith the following requirements. It is able to launch a PRBS test after an activevideo link session where bit errors have been detected. It is able detect bit errorsduring this PRBS test from the induced disturbance, and it is able to compare theamount of detected bit errors with the result from previous PRBS tests.
31

6. Evaluation
6.2.10 Thresholds for link qualityTo evaluate if the implementation of the SIVIC application is able to fullfill require-ment 10 of the SIVIC concept, a test is conducted where the user of the SIVICapplication is requested to change the threshold for fault detection of bit error de-tection and eye width monitor. The test is passed if the change of thresholds aresuccessful.
6.2.11 Warn when no longer dependable video linkTo evaluate if the implementation of the SIVIC application is able to fullfill require-ment 11 of the SIVIC concept, a test where the test rigs are exposed to continuouserrors of two 8b/10b symbols in every 40,960 bits periodically by using the built inerror generation functionality is performed. An error of this quantity will disablethe functionality of the video link and make it non dependable. The test is passedif the SIVIC application is able to detect the critical faults and print a message tothe user stating that the link is exposed to high disturbances, hence unreliable.
32

6. Evaluation
6.3 Test Results
This section covers the results of the tests for each part of the SIVIC applicationdescribed in section 6.2. The result of the more critical parts of the SIVIC applicationwill be described in detail while the results of the remaining parts will is show onlyin table 6.2.
Table 6.2: Final result of all tests.
Requirement Test Passing acceptancecriteria
Req: 1 Read and write registerdata over UART Yes
Req: 2 Usage profiles Yes
Req: 3 & 4 Recording of parameter dataduring and active video link Yes
Req: 5 Fault detection Yes
Req: 6 Temporarily remedy linkdefects No
Req: 7 Calculation for analysis YesReq: 8 Trend analysis YesReq: 9 PRBS test and analysis YesReq: 10 Thresholds for link quality Yes
Req: 11 Warn when no longerdependable video link Yes
Recording of parameter data during an active video link
The SIVIC application was able to record every fault detection parameter in eachtest rig about 3.3 times in every second resulting in about 100 samples over the 30second test. The SIVIC application was able to store everything according to thestructure described in section 5.1.3 without mixing the data meaning it has passedthe test.
Fault detection
Table 6.3 comprises the results of the fault detection test. As the SIVIC applicationis able to read every parameter content about 3.3 times in every second. It means fora 30 second test, the SIVIC application is able to read the contents about 100 times.With a disturbance of this level, the video link is practically useless. The Faultdetection have registered 99 critical errors of a high number of detected bit errors aswell as 91 failed register read/ write commands. The fault detection implementationis able to detect the critical faults, therefore, the test is passed.
33

6. Evaluation
Table 6.3: Result of Fault detection test using built in disturbance Feature.
Fault detection parameters Built in error generation testDetected bit errors 99Detected loss of video link lock 2Detected max retransmissions 0Detected failed read orwrite commands 91
Effect of transient disturbances using rise equipmentTable 6.4 and 6.5 includes the results of the transient tests induced by the equipmentat RISE. By looking at the results, a conclusion can be drawn that the evaluationboard test rig is much more susceptible for external disturbances while the parkingassist camera is practically not affected at all. Both detect a line fault error duringthe broken cable shield test, which resulted in a broken communication.
Table 6.4: Effect of the induced transient errors on the evaluation board test rigby equipment at RISE.
Fault detection parameters Test 1 Test 2 Test 3 Test 4 Test 5Detected bit errors 3 2 13 12 0Detected narrow eye width 43 32 71 73 0Detected loss of video link lock 44 29 67 64 0Detected max re transmissions 2 1 3 3 0Detected failed read orwrite commands 0 0 3 2 0
Detection of line faults 0 0 0 0 1
Table 6.5: Effect of the induced transient errors on parking assist camera test rigby equipment at RISE.
Fault detection parameters Test 1 Test 2 Test 3 Test 4 Test 5Detected bit errors 0 0 0 0 0Detected loss of video link lock 0 0 0 0 0Detected max retransmissions 0 0 0 0 0Detected pixel per line deviations 1 0 0 0Detected failed read orwrite commands 3 0 0 0 0
Detection of line faults 0 0 0 0 1
34

6. Evaluation
Calculations for analysisThe table 6.6 includes the results from the tests of the calculation for analysisimplementation. From the continuous disturbance test, the mean value of detectedbit errors is quite high but the standard deviation is low. However, from the transienttest, the mean value of detected bit errors is low but the standard deviation is quitehigh. From the combined continuous and transient disturbance test, both meanvalue and standard deviation are quite high suggesting that the system is exposedto both transient and continuous disturbances if compared to the results from theprevious tests. It is possible to distinguish between the two different disturbancesby using only mean values and standard deviation, therefore, the tests are passed.
Table 6.6: Result of calculation for analysis tests.
Statistic resultsof bit errordetection
Continuousdisturbancetest
Transientdisturbancetest
Combineddisturbancestest
Mean Value 44.40 5.09 55.68Standard Deviation 3.70 35.28 29.33
Trend analysisTable 6.7 includes the result from tests for the trend analysis implementation of theSIVIC application. The SIVIC application is able to detect an increase of about 80%bit errors over the frames for all of the tests. The SIVIC application is thus able todetect fast, medium, slow changing trends by corresponding frames respectively. Ithas fulfilled the requirement and thus passed the test.
Table 6.7: Result of trend analysis tests.
Fault detection parameters Detected difference in bit errorsover two frames
Fast trend test 84 % more bit errors in second frameMedium trend test 80 % more bit errors in second frameLong trend test 79.3 % more bit errors in second frame
Temporarily remedy link defects
The SIVIC application was not able to change the Equalization and Preemphasislevels and thus it has not passed the test.
35

7Discussion
The goal of this thesis is to explore if it is possible to build a diagnosing softwarefor analysis of high speed data links in future vehicles. By following the researchmethodology based on iterative steps called design science research as an approach,a software named Simons video interference check was developed. I proved thatan diagnostic application with this functionality is in fact possible to build, andobserved that the experience of using this iterative methodology is very positive.In the light of the knowledge gained during the preparation of this thesis, it waspossible to go a few steps back in terms of design and development of the softwarethereby resulting in a better final product.
The final version of the SIVIC application is robust and is able to performdiagnostics of the data link. By storing the parameter data in separate CSV filesfor each different parameter, mix up of data was absolutely impossible. This wayof storing the data also created a structure which was easy to use and easy to findinformation from. The thesis was limited to only use data from the fault detec-tion parameters which proved to be enough to analyze the link quality. However,the eye width monitor is the only parameter supplying information about the linkquality directly from the raw data signal. All other parameters relied on the un-derlying features implemented by Maxim Integrated such as detection of too manyre-transmitted symbols and detected bit errors. The eye width monitor allows theuser of the GMSL link to make one’s own analysis while the other parameter forcesone to trust that the system is able to detect all errors and issues on the data link.
Unfortunately, I only gained access to the evaluation board test rig with theeye width monitor feature in the final weeks of the thesis. All analysis were devel-oped around the other fault detection parameters implying that the full potentialof the eye width monitor is not fully used. Although the analysis still fullfill itsrequirements without any problems. The choice of the frame analysis for the trenddetection is good and it is able to detect different levels of trends. The choice ofmean value and standard deviation for disturbance detection is a good, workingapproach when only using the bit error detection functionality. By using the eyewidth monitor, more advanced statistic analysis could be introduced. Unfortunatelyi lacked the time to further research this myself.
The implementation of a run module and a shutdown module worked welland is a way to limiting the amount of processing power needed in a ECU. TheECUs in modern cars are already occupied with their current tasks leaving no roomto add processing heavy link diagnostics. Prolonging the heavy analysis to aftershutdown of the car, when no other process is running is a way to include morefeatures covered by a ECU without the need of upgrading the hardware, meaning
36

7. Discussion
no increase in production cost.Working on this thesis have made me realize that there is a need for diagnostic
applications like the SIVIC application in future cars. With the increased sensitivitydue to higher data transfer speeds and the more trust we put in these system to driveus around, it is very important to know that every part of the system is workingproperly. It is not easy to simulate real world disturbances to test systems duringdevelopment. Disturbances can vary dependent on the environment and a car isexposed to different EMI levels if it is driving along side a power line, inside a cityor out on the country side. It is hard to know exactly what disturbances existsin these environment but there exist standards that specify how the more crucialdisturbances should be generated and some of them are specified in the standardRI 130. RISE allowed me to use one of their labs and equipment to induce thedisturbances covered by RI 130. By using this equipment, I was able to induce realtransient disturbances to the test rigs and test how they are affected and understandif the SIVIC application detects any disturbances. From the tests where i used acable with a broken shield, the data link didn’t work at all. With data links of thistype, they may be so sensitive that a small break in the shield renders the entiredata link useless. It is then not useful to analyze if the cable is slowly breaking moreand more by using a diagnostic software. Software like the SIVIC application caninstead be used for detection of high disturbances emitted by other adjacent systemsin a car. If some system starts emitting to much disturbances all of a sudden. Thenmaybe some other systems will detect it also.
During the tests at RISE some interesting test results evolved. The parkingassist camera test rig was hardly affected by the disturbances compared to theevaluation board test rig which were certainly affected. Both of them used the samecable and were exposed to the same test sequence. By interviewing an expert ofSerDes based data links, it appears as if the test rigs don’t have the same abilityto filter out disturbances in the cable shield which is why the different sensitivitiesoccur. Neither of the test rigs are designed to be EMI resistant making them extrasusceptible to disturbances. The data links used in production wouldn’t be affectedby these disturbances since they are designed to be more resistant.
The built in error generation feature is a good tool while working with theGMSL data links. It can be used to get to know how the link reacts to distur-bances and it could be used to evaluate how well different implementations work, allwithout having access to lab environment and disturbance generating equipment.This feature was a widely used throughout the development phase as I had a limitedamount of lab time. I only had access to a lab for one day to inflict real disturbanceson the link. With more access to a lab, more analysis of how the data link reacts todisturbances could have been researched.
It was hard to determine the thresholds for when the data link is not credibleany more. To get a kind of indication of how many bit errors the link could handlewithout affecting the video data content, the parking assists camera test rig wereexposed to disturbances on different levels. While analyzing the video stream Inoticed some small fractures in the picture at around 120 bit errors per second.However the systems using the video stream may be able to handle a higher amountof fractures in the picture and then can have a higher threshold.
37

7. Discussion
All requirements but one was reached. Unfortunately i didn’t succeed in chang-ing the equalization and preemphasis levels to counteract the disturbances inducedon the data link. I believe that the failure to reach this goal is due to the narrowtime limits of the thesis. The SIVIC application, however, is able to perform it’smain tasks and can be seen as a working data link diagnostic application.
The contents of this thesis could be used as a foundation for future work.Future researchers could look at the possibility to add a software like the SIVICapplication to existing ECUs in cars. The SIVIC application could also be modifiedto work with other data links such as APIX of FPD-Link. The disturbance detectionand trend analysis can also be further researched to produce more reliable andadvanced methods by using the eye width monitor. One other topic which can beexpanded is the data storage solution. With the increased amount of data it isimportant to have a good approach to structure and store it. A possible solutioncould be to upload it to a cloud service.
38

8Conclusion
The evaluated SIVIC concept proves a way to use SerDes signals to detect andpredict data link failure. The SIVIC application is able to fullfill the requirements setup in the concept development except for one, the temporary link remedy. Howeverthis is not a crucial functionality of the software, making the SIVIC application stillable to accomplish its purpose of analyzing the link quality. The chosen statisticalmethods are able to detect the different types of disturbances affecting the systemand the trend analysis is able to detect changes in the disturbance levels over time.The fault detection part of the SIVIC application is able to detect when a data linkfailure occurs.
The theoretical contribution of this thesis addresses 11 requirements that solves11 aspects and provides a solution valid for any SerDes link. The practical contribu-tion is the implementation and evaluation of SIVIC, and its adaptability for a shortterm industrial implementation.
39

9Bibliography
[1] V. Vaishnavi and B. Kuechler, “Design research in information systems.” http://desrist.org/design-research-in-information-systems, 2004. [Online,Accessed 3-April-2017].
[2] M. Integrated, “28-bit gmsl deserializer for coax or stp cable.” https://www.maximintegrated.com/en/products/interface/high-speed-signaling/MAX9272A.html. [Online, Accessed 17-April-2017].
[3] C. Perform, “A comparison of cml and lvdsfor high-speed serial links.” http://www.cypress.com/file/74011/download, 2002. [Online, Accessed 17-April-2017].
[4] M. Peffers, “Get connected: Serdes demystified.” https://e2e.ti.com/blogs_/b/analogwire/archive/2014/05/08/get-connected-serdes-demystified, 2014. [Online, Accessed 4-April-2017].
[5] K. B. Kevin Sidwar, “A web developer’s guide to communication pro-tocols (spi, i2c, uart, gpio).” https://tessel.io/blog/108840925797/a-web-developers-guide-to-communication-protocols, 2015. [Online, Ac-cessed 17-April-2017].
[6] IBM-Redbooks, “Eye diagrams,” in Understanding Optical Communications,IBM Coorporation, 1998.
[7] Tech-Faq, “The osi model – what it is; why it matters; why it doesn’t mat-ter..” http://www.tech-faq.com/osi-model.html, 2016. [Online, Accessed17-April-2017].
[8] M. Integrated, “Max96705 16-bit gmsl serializer with high-immunity/bandwidth mode and coax/stp cable drive.” https://datasheets.maximintegrated.com/en/ds/MAX96705.pdf. [Online, Accessed 17-April-2017].
[9] “FMC1278electromagnetic compatability specification for electrical/electroniccomponents and subsystems,” standard, Ford, Oct. 2016.
[10] “ISO 26262-6:2011 road vehicles- functional safety- part 6: Product develop-ment at the software level,” standard, Swedish Stadard Institute, Stockholm,Sweden, Nov. 2011.
[11] R. Gutzmer, “Video interface technology,” in Handbook of Camera Monitor Sys-tems (A. Terzis, ed.), pp. 235–275, Springer International Publishing Switzer-land, 2016.
[12] M. Integrated, “Gigabit multimedia serial link (gmsl) serdes ics.” https://www.maximintegrated.com/en/products/interface/high-speed-signaling/gmsl.html, 2017. [Online, Accessed 7-March-2017].
40

9. Bibliography
[13] “Maxim integrated.” https://www.maximintegrated.com/en.html.[14] Tech-FAQ, “What is the function of serdes?.” http://www.tech-faq.com/
serdes.html, 2016. [Online, Accessed 4-April-2017].[15] C. University, “Lab 2 - 8b/10b encoder.” http://www.cs.cornell.edu/
courses/cs3410/2013sp/lab/lab2.html, 2013. [Online, Accessed 4-April-2017].
[16] “Inova semiconductor.” https://www.inova-semiconductors.de/en/.[17] “Texas instruments.” http://www.ti.com/.[18] F. Durda, “Serial and uart tutorial.” https://www.freebsd.org/doc/en/
articles/serial-uart/, 2014. [Online, Accessed 17-April-2017].[19] C. Yilmazer, “An introduction to preemphasis and equalization in maxim gmsl
serdes devices, howpublished =.”[20] V. Telang, “Equalization for high-speed serdes, howpublished =.”[21] A. Corporation, “Understanding eye pattern measurements.” https://dl.
cdn-anritsu.com/en-us/test-measurement/files/Application-Notes/Application-Note/11410-00533.pdf. [Online, Accessed 27-May-2017].
[22] M. Integrated, “Max9288 3.12gbps gmsl deserialziers for coax or stp inputand mipi csi2 output.” https://datasheets.maximintegrated.com/en/ds/MAX9288-MAX9290.pdf. [Online, Accessed 24-May-2017].
[23] M. Integrated, “Max9291/max9293 3.12gbps gmsl serializers for coax or stpoutput and hdmi input.” https://datasheets.maximintegrated.com/en/ds/MAX9291-MAX9293.pdf. [Online, Accessed 25-May-2017].
[24] M. Integrated, “Max96706 14-bit gmsl deserializer with coax or stp cable input.”https://datasheets.maximintegrated.com/en/ds/MAX96706.pdf. [Online,Accessed 25-May-2017].
[25] “Rise.” https://www.ri.se/.[26] emtest, “Rcb 200n1 transient immunity test generator meeting ford
fmc1278 and emc-cs-2009.1.” http://www.emtest.com/products/product/135120100000011403.pdf. [Online, Accessed 23-May-2017].
41

AAppendix 1
Transient pulses and timing sequences possible to generate with RCB200N1 [26].
Figure A.1: Pulse A2-1 Contact Break and Bounce from [9].
Figure A.2: Pulse A2-1 in detail. Contact Break and Bounce from [9].
I

A. Appendix 1
Figure A.3: Pulse A2-2 Contact Break from [9].
Figure A.4: Pulse A2-2 Contact Bounce (Voltage) from [9].
Figure A.5: Pulse A2-2 Contact Bounce (Current) from [9].
II

A. Appendix 1
Figure A.6: Pulse timing sequence from [9]. T = 50 ms. (M2)
Figure A.7: Resulting transient sequence from [9]. T = 50 ms.
Figure A.8: Pulse Burst timing sequence from [9]. T = 50 ms. (M3)
Figure A.9: Resulting transient Burst from [9]. T = 50 ms.
III