diagnostic neutron activation system for kstar - iopscience
TRANSCRIPT

Journal of Instrumentation
Diagnostic neutron activation system for KSTARTo cite this article M S Cheon et al 2012 JINST 7 C05009
View the article online for updates and enhancements
You may also likeDesign and performance of shatteredpellet injection systems for JET andKSTAR disruption mitigation research insupport of ITERLR Baylor SJ Meitner TE Gebhart etal
-
Interpretation of suprathermal emission atdeuteron cyclotron harmonics fromdeuterium plasmas heated by neutralbeam injection in the KSTAR tokamakB Chapman RO Dendy SC Chapmanet al
-
Enhanced understanding of non-axisymmetric intrinsic and controlled fieldimpacts in tokamaksY In J-K Park YM Jeon et al
-
Recent citationsInvestigation of the capsule detectionmethod at the irradiation end of the ITERneutron activation systemMunSeong Cheon et al
-
Development of neutron activation systemon EASTKai Li et al
-
Pre-conceptual study of the EuropeanDEMO neutron diagnosticsM Cecconello et al
-
This content was downloaded from IP address 21910037237 on 22102021 at 2050
2012 JINST 7 C05009
PUBLISHED BY IOP PUBLISHING FOR SISSA MEDIALAB
RECEIVED December 22 2011REVISED March 22 2012ACCEPTED April 5 2012
PUBLISHED May 16 2012
2nd INTERNATIONAL WORKSHOP ON FAST NEUTRON DETECTORS AND APPLICATIONSNOVEMBER 6ndash11 2011EIN GEDI ISRAEL
Diagnostic neutron activation system for KSTAR
MS Cheon1 YS Lee AC England HS Kim S Pak CR Seon and HG Lee
National Fusion Research InstituteGwahangno 169-148 Daejeon 305-806 Korea
E-mail munseongnfrirekr
ABSTRACT The Korea Superconducting Tokamak Advanced Research (KSTAR) device has be-gun deuterium plasma operation and increased neutron generation from D-D fusion reaction in theplasma is expected as the heating power of the plasma increases A neutron activation system uti-lizing the pneumatic transfer of encapsulated metal samples has been implemented to monitor thefusion neutron source strength and the total fusion power from the KSTAR plasma The prototypepneumatic transfer system for the ITER neutron activation system was slightly modified to be usedfor KSTAR and a High Purity Germanium (HPGe) detection system was used to count gammaphotons from the activated samples The Monte Carlo code MCNP and the inventory code FIS-PACT were also used for the calculations to evaluate the total number of neutrons emitted from theD-D fusion reactions in the KSTAR plasma The analysis of data from an activation measurementobtained from the 2011 KSTAR campaign shows the neutron flux at the irradiation station was22times108 cmminus2sminus1 and the total neutron yield was 47times1013 ns for a typical NBI-heated H-modeKSTAR plasma shot
KEYWORDS Nuclear instruments and methods for hot plasma diagnostics Neutron detectors(cold thermal fast neutrons)
1Corresponding author
ccopy 2012 IOP Publishing Ltd and Sissa Medialab srl doi1010881748-0221705C05009
2012 JINST 7 C05009
Contents
1 Introduction 1
2 Instrumentation 221 Pneumatic transfer system 222 Counting system and controller 3
3 Measurement experiment 4
4 Analysis 741 Monte-Carlo analysis model 742 Results 7
5 Conclusions 9
1 Introduction
The Korea Superconducting Tokamak Advanced Research (KSTAR) tokamak is a fusion researchdevice using superconducting coils for long pulse operation [1] Since the first plasma operation in2008 the performance of the KSTAR plasma has been upgraded with the help of auxiliary heatingsystems such as neutral beam injection (NBI) heating electron cyclotron heating (ECH) and ioncyclotron resonance heating (ICRH) KSTAR has begun deuterium plasma operation and increasedneutron generation from D-D fusion reactions in the plasma is expected as the heating power ofthe plasma increases The current performance of the KSTAR auxiliary heating systems in 2011campaign is listed in table 1
Neutrons from Ohmically heated KSTAR plasmas were detected for the first time in 2010using a sensitive 3He detector although the relation between measured neutron rate and D-D reac-tion rate was not identified clearly [2] New neutron diagnostic systems such as a fission chamberstilbene spectrometers and a neutron activation system have been installed at KSTAR for moreaccurate detection of neutrons from the KSTAR plasmas Among the neutron diagnostics whichare installed at KSTAR the main purpose of the neutron activation system is the measurement ofthe neutron fluence and the average neutron flux to the first wall With the help of neutron transportanalysis it is possible to evaluate the total average neutron source strength and also the total aver-age fusion power because the neutrons generated from the fusion reactions carry a fixed portion ofthe fusion energy in the form of their kinetic energy As a reliable and robust tool for the neutronyield measurement the neutron activation system can be used for the calibration of other neutrondiagnostics
The neutron activation system utilizes the method of pneumatic transfer of encapsulated metalsamples to the in-vessel irradiation station and counting of gamma photons from the activated sam-ples which have been irradiated by the neutrons from plasma This method has been successfully
ndash 1 ndash
2012 JINST 7 C05009
Table 1 Auxiliary heating performance of KSTAR in 2011
Heating system PerformanceECH 170 GHz 800 kW 10 sICRH 30 MHz 10 MW 10 sNBI 100 keV 16 MW 10 s
used for the neutron yield measurement at various tokamaks such as JET [3] TFTR [4] and JT-60U [5] A neutron activation system of this type will also be implemented at ITER [6 7] and isunder development at the National Fusion Research Institute (NFRI) A design of the pneumatictransfer system for the ITER neutron activation system has been developed and is under optimiza-tion through prototype tests The design for ITER is used for the KSTAR experiment with slightmodifications The main cause of the modification is the total neutron source strength of KSTARwhich is expected to be much less than that of ITER The expected maximum neutron sourcestrength of KSTAR is around 1016 ns which is four orders of magnitude less than that of ITERSo the capsule size for the KSTAR experiment was increased from the ITER design to containmuch heavier samples ie more than 10 grams The layout of the neutron activation system for theKSTAR is shown in figure 1
2 Instrumentation
21 Pneumatic transfer system
The pneumatic transfer system of the neutron activation system transfers capsules between thecapsule loading machine irradiation station counting station and disposal bin Polyethylene tubesare connected from those locations to the transfer station which is called a lsquocarouselrsquo and thedistribution of the capsules is done by the rotation of the carousel When the capsule in the carouselis properly located at the entry of the designated location the pneumatic valve behind the entryopens to transfer the capsule to the location Photo-sensors attached at various positions along thecapsule transfer routes are used to monitor the current capsule location One Programmable LogicController (PLC) controls all the valves sensors actuators in the pneumatic transfer system andalso the servo-motor for the carousel rotation High pressure nitrogen gas of about 4ndash5 bars is usedfor the capsule transfer and system operation The entire system is sealed pneumatically from theoutside environment except for the gas exhaust
The irradiation station is located inside the vacuum vessel close to the plasma The structurefor the irradiation station is made of two parallel stainless steel tubes which are connected at theirradiation station to form a gas circulation circuit It is installed at the lsquoFrsquo equatorial port of theKSTAR looking at the plasma in the tangential direction The length of the structure from thevacuum flange to the irradiation station is 27 m A supporter for the irradiation station is weldedon the surface of the vacuum vessel wall and holds the structure The irradiation station and thesupporter are electrically isolated using PLAVIST M a polymer material which has good propertiesat high temperature to avoid the formation of an electrical loop An air-cushion design is applied
ndash 2 ndash
2012 JINST 7 C05009
Figure 1 Layout of the neutron activation system for the KSTAR Capsules are transferred between theirradiation station at level D0 and the counting system at level D3 of the main experimental hall via thepneumatic transfer system
for the irradiation station to reduce the capsule speed near the end of the transfer The installedirradiation station is shown in figure 2
The counting station consists of a gamma photon detector inside a lead shield The structurefor the counting station is made of coaxial double stainless steel tubes It is designed to be ableto move vertically so that the distance from the detector surface can be varied according to theactivation level of the irradiated samples The disposal bin is a lead-shielded metal box to keepencapsulated samples after the operation Some samples which have relatively short decay timeand low radioactivity can be reused after enough cooling inside the disposal bin An air-cushiondesign was also applied both for the counting station and the disposal bin
The capsule is made of polyethylene with diameter of 28 mm and length of 50 mm The cap-sule transfer line between the irradiation station and the transfer station is made of a polyethylenetube whose inner diameter is 32 mm and the length of the transfer line is about 20 m
22 Counting system and controller
A High Purity Germanium (HPGe) detector system is used for the counting system of the neutronactivation system The counting system consists of an ORTEC-GEM25 series HPGe detector and
ndash 3 ndash
2012 JINST 7 C05009
Figure 2 Irradiation station installed at F equatorial port of KSTAR
computer-based multichannel analyzer (MCA) card system which can reproduce the gamma rayspectra by using the program Gamma Vision 50 (EGampG ORTEC) The energy resolution of thedetector is 177 keV full width at half maximum (FWHM) at the 133 MeV peak of 60Co Thedetector is shielded by a 10-cm thick lead and cooled by an electrical cooler to reduce radiationand thermal noise Energy and efficiency calibrations of the counting system were performed usingstandard gamma sources ie 109Cd (8803 keV) 57Co (1221 keV) 137Cs (66163 keV) and 60Co(11732 and 13325 keV)
The control software of the pneumatic transfer system is installed on the same computer onwhich the gamma spectrum analysis program is installed The control software was developedusing National Instruments LabVIEWT M for easy control of the pneumatic transfer system Thelocal control computer and the PLC of the pneumatic transfer system communicate with each otherby an Ethernet connection Thus the remote and simultaneous operation of the pneumatic transfersystem and gamma spectrometer is possible by accessing to the local control computer through theKSTAR local area network (LAN) The pneumatic transfer system and counting system installedat KSTAR is shown in figure 3
3 Measurement experiment
A neutron measurement experiment was performed for the KSTAR plasma operation shot 6303A plasma current auxiliary heating parameters and the neutron rate data from the uncalibrated fis-sion chamber for this shot are shown in figure 4 The plasma was heated by ECH and NBI and anL-H mode transition was observed during this shot Because the fission chamber data show therewas neutron generation during the NBI heating of the plasma beam-target reactions between theinjected high energy neutral beam and the plasma seems to be the most dominant source of the
ndash 4 ndash
2012 JINST 7 C05009
Figure 3 Pneumatic transfer and counting system of the neutron activation system
neutron production for this discharge The neutron activation system was used to measure theseneutrons
An indium sample was used for the activation experiment Indium undergoes mainly two re-actions when it is irradiated by a neutron flux ie 115In(nnrsquo)115mIn and 115In(nγ)116mIn Betweenthese two reactions the 115mIn line was chosen for the evaluation of the neutron flux because itis due to a threshold reaction with Eth=03 MeV and shows a high cross section around 25 MeVThus a sensitive measurement of fusion neutrons with relatively small contributions of photoneu-trons generated from the runaway electrons is possible by counting the 115mIn line An indiumsample of 1145 g was encapsulated and transferred to the irradiation station before shot 6303The activated indium sample was retrieved to the transfer station after the shot and transferred tothe counting station The gamma photons from the sample were counted for 40000 seconds af-ter 2 hours of cooling in order to obtain good statistics and to avoid noise from the other plasmadischarges The obtained pulse height spectrum from this counting is shown in figure 5
From the pulse height spectrum the 115mIn peak (336 keV) was clearly identified and thenumber of counts from the peak area was obtained with the statistical error of plusmn11 After thecorrection of the cooling and counting time effect the specific activity of the sample right after theirradiation was estimated to be 219 Bqg One of the significant sources of error in the measure-ment is the ambiguity of the capsule position during the irradiation because the current design ofthe irradiation station does not include the in-vessel positioning sensor This problem will be over-come from next yearrsquos KSTAR operation by changing the design of the irradiation station slightlyto put the in-vessel sensor
ndash 5 ndash
2012 JINST 7 C05009
Figure 4 Plasma current auxiliary heating parameters and fission chamber data (uncalibrated) for shot6303
Figure 5 Pulse height spectrum of activated indium sample for shot 6303
ndash 6 ndash
2012 JINST 7 C05009
Figure 6 CAD design and material specification for KSTAR Monte-Carlo model
4 Analysis
41 Monte-Carlo analysis model
A Monte-Carlo model for KSTAR was developed for the analysis of the neutron activation systemmeasurement data A three-dimensional computer-aided design (CAD) of the KSTAR was con-verted into an input file for the Monte-Carlo calculation using the interface program MCAM [8]This model is an upgraded version of the existing model [9] which was developed for the evaluationof the absorbed doses at various parts of the KSTAR The CAD design and material specificationfor the new model is shown in figure 6
This model is a 90 section of the KSTAR considering the symmetry of both the vacuumvessel and in-vessel components It consists of the cells for the superconducting coils such as thecentral solenoid (CS) toroidal field (TF) coils and poloidal field (PF) coils and the other tokamakstructures such as the vacuum vessel cryostat and in-vessel components The over simplificationin the cell geometries and material specifications in the old model was improved as much as possi-ble to reflect the real situation Because the most important location in the analysis of the neutronactivation system data is the irradiation station the in-vessel components which are close to theirradiation station are included in much details in the model to enhance the accuracy of the neu-tron transport calculations The in-vessel components that the new model includes are the graphiteplasma facing components (PFC) passive stabilizers poloidal limiters neutral beam shine-througharmour and in-vessel control coils (IVCC)
42 Results
A neutron transport and activation calculation was performed for the data analysis of the neutronactivation system A Monte-Carlo N-Particle transport code MCNP5 [10] and an activation codeFISPACT-2007 [11] were used for the analysis The neutron spectrum at the irradiation station wasachieved by running the MCNP code using the developed KSTAR model The attenuation effect bythe structure of the irradiation station itself was also taken into account The detailed MCNP model
ndash 7 ndash
2012 JINST 7 C05009
Figure 7 Horizontal view of MCNP model near the irradiation station
including the structure of the irradiation station in the horizontal plane and the neutron spectrumobtained from the MCNP calculation are shown in figure 7 and figure 8 respectively
The neutron spectrum obtained from the MCNP calculation is used as an input for the FIS-PACT calculation With the information of the neutron spectrum at the irradiation station and thematerial to be irradiated the FISPACT calculates the relation between the neutron flux at the irra-diation station and the activity of the 115mIn (336 keV) line The resultant neutron fluence at theirradiation station during the shot 6303 was calculated to be 131times109 ncm2 Thus the averageneutron flux at the irradiation station would be 22times108 ncm2s assuming the neutrons were gen-erated only during the NBI heating ie 6 seconds according to the fission chamber data TheMCNP calculation can also provide the relation between the neutron flux at the irradiation stationand the total neutron yield from the whole KSTAR plasma According to the MCNP calculationthe average total neutron yield for the shot 6303 was estimated to be 47times1013 ns
The statistical error of the measured sample activity was estimated to be about 5 mainlyfrom the counting error (sim1) and the detector efficiency error (sim5) The systematic error ofthe analysis consists mainly of the MCNP statistics (sim2) material cross-section (sim4) and mod-elling which has not been estimated yet Aside from the geometry and neutron source descriptionerror in the MCNP model the most significant source of error comes from the ambiguity of thecapsule position during the irradiation as mentioned in section 3 The result of the MCNP calcu-lation shows about 06 cm error would be induced if the capsule position is wrongly determinedfrom the designated irradiation station which can cause serious underestimation in the total neutronyield evaluation Therefore a design change of the current configuration of the irradiation stationis strongly required for the reliable measurement and error analysis in the future
ndash 8 ndash
2012 JINST 7 C05009
Figure 8 MCNP calculated neutron spectrum at the irradiation station
5 Conclusions
The first experimental estimation of the neutron source strength of the KSTAR plasma was per-formed using the neutron activation system By using indium as a sample material and by countingthe 115mIn line selectively it was possible to evaluate the neutron fluence and the average neutronflux at the irradiation station and the average total neutron yield from the KSTAR plasma Analy-sis of the results from the MCNP and the FISPACT calculation showed the average neutron flux tothe first wall was about 22times108 ncm2s and the average total neutron yield was 47times1013 ns forshot 6303 which was a typical NBI-heated H-mode KSTAR plasma shot According to the mea-surement data accumulated during 2011 KSTAR campaign it is estimated the typical total neutronsource strength the campaign was in the order of 1012 sim1013 ns
Acknowledgments
This work was supported by the Ministry of Education Science and Technology of Korea throughthe ITER project contract This work was carried out using computer software which is known asFISPACT-2007 for calculating the activation of materials irradiated in a neutron flux The ownerof FISPACT-2007 is UKAEA The pneumatic transfer system for this work was fabricated andinstalled with the help of VMT Co Ltd
References
[1] GS Lee et al The KSTAR project an advanced steady state superconducting tokamak experimentNucl Fusion 40 (2000) 575
[2] AC England et al Neutron emission from KSTAR Ohmically heated plasmas Phys Lett A 375(2011) 3095
[3] ON Jarvis et al Use of activation techniques for the measurement of neutron yields from deuteriumplasmas at the Joint European Torus Fusion Tech 20 (1991) 265
ndash 9 ndash
2012 JINST 7 C05009
[4] CW Barnes AR Larson G LeMunyan and MJ Loughlin Measurement of DT and DD neutronyields by neutron activation on the Test Fusion Test Reactor Rev Sci Instrum 66 (1995) 888
[5] M Hoek T Nishitani Y Ikeda and A Morioka Neutron yield measurements by use of foil activationat JT-60U Rev Sci Instrum 66 (1995) 885
[6] MS Cheon S Pak HG Lee L Bertalot and C Walker In-vessel design of ITER diagnosticneutron activation system Rev Sci Instrum 79 (2008) 10E505
[7] MS Cheon CR Seon S Pak HG Lee L Bertalot and RA Forrest Operational radioactivityevaluation of ITER diagnostic neutron activation system IEEE Trans Plasma Sci 38 (2010) 274
[8] FDS TEAM collaboration Y Wu CAD-based interface program for fusion neutron transportsimulation Fusion Eng Des 84 (2009) 1987
[9] H Kim et al Radioactivity evaluation for the KSTAR tokamak Rad Prot Dos 116 (2005) 24
[10] X-5 MONTE CARLO TEAM collaboration MCNP mdash a general Monte Carlo N-particle trasnportcode version 5 Los Alamos National Laboratory Los Alamos USA (2000)
[11] RA Forrest J Kopecky and J-C Sublet The European Activation File EAF-2007 neutron-inducedcross section library EURATOMUKAEA Fusion UK (2007)
ndash 10 ndash
- Introduction
- Instrumentation
-
- Pneumatic transfer system
- Counting system and controller
-
- Measurement experiment
- Analysis
-
- Monte-Carlo analysis model
- Results
-
- Conclusions
-
2012 JINST 7 C05009
PUBLISHED BY IOP PUBLISHING FOR SISSA MEDIALAB
RECEIVED December 22 2011REVISED March 22 2012ACCEPTED April 5 2012
PUBLISHED May 16 2012
2nd INTERNATIONAL WORKSHOP ON FAST NEUTRON DETECTORS AND APPLICATIONSNOVEMBER 6ndash11 2011EIN GEDI ISRAEL
Diagnostic neutron activation system for KSTAR
MS Cheon1 YS Lee AC England HS Kim S Pak CR Seon and HG Lee
National Fusion Research InstituteGwahangno 169-148 Daejeon 305-806 Korea
E-mail munseongnfrirekr
ABSTRACT The Korea Superconducting Tokamak Advanced Research (KSTAR) device has be-gun deuterium plasma operation and increased neutron generation from D-D fusion reaction in theplasma is expected as the heating power of the plasma increases A neutron activation system uti-lizing the pneumatic transfer of encapsulated metal samples has been implemented to monitor thefusion neutron source strength and the total fusion power from the KSTAR plasma The prototypepneumatic transfer system for the ITER neutron activation system was slightly modified to be usedfor KSTAR and a High Purity Germanium (HPGe) detection system was used to count gammaphotons from the activated samples The Monte Carlo code MCNP and the inventory code FIS-PACT were also used for the calculations to evaluate the total number of neutrons emitted from theD-D fusion reactions in the KSTAR plasma The analysis of data from an activation measurementobtained from the 2011 KSTAR campaign shows the neutron flux at the irradiation station was22times108 cmminus2sminus1 and the total neutron yield was 47times1013 ns for a typical NBI-heated H-modeKSTAR plasma shot
KEYWORDS Nuclear instruments and methods for hot plasma diagnostics Neutron detectors(cold thermal fast neutrons)
1Corresponding author
ccopy 2012 IOP Publishing Ltd and Sissa Medialab srl doi1010881748-0221705C05009
2012 JINST 7 C05009
Contents
1 Introduction 1
2 Instrumentation 221 Pneumatic transfer system 222 Counting system and controller 3
3 Measurement experiment 4
4 Analysis 741 Monte-Carlo analysis model 742 Results 7
5 Conclusions 9
1 Introduction
The Korea Superconducting Tokamak Advanced Research (KSTAR) tokamak is a fusion researchdevice using superconducting coils for long pulse operation [1] Since the first plasma operation in2008 the performance of the KSTAR plasma has been upgraded with the help of auxiliary heatingsystems such as neutral beam injection (NBI) heating electron cyclotron heating (ECH) and ioncyclotron resonance heating (ICRH) KSTAR has begun deuterium plasma operation and increasedneutron generation from D-D fusion reactions in the plasma is expected as the heating power ofthe plasma increases The current performance of the KSTAR auxiliary heating systems in 2011campaign is listed in table 1
Neutrons from Ohmically heated KSTAR plasmas were detected for the first time in 2010using a sensitive 3He detector although the relation between measured neutron rate and D-D reac-tion rate was not identified clearly [2] New neutron diagnostic systems such as a fission chamberstilbene spectrometers and a neutron activation system have been installed at KSTAR for moreaccurate detection of neutrons from the KSTAR plasmas Among the neutron diagnostics whichare installed at KSTAR the main purpose of the neutron activation system is the measurement ofthe neutron fluence and the average neutron flux to the first wall With the help of neutron transportanalysis it is possible to evaluate the total average neutron source strength and also the total aver-age fusion power because the neutrons generated from the fusion reactions carry a fixed portion ofthe fusion energy in the form of their kinetic energy As a reliable and robust tool for the neutronyield measurement the neutron activation system can be used for the calibration of other neutrondiagnostics
The neutron activation system utilizes the method of pneumatic transfer of encapsulated metalsamples to the in-vessel irradiation station and counting of gamma photons from the activated sam-ples which have been irradiated by the neutrons from plasma This method has been successfully
ndash 1 ndash
2012 JINST 7 C05009
Table 1 Auxiliary heating performance of KSTAR in 2011
Heating system PerformanceECH 170 GHz 800 kW 10 sICRH 30 MHz 10 MW 10 sNBI 100 keV 16 MW 10 s
used for the neutron yield measurement at various tokamaks such as JET [3] TFTR [4] and JT-60U [5] A neutron activation system of this type will also be implemented at ITER [6 7] and isunder development at the National Fusion Research Institute (NFRI) A design of the pneumatictransfer system for the ITER neutron activation system has been developed and is under optimiza-tion through prototype tests The design for ITER is used for the KSTAR experiment with slightmodifications The main cause of the modification is the total neutron source strength of KSTARwhich is expected to be much less than that of ITER The expected maximum neutron sourcestrength of KSTAR is around 1016 ns which is four orders of magnitude less than that of ITERSo the capsule size for the KSTAR experiment was increased from the ITER design to containmuch heavier samples ie more than 10 grams The layout of the neutron activation system for theKSTAR is shown in figure 1
2 Instrumentation
21 Pneumatic transfer system
The pneumatic transfer system of the neutron activation system transfers capsules between thecapsule loading machine irradiation station counting station and disposal bin Polyethylene tubesare connected from those locations to the transfer station which is called a lsquocarouselrsquo and thedistribution of the capsules is done by the rotation of the carousel When the capsule in the carouselis properly located at the entry of the designated location the pneumatic valve behind the entryopens to transfer the capsule to the location Photo-sensors attached at various positions along thecapsule transfer routes are used to monitor the current capsule location One Programmable LogicController (PLC) controls all the valves sensors actuators in the pneumatic transfer system andalso the servo-motor for the carousel rotation High pressure nitrogen gas of about 4ndash5 bars is usedfor the capsule transfer and system operation The entire system is sealed pneumatically from theoutside environment except for the gas exhaust
The irradiation station is located inside the vacuum vessel close to the plasma The structurefor the irradiation station is made of two parallel stainless steel tubes which are connected at theirradiation station to form a gas circulation circuit It is installed at the lsquoFrsquo equatorial port of theKSTAR looking at the plasma in the tangential direction The length of the structure from thevacuum flange to the irradiation station is 27 m A supporter for the irradiation station is weldedon the surface of the vacuum vessel wall and holds the structure The irradiation station and thesupporter are electrically isolated using PLAVIST M a polymer material which has good propertiesat high temperature to avoid the formation of an electrical loop An air-cushion design is applied
ndash 2 ndash
2012 JINST 7 C05009
Figure 1 Layout of the neutron activation system for the KSTAR Capsules are transferred between theirradiation station at level D0 and the counting system at level D3 of the main experimental hall via thepneumatic transfer system
for the irradiation station to reduce the capsule speed near the end of the transfer The installedirradiation station is shown in figure 2
The counting station consists of a gamma photon detector inside a lead shield The structurefor the counting station is made of coaxial double stainless steel tubes It is designed to be ableto move vertically so that the distance from the detector surface can be varied according to theactivation level of the irradiated samples The disposal bin is a lead-shielded metal box to keepencapsulated samples after the operation Some samples which have relatively short decay timeand low radioactivity can be reused after enough cooling inside the disposal bin An air-cushiondesign was also applied both for the counting station and the disposal bin
The capsule is made of polyethylene with diameter of 28 mm and length of 50 mm The cap-sule transfer line between the irradiation station and the transfer station is made of a polyethylenetube whose inner diameter is 32 mm and the length of the transfer line is about 20 m
22 Counting system and controller
A High Purity Germanium (HPGe) detector system is used for the counting system of the neutronactivation system The counting system consists of an ORTEC-GEM25 series HPGe detector and
ndash 3 ndash
2012 JINST 7 C05009
Figure 2 Irradiation station installed at F equatorial port of KSTAR
computer-based multichannel analyzer (MCA) card system which can reproduce the gamma rayspectra by using the program Gamma Vision 50 (EGampG ORTEC) The energy resolution of thedetector is 177 keV full width at half maximum (FWHM) at the 133 MeV peak of 60Co Thedetector is shielded by a 10-cm thick lead and cooled by an electrical cooler to reduce radiationand thermal noise Energy and efficiency calibrations of the counting system were performed usingstandard gamma sources ie 109Cd (8803 keV) 57Co (1221 keV) 137Cs (66163 keV) and 60Co(11732 and 13325 keV)
The control software of the pneumatic transfer system is installed on the same computer onwhich the gamma spectrum analysis program is installed The control software was developedusing National Instruments LabVIEWT M for easy control of the pneumatic transfer system Thelocal control computer and the PLC of the pneumatic transfer system communicate with each otherby an Ethernet connection Thus the remote and simultaneous operation of the pneumatic transfersystem and gamma spectrometer is possible by accessing to the local control computer through theKSTAR local area network (LAN) The pneumatic transfer system and counting system installedat KSTAR is shown in figure 3
3 Measurement experiment
A neutron measurement experiment was performed for the KSTAR plasma operation shot 6303A plasma current auxiliary heating parameters and the neutron rate data from the uncalibrated fis-sion chamber for this shot are shown in figure 4 The plasma was heated by ECH and NBI and anL-H mode transition was observed during this shot Because the fission chamber data show therewas neutron generation during the NBI heating of the plasma beam-target reactions between theinjected high energy neutral beam and the plasma seems to be the most dominant source of the
ndash 4 ndash
2012 JINST 7 C05009
Figure 3 Pneumatic transfer and counting system of the neutron activation system
neutron production for this discharge The neutron activation system was used to measure theseneutrons
An indium sample was used for the activation experiment Indium undergoes mainly two re-actions when it is irradiated by a neutron flux ie 115In(nnrsquo)115mIn and 115In(nγ)116mIn Betweenthese two reactions the 115mIn line was chosen for the evaluation of the neutron flux because itis due to a threshold reaction with Eth=03 MeV and shows a high cross section around 25 MeVThus a sensitive measurement of fusion neutrons with relatively small contributions of photoneu-trons generated from the runaway electrons is possible by counting the 115mIn line An indiumsample of 1145 g was encapsulated and transferred to the irradiation station before shot 6303The activated indium sample was retrieved to the transfer station after the shot and transferred tothe counting station The gamma photons from the sample were counted for 40000 seconds af-ter 2 hours of cooling in order to obtain good statistics and to avoid noise from the other plasmadischarges The obtained pulse height spectrum from this counting is shown in figure 5
From the pulse height spectrum the 115mIn peak (336 keV) was clearly identified and thenumber of counts from the peak area was obtained with the statistical error of plusmn11 After thecorrection of the cooling and counting time effect the specific activity of the sample right after theirradiation was estimated to be 219 Bqg One of the significant sources of error in the measure-ment is the ambiguity of the capsule position during the irradiation because the current design ofthe irradiation station does not include the in-vessel positioning sensor This problem will be over-come from next yearrsquos KSTAR operation by changing the design of the irradiation station slightlyto put the in-vessel sensor
ndash 5 ndash
2012 JINST 7 C05009
Figure 4 Plasma current auxiliary heating parameters and fission chamber data (uncalibrated) for shot6303
Figure 5 Pulse height spectrum of activated indium sample for shot 6303
ndash 6 ndash
2012 JINST 7 C05009
Figure 6 CAD design and material specification for KSTAR Monte-Carlo model
4 Analysis
41 Monte-Carlo analysis model
A Monte-Carlo model for KSTAR was developed for the analysis of the neutron activation systemmeasurement data A three-dimensional computer-aided design (CAD) of the KSTAR was con-verted into an input file for the Monte-Carlo calculation using the interface program MCAM [8]This model is an upgraded version of the existing model [9] which was developed for the evaluationof the absorbed doses at various parts of the KSTAR The CAD design and material specificationfor the new model is shown in figure 6
This model is a 90 section of the KSTAR considering the symmetry of both the vacuumvessel and in-vessel components It consists of the cells for the superconducting coils such as thecentral solenoid (CS) toroidal field (TF) coils and poloidal field (PF) coils and the other tokamakstructures such as the vacuum vessel cryostat and in-vessel components The over simplificationin the cell geometries and material specifications in the old model was improved as much as possi-ble to reflect the real situation Because the most important location in the analysis of the neutronactivation system data is the irradiation station the in-vessel components which are close to theirradiation station are included in much details in the model to enhance the accuracy of the neu-tron transport calculations The in-vessel components that the new model includes are the graphiteplasma facing components (PFC) passive stabilizers poloidal limiters neutral beam shine-througharmour and in-vessel control coils (IVCC)
42 Results
A neutron transport and activation calculation was performed for the data analysis of the neutronactivation system A Monte-Carlo N-Particle transport code MCNP5 [10] and an activation codeFISPACT-2007 [11] were used for the analysis The neutron spectrum at the irradiation station wasachieved by running the MCNP code using the developed KSTAR model The attenuation effect bythe structure of the irradiation station itself was also taken into account The detailed MCNP model
ndash 7 ndash
2012 JINST 7 C05009
Figure 7 Horizontal view of MCNP model near the irradiation station
including the structure of the irradiation station in the horizontal plane and the neutron spectrumobtained from the MCNP calculation are shown in figure 7 and figure 8 respectively
The neutron spectrum obtained from the MCNP calculation is used as an input for the FIS-PACT calculation With the information of the neutron spectrum at the irradiation station and thematerial to be irradiated the FISPACT calculates the relation between the neutron flux at the irra-diation station and the activity of the 115mIn (336 keV) line The resultant neutron fluence at theirradiation station during the shot 6303 was calculated to be 131times109 ncm2 Thus the averageneutron flux at the irradiation station would be 22times108 ncm2s assuming the neutrons were gen-erated only during the NBI heating ie 6 seconds according to the fission chamber data TheMCNP calculation can also provide the relation between the neutron flux at the irradiation stationand the total neutron yield from the whole KSTAR plasma According to the MCNP calculationthe average total neutron yield for the shot 6303 was estimated to be 47times1013 ns
The statistical error of the measured sample activity was estimated to be about 5 mainlyfrom the counting error (sim1) and the detector efficiency error (sim5) The systematic error ofthe analysis consists mainly of the MCNP statistics (sim2) material cross-section (sim4) and mod-elling which has not been estimated yet Aside from the geometry and neutron source descriptionerror in the MCNP model the most significant source of error comes from the ambiguity of thecapsule position during the irradiation as mentioned in section 3 The result of the MCNP calcu-lation shows about 06 cm error would be induced if the capsule position is wrongly determinedfrom the designated irradiation station which can cause serious underestimation in the total neutronyield evaluation Therefore a design change of the current configuration of the irradiation stationis strongly required for the reliable measurement and error analysis in the future
ndash 8 ndash
2012 JINST 7 C05009
Figure 8 MCNP calculated neutron spectrum at the irradiation station
5 Conclusions
The first experimental estimation of the neutron source strength of the KSTAR plasma was per-formed using the neutron activation system By using indium as a sample material and by countingthe 115mIn line selectively it was possible to evaluate the neutron fluence and the average neutronflux at the irradiation station and the average total neutron yield from the KSTAR plasma Analy-sis of the results from the MCNP and the FISPACT calculation showed the average neutron flux tothe first wall was about 22times108 ncm2s and the average total neutron yield was 47times1013 ns forshot 6303 which was a typical NBI-heated H-mode KSTAR plasma shot According to the mea-surement data accumulated during 2011 KSTAR campaign it is estimated the typical total neutronsource strength the campaign was in the order of 1012 sim1013 ns
Acknowledgments
This work was supported by the Ministry of Education Science and Technology of Korea throughthe ITER project contract This work was carried out using computer software which is known asFISPACT-2007 for calculating the activation of materials irradiated in a neutron flux The ownerof FISPACT-2007 is UKAEA The pneumatic transfer system for this work was fabricated andinstalled with the help of VMT Co Ltd
References
[1] GS Lee et al The KSTAR project an advanced steady state superconducting tokamak experimentNucl Fusion 40 (2000) 575
[2] AC England et al Neutron emission from KSTAR Ohmically heated plasmas Phys Lett A 375(2011) 3095
[3] ON Jarvis et al Use of activation techniques for the measurement of neutron yields from deuteriumplasmas at the Joint European Torus Fusion Tech 20 (1991) 265
ndash 9 ndash
2012 JINST 7 C05009
[4] CW Barnes AR Larson G LeMunyan and MJ Loughlin Measurement of DT and DD neutronyields by neutron activation on the Test Fusion Test Reactor Rev Sci Instrum 66 (1995) 888
[5] M Hoek T Nishitani Y Ikeda and A Morioka Neutron yield measurements by use of foil activationat JT-60U Rev Sci Instrum 66 (1995) 885
[6] MS Cheon S Pak HG Lee L Bertalot and C Walker In-vessel design of ITER diagnosticneutron activation system Rev Sci Instrum 79 (2008) 10E505
[7] MS Cheon CR Seon S Pak HG Lee L Bertalot and RA Forrest Operational radioactivityevaluation of ITER diagnostic neutron activation system IEEE Trans Plasma Sci 38 (2010) 274
[8] FDS TEAM collaboration Y Wu CAD-based interface program for fusion neutron transportsimulation Fusion Eng Des 84 (2009) 1987
[9] H Kim et al Radioactivity evaluation for the KSTAR tokamak Rad Prot Dos 116 (2005) 24
[10] X-5 MONTE CARLO TEAM collaboration MCNP mdash a general Monte Carlo N-particle trasnportcode version 5 Los Alamos National Laboratory Los Alamos USA (2000)
[11] RA Forrest J Kopecky and J-C Sublet The European Activation File EAF-2007 neutron-inducedcross section library EURATOMUKAEA Fusion UK (2007)
ndash 10 ndash
- Introduction
- Instrumentation
-
- Pneumatic transfer system
- Counting system and controller
-
- Measurement experiment
- Analysis
-
- Monte-Carlo analysis model
- Results
-
- Conclusions
-

2012 JINST 7 C05009
Figure 7 Horizontal view of MCNP model near the irradiation station
including the structure of the irradiation station in the horizontal plane and the neutron spectrumobtained from the MCNP calculation are shown in figure 7 and figure 8 respectively
The neutron spectrum obtained from the MCNP calculation is used as an input for the FIS-PACT calculation With the information of the neutron spectrum at the irradiation station and thematerial to be irradiated the FISPACT calculates the relation between the neutron flux at the irra-diation station and the activity of the 115mIn (336 keV) line The resultant neutron fluence at theirradiation station during the shot 6303 was calculated to be 131times109 ncm2 Thus the averageneutron flux at the irradiation station would be 22times108 ncm2s assuming the neutrons were gen-erated only during the NBI heating ie 6 seconds according to the fission chamber data TheMCNP calculation can also provide the relation between the neutron flux at the irradiation stationand the total neutron yield from the whole KSTAR plasma According to the MCNP calculationthe average total neutron yield for the shot 6303 was estimated to be 47times1013 ns
The statistical error of the measured sample activity was estimated to be about 5 mainlyfrom the counting error (sim1) and the detector efficiency error (sim5) The systematic error ofthe analysis consists mainly of the MCNP statistics (sim2) material cross-section (sim4) and mod-elling which has not been estimated yet Aside from the geometry and neutron source descriptionerror in the MCNP model the most significant source of error comes from the ambiguity of thecapsule position during the irradiation as mentioned in section 3 The result of the MCNP calcu-lation shows about 06 cm error would be induced if the capsule position is wrongly determinedfrom the designated irradiation station which can cause serious underestimation in the total neutronyield evaluation Therefore a design change of the current configuration of the irradiation stationis strongly required for the reliable measurement and error analysis in the future
ndash 8 ndash
2012 JINST 7 C05009
Figure 8 MCNP calculated neutron spectrum at the irradiation station
5 Conclusions
The first experimental estimation of the neutron source strength of the KSTAR plasma was per-formed using the neutron activation system By using indium as a sample material and by countingthe 115mIn line selectively it was possible to evaluate the neutron fluence and the average neutronflux at the irradiation station and the average total neutron yield from the KSTAR plasma Analy-sis of the results from the MCNP and the FISPACT calculation showed the average neutron flux tothe first wall was about 22times108 ncm2s and the average total neutron yield was 47times1013 ns forshot 6303 which was a typical NBI-heated H-mode KSTAR plasma shot According to the mea-surement data accumulated during 2011 KSTAR campaign it is estimated the typical total neutronsource strength the campaign was in the order of 1012 sim1013 ns
Acknowledgments
This work was supported by the Ministry of Education Science and Technology of Korea throughthe ITER project contract This work was carried out using computer software which is known asFISPACT-2007 for calculating the activation of materials irradiated in a neutron flux The ownerof FISPACT-2007 is UKAEA The pneumatic transfer system for this work was fabricated andinstalled with the help of VMT Co Ltd
References
[1] GS Lee et al The KSTAR project an advanced steady state superconducting tokamak experimentNucl Fusion 40 (2000) 575
[2] AC England et al Neutron emission from KSTAR Ohmically heated plasmas Phys Lett A 375(2011) 3095
[3] ON Jarvis et al Use of activation techniques for the measurement of neutron yields from deuteriumplasmas at the Joint European Torus Fusion Tech 20 (1991) 265
ndash 9 ndash
2012 JINST 7 C05009
[4] CW Barnes AR Larson G LeMunyan and MJ Loughlin Measurement of DT and DD neutronyields by neutron activation on the Test Fusion Test Reactor Rev Sci Instrum 66 (1995) 888
[5] M Hoek T Nishitani Y Ikeda and A Morioka Neutron yield measurements by use of foil activationat JT-60U Rev Sci Instrum 66 (1995) 885
[6] MS Cheon S Pak HG Lee L Bertalot and C Walker In-vessel design of ITER diagnosticneutron activation system Rev Sci Instrum 79 (2008) 10E505
[7] MS Cheon CR Seon S Pak HG Lee L Bertalot and RA Forrest Operational radioactivityevaluation of ITER diagnostic neutron activation system IEEE Trans Plasma Sci 38 (2010) 274
[8] FDS TEAM collaboration Y Wu CAD-based interface program for fusion neutron transportsimulation Fusion Eng Des 84 (2009) 1987
[9] H Kim et al Radioactivity evaluation for the KSTAR tokamak Rad Prot Dos 116 (2005) 24
[10] X-5 MONTE CARLO TEAM collaboration MCNP mdash a general Monte Carlo N-particle trasnportcode version 5 Los Alamos National Laboratory Los Alamos USA (2000)
[11] RA Forrest J Kopecky and J-C Sublet The European Activation File EAF-2007 neutron-inducedcross section library EURATOMUKAEA Fusion UK (2007)
ndash 10 ndash
- Introduction
- Instrumentation
-
- Pneumatic transfer system
- Counting system and controller
-
- Measurement experiment
- Analysis
-
- Monte-Carlo analysis model
- Results
-
- Conclusions
-
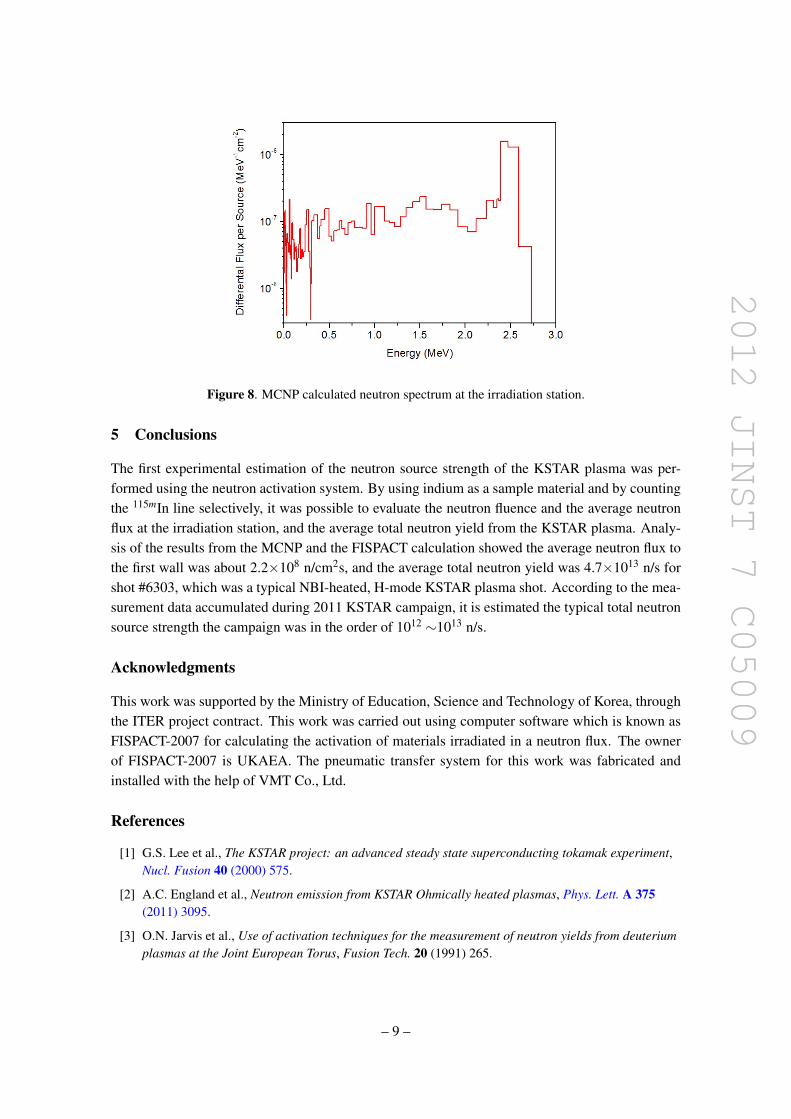
2012 JINST 7 C05009
[4] CW Barnes AR Larson G LeMunyan and MJ Loughlin Measurement of DT and DD neutronyields by neutron activation on the Test Fusion Test Reactor Rev Sci Instrum 66 (1995) 888
[5] M Hoek T Nishitani Y Ikeda and A Morioka Neutron yield measurements by use of foil activationat JT-60U Rev Sci Instrum 66 (1995) 885
[6] MS Cheon S Pak HG Lee L Bertalot and C Walker In-vessel design of ITER diagnosticneutron activation system Rev Sci Instrum 79 (2008) 10E505
[7] MS Cheon CR Seon S Pak HG Lee L Bertalot and RA Forrest Operational radioactivityevaluation of ITER diagnostic neutron activation system IEEE Trans Plasma Sci 38 (2010) 274
[8] FDS TEAM collaboration Y Wu CAD-based interface program for fusion neutron transportsimulation Fusion Eng Des 84 (2009) 1987
[9] H Kim et al Radioactivity evaluation for the KSTAR tokamak Rad Prot Dos 116 (2005) 24
[10] X-5 MONTE CARLO TEAM collaboration MCNP mdash a general Monte Carlo N-particle trasnportcode version 5 Los Alamos National Laboratory Los Alamos USA (2000)
[11] RA Forrest J Kopecky and J-C Sublet The European Activation File EAF-2007 neutron-inducedcross section library EURATOMUKAEA Fusion UK (2007)
ndash 10 ndash
- Introduction
- Instrumentation
-
- Pneumatic transfer system
- Counting system and controller
-
- Measurement experiment
- Analysis
-
- Monte-Carlo analysis model
- Results
-
- Conclusions
-