diagnostic accuracy of tcell interferongamma release ... · pdf filediagnostic accuracy of...
TRANSCRIPT
1
Diagnostic accuracy of T-cell interferon-gamma release assays in
tuberculous pleurisy: a meta-analysis*
Qiong Zhou,1* Yi-Qiang Chen,2* Shou-Ming Qin,2 Xiao-Nan Tao,1 Jian-Bao Xin1 and
Huan-Zhong Shi1
1Department of Respiratory Diseases, Union Hospital, Key Lab of Pulmonary Diseases of
Health Ministry, Tongji Medical College, Huazhong University of Science and Technology,
Wuhan, and 2First Affiliated Hospital, Guangxi Medical University, Nanning, China
Short title: IGRA in diagnosis of TB pleurisy
Key words: diagnosis, diagnostic accuracy, pleurisy, T-cell interferon-γ release assay,
tuberculosis
*These authors contributed equally to the present work
Correspondence: Dr. Huan-Zhong Shi, Department of Respiratory Diseases, Union Hospital,
Tongji Medical College, Huazhong University of Science and Technology, 1277 Jiefang
Avenue, Wuhan 430022, PR China; Telephone: (86) 27 85726290; Fax: (86) 27 85726081;
Email: [email protected] This is an Accepted Article that has been peer-reviewed and approved for
publication in the Respirology, but has yet to undergo copy-editing and proof
correction. Please cite this article as an "Accepted Article"; doi:
10.1111/j.1440-1843.2011.01941.x

2
SUMMARY AT A GLANCE
A meta-analysis was performed to establish the overall diagnostic accuracy of T cell IFN-γ
release assays for tuberculous pleurisy. The current evidence does not support the use of T
cell IFN-γ release assays on either pleural fluid or blood, for the diagnosis of tuberculous
pleurisy.

3
ABSTRACT
Background and objective: The diagnosis of tuberculous pleurisy by analysis of pleural fluid
using standard diagnostic tools is difficult. Recently, T cell interferon-gamma release assays
(IGRAs) have been introduced for the diagnosis of tuberculous pleurisy. The aim of the
present meta-analysis was to establish the overall diagnostic accuracy of IGRAs on both
pleural fluid and peripheral blood, for diagnosing tuberculous pleurisy.
Methods: A systematic review was performed of English language publications. Sensitivity,
specificity, and other measures of the accuracy of IGRAs for the diagnosis tuberculous
pleurisy using both pleural fluid and blood, were pooled using a random-effects model or a
fixed-effects model. Receiver operating characteristic curves were used to summarize overall
test performance.
Results: Seven out of eight studies met the inclusion criteria. The summary estimates of
sensitivity, specificity, positive likelihood ratio, negative likelihood ratio, positive predictive
value, negative predictive value, and diagnostic odds ratio were, for pleural fluid: 0.75, 0.82,
3.49, 0.24, 0.85, 0.70, and 19.04, respectively; and for blood: 0.80, 0.72, 2.86, 0.28, 0.78, 0.74,
and 11.06, respectively.
Conclusions: Since almost 20% of non-tuberculosis patients would be erroneously treated for
tuberculosis and 25% of patients with tuberculous pleurisy would be missed, pleural fluid
IGRAs are not useful for the clinical diagnosis of tuberculous pleurisy.
4
INTRODUCTION
Tuberculous pleural effusion (TPE) is common. However, differentiating TPE from the many
other causes of lymphocytic pleural effusions is often challenging, and the conventional
methods, such as direct examination of pleural fluid by Ziehl-Neelsen staining, culture of
pleural fluid, and pleural biopsy, have limitations and are thus not always helpful in making
the diagnosis. Microscopy of pleural fluid is rarely positive (<5%) (1-3). Culture of pleural
fluid has a low sensitivity (24–58%), and several weeks are required to grow Mycobacterium
tuberculosis (MTB) (3, 4). Biopsy of pleural tissue, and culture of biopsy material are widely
held to be the best methods of confirming the diagnosis (4). Although not perfect, culture
and/or biopsy, therefore, are widely considered the standard of diagnosis. However, pleural
biopsy is invasive, operator-dependent, and technically difficult, particularly in children (5).
The differential diagnosis of TPE sometimes mandates more invasive procedures such as
thoracoscopy or thoracotomy. These procedures, which require expertise, may cause
complications and may even increase morbidity.
Accumulation of lymphocytes, especially CD4+ T lymphocytes, has been well
documented in TPE (6, 7). Selective enrichment of memory T cells with defined surface
phenotype and a Th1-type cytokine profile are also well documented in TPE (8). Interferon
(IFN)-γ levels have been reported to be elevated in TPE (9). In a previous meta-analysis, we
showed that measurement of IFN-γ in pleural fluid is likely to be a useful diagnostic tool for
TPE, with a sensitivity of 0.89 (95% CI 0.87 to 0.91) and a specificity of 0.97 (95% CI 0.96
to 0.98) (10). Advances in the immunopathology of tuberculosis have led to the development
of novel T-cell IFN-γ release assays (IGRAs), which are now licensed as blood tests for the

5
diagnosis of latent tuberculosis. Extending the use of IGRAs to the diagnosis of TPE has
attracted significant interest and has been the focus of a growing number of publications (11).
The present meta-analysis was performed to establish the overall accuracy of IGRAs for the
diagnosis of TPE.
6
METHODS
Search strategy and study selection
Using PubMed as the search engine, a MEDLINE search was conducted to identify suitable
studies up to January 2010; no starting date limit was applied. Articles were also identified
using the related-articles function in PubMed. References within the identified articles were
also searched manually. The search terms included pleurisy/pleuritis, pleural effusion/pleural
fluid, AND Quantiferon, or Elispot, or interferon-gamma assays, or interferon-gamma release
assays, or T cell assays. The searches were limited to English language publications on human
studies. Conference abstracts were excluded because these contain limited data.
A study was included in the meta-analysis when it provided data on both the sensitivity
and specificity of IGRA for the diagnosis of TPE, or when it provided values from IGRA in a
dot plot form, allowing test results for individual study subjects to be extracted. Two
reviewers independently judged the eligibility of studies while screening the citations.
Disagreements between reviewers were resolved by consensus. The authors of some
publications were contacted for clarification and additional information.
Data extraction and quality assessment
The final set of English language articles was assessed independently by two reviewers. The
data that was retrieved included author, publication year, participant characteristics, test
methods, sensitivity and specificity data, cut-off values and methodological quality. The
methodological quality of the studies was assessed using the guidelines published by the
STARD (standards for reporting diagnostic accuracy, maximum score 25) initiative (12),
7
which are guidelines that aim to improve the quality of reporting in diagnostic studies. In
addition the QUADAS (quality assessment for studies of diagnostic accuracy, maximum
score 14) tool,13 i.e., appraisal by use of empirical evidence, expert opinion, and formal
consensus to assess the quality of primary studies of diagnostic accuracy, was used.
Statistical analyses
Standard methods recommended for meta-analyses of diagnostic test evaluations (14) were
used. Analyses were performed using two statistical software programs (Stata, version 9;
Stata Corporation, College Station, TX, USA and Meta-DiSc for Windows; XI Cochrane
Colloquium, Barcelona, Spain). The following measures of test accuracy were computed for
each study: sensitivity, specificity, positive likelihood ratio (PLR), negative likelihood ratio
(NLR), positive predictive value (PPV), negative predictive value (NPV), and diagnostic odds
ratio (DOR).
The analysis was based on a summary receiver operating characteristic (SROC) curve
(14, 15). The sensitivity and specificity for the single test threshold identified for each study
were used to plot an SROC curve (10, 15). The average sensitivity, specificity and other
measures across studies of pleural and blood IGRAs were calculated using a random-effects
model and a fixed-effects model, respectively (16, 17). Chi-square and Fisher’s exact tests
were used to detect statistically significant heterogeneity across studies. Since publication bias
is of concern for meta-analyses of diagnostic studies, the potential presence of this bias was
tested using funnel plots and the Egger test (18).
8
RESULTS
After independent review, eight publications on the use of IGRAs in patients with TPE were
considered eligible for inclusion in the analysis (19-26). Of these publications, one was
excluded because it was a case report (26). In the study by Dheda et al. (24), the investigators
performed IGRAs using two different methods (T-SPOT-TB® [Oxford Immunotec, Oxford,
UK] and QFN-TB® Gold In Tube [Cellestis Ltd., Carnegie, Australia]), and this research data
was treated as two independent studies in the meta-analysis. Consequently, seven publications
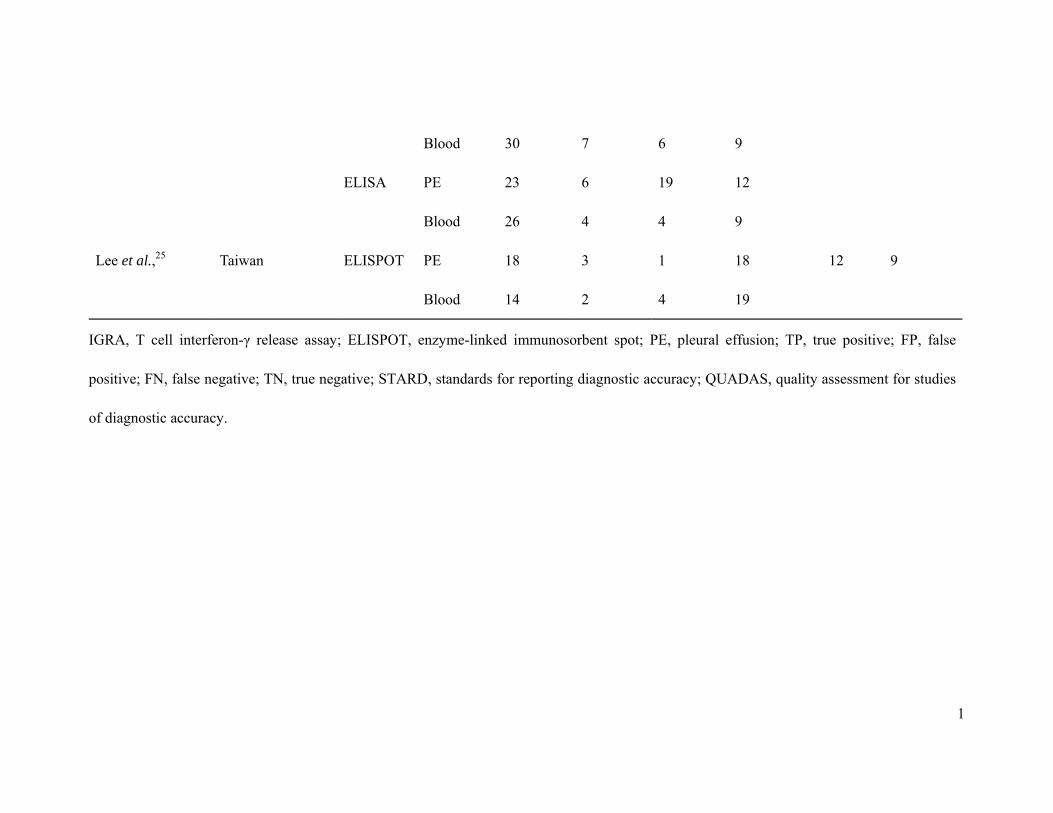
(19-25) were available for analysis of the diagnostic accuracy of IGRAs in TPE. The clinical
characteristics of these studies, along with the STARD and QUADAS scores, are outlined in
Table 1.
Quality of reporting and study characteristics
The average sample size in the eight studies of pleural IGRA (19-25) was 46 (range 18 – 75),
and the subjects included 213 patients with TPE and 153 non-TPE patients. The average
sample size in the seven studies of blood IGRA (20-25) was 45 (range 30 – 74), and the
subjects included 177 patients with TPE and 141 non-TPE patients.
In two studies (19, 20), the diagnosis of TPE was made by bacteriological or histological
assessment or both; in the remaining five studies (21-25), some TPE patients were diagnosed
on the basis of bacteriological or histological results, and some patients were diagnosed on
clinical course, including clinical presentation, pleural fluid analysis, radiology and
responsiveness to anti-tuberculosis chemotherapy.
9
Diagnostic accuracy
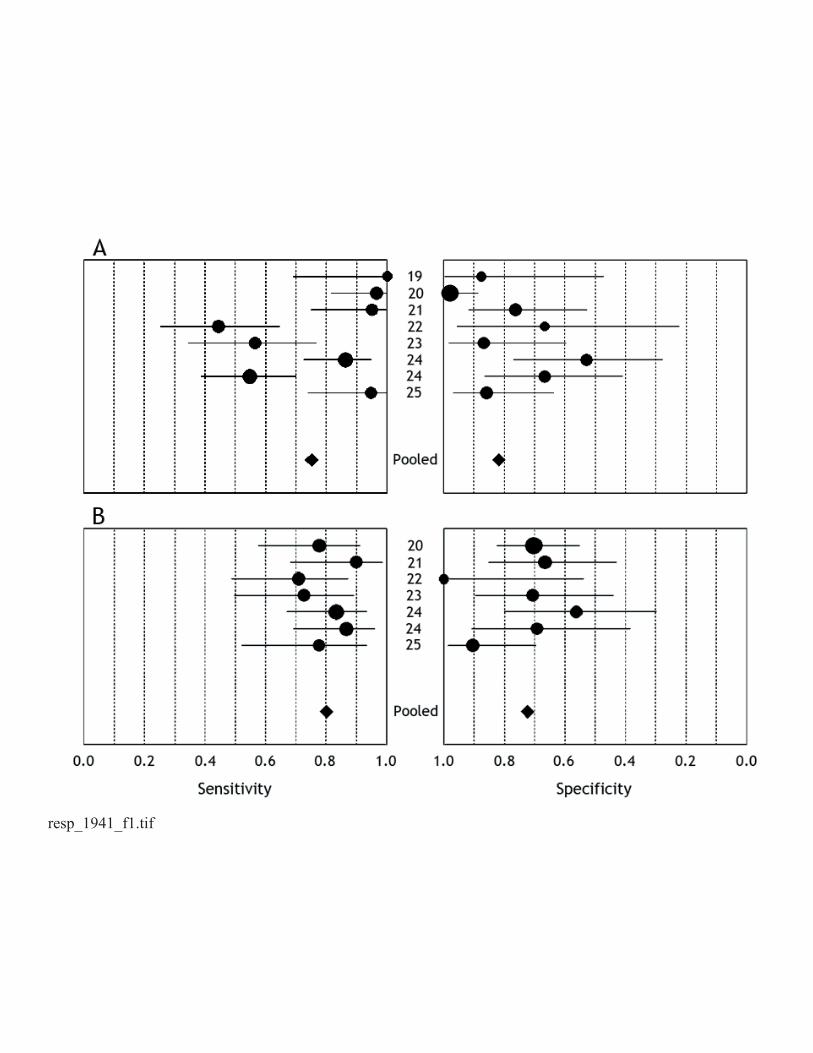
Figure 1A shows a forest plot of sensitivity and specificity for eight pleural IGRA assays in
the diagnosis of TPE. The sensitivity ranged from 0.44 to 1.0 (pooled sensitivity 0.75, 95% CI
0.69 – 0.81), while specificity ranged from 0.53 – 0.98 (pooled specificity 0.82, 95% CI 0.75
– 0.88). The PLR was 3.49 (95% CI 1.87 – 6.52), NLR was 0.24 (95% CI 0.1 – 0.56), PPV
was 0.85 (95% CI 0.79 – 0.9), NPV was 0.7 (95% CI 0.62 – 0.76), and DOR was 19.04 (95%
CI 4.79 – 75.77). Chi-square values for sensitivity, specificity, PLR, NLR, PPV, NPV, and
DOR were 53.12, 23.81, 22.63, 46.7, 29.32, 35.54, and 30.1, respectively (P <0.001 for all),
indicating significant heterogeneity between studies (Table 2).
Figure 1B shows a forest plot of sensitivity and specificity for five blood IGRA assays in
the diagnosis of TPE. The sensitivity ranged from 0.71 to 0.9 (pooled sensitivity 0.8, 95% CI
0.74 – 0.86), while specificity ranged from 0.56 – 1.0 (pooled specificity 0.72, 95% CI 0.64 –
0.8). The PLR was 2.86 (95% CI 2.16 – 3.79), NLR was 0.28 (95% CI 0.2 – 0.38), PPV was
0.78 (95% CI 0.72 – 0.84), NPV was 0.74 (95% CI 0.66 – 0.82), and DOR was 11.06 (95% CI
6.5 – 18.82). Chi-square values for sensitivity, specificity, PLR, NLR, PPV, NPV, and DOR
were 4.59, 10.53, 5.38, 2.56, 4.32, 6.76, and 3.75, respectively (P >0.05 for all), indicating no
significant heterogeneity between studies (Table 2).
Two different types of assays were used in the studies included in the meta-analysis. One
was enzyme-linked immunosorbent spot (ELISPOT) assays, such as T-SPOT-TB, in which
mononuclear cells from pleural fluid or blood are used and the number of IFN-γ-producing
cells responding to antigens such as the early secreted antigenic target 6 (ESAT-6) and culture
filtrate protein 10 (CFP-10), are reported. The other type of assay are ELISAs, such as
10
Quanti-FERON-TB Gold (QFN-G) or the third generation ‘In-Tube’ (QFN-GT), which used
pleural fluid or whole blood and measures T cell INF-γ production (expressed as pg/mL or
IU/mL) in response to a cocktail of ESAT-6, CFP-10 and TB 7.7. The comparison of overall
diagnostic values from ELISPOT and ELISA is shown in Table 2. It could not be concluded
that the overall accuracy of ELISPOT for the diagnosis of TPE was superior or inferior to that
of ELISA.
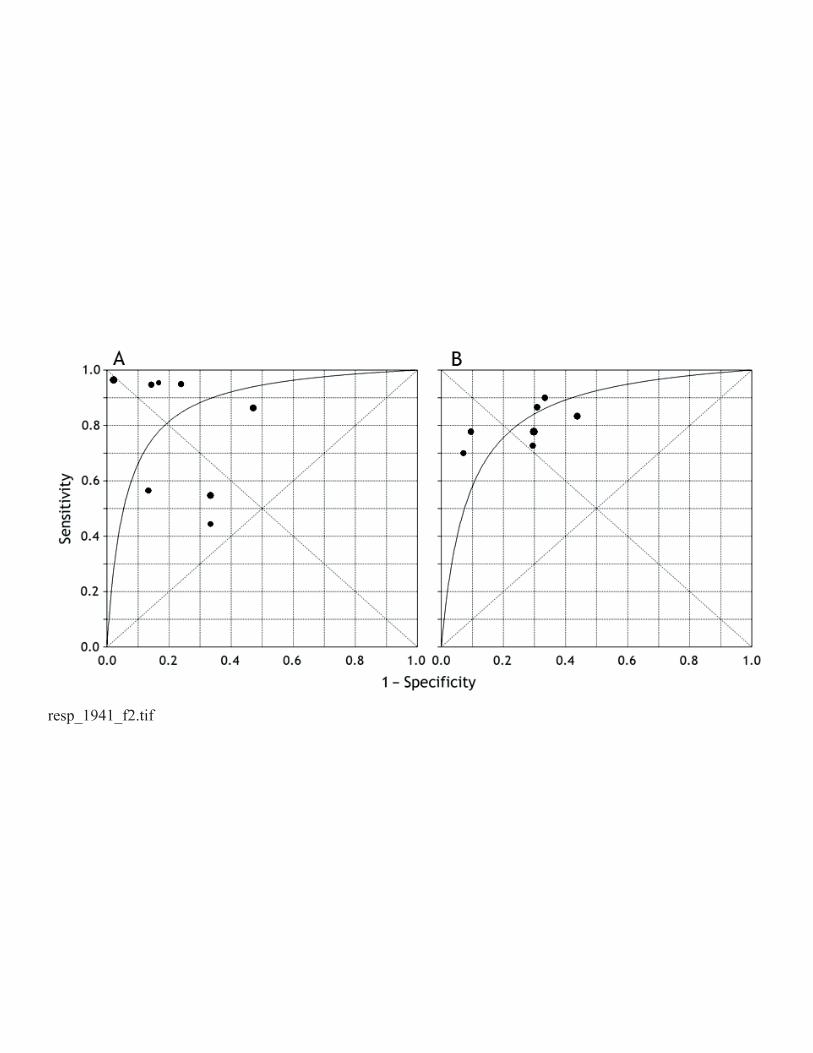
The SROC curves for IGRAs, showing sensitivity versus 1 – specificity from individual
studies are shown in Figure 2. The SROC curve for pleural IGRAs is not positioned near the
desirable upper left corner, and the optimum cut-off for sensitivity and specificity was 0.81
(SEM 0.06), with an area under the curve (AUC) of 0.88 (SEM 0.06). For blood IGRAs the
optimum cut-off for sensitivity and specificity was 0.78 (SEM 0.03) with an AUC of 0.85
(SEM 0.03). These data indicated that the overall accuracy of IGRAs in both pleural fluid and
blood were not as high as expected, and that the results from pleural IGRAs appeared to be
better than those from blood IGRAs.
Multiple regression analysis and publication bias
As show in Table 1, three publications from four studies had higher STARD (≥ 13) and
QUADAS scores (≥ 11). These scores were used in a meta-regression analysis to assess the
effect of study quality on the relative DOR (RDOR) of IGRAs for the diagnosis of TPE. As
shown in Table 2, higher quality studies on both pleural and blood IGRAs produced RDORs
that were not significantly higher than those for lower quality studies. Three studies were
performed in areas with a low incidence of tuberculosis (19-21) and five studies (four

11
publications) were performed in areas with a high incidence of tuberculosis (22-25).
ELISPOT was used in four studies (19, 21, 24, 25) and ELISA in the remaining four studies
(20, 22-24). The assay methods (ELISPOT versus ELISA) and the study settings (low versus
high incidence of tuberculosis) did not substantially affect the diagnostic accuracy of either
pleural or blood IGRAs (Table 3).
Publication bias
Although the funnel plots for publication bias showed some asymmetry due to the limited
number of studies (Fig. 3), evaluation of publication bias using Egger tests showed that this
was not significant for either pleural (P = 0.21) or blood IGRAs (P = 0.303). These results
indicated that there was no potential for publication bias.
12
DISCUSSION
IGRAs were first developed for the diagnosis of latent tuberculosis and evolved from the
principle that circulating memory T cells of patients, who have previously been exposed to
MTB, produce IFN-γ when re-challenged with mycobacterial antigens (27). In a recent
meta-analysis (28), Pai and colleagues showed that IGRAs have excellent specificity that is
unaffected by bacille Calmette-Guérin vaccination. Currently available IGRAs use antigens
specific to MTB, such as ESAT-6 and CFP-10. Two commercial kits are now available, the
T-SPOT-TB® and QFN-TB® (29). Recently, both these methods have been assessed for the
diagnosis of TPE, with mixed results.
The results of the present meta-analysis indicated that the pooled sensitivities of pleural
and blood IGRAs were 0.75 and 0.80, respectively and their specificities were 0.82 and 0.72,
respectively. These data suggest that both the sensitivity and specificity of IGRAs were not as
high as expected. Positive results from IGRAs may be helpful in confirming (ruling in) TPE;
on the other hand, the relatively low sensitivity indicated that it would not be possible to
exclude TPE when a patient’s IGRA result was below the cut-off value.
Unlike a traditional ROC plot that explores the effect of varying thresholds (cut points
for determining positive tests) on sensitivity and specificity in a single study, each data point
in the SROC plot represents a separate study. The SROC curve presents a global summary of
test performance, and shows the trade off between sensitivity and specificity. The results of
the analysis based on the SROC curve showed an optimum cut-off for sensitivity and
specificity of pleural and blood IGRAs of 0.81 and 0.78, respectively, while the AUCs were
0.88 and 0.85, respectively, indicating that overall accuracy was also not as high as expected.
13
The DOR is a single indicator of test accuracy (30) that combines the sensitivity and
specificity data into a single number. The DOR of a test is the ratio of the odds of positive test
results in the diseased group to the odds of positive test results in the non-diseased group. The
DOR ranges in value from 0 to infinity, with higher values indicating better discriminatory
performance (higher accuracy) of the test. A DOR of 1.0 indicates that the test does not
discriminate between patients with the disorder and those without it. In the present
meta-analysis, the pooled DORs of pleural and blood IGRAs were 19.04 and 11.06,
respectively, indicating that IGRAs may be helpful in the diagnosis of TPE. The diagnostic
accuracy of IGRAs for TPE appears to be similar to that of conventional tests such as
cytological examination, which have high specificity and low sensitivity. This similarity may
make IGRAs less useful in practice because they do not have test properties that complement
the properties of conventional tests.
Since the SROC curve and the DOR are not easy to interpret and use in clinical practice,
and since likelihood ratios are considered more meaningful clinically (31, 32), both PLR and
NLR are also presented as measures of diagnostic accuracy. Likelihood ratios >10 or <0.1
generate large and often conclusive shifts from pretest to post-test probability, indicating high
accuracy. A PLR of 3.49 for pleural IGRAs suggests that patients with TPE have about a
3-fold higher chance of a positive IGRA test compared to patients without TPE, and this PLR
is not high enough for clinical purposes. On the other hand, the NLR for pleural IGRAs was
0.24. If the pleural IGRA result was negative, the probability that this patient had TPE would
be 24%, which is not low enough to rule out TPE. Very similar results were obtained for
blood IGRAs.
14
The PPV is the proportion of patients with positive test results who are correctly
diagnosed, while the NPV is the proportion of patients with negative test results who are
correctly diagnosed. The pooled results showed that the PPV for pleural IGRAs was 0.85,
suggesting that 15% of positive results would actually be false positives. On the other hand,
the NPV of pleural IGRAs was 0.70, indicating a false negative rate of 30%. Similar results
were observed for the blood IGRAs. The relatively low PPV and NPV suggest that IGRAs
would not be acceptable for clinical purposes.
Although the principle of both ELISPOT and ELISA is based on IFN-γ release after
stimulation by specific antigens, there are some differences between the two methods.
Therefore, the overall diagnostic values for ELISPOT and ELISA were compared. As shown
in Table 2, the sensitivity, DOR, and AUC for pleural ELISPOT were higher than those for
pleural ELISA. In contrast, the specificity, PLR, NLR, PPV, and NPV of pleural ELISPOT
were lower than those for pleural ELISA. Similar results were observed for blood IGRAs.
Therefore, it could not be concluded that the overall accuracy of ELISPOT for the diagnosis
of TPE was superior or inferior to that of ELISA.
An exploration of the reasons for heterogeneity, rather than computation of a single
summary measure, is an important goal of meta-analysis (33). Both STARD and QUADAS
scores were used in the meta-regression analysis to assess the effect of study quality on
RDOR. The higher quality studies (STARD ≥ 13 or QUADAS ≥ 11) did not show better test
performance than the lower quality studies, although there was significant heterogeneity for
sensitivity, specificity, PLR, NLR, PPV, NPV, and DOR between pleural IGRA studies. The
assay method (ELISPOT versus ELISA) also did not substantially affect diagnostic accuracy

15
for either pleural or blood IGRAs. In those studies performed in settings with a low burden of
tuberculosis, with largely immunocompetent patient populations, pleural fluid T cell
responses to stimulation with ESAT-6 and CFP-10 appeared to be significantly greater than
those elicited in peripheral blood (20, 21). Moreover, blood IGRAs performed in low burden
settings demonstrated a reasonable NPV for TPE, and pleural IGRAs appeared to produce
even fewer false-negative results (11). In the present meta-analysis, the study setting (low
versus high burden) did not affect the diagnostic accuracy of either pleural or blood IGRAs,
although the P value (0.062) almost reached statistical significance.
This meta-analysis has limitations. First, exclusion of conference abstracts, letters to the
editor, and non-English language articles may have contributed to the observed publication
bias. However, a review of the conference abstracts and letters suggested that the overall
results were similar to those from the English language articles that were included.
Publication bias may also be introduced by inflation of the estimates of diagnostic accuracy,
since studies that report positive results are more likely to be accepted for publication. Second,
the number of studies available for inclusion in the present meta-analysis was limited, with
some studies involving less than 10 TPE specimens; very small studies may be vulnerable to
selection bias. Third, there may have been misclassification bias. The diagnosis of TPE was
made by bacteriological or histological assessment, or both (gold standard) in only two of the
seven studies; in the remaining five studies (21-25), some TPE patients were diagnosed on the
basis of bacteriological or histological results, and some were diagnosed on the basis of
clinical course, including presentation, pleural fluid analysis, radiology and responsiveness to
anti-tuberculosis chemotherapy. This issue of diagnostic accuracy may have caused
16
non-random misclassification, leading to biased results.
It has been reported that blood IGRAs do not distinguish between latent and active
tuberculosis (34). In contrast, the frequency of clonally expanded antigen-specific T cells is
much greater at the site of TPE than in peripheral blood, and these cells should not be present
in non-TPE patients (19). Theoretically, tuberculosis antigen-specific responses should
distinguish active TPE from alternative diagnoses and should have greater discriminatory
value than non-specific inflammatory biomarkers such as unstimulated IFN-γ or adenosine
deaminase (ADA). However, in a previous meta-analysis (10), we reported that the summary
estimates for IFN-γ in the diagnosis of TPE were: sensitivity 0.89 (0.87 – 0.91), specificity
0.97 (0.96 – 0.98), PLR 23.45 (17.31 – 31.78), NLR 0.11 (0.07 – 0.16), and DOR 272.7
(147.5 – 504.2). In another meta-analysis (35), we reported that the summary estimates for
(ADA) in the diagnosis of TPE were: sensitivity 0.92 (0.9 – 0.93), specificity 0.9 (0.89 – 0.91),
PLR 9.03 (7.19 – 11.35), NLR 0.1 (0.07 – 0.14), and DOR 110.08 (69.96 – 173.2). Therefore,
based on comparisons of the above measures, the overall accuracy of IGRAs for diagnosing
TPE appeared to be inferior to that of either IFN-γ or ADA. It is unclear why IFN-γ performs
better than IGRAs. First, anatomical factors such as the confined pleural space, which allows
accumulation of cytokines, may play a role, in addition to end-stage activation of immune
cells in TPE. Another possibility is the translocation of blood tuberculosis antigen-specific T
cells through an inflamed or “leaky” pleura in subjects without TPE, who had a high
frequency of peripheral antigen-specific T cells due to latent tuberculosis infection. The third
explanation for the poor diagnostic accuracy of IGRAs may also include transient exposure to
non-replicating persistent MTB organisms in the pleural space of patients without TPE.
17
As discussed previously, the overall test performance of pleural and blood IGRAs for the
diagnosis of TPE, including sensitivity, specificity, PLR, NLR, PPV, NPV, and DOR, were
not as high as expected. False positive test results are common for pleural fluid and blood
IGRAs, because of the inability of IGRAs to distinguish active from latent tuberculosis (11,
24). In the present meta-analysis, false positive results appeared to be less frequent when
pleural fluid was used, but in patients with latent infection, the inevitable passage of
circulating pre-sensitized T cells of non-tuberculous origin into the pleural space will always
result in suboptimal specificity. Pleural fluid appears to be different from other body fluids,
including BAL (36, 37) and cerebrospinal fluid (38). In previous studies, IGRAs on BAL or
cerebrospinal fluid were shown to be useful rapid immunodiagnostic tests for tuberculosis
(36-38).
In summary, since IGRAs are technically complex and expensive, it is unlikely that these
assays will make an additional contribution in clinical practice, especially when IFN-γ and
ADA assays are available. It was concluded from this meta-analysis that current evidence did
not support the use of IGRAs for the diagnosis of tuberculous pleurisy.

18
ACKNOWLEDGEMENTS
We are grateful Dr. K. Dheda and Dr. R. N. van Zyl-Smit for sending additional information
on their primary studies. This study was supported by a grant from the National Science Fund
for Distinguished Young Scholars (No. 30925032) and by grants from the National Natural
Science Foundation of China (No. 30872343 and No. 30770648).

19
REFERENCES
1 Escudero Bueno C, Garcia Clemente M, Cuesta Castro B et al. Cytologic and
bacteriologic analysis of fluid and pleural biopsy specimens with Cope’s needle. Study
of 414 patients. Arch. Intern. Med. 1990; 150: 1190-4.
2 Valdes L, Alvarez D, San Jose E et al. Tuberculous pleurisy. A study of 254 patients. Arch.
Intern. Med. 1998; 158: 2017-21.
3 Porcel JM. Tuberculous pleural effusion. Lung 2009; 187: 263-70.
4 Trajman A, Pai M, Dheda K et al. Novel tests for diagnosing tuberculous pleural effusion:
what works and what does not? Eur. Respir. J. 2008; 31: 1098-106.
5 Perez-Rodriguez E, Jimenez Castro D. The use of adenosine deaminase and adenosine
deaminase isoenzymes in the diagnosis of tuberculous pleuritis. Curr. Opin. Pulm. Med.
2000; 6: 259-66.
6 Barnes PF, Mistry SD, Cooper CL et al. Compartmentalization of a CD4+ T lymphocyte
subpopulation in tuberculous pleuritis. J. Immunol. 1989; 142: 1114-9.
7 Yang HB, Shi HZ. T lymphocytes in pleural effusion. Chin. Med. J. 2008; 121: 579-80.
8 Mitra DK, Sharma SK, Dinda AK et al. Polarized helper T cells in tubercular pleural
effusion: phenotypic identity and selective recruitment. Eur. J. Immunol. 2005; 35:
2367-75.
9 Yamada Y, Nakamura A, Hosoda M et al. Cytokines in pleural liquid for diagnosis of
tuberculous pleurisy. Respir. Med. 2001; 95: 577-81.
10 Jiang J, Shi HZ, Liang QL et al. Diagnostic value of interferon-gamma in tuberculous
pleurisy: a meta-analysis. Chest 2007; 131: 1133-41.
11 Hooper CE, Lee YCG, Maskell NA. Interferon-gamma release assays for the diagnosis of

20
TB pleural effusions: hype or real hope? Curr. Opin. Pulm. Med. 2009; 15: 358-65.
12 Bossuyt PM, Reitsma JB, Bruns DE et al. Standards for Reporting of Diagnostic Accuracy.
Towards complete and accurate reporting of studies of diagnostic accuracy: the STARD
initiative. BMJ 2003; 326: 41-4.
13 Whiting P, Rutjes AW, Reitsma JB et al. The development of QUADAS: a tool for the
quality assessment of studies of diagnostic accuracy included in systematic reviews. BMC
Med. Res. Methodol. 2003; 3: 25.
14 Deville WL, Buntinx F, Bouter LM et al. Conducting systematic reviews of diagnostic
studies: didactic guidelines. BMC Med. Res. Methodol. 2002; 2: 9.
15 Moses LE, Shapiro D, Littenberg B. Combining independent studies of a diagnostic test
into a summary ROC curve: data-analytic approaches and some additional considerations.
Stat. Med. 1993; 12: 1293-316.
16 Irwig L, Macaskill P, Glasziou P et al. Meta-analytic methods for diagnostic test accuracy.
J. Clin. Epidemiol. 1995; 48: 119-30.
17 Vamvakas EC. Meta-analyses of studies of the diagnostic accuracy of laboratory tests: a
review of the concepts and methods. Arch. Pathol. Lab. Med. 1998; 122: 675-86.
18 Egger M, Davey Smith G, Schneider M et al. Bias in meta-analysis detected by a simple,
graphical test. BMJ 1997; 315: 629-34.
19 Wilkinson KA, Wilkinson RJ, Pathan A et al. Ex vivo characterization of early secretory
antigenic target 6-specific T cells at sites of active disease in pleural tuberculosis. Clin.
Infect. Dis. 2005; 40: 184-7.
20 Ariga H, Kawabe Y, Nagai H et al. Diagnosis of active tuberculous serositis by
21
antigen-specific interferon-gamma response of cavity fluid cells. Clin. Infect. Dis. 2007;
45: 1559-67.
21 Losi M, Bossink A, Codecasa L et al. Use of a T-cell interferon-gamma release assay for
the diagnosis of tuberculous pleurisy. Eur. Respir. J. 2007; 30: 1173-9.
22 Baba K, Sørnes S, Hoosen AA et al. Evaluation of immune responses in HIV infected
patients with pleural tuberculosis by the QuantiFERON TB-Gold interferon-gamma assay.
BMC Infect. Dis. 2008; 8: 35.
23 Chegou NN, Walzl G, Bolliger CT et al. Evaluation of adapted whole-blood
interferon-gamma release assays for the diagnosis of pleural tuberculosis. Respiration
2008; 76: 131-8.
24 Dheda K, van Zyl-Smit RN, Sechi LA et al. Utility of quantitative T-cell responses versus
unstimulated interferon-γ for the diagnosis of pleural tuberculosis. Eur. Respir. J. 2009;
34: 1118-26.
25 Lee LN, Chou CH, Wang JY et al. Enzyme-linked immunospot assay for interferon-γ in
the diagnosis of tuberculous pleurisy. Clin. Microbiol. Infect. 2009; 15: 173-9.
26 Kobashi Y, Shimizu H, Mouri K et al. Rapid diagnosis of tuberculous pleuritis by a T-cell
interferon-γ release assay. Scand. J. Infect. Dis. 2009; 41: 232-6.
27 Pai M, Riley LW, Colford JM Jr. Interferon-gamma assays in the immunodiagnosis of
tuberculosis: a systematic review. Lancet Infect. Dis. 2004; 4: 761-76.
28 Pai M, Zwerling A, Menzies D. Systematic review: T-cell-based assays for the diagnosis
of latent tuberculosis infection: an update. Ann. Intern. Med. 2008; 149: 177-84.
29 Joshi R, Pai M. Can pleural tuberculosis be diagnosed using interferon-gamma release
22
assays? Respiration 2008; 76: 128-30.
30 Glas AS, Lijmer JG, Prins MH et al. The diagnostic odds ratio: a single indicator of test
performance. J. Clin. Epidemiol. 2003; 56: 1129-35.
31 Deeks JJ. Systematic reviews of evaluations of diagnostic and screening tests. In: Egger
M, Smith GD, Altman DG (eds.) Systematic Reviews in Health Care. Meta-analysis in
Context. BMJ Publishing Group, London, 2001: 248-82.
32 Jaeschke R, Guyatt G, Lijmer J. Diagnostic tests. In: Guyatt G, Rennie D (eds.) Users’
Guides to the Medical Literature. A Manual for Evidence-Based Clinical Practice. AMA
Press, Chicago, 2002: 121-40.
33 Petitti DB. Approaches to heterogeneity in meta-analysis. Stat. Med. 2001; 20: 3625-33.
34 Pai M, Dheda K, Cunningham J et al. T-cell assays for the diagnosis of latent tuberculosis
infection: moving the research agenda forward. Lancet Infect. Dis. 2007; 7: 428-38.
35 Liang QL, Shi HZ, Wang K et al. Diagnostic precision of adenosine deaminase in
tuberculous pleurisy: a meta-analysis. Respir. Med. 2008; 102: 744-54.
36 Dheda K, van Zyl-Smit RN, Meldau R et al. Quantitative lung T cell responses aid the
rapid diagnosis of pulmonary tuberculosis. Thorax 2009; 64: 847-53.
37 Jafari C, Thijsen S, Sotgiu G et al. Bronchoalveolar lavage enzyme-linked immunospot
for a rapid diagnosis of tuberculosis: a Tuberculosis Network European Trialsgroup study.
Am. J. Respir. Crit. Care Med. 2009; 180: 666-73.
38 Patel VB, Singh R, Connolly C et al. Cerebrospinal T cell responses aid the diagnosis of
tuberculous meningitis in a HIV and TB endemic population. Am. J. Respir. Crit. Care
Med. 2010; 182: 569-77.
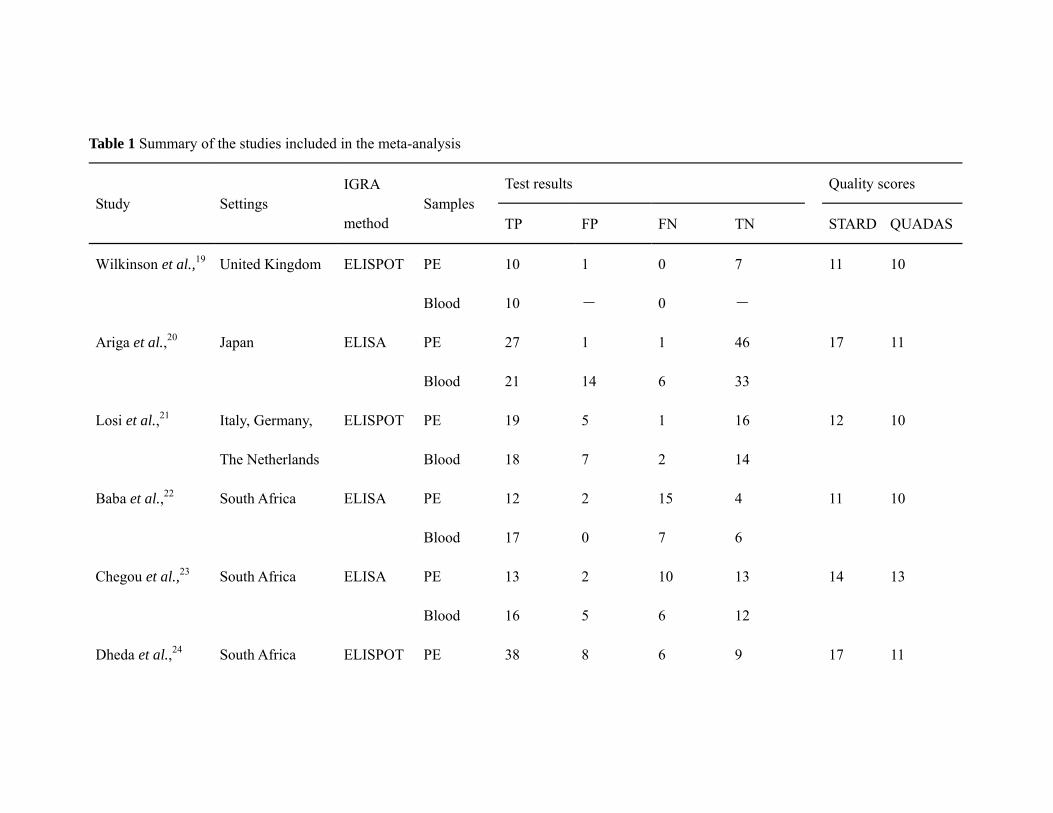
Table 1 Summary of the studies included in the meta-analysis
Study Settings IGRA
method Samples
Test results Quality scores
TP FP FN TN STARD QUADAS
Wilkinson et al.,19 United Kingdom ELISPOT PE
Blood
10 1 0 7 11 10
10 - 0 -
Ariga et al.,20 Japan ELISA PE
Blood
27 1 1 46 17 11
21 14 6 33
Losi et al.,21 Italy, Germany,
The Netherlands
ELISPOT PE
Blood
19 5 1 16 12 10
18 7 2 14
Baba et al.,22 South Africa ELISA PE
Blood
12 2 15 4 11 10
17 0 7 6
Chegou et al.,23 South Africa ELISA PE
Blood
13 2 10 13 14 13
16 5 6 12
Dheda et al.,24 South Africa ELISPOT PE 38 8 6 9 17 11
1
Blood 30 7 6 9
ELISA PE
Blood
23 6 19 12
26 4 4 9
Lee et al.,25 Taiwan ELISPOT PE
Blood
18 3 1 18 12 9
14 2 4 19
IGRA, T cell interferon-γ release assay; ELISPOT, enzyme-linked immunosorbent spot; PE, pleural effusion; TP, true positive; FP, false
positive; FN, false negative; TN, true negative; STARD, standards for reporting diagnostic accuracy; QUADAS, quality assessment for studies
of diagnostic accuracy.
2
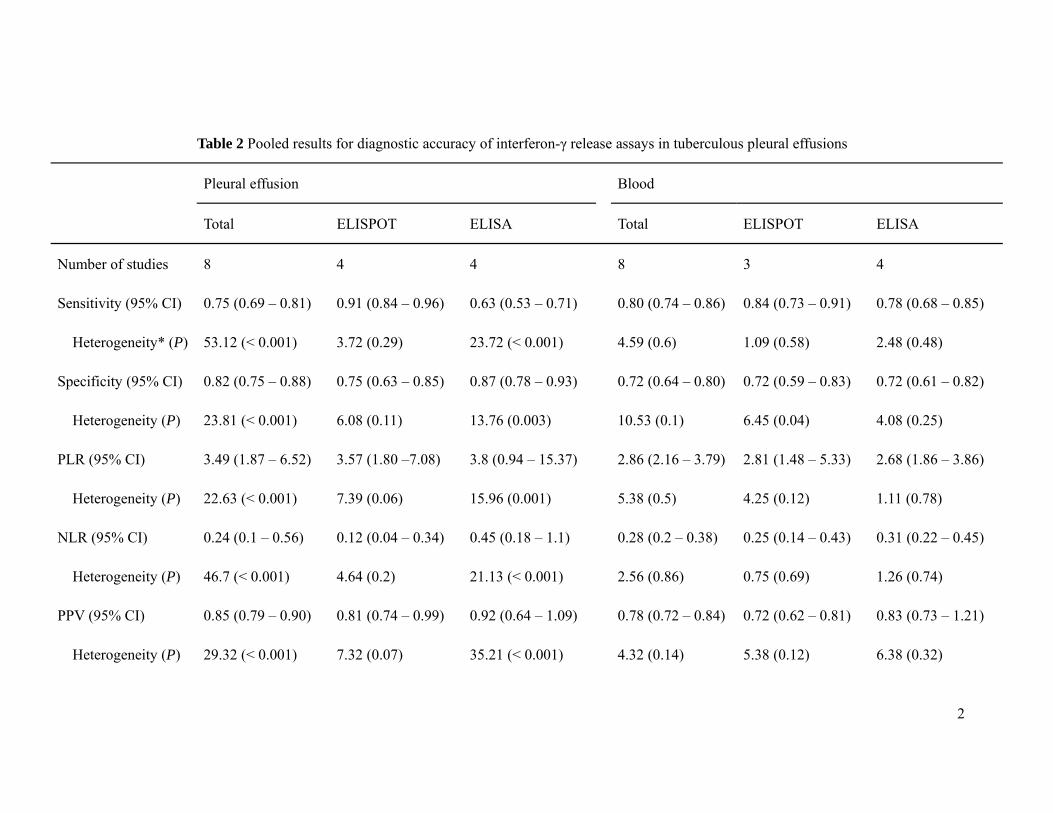
Table 2 Pooled results for diagnostic accuracy of interferon-γ release assays in tuberculous pleural effusions
Pleural effusion Blood
Total ELISPOT ELISA Total ELISPOT ELISA
Number of studies 8 4 4 8 3 4
Sensitivity (95% CI)
Heterogeneity* (P)
0.75 (0.69 – 0.81)
53.12 (< 0.001)
0.91 (0.84 – 0.96)
3.72 (0.29)
0.63 (0.53 – 0.71)
23.72 (< 0.001)
0.80 (0.74 – 0.86)
4.59 (0.6)
0.84 (0.73 – 0.91)
1.09 (0.58)
0.78 (0.68 – 0.85)
2.48 (0.48)
Specificity (95% CI)
Heterogeneity (P)
0.82 (0.75 – 0.88)
23.81 (< 0.001)
0.75 (0.63 – 0.85)
6.08 (0.11)
0.87 (0.78 – 0.93)
13.76 (0.003)
0.72 (0.64 – 0.80)
10.53 (0.1)
0.72 (0.59 – 0.83)
6.45 (0.04)
0.72 (0.61 – 0.82)
4.08 (0.25)
PLR (95% CI)
Heterogeneity (P)
3.49 (1.87 – 6.52)
22.63 (< 0.001)
3.57 (1.80 –7.08)
7.39 (0.06)
3.8 (0.94 – 15.37)
15.96 (0.001)
2.86 (2.16 – 3.79)
5.38 (0.5)
2.81 (1.48 – 5.33)
4.25 (0.12)
2.68 (1.86 – 3.86)
1.11 (0.78)
NLR (95% CI)
Heterogeneity (P)
0.24 (0.1 – 0.56)
46.7 (< 0.001)
0.12 (0.04 – 0.34)
4.64 (0.2)
0.45 (0.18 – 1.1)
21.13 (< 0.001)
0.28 (0.2 – 0.38)
2.56 (0.86)
0.25 (0.14 – 0.43)
0.75 (0.69)
0.31 (0.22 – 0.45)
1.26 (0.74)
PPV (95% CI)
Heterogeneity (P)
0.85 (0.79 – 0.90)
29.32 (< 0.001)
0.81 (0.74 – 0.99)
7.32 (0.07)
0.92 (0.64 – 1.09)
35.21 (< 0.001)
0.78 (0.72 – 0.84)
4.32 (0.14)
0.72 (0.62 – 0.81)
5.38 (0.12)
0.83 (0.73 – 1.21)
6.38 (0.32)
3
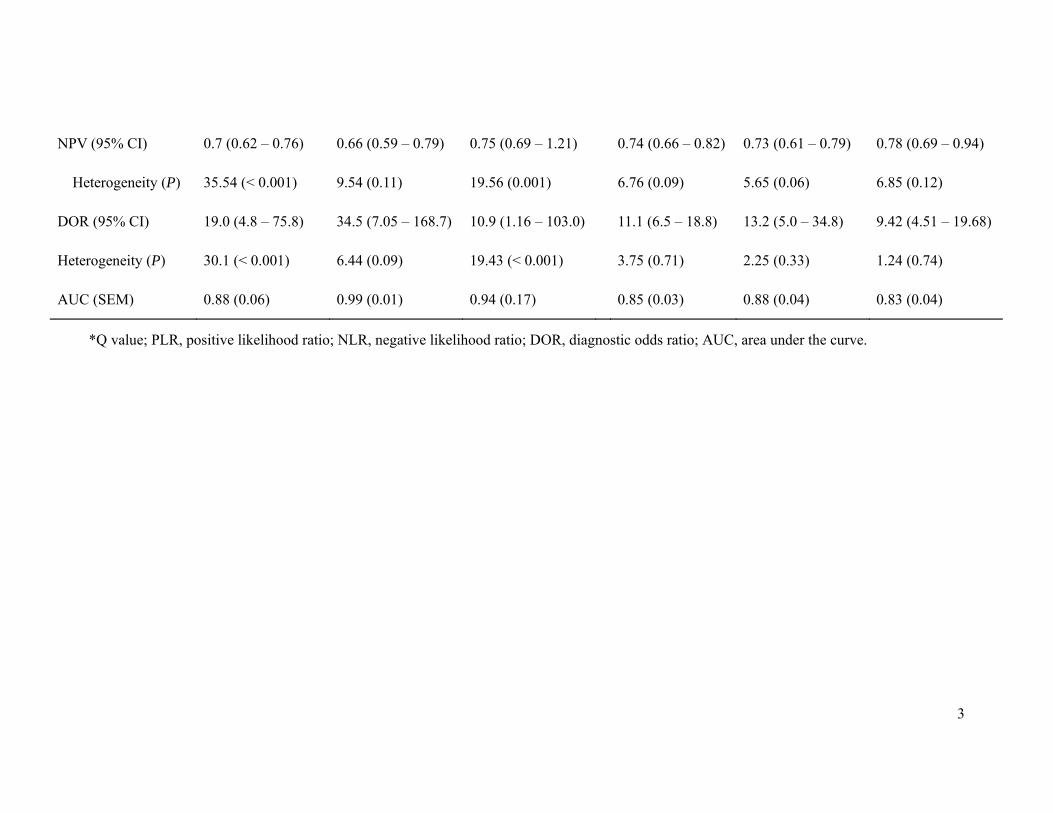
NPV (95% CI)
Heterogeneity (P)
0.7 (0.62 – 0.76)
35.54 (< 0.001)
0.66 (0.59 – 0.79)
9.54 (0.11)
0.75 (0.69 – 1.21)
19.56 (0.001)
0.74 (0.66 – 0.82)
6.76 (0.09)
0.73 (0.61 – 0.79)
5.65 (0.06)
0.78 (0.69 – 0.94)
6.85 (0.12)
DOR (95% CI)
Heterogeneity (P)
19.0 (4.8 – 75.8)
30.1 (< 0.001)
34.5 (7.05 – 168.7)
6.44 (0.09)
10.9 (1.16 – 103.0)
19.43 (< 0.001)
11.1 (6.5 – 18.8)
3.75 (0.71)
13.2 (5.0 – 34.8)
2.25 (0.33)
9.42 (4.51 – 19.68)
1.24 (0.74)
AUC (SEM) 0.88 (0.06) 0.99 (0.01) 0.94 (0.17) 0.85 (0.03) 0.88 (0.04) 0.83 (0.04)
*Q value; PLR, positive likelihood ratio; NLR, negative likelihood ratio; DOR, diagnostic odds ratio; AUC, area under the curve.

4
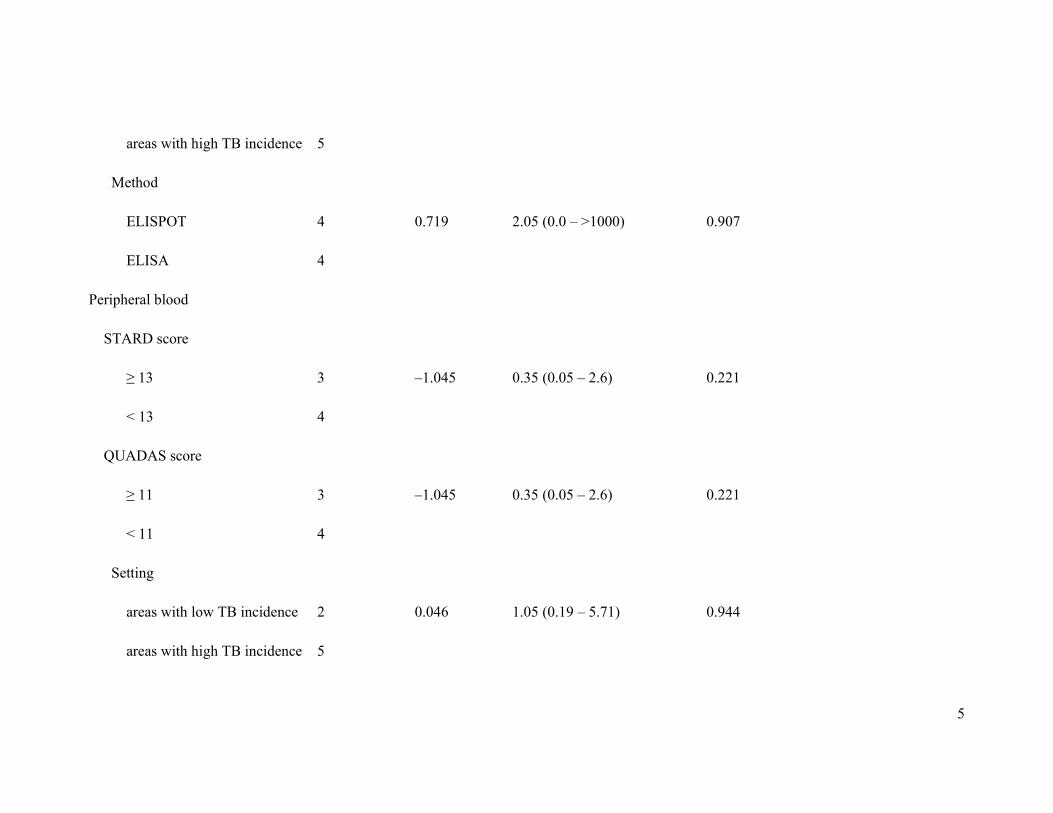
Table 3 Weighted meta-regression of the effects of study settings, methods and methodological quality on diagnostic accuracy of interferon-γ
release assays
Covariate Number of
studies Coefficient RDOR (95% CI) P value
Pleural effusion
STARD score
≥ 13
< 13
3
5
–0.094
0.91 (0.01 – 114.15)
0.962
QUADAS score
≥ 11
< 11
3
5
–0.094
0.91 (0.01 – 114.15)
0.962
Setting
areas with low TB incidence
3
3.239
25.5 (0.79 – 821.68)
0.062
5
areas with high TB incidence 5
Method
ELISPOT
ELISA
4
4
0.719
2.05 (0.0 – >1000)
0.907
Peripheral blood
STARD score
≥ 13
< 13
3
4
–1.045
0.35 (0.05 – 2.6)
0.221
QUADAS score
≥ 11
< 11
3
4
–1.045
0.35 (0.05 – 2.6)
0.221
Setting
areas with low TB incidence
areas with high TB incidence
2
5
0.046
1.05 (0.19 – 5.71)
0.944

6
Method
T-SPOT-TB
QFN-TB
3
4
0.491
1.63 (0.29 – 9.19)
0.474
RDOR, relative diagnostic odds ratio; STARD, standards for reporting diagnostic accuracy; ELISPOT, enzyme-linked immunosorbent spot;
QUADAS, quality assessment for studies of diagnostic accuracy; TB, tuberculosis.
Figure legends
Figure 1 Forest plot showing estimates of sensitivity and specificity for T-cell interferon-γ
release assays in pleural fluid (a) and peripheral blood (b) for the diagnosis of tuberculous
pleurisy. The point estimates of sensitivity and specificity from each study are shown as solid
circles. Error bars indicate 95% CI. Numbers indicate the studies included in the
meta-analysis, as cited in the reference list.
Figure 2 Summary receiver operating characteristic (SROC) curves for T-cell interferon-γ
release assays in pleural fluid (a) and peripheral blood (b). Solid circles represent each study
included in the meta-analysis. The size of each study is indicated by the size of the solid
circle. The regression SROC curves summarize the overall diagnostic accuracy.
Figure 3 Funnel graph for the assessment of potential publication bias in studies of T-cell
interferon-γ release assays in pleural fluid (a) and peripheral blood (b). The funnel graph plots
the log of the diagnostic odds ratio (DOR) against the standard error of the log of the DOR
(an indicator of sample size). Solid circles represent each study in the meta-analysis. The
central lines indicate the summary DORs.
resp_1941_f1.tif
resp_1941_f2.tif

resp_1941_f3.tif