diagnostic accuracy of rating scales for attention-deficit ...edition and fourth edition and...
TRANSCRIPT
REVIEW ARTICLEPEDIATRICS Volume 137 , number 3 , March 2016 :e 20152749
Diagnostic Accuracy of Rating Scales for Attention-Deficit/Hyperactivity Disorder: A Meta-analysisLing-Yin Chang, PhD,a Mei-Yeh Wang, PhD,b Pei-Shan Tsai, PhDa
abstractCONTEXT: The Child Behavior Checklist–Attention Problem (CBCL-AP) scale and Conners
Rating Scale–Revised (CRS-R) are commonly used behavioral rating scales for diagnosing
attention-deficit/hyperactivity disorder (ADHD) in children and adolescents.
OBJECTIVE: To evaluate and compare the diagnostic performance of CBCL-AP and CRS-R in
diagnosing ADHD in children and adolescents.
DATA SOURCES: PubMed, Ovid Medline, and other relevant electronic databases were searched
for articles published up to May 2015.
STUDY SELECTION: We included studies evaluating the diagnostic performance of either CBCL-AP
scale or CRS-R for diagnosing ADHD in pediatric populations in comparison with a defined
reference standard.
DATA EXTRACTION: Bivariate random effects models were used for pooling and comparing
diagnostic performance.
RESULTS: We identified and evaluated 14 and 11 articles on CBCL-AP and CRS-R, respectively.
The results revealed pooled sensitivities of 0.77, 0.75, 0.72, and 0.83 and pooled specificities
of 0.73, 0.75, 0.84, and 0.84 for CBCL-AP, Conners Parent Rating Scale–Revised, Conners
Teacher Rating Scale–Revised, and Conners Abbreviated Symptom Questionnaire (ASQ),
respectively. No difference was observed in the diagnostic performance of the various
scales. Study location, age of participants, and percentage of female participants explained
the heterogeneity in the specificity of the CBCL-AP.
CONCLUSIONS: CBCL-AP and CRS-R both yielded moderate sensitivity and specificity in
diagnosing ADHD. According to the comparable diagnostic performance of all examined
scales, ASQ may be the most effective diagnostic tool in assessing ADHD because of its
brevity and high diagnostic accuracy. CBCL is recommended for more comprehensive
assessments.
aSchool of Nursing, College of Nursing, Taipei Medical University, Taipei, Taiwan; and bDepartment of Nursing, Cardinal Tien Junior College of Healthcare and Management, New Taipei City,
Taiwan
Dr Chang conceptualized and designed the study, performed the analyses, and drafted the initial manuscript; Professor Wang participated in the study selection and
data extraction process, conducted the quality assessment of the study, and reviewed and revised the manuscript; Professor Tsai participated in the study design,
coordinated and supervised data collection, and critically reviewed and revised the manuscript; and all authors approved the fi nal manuscript and are accountable
for all aspects of the study.
DOI: 10.1542/peds.2015-2749
Accepted for publication Dec 8, 2015
To cite: Chang L, Wang M, Tsai P. Diagnostic Accuracy of Rating Scales for Attention-Defi cit/Hyperactivity Disorder: A Meta-analysis. Pediatrics. 2016;137(3):e20152749
by guest on March 1, 2020www.aappublications.org/newsDownloaded from

CHANG et al
Attention-deficit/hyperactivity
disorder (ADHD), the most prevalent
neurodevelopmental disorder among
children and adolescents, affects ∼5
in 100 children in the United States.1
The prevalence of ADHD increased by
an average 3% annually from 1997 to
2006 and an average ∼5% annually
from 2003 to 2011.2 ADHD symptoms
can cause functional impairments in
numerous settings, such as schools,
homes, and communities.3 For
example, several negative outcomes,
such as poor peer relationships,4
high risk of injury,5 and low academic
performance,6 have been associated
with ADHD. ADHD considerably
affects the society and economy.7,8
Therefore, it is crucial to identify
children and adolescents with ADHD
so that appropriate treatments and
interventions can be applied for
preventing the adverse consequences
associated with this disorder.
Diagnostic criteria for identifying
ADHD are based on behavioral
symptoms, because of the lack of
reliable biological markers for
diagnosing ADHD.9 Behavior rating
scales, which comprise checklists
that examine various behaviors and
symptoms, are the most common
ADHD assessment tools in schools
and communities because of their
uncomplicated administration and
high time- and cost-efficiency.10
The Child Behavior Checklist
(CBCL)11 and Conners Rating
Scale–Revised (CRS-R)12 are
commonly used diagnostic tools
for identifying ADHD in children
and adolescents because of their
adequately established reliability
and validity. CBCL is a parent-
rated questionnaire for assessing a
wide range of child emotional and
behavioral problems. The CBCL-
Attention Problem (CBCL-AP)
subscale, 1 of the 8 empirically
derived clinical syndrome subscales
of the CBCL, is frequently used as
a diagnostic tool for ADHD and
has strong discriminatory power
for detecting ADHD in children
and adolescents.13,14 In contrast
to CBCL, CRS-R is specifically
designed for assessing ADHD and
its related behavioral problems in
children and adolescents (ages 3
to 17 years). CRS-R includes both
long and short versions of parent
and teacher rating scales as well
as various subscales—namely
oppositional, cognitive problem
or inattention, and hyperactivity
subscales—and an ADHD index.
Furthermore, an abridged version
of CRS-R, the Conners Abbreviated
Symptom Questionnaire (ASQ),
contains 10 identical items for
parent and teacher rating
scales.
Despite the availability of several
comprehensive reviews on the
psychometric properties of CBCL
and CRS-R,10,15–18 the sensitivity,
specificity, and diagnostic odds
ratio (DOR) of these tools,
indicative of their diagnostic
performance, have been rarely
examined. To the best of our
knowledge, no meta-analyses have
reported pooled estimates of the
diagnostic accuracy of CBCL-AP
and CRS-R. Moreover, no published
systematic review has compared
the diagnostic performance of
CBCL-AP and CRS-R. Therefore,
in this study, we identified and
compared the diagnostic accuracy
of these 2 ADHD diagnostic tools
in children and adolescents. Our
findings can help clinicians make
more informed decisions regarding
the selection of the most suitable
rating scales for assessments.
Rating scales with a comparatively
high accuracy can facilitate early
detection of ADHD and ensure
timely treatment.
METHODS
Data Sources and Search
We conducted this study according
to the recommendations of the
Cochrane Collaboration Diagnostic
Test Accuracy Working Group. We
searched for studies in 6 databases:
PubMed, Ovid Medline, Embase,
Cumulative Index to Nursing and
Allied Health Literature, PsycINFO,
and Web of Science. All search
processes were conducted from
January 30, 2015, to May 21, 2015.
We used a combination of MeSH
terms and keywords pertaining
to ADHD (“attention-deficit
hyperactivity disorder” OR “ADHD”
OR “hyperkinetic disorder”),
diagnostic accuracy (“sensitivity”
OR “specificity” OR “AUC” OR
“ROC” OR “predictive value” OR
“diagnostic accuracy” OR “diagnostic
performance” OR “diagnostic
utility”), AND the name of the
reviewed scale (“CBCL” OR “Child
Behavior Checklist” OR “Conners”
OR “CPRS” OR “CTRS” OR “ASQ”).
Additional eligible studies were
identified by manually searching
the reference lists of all the included
studies.
Study Selection
Titles and abstracts were
independently screened by 2
reviewers (Drs Chang and Wang).
After the exclusion of duplicates
from the eligible articles, full-
text articles were retrieved
and reviewed. The following
criteria were considered for
study inclusion: type of study,
participants, index test, target
condition, and reference standards.
Studies were excluded if they failed
to meet the inclusion criteria or if
essential information was missing
and could not be obtained from the
authors.
Types of Studies
Cross-sectional, cohort, and case-
control studies were included. These
studies evaluated the diagnostic
accuracy of the reviewed behavioral
rating scale in assessing ADHD
in children and adolescents in
comparison with a defined reference
standard. The studies were included
irrespective of publication status and
language.
2 by guest on March 1, 2020www.aappublications.org/newsDownloaded from
PEDIATRICS Volume 137 , number 3 , March 2016
Participants
Studies in which the study
populations were children and
adolescents aged 3 to 18 years
were included. Participants were
not restricted to specific settings;
specifically, participants from both
clinical and community settings were
included.
Index Test
Studies evaluating CBCL-AP or CRS-R
were included.
Target Condition
We included studies on all ADHD
types: predominantly inattentive,
predominantly hyperactive–
impulsive, and combined.
Reference Standard
The reference standard was a clinical
examination performed by qualified
professionals, psychiatrists, nurses,
and other trained personnel by using
criterian of Diagnostic and Statistical Manual of Mental Disorders, Third Edition and Fourth Edition and
International Classification of Diseases, Ninth Revision, Clinical Modification and Tenth Revision, Clinical Modification.
Data Extraction
Data were independently extracted
by 2 reviewers (Drs Chang and
Wang), and they resolved any
discrepancies through discussion.
The extracted study characteristics
are listed in Supplemental Table
3. Furthermore, we recorded the
number of true-positive, true-
negative, false-positive, and false-
negative results to construct a 2 ×
2 table for each study. If such data
were unavailable, we attempted to
derive them from summary statistics,
such as sensitivity, specificity, or
likelihood ratios, if reported. When
studies reported different cutoff
values for an index test, data from the
optimal cutoff value were extracted.
If a study presented different index
test cutoff values for male and female
participants, the data of the different
genders were analyzed separately.
Quality Assessment
The 2 reviewers individually
conducted a quality assessment
for each included study by using
the revised version of the Quality
Assessment of Diagnostic Accuracy
Studies (QUADAS-2) tool. This tool
comprises 4 key domains: patient
selection, index test, reference
standard, and flow and timing.
Each domain was assessed in terms
of the risk of bias, and the first 3
domains were also assessed for
concern regarding applicability
to the research question. Any
disagreements between the
reviewers were resolved through
discussion and by consulting the
corresponding author, if necessary.
Statistical Analysis
Data analyses were performed by
using Review Manager 5.2, Stata
Version 13 (metandi and midas
commands), and SAS Version 9.3.
Data Synthesis
Diagnostic data from each study
were fitted in a bivariate random
effects model,19 which estimates
pairs of logit-transformed sensitivity
and specificity from studies and
considers the correlation between
the sensitivity and specificity
observed among studies.20 We
also estimated pooled sensitivity,
specificity, likelihood ratios (LRs),
and DORs. DORs, defined as the
odds of obtaining a positive test
result in patients with a disease
compared with the odds of obtaining
a positive test result in participants
without a disease, were computed
as positive LRs (LR+) divided by
negative LRs (LR−).21 Statistical
differences in sensitivity, specificity,
and DORs between different scales
were further examined to compare
the diagnostic performance of
the selected diagnostic tools. We
plotted hierarchical summary
receiver operating characteristic
(HSROC) curves and estimated the
corresponding areas under the
curves (AUCs), which measure global
diagnostic accuracy by estimating the
probability of accurately classifying
a randomly selected participant as
a case or a control.20 According to
the guidelines for interpreting AUC
values,22 the diagnostic accuracy
of a test was categorized as low,
moderate, and high when AUC values
were 0.5–0.7, 0.7–0.9, and 0.9–1.0,
respectively.
Heterogeneity Evaluation
The heterogeneity of the diagnostic
test parameters was evaluated by
using I2 statistics, with 0% and
>50% indicating no observed
heterogeneity and substantial
heterogeneity, respectively.23 The
threshold effect was an essential
source of heterogeneity in this meta-
analysis. To determine whether
a threshold effect existed, we
calculated the Spearman correlation
between sensitivity and specificity.24
A significant negative correlation
(P < .05) suggested a threshold
effect. We explored other sources of
heterogeneity in pooled sensitivity
and specificity by including the
following study characteristics, one
at a time, into a bivariate regression
model25: sample sources, study
location, number of participants,
cutoff values, study year, age of
participants, percentage of female
participants, and QUADAS-2
items. LR tests were performed to
determine the statistical significance
of the results.
Publication Bias
Publication bias was detected by
regressing log DORs on the inverse
root of the effective sample size26
to examine funnel plot asymmetry,
with P < .10 for the slope coefficient
indicating significant asymmetry.
Sensitivity Analyses
We performed sensitivity analyses
to examine the robustness of the
3 by guest on March 1, 2020www.aappublications.org/newsDownloaded from
CHANG et al
results. First, we examined for
a particularly influential study
by using the Cook distance and
generated a scatter plot for
identifying outliers by using
standardized predicted random
effects (standardized level 2
residuals). Outliers and highly
influential studies were individually
excluded from the model to examine
the robustness of the results.27
RESULTS
Search Results
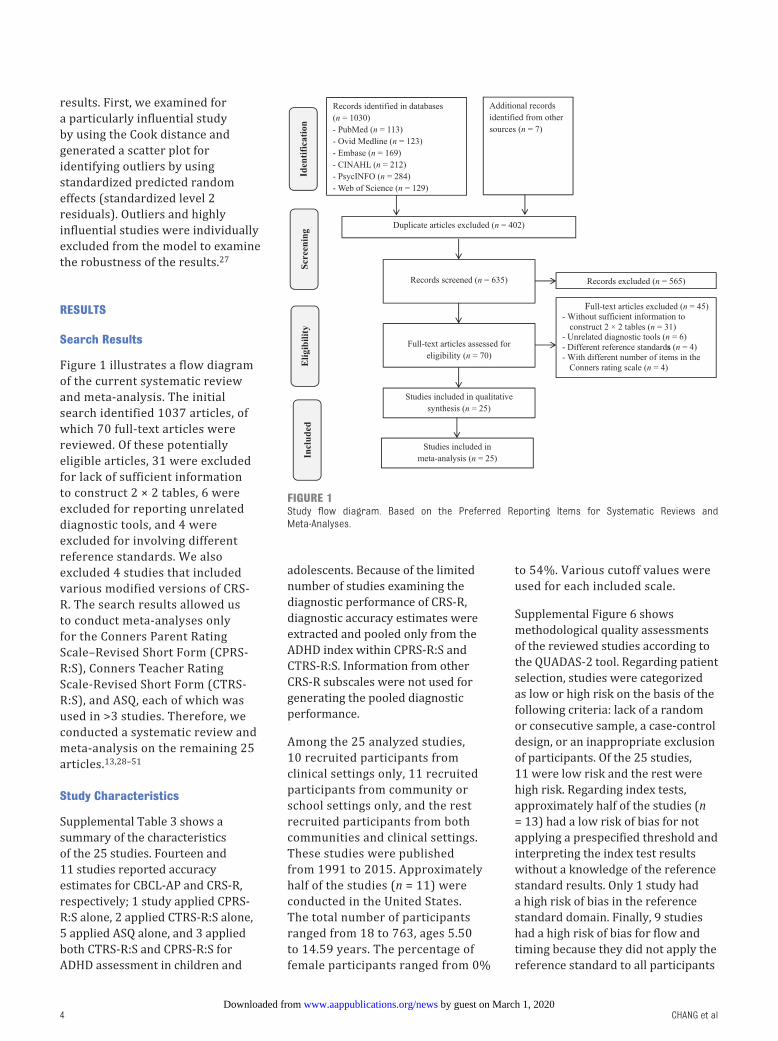
Figure 1 illustrates a flow diagram
of the current systematic review
and meta-analysis. The initial
search identified 1037 articles, of
which 70 full-text articles were
reviewed. Of these potentially
eligible articles, 31 were excluded
for lack of sufficient information
to construct 2 × 2 tables, 6 were
excluded for reporting unrelated
diagnostic tools, and 4 were
excluded for involving different
reference standards. We also
excluded 4 studies that included
various modified versions of CRS-
R. The search results allowed us
to conduct meta-analyses only
for the Conners Parent Rating
Scale–Revised Short Form (CPRS-
R:S), Conners Teacher Rating
Scale-Revised Short Form (CTRS-
R:S), and ASQ, each of which was
used in >3 studies. Therefore, we
conducted a systematic review and
meta-analysis on the remaining 25
articles.13,28–51
Study Characteristics
Supplemental Table 3 shows a
summary of the characteristics
of the 25 studies. Fourteen and
11 studies reported accuracy
estimates for CBCL-AP and CRS-R,
respectively; 1 study applied CPRS-
R:S alone, 2 applied CTRS-R:S alone,
5 applied ASQ alone, and 3 applied
both CTRS-R:S and CPRS-R:S for
ADHD assessment in children and
adolescents. Because of the limited
number of studies examining the
diagnostic performance of CRS-R,
diagnostic accuracy estimates were
extracted and pooled only from the
ADHD index within CPRS-R:S and
CTRS-R:S. Information from other
CRS-R subscales were not used for
generating the pooled diagnostic
performance.
Among the 25 analyzed studies,
10 recruited participants from
clinical settings only, 11 recruited
participants from community or
school settings only, and the rest
recruited participants from both
communities and clinical settings.
These studies were published
from 1991 to 2015. Approximately
half of the studies (n = 11) were
conducted in the United States.
The total number of participants
ranged from 18 to 763, ages 5.50
to 14.59 years. The percentage of
female participants ranged from 0%
to 54%. Various cutoff values were
used for each included scale.
Supplemental Figure 6 shows
methodological quality assessments
of the reviewed studies according to
the QUADAS-2 tool. Regarding patient
selection, studies were categorized
as low or high risk on the basis of the
following criteria: lack of a random
or consecutive sample, a case-control
design, or an inappropriate exclusion
of participants. Of the 25 studies,
11 were low risk and the rest were
high risk. Regarding index tests,
approximately half of the studies (n
= 13) had a low risk of bias for not
applying a prespecified threshold and
interpreting the index test results
without a knowledge of the reference
standard results. Only 1 study had
a high risk of bias in the reference
standard domain. Finally, 9 studies
had a high risk of bias for flow and
timing because they did not apply the
reference standard to all participants
4
FIGURE 1Study fl ow diagram. Based on the Preferred Reporting Items for Systematic Reviews and Meta-Analyses.
by guest on March 1, 2020www.aappublications.org/newsDownloaded from
PEDIATRICS Volume 137 , number 3 , March 2016
or failed to include all participants in
the analysis.
Meta-Analysis
Pooled Performance
Figure 2 illustrates a forest plot
of the coupled sensitivity and
specificity with 95% confidence
intervals (CIs) for each study
included in this meta-analysis.
Table 1 shows a summary of the
pooled estimates of the sensitivity,
specificity, LR+, LR−, and DORs
obtained from the bivariate model
for each diagnostic tool. Among
the studies on CBCL-AP, the pooled
sensitivity, specificity, and DOR
were 0.77 (95% CI 0.69–0.84), 0.73
(95% CI 0.64–0.81), and 9.37 (95%
CI 5.71–15.38), respectively. For
CRS-R, 83% of participants with
ADHD were accurately identified
using ASQ (95% CI 0.59–0.95),
whereas 75% were identified
using CPRS-R:S (95% CI 0.64–0.84)
and 72% using CTRS-R:S (95% CI
0.63–0.79). Regarding specificity,
84% of participants without ADHD
were accurately identified by using
ASQ and CTRS-R:S (95% CI 0.68–
0.93 and 0.69–0.93, respectively),
whereas 75% were identified using
CPRS-R:S (95% CI 0.64–0.84). In
addition, pooled DORs for CPRS-
R:S, CTRS-R:S, and ASQ were 8.95,
13.68, and 26.72, respectively.
No significant differences were
observed in sensitivity, specificity,
or DORs for any of the assessed
tools (all P > .05, Table 1).
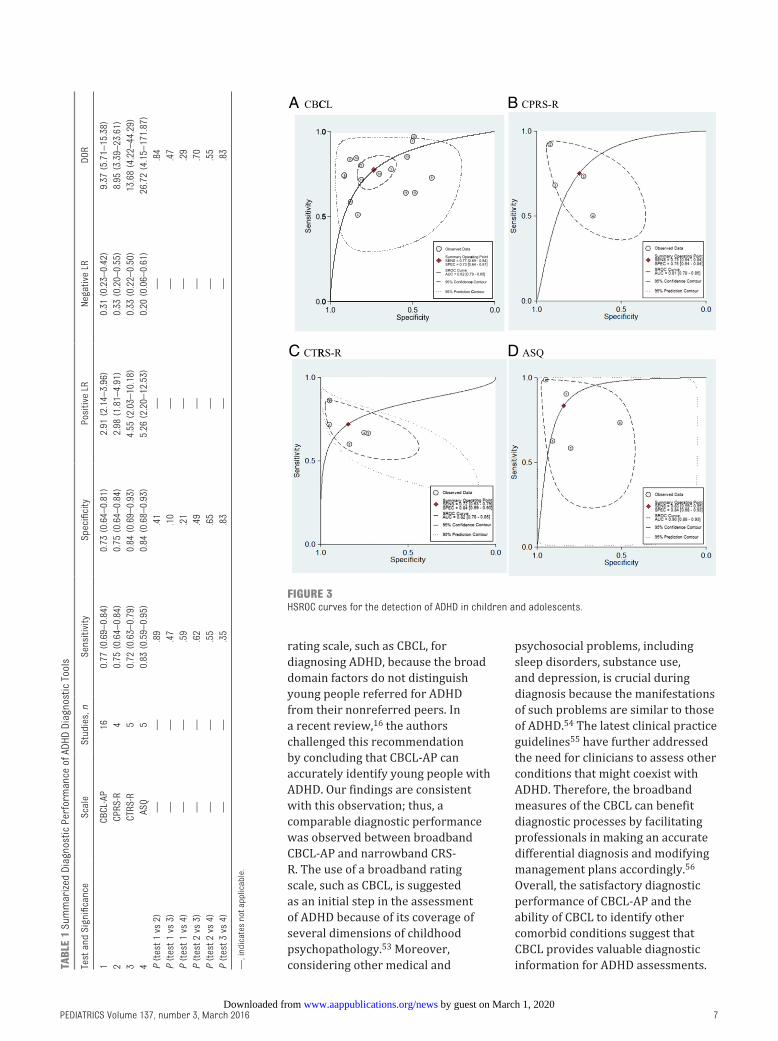
Figure 3 shows HSROC curves and
associated AUCs for the included
diagnostic tools. The AUCs were
0.82, 0.81, 0.82, and 0.90 for
CBCL-AP, CPRS-R:S, CTRS-R: S, and
ASQ, respectively. The prediction
region, which indicates the area
most likely to contain the true
mean test accuracy values of the
sensitivity and specificity for
each diagnostic tool, can be used
as a means of illustrating the
extent of statistical heterogeneity.
Heterogeneity was observed in
the included studies, with a higher
heterogeneity in sensitivity than in
specificity for CBCL-AP and CPRS-
R:S (Fig 3). Conversely, a higher
heterogeneity was observed in
specificity than in sensitivity for
CTRS-R:S and ASQ. The results
of the bivariate model revealed
substantial heterogeneity among
studies for each diagnostic tool (all
I2 > 50%).
Sources of Heterogeneity
The nonsignificant Spearman
correlations between sensitivity
and specificity of the reviewed
scales (all P > .05) suggested the
lack of a threshold effect in the
present meta-analysis (correlation
coefficients for CBCL-AP, CPRS-R:S,
CTRS-R:S, and ASQ were −0.31,
0.8, 0.6, and 0.5, respectively).
Table 2 shows the sources of
heterogeneity in studies examining
the diagnostic performance of
CBCL-AP. Because the number of
included studies was low, analyses
were not performed for other
included diagnostic tools. CBCL-AP
specificity was significantly higher
in studies conducted in the United
States than in those conducted in
other countries (0.81 and 0.64,
respectively; P = .03) and in older
participants (age ≥11 years) than
in younger ones (<11 years) (0.84
and 0.63, respectively; P < .01).
Compared with studies with a lower
percentage of female participants
(<35%), those with a higher
percentage (≥35%) demonstrated a
significantly higher specificity (0.64
and 0.83, respectively; P = .04). No
statistical significance in sensitivity
or specificity was observed
between other subgroups, namely
sample sources (clinic versus
nonclinic), number of participants
(≥200 vs <200), cut-off value (≥65
vs <65), study year (before 2005 vs
after 2005), and study quality (high
vs low risk), indicating that these
subgroups are unlikely sources of
heterogeneity.
Publication Bias
Figure 4 illustrates funnel plots
with superimposed regression lines
for each included diagnostic tool.
The statistically nonsignificant P
values (.61, .56, .47, and .85 for
CBCL-AP, CPRS-R: S, CTRS-R: S,
and ASQ, respectively) for the
slope coefficient suggest symmetry
in data and a low likelihood of
publication bias.
Sensitivity Analyses
Based on the Cook distance, studies
conducted by Roessner et al44
and Gargaro et al36 were the most
influential (Fig 5) for CBCL-AP
and CPRS-R:S, respectively.
However, only Roessner et al44
was identified as an outlier, with
the highest standardized residuals
for sensitivity (Fig 5). After we
excluded this study and refitted the
model for CBCL-AP, we observed
no changes in specificity (0.75 vs
0.75); however, the sensitivity
dropped from 0.77 to 0.74.
DISCUSSION
The current study is the first
systematic review and meta-
analysis assessing and comparing
the diagnostic performance of
CBCL-AP and CRS-R in diagnosing
ADHD in children and adolescents.
Our results suggest that CBCL-AP
and CRS-R have comparable
diagnostic performance in
sensitivity, specificity, and DORs.
The reviewed scales yielded
satisfactory sensitivity and
specificity. In addition, the overall
ability of each tool to accurately
classify participants as cases or
noncases was moderate to high.
Some systematic reviews have
evaluated the psychometric
properties of CBCL and CRS-R in
children and adolescents10,15–18;
however, information regarding
the diagnostic performance
of these tools has rarely been
reviewed comprehensively.
5 by guest on March 1, 2020www.aappublications.org/newsDownloaded from

CHANG et al
Therefore, the overall diagnostic
performance of CBCL and CRS-R
remains inconclusive. In addition,
no conclusion has been drawn
regarding the comparison of CBCL
and diverse versions of CRS-R.
Furthermore, no previous meta-
analysis has evaluated the utility
of the CBCL and CRS-R in assessing
ADHD. In the current study, no
difference was observed in the
diagnostic performance of the 2
scales in detecting ADHD in children
and adolescents.
The American Academy of Pediatrics
Diagnostic Guidelines52 does not
recommend using a broadband
6
FIGURE 2Forest plots of coupled sensitivity and specifi city for each included screening tool. FN, false negative; FP, false positive; TN, true negative; TP, true positive.
by guest on March 1, 2020www.aappublications.org/newsDownloaded from
PEDIATRICS Volume 137 , number 3 , March 2016
rating scale, such as CBCL, for
diagnosing ADHD, because the broad
domain factors do not distinguish
young people referred for ADHD
from their nonreferred peers. In
a recent review,16 the authors
challenged this recommendation
by concluding that CBCL-AP can
accurately identify young people with
ADHD. Our findings are consistent
with this observation; thus, a
comparable diagnostic performance
was observed between broadband
CBCL-AP and narrowband CRS-
R. The use of a broadband rating
scale, such as CBCL, is suggested
as an initial step in the assessment
of ADHD because of its coverage of
several dimensions of childhood
psychopathology.53 Moreover,
considering other medical and
psychosocial problems, including
sleep disorders, substance use,
and depression, is crucial during
diagnosis because the manifestations
of such problems are similar to those
of ADHD.54 The latest clinical practice
guidelines55 have further addressed
the need for clinicians to assess other
conditions that might coexist with
ADHD. Therefore, the broadband
measures of the CBCL can benefit
diagnostic processes by facilitating
professionals in making an accurate
differential diagnosis and modifying
management plans accordingly.56
Overall, the satisfactory diagnostic
performance of CBCL-AP and the
ability of CBCL to identify other
comorbid conditions suggest that
CBCL provides valuable diagnostic
information for ADHD assessments.
7
TABL
E 1
Su
mm
ariz
ed D
iagn
osti
c P
erfo
rman
ce o
f AD
HD
Dia
gnos
tic
Tool
s
Test
an
d S
ign
ifi ca
nce
Sca
leS
tud
ies,
nS
ensi
tivi
tyS
pec
ifi ci
tyP
osit
ive
LRN
egat
ive
LRD
OR
1C
BC
L-AP
160.
77 (
0.69
–0.
84)
0.73
(0.
64–
0.81
)2.
91 (
2.14
–3.
96)
0.31
(0.
23–
0.42
)9.
37 (
5.71
–15
.38)
2C
PR
S-R
40.
75 (
0.64
–0.
84)
0.75
(0.
64–
0.84
)2.
98 (
1.81
–4.
91)
0.33
(0.
20–
0.55
)8.
95 (
3.39
–23
.61)
3C
TRS
-R5
0.72
(0.
63–
0.79
)0.
84 (
0.69
–0.
93)
4.55
(2.
03–
10.1
8)0.
33 (
0.22
–0.
50)
13.6
8 (4
.22–
44.2
9)
4AS
Q5
0.83
(0.
59–
0.95
)0.
84 (
0.68
–0.
93)
5.26
(2.
20–
12.5
3)0.
20 (
0.06
–0.
61)
26.7
2 (4
.15–
171.
87)
P (
test
1 v
s 2)
——
.89
.41
——
.84
P (
test
1 v
s 3)
——
.47
.10
——
.47
P (
test
1 v
s 4)
——
.59
.21
——
.29
P (
test
2 v
s 3)
——
.62
.49
——
.70
P (
test
2 v
s 4)
——
.55
.65
——
.55
P (
test
3 v
s 4)
—
—.3
5.8
3—
—.8
3
—, i
nd
icat
es n
ot a
pp
licab
le.
FIGURE 3HSROC curves for the detection of ADHD in children and adolescents.
by guest on March 1, 2020www.aappublications.org/newsDownloaded from

CHANG et al
All CRS-R versions exhibited a
favorable diagnostic performance,
and ASQ demonstrated the highest
sensitivity, specificity, and AUC,
although the differences were
not significant. The satisfactory
diagnostic utility of the ADHD index
within CPRS-R:S and CTRS-R:S
observed in the current study is
consistent with those reported in
previous reviews,10,57 suggesting
that the ADHD index contains the
most favorable set of items for
distinguishing children with ADHD
from those without ADHD. In
contrast to the conventional notion
that ASQ is a global measure of
psychopathology and not a specific
indicator of ADHD diagnosis,58
we observed that ASQ had high
diagnostic ability in distinguishing
children and adolescents with
and without ADHD. Therefore, on
the basis of the current findings
regarding the diagnostic utility
of ASQ and the advantages of its
brevity, it can be considered an
ideal tool for diagnosing ADHD. The
information obtained from ASQ
can also facilitate the process of
determining the requirements for a
more comprehensive evaluation.
The heterogeneity observed in
CBCL-AP among the included
studies was explained by the age of
participants and percentage of female
participants. The specificity was high
in studies with older participants
and a high percentage of female
participants. Expressions of ADHD
symptoms vary among children
and adolescents with different
demographic characteristics;
therefore, studies59,60 have reported
that CBCL subscale scores varied
according to age and gender.
However, the age and gender
differences disappeared when other
demographic factors were included
in the multivariate analyses.13
Similar phenomena may exist in the
current study, because our results
were obtained from a univariate
metaregression, as suggested by
the Cochrane Handbook61 for small
sample sizes. Different results
may be observed when other
potential sources of heterogeneity
are simultaneously considered in
regression models. In addition, no
previous study has evaluated age and
gender differences in the sensitivity
and specificity of CBCL-AP; therefore,
the present findings should be
interpreted with caution.
Our study has several strengths.
This is the first systematic review
and meta-analysis generating and
comparing the pooled diagnostic
performance of different behavioral
8
TABLE 2 Univariate Metaregression Analysis for Identifying Potential Sources of Heterogeneity in the Diagnostic Performance of CBCL-AP scale
Study characteristic Studies, n Sensitivity Specifi city
Pooled estimate (95% CI) P Pooled estimate (95% CI) P
Sample source 1.00 1.00
Clinic 8 0.78 (0.64–0.88) 0.67 (0.54–0.78)
Nonclinic 7 0.76 (0.68–0.83) 0.79 (0.66–0.88)
Study location .09 .03
United States 8 0.70 (0.61–0.78) 0.81 (0.73–0.87)
Other countries 8 0.83 (0.72–0.90) 0.64 (0.49–0.77)
No. of participants .88 .82
≥200 7 0.77 (0.61–0.88) 0.75 (0.63–0.84)
<200 9 0.75 (0.68–0.80) 0.72 (0.57–0.84)
Cutoff value 1.00 1.00
≥65 8 0.69 (0.59–0.77) 0.74 (0.60–0.84)
<65 6 0.86 (0.75–0.92) 0.72 (0.53–0.86)
Study year .26 .05
After or during 2005 11 0.80 (0.71–0.87) 0.67 (0.55–0.78)
Before 2005 5 0.71 (0.57–0.81) 0.83 (0.76–0.89)
Age .91 < .01
≥11 7 0.77 (0.67–0.85) 0.84 (0.75–0.90)
<11 9 0.77 (0.65–0.86) 0.63 (0.52–0.72)
Female participants, % .35 .04
≥35 7 0.73 (0.66–0.79) 0.83 (0.77–0.88)
<35 9 0.80 (0.67–0.88) 0.64 (0.51–0.76)
Study quality
Patient selection .13 .17
High risk 8 0.83 (0.70–0.91) 0.67 (0.53–0.78)
Low risk 8 0.73 (0.67–0.78) 0.79 (0.67–0.87)
Index test .61 .95
High risk 10 0.74 (0.67–0.80) 0.74 (0.60–0.84)
Low risk 6 0.79 (0.62–0.89) 0.71 (0.58–0.82)
Flow and timing .15 .31
High risk 4 0.67 (0.52–0.79) 0.80 (0.62–0.91)
Low risk 12 0.80 (0.72–0.87) 0.71 (0.60–0.80)
by guest on March 1, 2020www.aappublications.org/newsDownloaded from

PEDIATRICS Volume 137 , number 3 , March 2016
diagnostic tools in assessing
ADHD in children and adolescents.
Moreover, the bivariate random
effects model and HSROC analyses
used in this study are the most
statistically rigorous methods
in diagnostic meta-analysis. We
also followed a standard protocol
and used a comprehensive
search strategy for including all
relevant studies fulfilling our
selection criteria. In addition,
we supplemented the search by
carefully identifying appropriate
articles from the reference lists of
the relevant review articles. Finally,
potential sources of heterogeneity
were identified by adding covariates
to the bivariate metaregression
models.
Our study has several limitations.
First, the selection criteria and search
strategy may have restricted the
number of included articles. Second,
the small sample size restricted
the use of metaregression for
determining factors contributing
to heterogeneity among studies
evaluating CRS-R. Third, although
we attempted to explain the
considerable heterogeneity in
CBCL-AP, heterogeneity might remain
unexplained. Some analyses may
have been underpowered because
of the limited number of studies
with adequate data. Fourth, the
pooled diagnostic performances of
CPRS-R:S and CTRS-R:S were based
on diagnostic parameters extracted
from the ADHD index subscale.
The diagnostic performance may
be higher when the scores of other
subscales are also considered in the
ADHD assessment. Finally, to increase
9
FIGURE 4Funnel plot with superimposed regression line.
by guest on March 1, 2020www.aappublications.org/newsDownloaded from

CHANG et al
the number of included studies, the
present analyses comparing different
diagnostic tools were conducted using
studies that have evaluated ≥1 of the
tools. However, the included studies
were heterogeneous regarding study
design and sample characteristics,
which may have confounded the
results. Future meta-analyses
aimed at comparing the diagnostic
performance of two different tools
should be conducted on the basis of
studies that have directly compared
the targeted tools by applying both
tools to each participant or by
randomizing each participant to
undergo assessment by using one of
the tools.61
CONCLUSIONS
Our meta-analysis revealed that
CBCL-AP and CRS-R demonstrated
moderate sensitivity and specificity
in detecting ADHD in children and
adolescents. Many symptoms of
ADHD are not always observed
in clinical settings; therefore,
information provided by both scales
can enhance clinicians’ understanding
of children’s symptoms in different
settings. Our findings indicate
that ASQ is the optimal diagnostic
tool for assessing ADHD because
of its brevity and high diagnostic
accuracy. Moreover, the CBCL
is recommended when more
comprehensive assessments are
required for detecting other comorbid
conditions of ADHD, because the
CBCL-AP can be applied together with
other CBCL subscales. However, the
moderate diagnostic values of CRS-R
and CBCL reveal the importance of
incorporating clinical examinations
to eliminate other disorders and
obtain information such as age of
onset, intensity and pervasiveness of
symptoms, and level of impairment
during ADHD diagnosis.
10
ABBREVIATIONS
ADHD: attention-deficit/
hyperactivity disorder
ASQ: Conners Abbreviated
Symptom Questionnaire
AUC: area under the curve
CBCL: Child Behavior Checklist
CBCL-AP: CBCL–Attention
Problem
CI: confidence interval
CPRS-R:S: Conners Parent Rating
Scale–Revised Short
Form
CRS-R: Conners Rating
Scale–Revised
CTRS-R:S: Conners Teacher
Rating Scale–Revised
Short Form
DOR: diagnostic odds ratio
HSROC: hierarchical summary
receiver operating
characteristic
LR: likelihood ratio
QUADAS-2: Quality Assessment
of Diagnostic
Accuracy Studies
FIGURE 5Infl uential analysis and outlier detection.
by guest on March 1, 2020www.aappublications.org/newsDownloaded from
PEDIATRICS Volume 137 , number 3 , March 2016
REFERENCES
1. American Psychiatric Association.
Diagnostic and Statistical Manual of
Mental Disorders, 5th ed. Washington,
DC: American Psychiatric Association;
2013
2. Akinbami LJ, Liu X, Pastor PN, Reuben
CA. Attention defi cit hyperactivity
disorder among children aged 5-17
years in the United States, 1998-2009.
NCHS Data Brief, no. 70. Hyattsville, MD:
National Center for Health Statistics;
2011.
3. Barkley RA. Associated cognitive,
developmental, and health problems.
In: Barkley RA, Murphy KR, eds.
Attention-Defi cit Hyperactivity Disorder:
A Clinical Workbook. New York, NY:
Guilford Press; 2006:122–183
4. Strine TW, Lesesne CA, Okoro CA,
et al. Emotional and behavioral
diffi culties and impairments in
everyday functioning among children
with a history of attention-defi cit/
hyperactivity disorder. Prev Chronic
Dis. 2006;3(2):A52
5. Xiang H, Stallones L, Chen G, Hostetler
SG, Kelleher K. Nonfatal injuries
among US children with disabling
conditions. Am J Public Health.
2005;95(11):1970–1975
6. Holmberg K, Bölte S. Do symptoms
of ADHD at ages 7 and 10 predict
academic outcome at age 16 in the
general population? J Atten Disord.
2014;18(8):635–645
7. Leibson CL, Katusic SK, Barbaresi
WJ, Ransom J, O’Brien PC. Use and
costs of medical care for children
and adolescents with and without
attention-defi cit/hyperactivity disorder.
JAMA. 2001;285(1):60–66
8. De Ridder A, De Graeve D. Healthcare
use, social burden and costs of
children with and without ADHD in
Flanders, Belgium. Clin Drug Investig.
2006;26(2):75–90
9. Thome J, Ehlis AC, Fallgatter AJ, et
al. Biomarkers for attention-defi cit/
hyperactivity disorder (ADHD). A
consensus report of the WFSBP task
force on biological markers and the
World Federation of ADHD. World J Biol
Psychiatry. 2012;13(5):379–400
10. Demaray MK, Elting J, Schaefer K.
Assessment of attention-defi cit/
hyperactivity disorder (ADHD):
a comparative evaluation of
fi ve, commonly used, published
rating scales. Psychol Sch.
2003;40(4):341–361
11. Achenbach TM, Rescorla LA. Manual
for the ASEBA School-Age Forms and
Profi les. Burlington, VT: University
of Vermont, Research Center for
Children, Youth & Families; 2001
12. Conners CK. Conners’ Rating Scales-
Revised Technical Manual. North
Tonawanda, NY: Multi Health Systems;
1997
13. Lampert TL, Polanczyk G, Tramontina
S, Mardini V, Rohde LA. Diagnostic
performance of the CBCL-Attention
Problem Scale as a screening
measure in a sample of Brazilian
children with ADHD. J Atten Disord.
2004;8(2):63–71
14. Chen WJ, Faraone SV, Biederman J,
Tsuang MT. Diagnostic accuracy of the
Child Behavior Checklist scales for
attention-defi cit hyperactivity disorder:
a receiver-operating characteristic
analysis. J Consult Clin Psychol.
1994;62(5):1017–1025
15. Collett BR, Ohan JL, Myers KM.
Ten-year review of rating scales.
V: scales assessing attention-
defi cit/hyperactivity disorder. J
Am Acad Child Adolesc Psychiatry.
2003;42(9):1015–1037
16. Pelham WE Jr, Fabiano GA, Massetti GM.
Evidence-based assessment of attention
defi cit hyperactivity disorder in children
and adolescents. J Clin Child Adolesc
Psychol. 2005;34(3):449–476
17. Angello LM, Volpe RJ, DiPerna JC, et
al. Assessment of attention-defi cit/
hyperactivity disorder: an evaluation
of six published rating scales. School
Psych Rev. 2003;32(2):241–262
18. Smith KG, Corkum P. Systematic
review of measures used to diagnose
attention-defi cit/hyperactivity
disorder in research on preschool
children. Top Early Child Spec Educ.
2007;27(3):164–173
19. Reitsma JB, Glas AS, Rutjes
AWS, Scholten RJ, Bossuyt PM,
Zwinderman AH. Bivariate analysis of
sensitivity and specifi city produces
informative summary measures in
diagnostic reviews. J Clin Epidemiol.
2005;58(10):982–990
20. Rutter CM, Gatsonis CA. A
hierarchical regression approach
to meta-analysis of diagnostic test
accuracy evaluations. Stat Med.
2001;20(19):2865–2884
21. Glas AS, Lijmer JG, Prins MH, Bonsel
GJ, Bossuyt PMM. The diagnostic
odds ratio: a single indicator of
test performance. J Clin Epidemiol.
2003;56(11):1129–1135
22. Swets JA. Measuring the accuracy
of diagnostic systems. Science.
1988;240(4857):1285–1293
11
Address correspondence to Pei-Shan Tsai, PhD, School of Nursing, College of Nursing, Taipei Medical University, 250 Wu-Hsing St, Taipei 110, Taiwan. E-mail:
PEDIATRICS (ISSN Numbers: Print, 0031-4005; Online, 1098-4275).
Copyright © 2016 by the American Academy of Pediatrics
FINANCIAL DISCLOSURE: The authors have indicated they have no fi nancial relationships relevant to this article to disclose.
FUNDING: This study was supported by a postdoctoral training grant from the Ministry of Science and Technology of the Republic of China (MOST 103-2811-B-038-
021).
POTENTIAL CONFLICT OF INTEREST: The authors have indicated they have no potential confl icts of interest to disclose.
COMPANION PAPER: A companion to this article can be found online at www.pediatrics. org/ cgi/ doi/ 10. 1542/ peds. 2015- 4450.
by guest on March 1, 2020www.aappublications.org/newsDownloaded from
CHANG et al
23. Higgins JPT, Thompson SG,
Deeks JJ, Altman DG. Measuring
inconsistency in meta-analyses. BMJ.
2003;327(7414):557–560
24. Zamora J, Abraira V, Khan K,
Coomarasamy A. Meta-DiSc: a software
for meta-analysis of test accuracy
data. BMC Med Res Methodol. 2006;6:31
25. Takwoingi Y. Meta-analysis of
test accuracy studies in Stata: a
bivariate model approach. Version
1.0. November 2013. Available at: dta.
cochrane.org/. Accessed June 23, 2015.
26. Deeks JJ, Macaskill P, Irwig L. The
performance of tests of publication
bias and other sample size effects
in systematic reviews of diagnostic
test accuracy was assessed. J Clin
Epidemiol. 2005;58(9):882–893
27. MIDAS. STATA module for meta-
analytical integration of diagnostic test
accuracy studies [computer program].
Version S456880. Boston, MA: Boston
College Department of Economics;
2007.
28. Abdekhodaie Z, Tabatabaei SM,
Gholizadeh M. The investigation of
ADHD prevalence in kindergarten
children in northeast Iran and
a determination of the criterion
validity of Conners’ questionnaire via
clinical interview. Res Dev Disabil.
2012;33(2):357–361
29. Alloway TP, Gathercole SE, Holmes
J, Place M, Elliott JG, Hilton K. The
diagnostic utility of behavioral
checklists in identifying children
with ADHD and children with working
memory defi cits. Child Psychiatry Hum
Dev. 2009;40(3):353–366
30. Bussing R, Schuhmann E, Belin TR,
Widawski M, Perwien AR. Diagnostic
utility of two commonly used ADHD
screening measures among special
education students. J Am Acad
Child Adolesc Psychiatry. 1998;37(1):
74–82
31. Deb S, Dhaliwal AJ, Roy M. The
usefulness of Conners’ Rating Scales-
Revised in screening for attention
defi cit hyperactivity disorder in
children with intellectual disabilities
and borderline intelligence. J Intellect
Disabil Res. 2008;52(11):950–965
32. Derks EM, Hudziak JJ, Dolan CV,
Ferdinand RF, Boomsma DI. The
relations between DISC-IV DSM
diagnoses of ADHD and multi-informant
CBCL-AP syndrome scores. Compr
Psychiatry. 2006;47(2):116–122
33. Edwards MC, Sigel BA. Estimates of
the Utility of Child Behavior Checklist/
Teacher Report Form Attention
Problems Scale in the diagnosis
of ADHD in children referred to a
specialty clinic. J Psychopathol Behav
Assess. 2015;37(1):50–59
34. Eiraldi RB, Power TJ, Karustis JL,
Goldstein SG. Assessing ADHD and
comorbid disorders in children: the
Child Behavior Checklist and the
Devereux Scales of Mental Disorders. J
Clin Child Psychol. 2000;29(1):3–16
35. Elkins RM, Carpenter AL, Pincus DB,
Comer JS. Inattention symptoms
and the diagnosis of comorbid
attention-defi cit/hyperactivity disorder
among youth with generalized
anxiety disorder. J Anxiety Disord.
2014;28(8):754–760
36. Gargaro BA, May T, Tonge BJ, Sheppard
DM, Bradshaw JL, Rinehart NJ. Using
the DBC-P Hyperactivity Index to screen
for ADHD in young people with autism
and ADHD: a pilot study. Res Autism
Spectr Disord. 2014;8(9):1008–1015
37. Gau SSF, Soong WT, Chiu YN, Tsai
WC. Psychometric properties of the
Chinese version of the Conners’
parent and teacher rating scales-
revised: short form. J Atten Disord.
2006;9(4):648–659
38. Gjevik E, Sandstad B, Andreassen OA,
Myhre AM, Sponheim E. Exploring the
agreement between questionnaire
information and DSM-IV diagnoses of
comorbid psychopathology in children
with autism spectrum disorders.
Autism. 2015;19(4):433–442
39. Gould MS, Bird H, Jaramillo BS.
Correspondence between statistically
derived behavior problem syndromes
and child psychiatric diagnoses in a
community sample. J Abnorm Child
Psychol. 1993;21(3):287–313
40. Holmberg K, Sundelin C, Hjern A.
Screening for attention-defi cit/
hyperactivity disorder (ADHD): can
high-risk children be identifi ed in
fi rst grade? Child Care Health Dev.
2013;39(2):268–276
41. Hudziak JJ, Copeland W, Stanger
C, Wadsworth M. Screening for
DSM-IV externalizing disorders
with the Child Behavior Checklist:
a receiver-operating characteristic
analysis. J Child Psychol Psychiatry.
2004;45(7):1299–1307
42. Kim JW, Park KH, Cheon KA, Kim BN,
Cho SC, Hong K-EM. The child behavior
checklist together with the ADHD
rating scale can diagnose ADHD in
Korean community-based samples.
Can J Psychiatry. 2005;50(12):802–805
43. Rishel CW, Greeno C, Marcus SC, Shear
MK, Anderson C. Use of the child
behavior checklist as a diagnostic
screening tool in community
mental health. Res Soc Work Pract.
2005;15(3):195–203
44. Roessner V, Becker A, Rothenberger
A, Rohde LA, Banaschewski T. A cross-
cultural comparison between samples
of Brazilian and German children with
ADHD/HD using the Child Behavior
Checklist. Eur Arch Psychiatry Clin
Neurosci. 2007;257(6):352–359
45. Schwarte AR. Evaluating the Diagnostic
Utility of Attention-Defi cit/Hyperactivity
Measures Using Discriminant Function
Analysis. Ann Arbor, MI: ProQuest
Information & Learning; 2005
46. Tillman R, Geller B. A brief screening
tool for a prepubertal and early
adolescent bipolar disorder
phenotype. Am J Psychiatry.
2005;162(6):1214–1216
47. Tripp G, Schaughency EA, Clarke B.
Parent and teacher rating scales in
the evaluation of attention-defi cit
hyperactivity disorder: contribution to
diagnosis and differential diagnosis
in clinically referred children. J Dev
Behav Pediatr. 2006;27(3):209–218
48. Wassenberg R, Max JE, Koele SL,
Firme K. Classifying psychiatric
disorders after traumatic brain injury
and orthopaedic injury in children:
adequacy of K-SADS versus CBCL. Brain
Inj. 2004;18(4):377–390
49. Young S, Gudjonsson G, Misch P, et
al. Prevalence of ADHD symptoms
among youth in a secure facility: the
consistency and accuracy of self- and
12 by guest on March 1, 2020www.aappublications.org/newsDownloaded from
PEDIATRICS Volume 137 , number 3 , March 2016
informant-report ratings. J Forensic
Psychiatr Psychol. 2010;21(2):238–246
50. Yu D-L, Wang L, Han X-y. A study on
ADHD children with Conners Teacher
Rating Scale. Chin J Clin Psychol.
2004;12(3):262–263
51. Zelko FA. Comparison of parent-
completed behavior rating scales:
differentiating boys with ADD from
psychiatric and normal controls. J Dev
Behav Pediatr. 1991;12(1):31–37
52. American Academy of Pediatrics.
Clinical practice guideline: diagnosis
and evaluation of the child with
attention-defi cit/hyperactivity disorder.
Pediatrics. 2000;105(5). Available at:
www. pediatrics. org/ cgi/ content/ full/
105/ 5/ e1158
53. Barkley RA. Attention-Defi cit
Hyperactivity Disorder: A Handbook for
Diagnosis and Treatment, 3rd ed. New
York, NY: The Guilford Press; 2006
54. Feldman HM, Reiff MI. Clinical
practice. Attention deficit-
hyperactivity disorder in children
and adolescents. N Engl J Med.
2014;370(9):838–846
55. Wolraich M, Brown L, Brown RT, et al;
Subcommittee on Attention-Defi cit/
Hyperactivity Disorder; Steering
Committee on Quality Improvement
and Management. ADHD: clinical
practice guideline for the diagnosis,
evaluation, and treatment of attention-
defi cit/hyperactivity disorder in
children and adolescents. Pediatrics.
2011;128(5). Available at: www.
pediatrics. org/ cgi/ content/ full/ 128/ 5/
e1007
56. Volpe RJ, Dupaul GJ. Assessment
with brief behavior rating scales. In:
Andrews JW, Saklofske DH, Janzen HL,
eds. Handbook of Psychoeducational
Assessment: Ability, Achievement,
and Behavior in Children. A Volume
in the Educational Psychology Series.
San Diego: Academic Press, Inc.;
2001:357–387
57. Gianarris WJ, Golden CJ, Greene L.
The Conners’ Parent Rating Scales: a
critical review of the literature. Clin
Psychol Rev. 2001;21(7):1061–1093
58. Conners CK. Conners’ rating scales
manual. New York, NY: Multi Health
Systems; 1989
59. Achenbach TM. Manual for the Child
Behavior Checklist. Burlington, VT:
University of Vermont, Department of
Psychiatry; 1991
60. Crijnen AAM, Achenbach TM, Verhulst
FC. Problems reported by parents of
children in multiple cultures: the Child
Behavior Checklist syndrome constructs.
Am J Psychiatry. 1999;156(4):569–574
61. Macaskill P, Gatsonis C, Deeks JJ,
Harbord RM, Takwoingi Y. Analysing
and Presenting Results. In: Deeks JJ,
Bossuyt PM, Gatsonis C, eds. Cochrane
Handbook for Systematic Reviews of
Diagnostic Test Accuracy Version 1.0,
Chapter 10. London: The Cochrane
Collaboration; 2010
13 by guest on March 1, 2020www.aappublications.org/newsDownloaded from

DOI: 10.1542/peds.2015-2749 originally published online February 29, 2016; 2016;137;Pediatrics
Ling-Yin Chang, Mei-Yeh Wang and Pei-Shan TsaiDisorder: A Meta-analysis
Diagnostic Accuracy of Rating Scales for Attention-Deficit/Hyperactivity
ServicesUpdated Information &
http://pediatrics.aappublications.org/content/137/3/e20152749including high resolution figures, can be found at:
Referenceshttp://pediatrics.aappublications.org/content/137/3/e20152749#BIBLThis article cites 48 articles, 3 of which you can access for free at:
Subspecialty Collections
activity_disorder_adhd_subhttp://www.aappublications.org/cgi/collection/attention-deficit:hyperAttention-Deficit/Hyperactivity Disorder (ADHD)al_issues_subhttp://www.aappublications.org/cgi/collection/development:behaviorDevelopmental/Behavioral Pediatricsfollowing collection(s): This article, along with others on similar topics, appears in the
Permissions & Licensing
http://www.aappublications.org/site/misc/Permissions.xhtmlin its entirety can be found online at: Information about reproducing this article in parts (figures, tables) or
Reprintshttp://www.aappublications.org/site/misc/reprints.xhtmlInformation about ordering reprints can be found online:
by guest on March 1, 2020www.aappublications.org/newsDownloaded from

DOI: 10.1542/peds.2015-2749 originally published online February 29, 2016; 2016;137;Pediatrics
Ling-Yin Chang, Mei-Yeh Wang and Pei-Shan TsaiDisorder: A Meta-analysis
Diagnostic Accuracy of Rating Scales for Attention-Deficit/Hyperactivity
http://pediatrics.aappublications.org/content/137/3/e20152749located on the World Wide Web at:
The online version of this article, along with updated information and services, is
http://pediatrics.aappublications.org/content/suppl/2016/02/17/peds.2015-2749.DCSupplementalData Supplement at:
1073-0397. ISSN:60007. Copyright © 2016 by the American Academy of Pediatrics. All rights reserved. Print
the American Academy of Pediatrics, 141 Northwest Point Boulevard, Elk Grove Village, Illinois,has been published continuously since 1948. Pediatrics is owned, published, and trademarked by Pediatrics is the official journal of the American Academy of Pediatrics. A monthly publication, it
by guest on March 1, 2020www.aappublications.org/newsDownloaded from