diagnosis of early blight disease in tomato plant based on
TRANSCRIPT

Journal of Agricultural Machinery
https://jame.um.ac.ir/Homepage:
Full Research Paper
Vol. 12, No. 1, Spring 2022, p. 81-94
Diagnosis of Early Blight Disease in Tomato Plant based on Visible/Near-Infrared Spectroscopy and Principal Components Analysis- Artificial Neural
Network Prior to Visual Disease Symptoms
F. Azadshahraki1*
, K. Sharifi2, B. Jamshidi
3, R. Karimzadeh
4, H. Naderi
5
1- Agricultural Engineering Research Institute, Agricultural Research, Education and Extension Organization (AREEO), Karaj, Iran
2- Assistant Professor, Research Department of Plant Pathology, Iranian Research Institute of Plant Protection, Agricultural
Research, Education and Extension Organization (AREEO), Tehran, Iran 2- Agricultural Engineering Research Institute, Agricultural Research, Education and Extension Organization (AREEO), Karaj, Iran
4 Department of Physics, Shahid Beheshti University, Tehran, Iran
5- MSc. in Remote Sensing and Geographic Information System, Vanda Atlas Technologists Company, Karaj, Iran
Abstract
Early diagnosis of plant diseases before the occurrence of symptoms can reduce the loss of the yield and increase the quality of agricultural crops. It also reduces the consumption of pesticides, environmental risks, and the cost of production. For this reason, the objectives of the present study were non-destructive diagnosis of early blight of tomato plant and discrimination of the most important agents of early blight (A. solani and A. alternate) in the primary stages of incidence of the disease before appearing visual symptoms using Vis-NIR spectroscopy (400-900 nm). The spectral data were acquired from the leaves of the plants infected with A. solani and A. alternate, 48 hours, 72 hours, 96 hours, and 120 hours after inoculation. To develop the recognition model based on the spectral data, principal components analysis (PCA) coupled with artificial neural network (ANN) was used. The results showed that the PCA-ANN model could diagnose the infected plants and pathogen species with accuracy of 93-100% for test set samples. In 96 hours after inoculation, in addition to the simpler model (8 PCs and 3 neurons in hidden layer), accuracy of 100% was obtained. At all times after inoculation, there was no error in diagnosis of the plants infected with A. solani that is more pathogenic and aggressive than other species, from healthy plants. Early blight in tomato plant and the type of pathogen before visual symptoms, without any plant sample preparation, could be diagnosed non-destructively (with accuracy of 93-100%) using Vis-NIR (400-900 nm) spectroscopy coupled with PCA-ANN. It was concluded that this technology could be used for rapid, low-cost, and early diagnosis of this disease in tomato plant instead of time-consuming, expensive, and destructive laboratory methods.
Keywords: Early blight, NIR spectroscopy, Principal components analysis, Tomato plants
Introduction1
Tomato (Solanum lycopersicum L.) is one of the most popular plants in the world and is grown in a wide range of climates (Song et al., 2015). Tomatos are widely consumed because
(*- Corresponding Author Email: [email protected])
of its high nutritional value and are a well-known source of vitamins and minerals. They can be eaten as raw vegetables or processed products (Sigmund and Gustav, 1991; Minich et al., 2019). However, diseases can affect the yield and quality of tomato fruits
How to cite this article:
Azadshahraki, F., K. Sharifi, B. Jamshidi, R. Karimzadeh, and H. Naderi. 2022. Diagnosis
of Early Blight Disease in Tomato Plant based on Visible/Near-Infrared Spectroscopy and
Principal Components Analysis- Artificial Neural Network Prior to Visual Disease
Symptoms. Journal of Agricultural Machinery 12 (1): 81-94.
DOI: 10.22067/jam.2021.67436.1001
Received: 13-12-2020 Revised: 08-01-2021
Accepted: 15-02-2021 Available Online: 28-09-2021

82 Journal of Agricultural Machinery Vol. 12, No. 1, Spring 2022
during the growing season (Chaerani and Voorrips, 2006).
Early blight is a serious disease in tomato growing regions and has been reported under a wide range of climatic conditions. This disease weakens tomato plants and increases susceptibility of the plants to infection (Adhikari et al., 2017; Zhang et al., 2018). Leaf spots and leaf drop caused by early blight, reduce the photosynthetic area and increase the imbalance between nutrient demand and nutrient supply (Ding et al., 2019). Failure to control early blight at the right time leads to foliar damage, the serious losses of the yield and quality, and excessive consumption of fungicides in tomato production. Therefore, early diagnosis and control of this disease has great economic importance (Ershad, 2009; Adhikari et al., 2017).
Species of the genus Alternaria causes early blight in tomato plants. Alternaria solani and A. alternata are the most important pathogenic species of the genus Alternaria in many countries such as Iran (Ershad, 2009; Zhang et al., 2018). These two species are different in terms of the secreted enzymes involved in pathogenesis. Morphologically, A. alternata produces small spores and A. solani produces larger spores than those because of A. alternata. In tomato plants, pathogenicity of A. alternata is lower than that of A. solani (Simmons, 2000).
Because of climatic conditions of tomato cultivation, high humidity and moderate temperatures may spread early blight, especially in the southern and northern regions of Iran (Ershad, 2009; Babagoli and Behdad, 2012). As mentioned above, different chemical fungicides are used to control early blight. Early diagnosis of this disease can reduce the consumption of fungicides. On the other hand, identifying the disease before its incidence allows the application of biological fungicides to prevent the spreading of the disease agents (Zitter et al., 2004).
Plant diseases, are usually diagnosed by visual assessments or common laboratory methods. Common diagnostic techniques such
as polymerase chain reaction (PCR), enzyme linked immune sorbent assay (ELISA), and fluorescence in situ hybridization (FISH) are destructive, time-consuming, and expensive. In addition, such diagnostic techniques require highly skilled technicians and advanced equipment (Xie et al., 2015; Ghanei Ghooshkhaneh, 2018).
Some non-destructive methods have been used to classify, forecast, diagnose or warn the occurrence of crop diseases, and various models have been developed for these non-destructive techniques. Near-infrared (NIR) spectroscopy as an advanced and innovative technology utilizes the spectral range from 780 to 2,500 nm (12,800 cm
-1– 4,000 cm
-1) and
provides internal structural information of organic materials in food, pharmaceutical, chemical, and petrochemical industries (Cen and He, 2007; Jamshidi et al., 2015). This technology coupled with the advanced mathematical and statistical methods has become a reliable, fast, and powerful non-destructive tool for analyzing the internal properties of organic materials (Tey et al., 2013; Nicolai et al., 2014).
NIR spectroscopy equipment (with a full spectral range) is expensive and its use in rapid detection systems depends on economic feasibility. The equipment with a narrower spectral range such as visible/near-infrared (Vis-NIR) spectroscopy equipment are low cost and more economically feasible for use in rapid and on-line detection systems (Mouazen et al., 2005). Some studies have confirmed the fitness of Vis-NIR or NIR spectroscopy for the classification of the leaves infected with citrus canker (Sankaran and Ehsani, 2013), diagnosis of the avocado leaves infected with laurel wilt (Sankaran and Ehsani, 2012), diagnosis of virus-infected soybean (Jinendra et al., 2010), diagnosis of huanglongbing in citrus orchards (Sankaran et al., 2011), and prediction of disease ratings for leaf gall in sugarcane clones (Purcell et al., 2009). However, relatively few reports have been found about the non-destructive diagnosis of crop diseases before the onset of symptoms. No reports have been found about the non-destructive diagnosis of
Azadshahraki et al., Diagnosis of Early Blight Disease in Tomato Plant … 83
early blight on tomato plants before appearing visual symptoms using Vis-NIR or NIR spectroscopy.
This research aimed to evaluate the feasibility of non-destructive method of Vis-NIR spectroscopy for diagnosis of early blight diseases (A. solani and A. alternate, as the main agents in tomato plants in Iran) in the primary stages of the disease incidence before occurrence of visual symptoms. Moreover, different PCA-ANN models were also developed for different times of establishment and progression of pathogens to select optimum diagnosis models for diagnosing the disease and discrimination of pathogen type.
Material and Methods
Pathogenicity on tomato plants
Susceptible tomato seedlings (cv. Peto Early CH), planted in trays containing peat moss, were transferred to 1.5-liter pots in four-
leaf stage. Ten milliliters of spore suspension of each of isolates of A. solani and A. alternata were prepared with sterile distilled water. Using a hemocytometer, the concentration of the suspensions was adjusted to 10
5 and 10
6
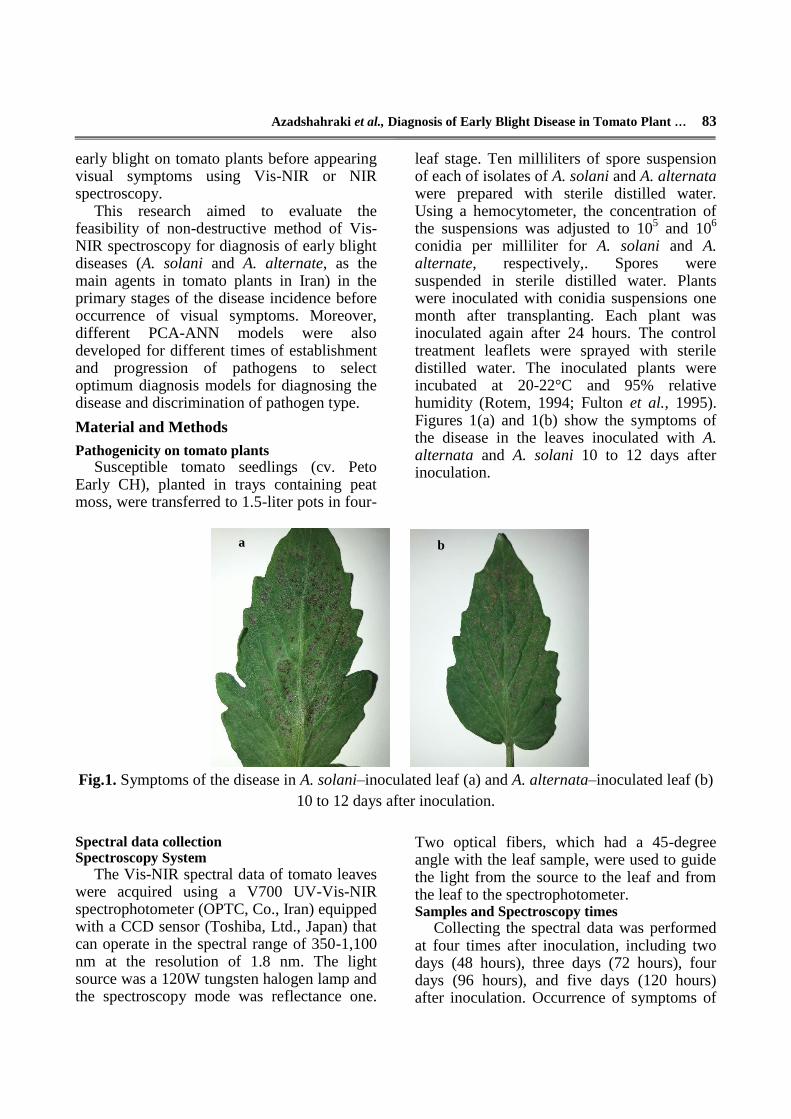
conidia per milliliter for A. solani and A. alternate, respectively,. Spores were suspended in sterile distilled water. Plants were inoculated with conidia suspensions one month after transplanting. Each plant was inoculated again after 24 hours. The control treatment leaflets were sprayed with sterile distilled water. The inoculated plants were incubated at 20-22°C and 95% relative humidity (Rotem, 1994; Fulton et al., 1995). Figures 1(a) and 1(b) show the symptoms of the disease in the leaves inoculated with A. alternata and A. solani 10 to 12 days after inoculation.
Fig.1. Symptoms of the disease in A. solani–inoculated leaf (a) and A. alternata–inoculated leaf (b)
10 to 12 days after inoculation.
Spectral data collection Spectroscopy System
The Vis-NIR spectral data of tomato leaves were acquired using a V700 UV-Vis-NIR spectrophotometer (OPTC, Co., Iran) equipped with a CCD sensor (Toshiba, Ltd., Japan) that can operate in the spectral range of 350-1,100 nm at the resolution of 1.8 nm. The light source was a 120W tungsten halogen lamp and the spectroscopy mode was reflectance one.
Two optical fibers, which had a 45-degree angle with the leaf sample, were used to guide the light from the source to the leaf and from the leaf to the spectrophotometer. Samples and Spectroscopy times
Collecting the spectral data was performed at four times after inoculation, including two days (48 hours), three days (72 hours), four days (96 hours), and five days (120 hours) after inoculation. Occurrence of symptoms of
a b

84 Journal of Agricultural Machinery Vol. 12, No. 1, Spring 2022
early blight on tomato plants depends on many factors and under the best condition; the symptom is visualized for five to seven days after conidia establishment on the leaves (Sherf and MacNab 1986; Chaerani et al., 2007).
The lower and upper leaves of each plant were excluded from the experiment. For each pathogenic species, the spectral data were acquired from 50 leaves of the infected plants (from 4-6 plants), in each day after inoculation. On the fifth day (120 hours after inoculation), five spectral samples of the leaves infected with A. solani were lost because of incorrect spectra collection, and the total number of the samples infected with A. solani in this day was 45. In each day of spectroscopy, along with acquiring the spectra from the inoculated samples, the spectral data from the leaves of two healthy plants (control treatment) were also acquired (approximately 23 leaves per day). In total, the number of spectral samples of healthy leaves was 91. Therefore, the total number of samples on each of the second, third, and fourth days after inoculation was 191, and in the fifth day was 186. For each leaf sample, five measurements from five different points were obtained. The average of these five spectra was used as a representative spectrum for one leaf sample. PCA-ANN models
In this experiment, the ANN method was used for the classification of A. alternate-inoculated, A. solani-inoculated, and healthy leaves. An ANN is a non-linear computing model inspired by biological neural networks (Salchenberger et al., 1992; Kia, 2010; Castro et al., 2017). ANNs modeling technique have been widely used for prediction and classification based on the spectral data (Mireei et al., 2010; Pan et al., 2016; Dai et al., 2015; Yoplac et al., 2019).
Multilayer feed forward network with back-propagation (BP) learning algorithm, which is the most popular neural network, was used for the recognition of the leaf samples. One BP network is a feed forward multilayer perceptron network that consists of one input layer with the neurons as independent
variables, one or more hidden layers, and one output layer with the neurons as a dependent variable (leaf classes in this study) (Kia, 2010; Omid et al., 2010). In this study, a single-hidden layer ANN was established for classification. The transfer function was tansig, the training function was trainscg, and epoch was 1,000. Wavelengths shorter than 400 and longer than 900 nm were eliminated to reduce the noise and thus, the spectral range of 400 to 900 nm was used for developing the model.
The spectral data in the range of 400-900 nm was used as the input layer in ANN, but they were not directly used because of the large number of the data for each spectrum sample. In order to reduce the data in each spectrum, PCA was used. PCA is a well-known technique for the data mining and is commonly used in spectroscopy (Wold et al., 2101). PCA is an orthogonal linear transformation that transforms the spectral data to a new coordinate system whose axes are the PCs. In this transformation, the greatest variance of the data comes to lie on the first coordinate (called the first principal component), the second greatest variation on the second PC, and so on. This process continues until the cumulative variance of the principal components is equal to 100% of the variance of the original data. In PCA, the data components that have the greatest effect on the variance, are selected and can be used instead of the original data and reduce the data volume (Nicolai et al., 2007). It is clear that the first component, then the second component, and the subsequent components have the greatest impact on recognition, respectively. The optimum number of PCs in the PCA-ANN models was chosen based on the cumulative explained data variance (Brown et al., 2005).
For the classification of the leaves in each day based on PCs, the samples were divided into a training (70%), validation (15%), and test (15%) subsets, randomly. The training datasets were used to fit the model, and the validation datasets were used to stop the training ones and avoid overfitting when the error in the validation datasets increases. The

Azadshahraki et al., Diagnosis of Early Blight Disease in Tomato Plant … 85
test datasets were used to evaluate the model fitted at the training stage. In this paper, the developed models were also evaluated by training and validation subsets, in addition to evaluation by test subset.
The optimum number of neurons in the hidden layer was determined by trial and error and examining several networks with the different number of neurons in the hidden layer, and finding the optimum model. A 3-byte binary code was assumed for the output vectors of three output neurons (Kia, 2010; Omid et al., 2010). Therefore, the output vectors (100), (010), and (001) were denoted as the healthy leaf, A. alternate-inoculated leaf, and A. solani-inoculated leaf, respectively.
In the PCA-ANN models, of the variance explained by PCs should be at least 85% of variance of the original data (Mireei et al.,
2010). The models with the lower number of PCs have lower classification accuracy, while using the higher number of PCs makes more complex models without a significant difference in the discrimination power (Nicolai et al., 2007). In this study, the maximum number of PCs as the input for ANN was considered 10. Finally, the optimum number of PCs as the input for ANN was selected by trial and error. These PCs were selected instead of the original spectral data.
For each time after inoculation (48 hours, 72 hours, 96 hours, and 120 hours), one PCA-ANN model was developed to discriminate healthy, A. -infected and A. solani -infected leaves. In this paper, principal components analysis and BP-ANN were carried out using Matlab12.
The procedure of this study is shown in Figure 2.
Fig.2. Research procedure

86 Journal of Agricultural Machinery Vol. 12, No. 1, Spring 2022
Results and Discussion
Effect of early blight pathogens and time on the absorbance spectra
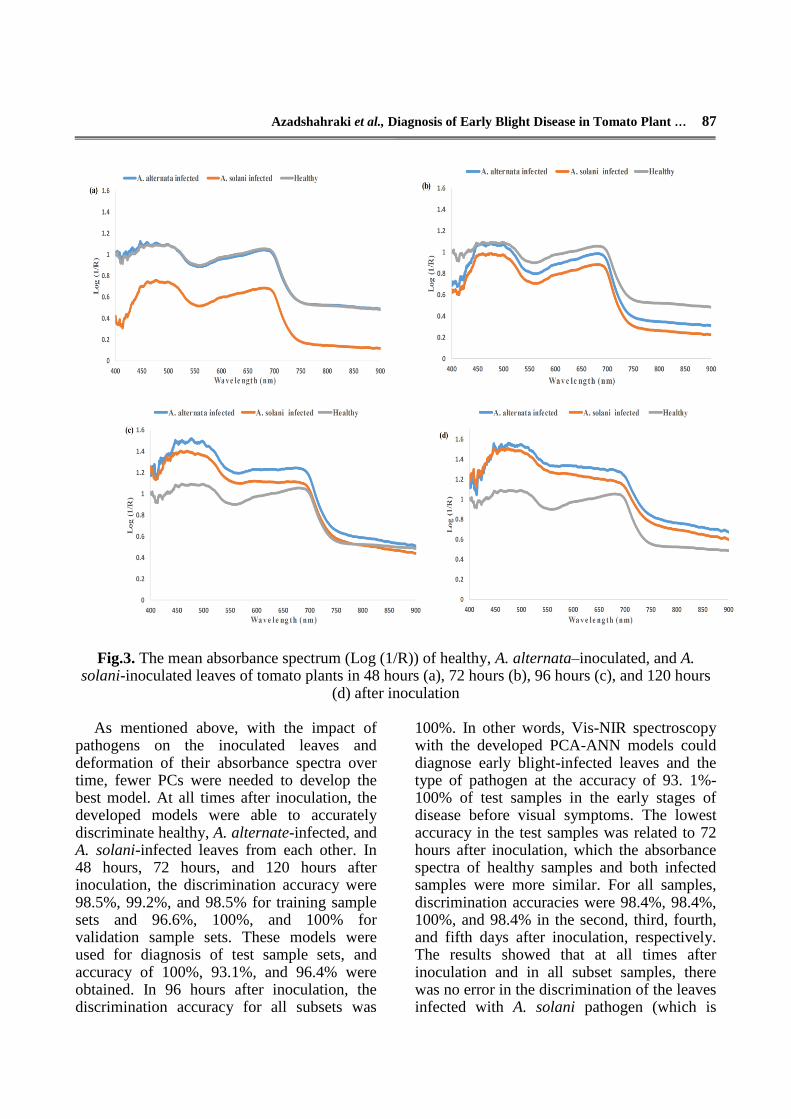
Figures 3(a), (b), (c), and (d) show the mean absorbance spectrum of healthy, A. alternata–inoculated, and A. solani-inoculated leaves in 48 hours, 72 hours, 96 hours, and 120 hours after inoculation at the wavelength range of 400-900 nm, respectively. For the better interpretation of spectra, absorbance values (Log (1/R)) of spectra are shown instead of raw spectra in Figure 2 (Azadshahraki et al., 2018).
All spectra had two broad peaks around 470 nm and 680 nm, which were due to the chlorophyll of the photosystem I and II reaction centers (Taiz and Zeiger, 2002). In 48 hours and 72 hours after inoculation, the mean absorbance spectra were clearly very similar. As mentioned above, spores of A. solani are larger than those of A. alternate. In 48 hours after inoculation, the absorption (height of spectrum) of A. solani samples was lower than that of other samples and this might have been due to the greater light reflection because of large spores. Over time, as the spores multiply and grow, the reaction between spores and leaves increases, and the light absorption (height of the spectrum) increases in both species of diseases. At other times after inoculation (96 hours and 120 hours after inoculation), absorbance spectra of the inoculated leaves changed and the shape of the second peaks was quite different from that of the second peaks of spectra in the second and third day after inoculation. The height of the mean absorbance spectra of the inoculated leaves was increased in the fourth and fifth days after inoculation, and these means were higher than the mean absorbance spectrum of healthy leaves. These changes in the spectra of the infected leaves and the differences between the spectra of the infected and healthy leaves in fourth and fifth days could be due to the impact of diseases on the leaves and might have been effective in discriminating the
infected leaves. The absorption increment in spectra of both A. alternata–infected and A. Solani–infected leaves in 96 hours and 120 hours after inoculation indicated that early blight disease increased the absorption of chlorophyll over time, and this increment around 470 nm was more than around 680 nm. In general, the height changes in A. solani-infected spectrum was more than that in A. alternate-infected spectrum. Because the pathogen (Alternaria spp.) is a necrotrophic fungus, within 48 to 72 hours after inoculation, it is possible that the fungal spores could be plasmolyzed and the contents of them could be transferred to the host cells. The reduction in the spore volume caused in order that the spectrum of the inoculated leaves could be closer to the control treatment leaves. However, 72 hours after inoculation, the intracellular host changes were begun, and the spectrum absorption increased in the infected leaves. Research has shown that members of the genus Alternaria cause quiescent infections, in which the fungus enters the tissue where it remains dormant until changed conditions favor infection (Thomma, 2003). Diagnosis of healthy and infected plants at each time after inoculation
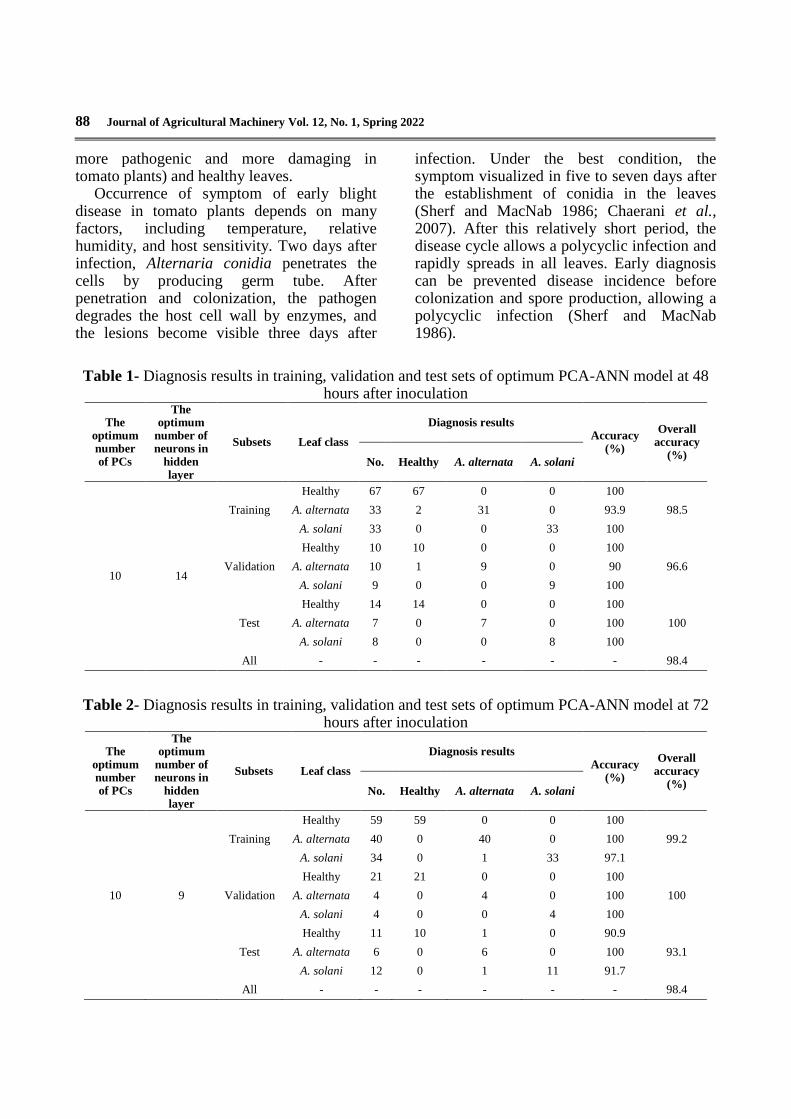
Tables 1, 2, 3, and 4 show the results of the classification of training, validation and test sample sets of healthy, A. alternate-infected, and A. solani-infected leaves of tomato plants for 48 hours, 72 hours, 96 hours, and 120 hours after inoculation using Vis-NIR spectroscopy (400-900 nm) and the PCA-ANN model. According to these Tables, the optimum developed PCA-ANN model for each time after inoculation had the specific number of PCs as well as neurons in the hidden layer. All selected PCs could explain more than 99% of the variance of the original data and had high power of discriminating the infected leaves. In the second and third day after inoculation, the models were more complex (had more PCs and more hidden layer neurons).
Azadshahraki et al., Diagnosis of Early Blight Disease in Tomato Plant … 87
Fig.3. The mean absorbance spectrum (Log (1/R)) of healthy, A. alternata–inoculated, and A. solani-inoculated leaves of tomato plants in 48 hours (a), 72 hours (b), 96 hours (c), and 120 hours
(d) after inoculation As mentioned above, with the impact of
pathogens on the inoculated leaves and deformation of their absorbance spectra over time, fewer PCs were needed to develop the best model. At all times after inoculation, the developed models were able to accurately discriminate healthy, A. alternate-infected, and A. solani-infected leaves from each other. In 48 hours, 72 hours, and 120 hours after inoculation, the discrimination accuracy were 98.5%, 99.2%, and 98.5% for training sample sets and 96.6%, 100%, and 100% for validation sample sets. These models were used for diagnosis of test sample sets, and accuracy of 100%, 93.1%, and 96.4% were obtained. In 96 hours after inoculation, the discrimination accuracy for all subsets was
100%. In other words, Vis-NIR spectroscopy with the developed PCA-ANN models could diagnose early blight-infected leaves and the type of pathogen at the accuracy of 93. 1%-100% of test samples in the early stages of disease before visual symptoms. The lowest accuracy in the test samples was related to 72 hours after inoculation, which the absorbance spectra of healthy samples and both infected samples were more similar. For all samples, discrimination accuracies were 98.4%, 98.4%, 100%, and 98.4% in the second, third, fourth, and fifth days after inoculation, respectively. The results showed that at all times after inoculation and in all subset samples, there was no error in the discrimination of the leaves infected with A. solani pathogen (which is
88 Journal of Agricultural Machinery Vol. 12, No. 1, Spring 2022
more pathogenic and more damaging in tomato plants) and healthy leaves.
Occurrence of symptom of early blight disease in tomato plants depends on many factors, including temperature, relative humidity, and host sensitivity. Two days after infection, Alternaria conidia penetrates the cells by producing germ tube. After penetration and colonization, the pathogen degrades the host cell wall by enzymes, and the lesions become visible three days after
infection. Under the best condition, the symptom visualized in five to seven days after the establishment of conidia in the leaves (Sherf and MacNab 1986; Chaerani et al., 2007). After this relatively short period, the disease cycle allows a polycyclic infection and rapidly spreads in all leaves. Early diagnosis can be prevented disease incidence before colonization and spore production, allowing a polycyclic infection (Sherf and MacNab 1986).
Table 1- Diagnosis results in training, validation and test sets of optimum PCA-ANN model at 48 hours after inoculation
The optimum number of PCs
The optimum
number of neurons in
hidden layer
Subsets Leaf class
Diagnosis results
Accuracy (%)
Overall accuracy
(%) No. Healthy A. alternata A. solani
10 14
Training
Healthy 67 67 0 0 100
A. alternata 33 2 31 0 93.9 98.5
A. solani 33 0 0 33 100
Healthy 10 10 0 0 100
Validation A. alternata 10 1 9 0 90 96.6
A. solani 9 0 0 9 100
Healthy 14 14 0 0 100
Test A. alternata 7 0 7 0 100 100
A. solani 8 0 0 8 100
All - - - - - - 98.4
Table 2- Diagnosis results in training, validation and test sets of optimum PCA-ANN model at 72 hours after inoculation
The optimum number of PCs
The optimum
number of neurons in
hidden layer
Subsets Leaf class
Diagnosis results
Accuracy (%)
Overall accuracy
(%) No. Healthy A. alternata A. solani
10 9
Training
Healthy 59 59 0 0 100
A. alternata 40 0 40 0 100 99.2
A. solani 34 0 1 33 97.1
Healthy 21 21 0 0 100
Validation A. alternata 4 0 4 0 100 100
A. solani 4 0 0 4 100
Healthy 11 10 1 0 90.9
Test A. alternata 6 0 6 0 100 93.1
A. solani 12 0 1 11 91.7
All - - - - - - 98.4

Azadshahraki et al., Diagnosis of Early Blight Disease in Tomato Plant … 89
Table 3- Diagnosis results in training, validation and test sets of optimum PCA-ANN model at 96 hours after inoculation
The
optimum
number
of PCs
The optimum number
of neurons
in hidden layer
Subsets Leaf class
Diagnosis results
Accuracy
(%)
Overall
accuracy
(%) No. Healthy A. alternata A. solani
8 3
Training
Healthy 63 63 0 0 100 100
A. alternata 37 0 37 0 100 100
A. solani 33 0 0 33 100 100
Healthy 16 16 0 0 100 100
Validation A. alternata 7 0 7 0 100 100
A. solani 6 0 0 6 100 100
Healthy 12 12 0 0 100 100
Test A. alternata 6 0 6 0 100 100
A. solani 11 0 0 11 100 100
All - - - - - - 100
Table 4- Diagnosis results in training, validation and test sets of optimum PCA-ANN model at 120 hours after inoculation
The optimum number of PCs
The optimum
number of neurons in
hidden layer
Subsets Leaf class
Diagnosis results
Accuracy (%)
Overall accuracy
(%) No. Healthy A. alternata A. solani
9 9
Training Healthy 61 61 0 0 100
A. alternata 38 0 37 1 97.4 98.5 A. solani 31 0 1 30 96.8
Healthy 14 14 0 0 100 Validation A. alternata 8 0 8 0 100 100
A. solani 6 0 0 6 100 Healthy 16 16 0 0 100
Test A. alternata 4 0 4 0 100 96.4 A. solani 8 0 1 7 87.5
All - - - - - - 98.4
In present study, the accuracy of using Vis-
NIR spectroscopy and the PCA-ANN model for early diagnosis of the tomato leaves infected with early blight was close to that of diagnosis of A. alternata in the eggplant leaves (over 88.46% in the testing sets) using the hyperspectral image technique reported by Xie and He (2016). Yin and Zhao (2013) reported the accuracy of 80.68% for recognition of early blight in tomato plants using the hyperspectral data and the support vector machine. Atherton et al. (2015) reported that hyperspectral spectroscopy could discriminate more heavily the potato plants diseased with
early blight (A. solani) from healthy potato plants in different growth stages. Atherton et al. (2017) used hyperspectral remote sensing spectroscopy for advanced diagnosis of early blight (A. solani) in potato plants prior to visual disease symptoms, and reported that the technique could distinguish moderately the diseased plants from healthy and minimally diseased plants. An investigation of the potential of using hyperspectral imaging for diagnosing early blight and late blight diseases in tomato leaves by Xie et al. (2015) showed that using a hyperspectral imaging technique and extreme learning machine (ELM)

90 Journal of Agricultural Machinery Vol. 12, No. 1, Spring 2022
classifier model or successive projection algorithm (SPA) could excellently diagnose the diseases at the accuracy of 97.1-100% in the testing sets. Diagnosis accuracy of present study for test set samples (93.1-100%) was close to the results reported by Xie et al. (2015). However, different studies for non-destructive diagnosis of diseases have different results because of different instruments, stage
of diseases, plant types and varieties. Because of the high cost of hyperspectral imaging equipment and good results of present study, Vis–NIR spectroscopy can be recommended for diagnosis of early blight disease prior to visual symptoms. The results of this research compared to other studies are summarized in Table 5.
Table 5- Comparison of the performance of early and nondestructive diagnosis of early blight
disease in this study with other studies Research Vegetable Accuracy (%)
Tis research Tomato 93.1-100 Xie et al., 2015 Tomato 97.1-100
Gold et al., 2020 Potato 89-95 Xie and He, 2016 Eggplant 88.46
Yin and Zhao, 2013 Tomato 80.68
Conclusion
This study evaluated the feasibility of utilizing Vis–NIR spectroscopy (range of 400-900nm) using a CCD spectrometer coupled with the PCA-ANN modeling method for early and non-destructive diagnosis of early blight disease in tomato plants and diagnosis of type of pathogen (A. alternate and A. solani) before the appearance of the symptoms. The results of this study indicated that, when optimum PCs and optimum number of neurons in the hidden layer of ANN were selected, the PCA-ANN model could accurately diagnose the infected plants and type of pathogen (accuracy of 93.1-100%). Over time, the shape of the infected spectra changed and this change was effective in diagnosing the infected leaves. At all times after inoculation, the developed models could discriminate A. solani-infected plants from healthy leaves at the accuracy of 100%. This was a noticeable result because of more pathogenicity and more damage of A. solani
species. On fourth day after inoculation, Vis-NIR spectroscopy combined with the PCA-ANN computing method could diagnose the infected leaves and type of pathogen without any error by the simpler model. Therefore, it was concluded that Vis-NIR spectroscopy could be utilized for rapid and non-destructive early diagnosis of early blight on tomato plants before visual symptoms without any plant sample preparation. It is recommended that diagnosis of other causes of tomato leaf spots, including manganese deficiency, and fungi of Septoria sp. and Cercospora sp., in which some cases have similar symptoms to early blight, be evaluated by NIR spectroscopy in the future research.
Acknowledgement
This research was supported by Iranian Research Institute of Plant Protection and Agricultural Engineering Research Institute of Iran (Project number: 3-16-1614-039-970295).
References
1. Adhikari, P., Y. Oh, and D. R. Panthee. 2017. Current status of early blight resistance in tomato: an update. International Journal of Molecular 18 (10): 2019.
2. Atherton, D., D. G. Watson, M. Zhang, Z. Qin, and X. Liu. 2015. Hyperspectral spectroscopy for detection of early blight (Alternaria solani) disease in potato (Solanum tuberosum) plants at two different growth stages. In 2015 ASABE Annual International Meeting (p. 1). American Society of Agricultural and Biological Engineers.

Azadshahraki et al., Diagnosis of Early Blight Disease in Tomato Plant … 91
3. Atherton, D., R. Choudhary, and D. Watson. 2017. Hyperspectral remote sensing for advanced detection of early blight (Alternaria solani) disease in potato (Solanum tuberosum) plants prior to visual disease symptoms. In 2017 ASABE Annual International Meeting (p. 1). American Society of Agricultural and Biological Engineers.
4. Azadshahraki, F., B. Jamshidi, and V. R. Sharabiani. 2018. Non-destructive determination of vitamin C and lycopene contents of intact cv. Newton tomatoes using NIR spectroscopy. Yuzuncu Yil University Journal of Agricultural Sciences 28 (4): 389-397.
5. Babagoli, M. A., and E. Behdad. 2012. Effects of three essential oils on the growth of the fungus Alternaria solani. Journal of Research in Agricultural Science 8 (14): 45-57.
6. Brown, D. J., R. S. Bricklemyer, and P. R. Miller. 2005. Validation requirements for diffuse reflectance soil characterization models with a case study of VNIR soil C prediction in Montana. Geoderma 129 (3-4): 251-267.
7. Castro, W., J. Oblitas, R. Santa-Cruz, and H. Avila-George. 2017. Multilayer perceptron architecture optimization using parallel computing techniques. PloS One 12 (12): 1-17.
8. Cen, H., and Y. He. 2007. Theory and application of near infrared reflectance spectroscopy in determination of food quality. Trends in Food Science & Technology 18 (2): 72-83.
9. Chaerani, R., and R. E. Voorrips. 2006. Tomato early blight (Alternaria solani): the pathogen, genetics, and breeding for resistance. Journal of General Plant Pathology 72 (6): 335-347.
10. Chaerani, R., R. Groenwold, P. Stam, and R. E. Voorrips. 2007. Assessment of early blight (Alternaria solani) resistance in tomato using a droplet inoculation method. Journal of General Plant Pathology 73 (2): 96-103.
11. Dai, Q., J. H. Cheng, D. W. Sun, H. Pu, X. A. Zeng, and Z. Xiong. 2015. Potential of visible/near-infrared hyperspectral imaging for rapid detection of freshness in unfrozen and frozen prawns. Journal of Food Engineering 149: 97-104.
12. Ding, S., K. Meinholz, K. Cleveland, S. A. Jordan, and A. J. Gevens. 2019. Diversity and virulence of Alternaria spp. causing potato early blight and Brown spot in Wisconsin. Phytopathology 109 (3): 436-445.
13. Ershad, D. 2009. Fungi of Iran. 3rd edition, Iranian Research Institution of Plant Protection. 531 pp.
14. Fulton, T. M., J. Chunwongse, and S. D. Tanksley. 1995. Microprep protocol for extraction of DNA from tomato and other herbaceous plants. Plant Molecular Biology Reporter 13 (3): 207-209.
15. Gold, K. M., P. A. Townsend, A. Chlus, I. Herrmann, J. J. Couture, E. R. Larson, and A. J. Gevens. 2020. Hyperspectral measurements enable pre-symptomatic detection and differentiation of contrasting physiological effects of late blight and early blight in potato. Remote Sensing 12 (2): 286.
16. Ghanei Ghooshkhaneh, N., M. R. Golzarian, and M. Mamarabadi. 2018. Detection and classification of citrus green mold caused by Penicillium digitatum using multispectral imaging. Journal of the Science of Food and Agriculture 98 (9): 3542-3550.
17. Jamshidi, B., S. Minaei, E. Mohajerani, and H. Ghassemian. 2015. Pattern recognition of near-infrared spectroscopy for non-destructive discrimination of oranges based on taste index. Journal of Agricultural Machinery 5 (1): 101-110. (In Persian).
18. Jinendra, B., K. Tamaki, S. Kuroki, M. Vassileva, S. Yoshida, and R Tsenkova. 2010. Near infrared spectroscopy and aquaphotomics: Novel approach for rapid in vivo diagnosis of virus infected soybean. Biochemical and Biophysical Research Communications 397 (4): 685-690.Kia, M. 2010. Neural network using MATLAb. Tehran: Kiyan Rayane.408pp.
19. Mireei, S. A., S. S. Mohtasebi, R. Massudi, S. Rafiee, and A. S. Arabanian. 2010. Feasibility of near infrared spectroscopy for analysis of date fruits. International Agrophysics 24 (4): 351-356.

92 Journal of Agricultural Machinery Vol. 12, No. 1, Spring 2022
20. Minich, D. M. 2019. A review of the science of colorful, plant-based food and practical strategies for “eating the rainbow. Nutrition and Metabolism 2019.
21. Mouazen, A. M., W. Saeys, J. Xing, J. De Baerdemaeker, and H. Ramon. 2005. Near infrared spectroscopy for agricultural materials: an instrument comparison. Journal of Near Infrared Spectroscopy 13 (2): 87-97.
22. Nicolai, B. M., K. Beullens, E. Bobelyn, A. Peirs, W. Saeys, K. I. Theron, and J. Lammertyn. 2007. Nondestructive measurement of fruit and vegetable quality by means of NIR spectroscopy: A review. Postharvest Biology and Technology 46 (2): 99-118.
23. Nicolai, B. M., T. Defraeye, B. De Ketelaere, E. Herremans, M. L. Hertog, W. Saeys, A. Torricelli, T. Vandendriessche, and P. Verboven. 2014. Nondestructive measurement of fruit and vegetable quality. Annual Review of Food Science and Technology 5: 285-312.
24. Omid, M., A. Mahmoudi, and M. H. Omid. 2010. Development of pistachio sorting system using principal component analysis (PCA) assisted artificial neural network (ANN) of impact acoustics. Expert Systems with Applications 37 (10): 7205-7212.
25. Pan, L., Q. Zhang, W. Zhang, Y. Sun, P. Hu, and K. Tu. 2016. Detection of cold injury in peaches by hyperspectral reflectance imaging and artificial neural network. Food Chemistry 192: 134-141.
26. Purcell, D. E., M. G. O'Shea, R. A. Johnson, S. Kokot. 2009. Near-infrared spectroscopy for the prediction of disease ratings for Fiji leaf gall in sugarcane clones. Journal of Applied Spectroscopy 63 (4): 450-457.
27. Rotem, J. 1994. The genus Alternaria: biology, epidemiology, and pathogenicity. American Phytopathological Society Press, St. Paul, Minnesota.
28. Salchenberger, L. M., E. M. Cinar, and N. A. Lash. 1992. Neural networks: A new tool for predicting thrift failures. Decision Sciences 23 (4): 899-916.
29. Sankaran, S., A. Mishra, J. M. Maja, and R. Ehsani. 2011. Visible-near infrared spectroscopy for detection of Huanglongbing in citrus orchards. Computers and Electronics in Agriculture 77 (2): 127-134.
30. Sigmund, R., and E. Gustav. 1991. The cultivated plants of the tropics and subtropics. Institute of Agronomy in the Tropics, University of Gottingen, Germany, p. 552.
31. Sankaran, S., R. Ehsani, S. A. Inch, and R. C. Ploetz. 2012. Evaluation of visible-near infrared reflectance spectra of avocado leaves as a non-destructive sensing tool for detection of laurel wilt. Plant Disease 96 (11): 1683-1689.
32. Sankaran, S., and R. Ehsani. 2013. Comparison of visible-near infrared and mid-infrared spectroscopy for classification of Huanglongbing and citrus canker infected leaves. Agricultural Engineering International: CIGR Journal 15 (3): 75-79.
33. Sherf, A. F., and A. A. MacNab. 1986. Vegetable diseases and their control. John Wiley and Sons, USA, 722 pp.
34. Simmons, E. G. 2000. Alternaria themes and variations (244-286) species on Solanaceae. Mycotaxon 75: 1-115.
35. Song, Y., Q. Diao, and H. Qi. 2015. Polyamine metabolism and biosynthetic genes expression in tomato (Lycopersicon esculentum Mill) seedlings during cold acclimation. Journal of Plant Growth Regulation 75: 21-32.
36. Teye, E., X. Y. Huang, and N. Afoakwa. 2013. Review on the potential use of near infrared spectroscopy (NIRS) for the measurement of chemical residues in food. American Journal of Food Science and Technology 1: 1-8.
37. Taiz, L., and E. Zeiger. 2002. Plant Physiology. 3rd ed Sinauer Associates Inc Publishers. Sunderland, MA, 690pp.
38. Thomma, B. P. 2003. Alternaria spp.: from general saprophyte to specific parasite. Molecular Plant Pathology 4 (4): 225-236.

Azadshahraki et al., Diagnosis of Early Blight Disease in Tomato Plant … 93
39. Wold, S., M. Sjöström, and L. Eriksson. 2001. PLS-regression: a basic tool of chemometrics. Chemometrics and Intelligent Laboratory Systems 58 (2): 109-130.
40. Xie, C., Y. Shao, X. Li, and Y. He. 2015. Detection of early blight and late blight diseases on tomato leaves using hyperspectral imaging. Scientific Reports 5: 16564.
41. Xie, C., and Y. He. 2016. Spectrum and image texture features analysis for early blight disease detection on eggplant leaves. Sensors 16 (5): 676.
42. Yin, X., and S. Zhao. 2013. Hyperspectral recognition of processing tomato early blight based on GA and SVM. In Fif
th International Conference on Machine Vision (ICMV 2012):
Computer Vision, Image Analysis and Processing (Vol. 8783, p. 87831D). International Society for Optics and Photonics.
43. Yoplac, I., H. Avila-George, L. Vargas, P. Robert, and W. Castro. 2019. Determination of the superficial citral content on microparticles: An application of NIR spectroscopy coupled with chemometric tools. Heliyon 5 (7): e02122.
44. Zhang, D., J. Y. He, P. Haddadi, J. H. Zhu, Z. H. Yang, and L. Ma. 2018. Genome sequence of the potato pathogenic fungus Alternaria solani HWC-168 reveals clues for its conidiation and virulence. BMC Microbiology 18 (1): 1-13.
45. Zitter, T. A., J. L. Drennan, M. A. Mutschler, and M. J. Kim. 2004. Control of early blight of tomato with genetic resistance and conventional and biological sprays. In I International Symposium on Tomato Diseases 695 (pp. 181-190).
94 Journal of Agricultural Machinery Vol. 12, No. 1, Spring 2022
های کشاورزینشریه ماشین
https://jame.um.ac.ir/
مقاله پژوهشی
12-41ص ،2102بهار ، 2شماره ، 21جلد
سنجی مرئی/ فروسرخ نزدیک و فرنگی بر پایه طیف موجی گیاه گوجه تشخیص بیماری لکه
شبکه عصبی مصنوعی قبل از ظهور علائم بیماری -های اصلی تجزیه مؤلفه
5، هانیه نادری4زاده ، روح الله کریم3، بهاره جمشیدی2، کسری شریفی*1فرزاد آزادشهرکی
32/09/3299تاریخ دریافت: 32/33/3299تاریخ پذیرش:
چکیده
تواند افت عملکرد را محصول را کاهش داده و کیفیت آن را افزایش دهد. این امر خیص زودهنگام بیماری گیاهان قبل از وقوع علائم، میتششخیص غیر تخریبی بیماری دهد. هدف از انجام این تحقیق، ت محیطی و هزینه تولید را کاهش می همچنین مصرف سموم شیمیایی، مشکلات زیست
( از یکدیگر در مراحل اولیه بیماری، قبل A. solani, A. alternateزای آن ) ترین عوامل بیماری فرنگی و همچنین تشخیص مهم موجی گیاه گوجه لکه های گیاهان آلوده به ز برگهای طیفی ا نانومتر( بود. داده 900-000سنجی مرئی/ فروسرخ نزدیک ) از بروز علائم ظاهری، با استفاده از طیف
A. alternate وA. solani های های تشخیص بر اساس داده منظور توسعه مدل ساعت بعد از تلقیح بیماری استخراج شدند. به 330 و 99، 23، 04درتوانست PCA-ANNل ( استفاده شد. نتایج نشان داد که مدANN( همراه با شبکه عصبی مصنوعی )PCAهای اصلی ) طیفی، از تجزیه مؤلفه
تر دست آمدن مدل ساده ساعت بعد از تلقیح، علاوه بر به 99های تست شناسایی کند. در درصد در نمونه 300-92گیاهان آلوده و نوع پاتوژن را با دقت های بعد از تلقیح، در زمانهای تدوین شده، در تمامی درصد تشخیص حاصل شد. مدل 300نرون در لایه مخفی(، دقت 2مؤلفه اصلی و 4بینی ) پیش
سنجی باشد نسبت به گیاهان سالم، هیچ خطایی نداشتند. استفاده از طیف زایی بالایی می رای قدرت بیماریاکه د A. solaniتشخیص گیاهان آلوده با وژن آن را قبل از بروز علائم فرنگی و نوع پات موجی گوجه توانست بیماری لکه PCA-ANNنانومتر( همراه با 900-000مرئی/ فروسرخ نزدیک )
تواند صورت غیر مخرب تشخیص دهد. نتایج این پژوهش نشان داد که این تکنیک می سازی گیاه، به درصد( بدون هیچ آماده 92-300ظاهری )با دقت کار رود. مخرب به بر، گران و های آزمایشگاهی زمان جای روش فرنگی به هزینه و زودهنگام این بیماری گوجه برای تشخیص سریع، کم
موجی لکه ،فرنگی سنجی فروسزخ نزدیک، گوجه های اصلی، طیف تجزیه مؤلفهواژهای کلیدی:
ایران ،موزش و ترویج کشاورزی، کرج، آمؤسسه تحقیقات فنی و مهندسی کشاورزی، سازمان تحقیقات -3 های گیاهان، مؤسسه تحقیقات گیاهپزشکی کشور، سازمان تحقیقات، آموزش و ترویج کشاورزی، تهران، ایران بخش تحقیقات بیماری -3 آموزش و ترویج کشاورزی، کرج، ایران مؤسسه تحقیقات فنی و مهندسی کشاورزی، سازمان تحقیقات، -2 ایران ،دانشکده فیزیک، دانشگاه شهید بهشتی، تهران -0 شرکت واندا اطلس، کرج، ایران -5 ([email protected]: Emailنویسنده مسئول: -*)
DOI: 10.22067/jam.2021.67436.1001