diabetes research - openventio... publishers diabetes research open journal issn 2379-6391...
TRANSCRIPT

www.openventio.org
PUBLISHERS
Diabetes ReseaRchOpen Journal
ISSN 2379-6391
Editor-in-Chief Shi Fang Yan, MD
Associate EditorsStephen I-Hong Hsu, MD, PhDJian-Xiong Chen, MD, FAHATakashi Nomiyama, MD, PhD
| January 2016 | Volume 1 | issue 5 |

Diabetes Research
Open Journal
Diabetes Res Open J
ISSN 2379-6391
Table of Contents
1. Current Controversies around Carbohydrate Restriction and the Risk of High-Protein Diets
– Charlotte Warren, Heather Hannah and Kami Kandola*
2. The Use of Urtica dioica (Stinging Nettle) as a Blood Sugar Lowering Herb: A Case Report and a Review of the Literature
3. Diabetes in the Northwest Territories
4. Clinical and Experimental Evidence of Hypoglycemic Neuropathy
5. Changes of Fat Volume and Adipocytokines by the Randomized Interven-tion Program for Obesity Control Program (SCOP)
– Bisrat Hailemeskel* and Fekadu Fullas
– Yung-Chu Hsu, Hui-Lun Zhan and Chun-Pai Yang*
– Nobuhisa Kawashima, Shaw Watanabe*, Akemi Morita, Naomi Aiba, Motohiko Miyachi,Tohru Sakai for Saku Control Obesity Program (SCOP) Study Group
– Shaw Watanabe*
Editorial
Research
Review
Case Report
Review
136-146
128-130
131-135
123-127
e7-e10

Diabetes Research
Open Journalhttp://dx.doi.org/10.17140/DROJ-1-e003
Diabetes Res Open J
ISSN 2379-6391
Current Controversies around Carbohydrate Restriction and the Risk of High-Protein Diets
Shaw Watanabe*
Life Science Promoting Association, Tokyo 160-0015, Japan
Editorial*Corresponding authorShaw Watanabe, MD, PhD PresidentLife Science Promoting Association25-3-1004, Daikyo-cho, Shinjuku-ku Tokyo 160-0015, Japan E-mail: [email protected]
Article HistoryReceived: December 26th, 2015 Accepted: December 28th, 2015 Published: December 28th, 2015
CitationWatanabe S. Current controversies around carbohydrate restriction and the risk of high-protein diets. Diabe-tes Res Open J. 2015; 1(5): e7-e10. doi: 10.17140/DROJ-1-e003
Copyright© 2015 Watanabe S. This is an open access article distributed under the Creative Commons At-tribution License, which permits unrestricted use, distribution, and reproduction in any medium, pro-vided the original work is properly cited.
Volume 1 : Issue 5Article Ref. #: 1000DROJ1e003
Page e7
LOW CARBOHYDRATE DIET AND FRUCTOSE-RICH CORN SYRUP
Recently, a Low carbohydrate (LCH) diet has been recommended by many doc-tors to control hyperglycemia and overweight. Unlike a traditional calorie-restricted diet, a carbohydrate-restricted diet typically contains less than 15% of the total energy intake from carbohydrates and about 30% from proteins. High glycemic index carbohydrates are the only cause of the glucose spike, so the main benefit of a LCH diet is not to cause postprandial hyper-glycemia, which is considered to be the most serious risk factor for arteriosclerosis in diabetic patients. Life With Diabetes1 says that all absorbable carbohydrate foods turn to glucose in the blood, while fats and proteins do not, at least directly. Compared to a calorie-restricted diet, a carbohydrate-restricted diet accelerates fat metabolism yielding to ketogenic energy and helps gluconeogenesis in the liver, resulting in a more effective control of weight.
The recent movie “That Sugar Film” seems to expose the dangers of eating sugar for the society. Inspired by “Super Size Me”, the antecedent of “That Sugar Film”, Gameau relates how he experienced on his own body for 60 days, and indulged in taking healthy foods contain-ing sugar. The experiment caused fatty liver, an excess of 10 cm of visceral fat around his waist, mood swings, and metabolic changes which could lead to coronary disease. Gameau actually consumed the typical Australian amount of 40 teaspoons of sugar (160 g) a day, maintained physical exercise, took the same amount of kilojoules as in his usual diet, and only ate food items perceived to be healthy. The latter include cereal, smoothies, muesli bars, and low-fat yoghurt. For Gameau, the worst effects of the diet were on his cognition, mood and ability to concentrate.
Food companies are convincing people that these foods might actually be good for them. At the same time, these products are replete with cheap additives, and premium prices are charged to make consumers believe that they are purchasing something healthy. In 2015, World Health Organization (WHO) recommended to reduce the intake of free sugars throughout the life course.2 For both adults and children, WHO recommends reducing the intake of free sugars to less than 10% of total energy intake. WHO suggests a further reduction of the intake of free sugars to below 5% of the total energy intake. However, the problem is not only caused by refined sugars, but also by syrup hidden in processed foods. The sweetness of fructose is 1.5 times stronger than sucrose. Because high fructose corn syrup is cheap and easy to handle, it is frequently added to many industrial foods.
The average dietary intake of fructose, largely derived from sweeteners based on high-fructose corn syrup, has been estimated to increase by 20-40% over the last three decades. Compared to glucose, fructose is more potent in the stimulation of de novo hepatic lipogenesis and Very Low Density Lipoprotein (VLDL) secretion, which subsequently impact on systemic energy metabolism and insulin sensitivity. Fructose is absorbed by enterocytes through Glu-cose Transporter or Fructose Transporter (GLUT5), a fructose-specific hexose transporter, and reaches the liver through the portal vein. In the liver, fructose enters the glycolytic pathway downstream of phosphofructokinase, a rate-limiting enzyme of the glycolysis, and generates carbons for the synthesis of fatty acids and triglycerides. Fructose intake also activates the ex-pression of lipogenic genes, which involves the induction of Sterol Regulatory Element Bind-ing Proteins (SREBP), particularly SREBP1c, a major transcriptional regulator of lipogenic

Diabetes Research
Open Journalhttp://dx.doi.org/10.17140/DROJ-1-e003
Diabetes Res Open J
ISSN 2379-6391
Page e8
gene expression.3 High-fructose corn syrup is certainly not a healthy alternative to sucrose.4
Recently, sweetened fruit (soft) drinks have received considerable attention as popular high-energy beverages potentially related to the prevalence of obesity among young children. Wright et al5 performed a secondary analysis of the data from the Na-tional Health and Nutrition Examination Survey (NHANES) 1999-2002. Twenty-four percent of the children were overweight or at risk for overweight, and more than 80% children drank fructose-rich high-calorie drinks.
Thus, the sources of excessive intake of fructose and glucose are mostly processed foods, fruit drinks, and soda, where sweeteners are added to cause taste addiction. Fruit sugar (fructose, the sweeter half of sucrose or cane sugar) is poisonous to the liv-er in sustained large quantities. Excessive intake of apple juice and other fruit juices is not part of a healthy diet. Abid et al6 reported that the consumption of soft drinks is associated with fatty liver disease, independently of the presence of a metabolic syndrome.
HYPERKETONEMIA FROM LOW CARBOHYDRATE DIET
Low-carbohydrate diet relies on alternate energy sources for the human body. Some specialized cells, for example in the brain, retina, gonadal germinal epithelium, and erythrocytes require glucose as the primary energy source. Carbohydrate-restriction diet increases the concentration of β-hydroxy butyrate (BHB) and other ketones in the blood. Cahill7 studied the glucose metabolism of people who voluntarily fasted for 40 days. He reported that in starving human adults, BHB and aceto-acetate were produced in the liver from long-chain fatty acids and released into the blood. BHB can rise to approximately 6 mM during starvation, but newly produced amounts of acetyl-CoA from fat cannot be metabolized in the Krebs cycle and it is diverted towards ketone body synthe-sis. The reference range of BHB is less than 0.4-0.5 mmol/L in healthy persons, but it may exceed 1 mmol/L as a consequence of a carbohydrate-restricted diet.8
Glucose, BHB, and aceto-acetate are used as energy sources for the brain of people put on a low-carbohydrate diet. How-ever, the brain requires 80 g glucose a day by gluconeogenesis, with the following daily synthesis: 15-20 g glucose from lactic acid and glycerol, 20 g from pyruvate reuse, 35-40 g from ketone bodies, and 10-11 g from the degradation of proteins. The liver accounts for two-fifths, and the kidney for three-fifths of the glucose production.9 A low-carbohydrate diet inevitably requires high-fat high-protein diet. An example of high-fat diet is the keton formula in which 70% of energy comes from fat, and 30% from proteins. The keton formula is usually given for 2 years to epileptic children, and long-term effects are unknown. The effects of dietary composi-tion on energy expenditure during the maintenance of weight loss have been shown in recent studies.10
RISKS OF HIGH PROTEIN, LOW CARBOHYDRATE DIET
Ebbeling et al10 conducted a cross-over study on the effects of three different diet regimens administered for 4 weeks: isocaloric low-fat diet (60% of energy from carbohydrates, 20% from proteins); low-glycemic index diet (40% from carbohydrates, 20% from proteins); and very low-carbohydrate diet (10% from carbohydrates, 30% from proteins). Compared with the baseline prior to weight loss, the resting and total energy expenditure were increased in the very low-carbohydrate/high protein group. Uri-nary corticosteroids and C-reactive protein were also high. These observations would suggest that metabolic changes caused by a 3-weeks intake of low-carbohydrate/high protein diet resulted in stress and inflammation of the body.
Altogether, the above data suggest that longer-term human studies are necessary to determine the ideal balance between major nutrients, carbohydrate, protein and fat associated with a healthy longevity. The low carbohydrate/high-protein diet used in the Swedish women’s cohort study showed that low carbohydrate/high protein diets are associated with an increased risk of cardio-vascular diseases after an average of 15.7 years of follow-up.11 The longest follow-up study is the US physician and nurse’s cohorts, in which 44,548 males and 85,168 females were followed up for 20 years and 12.6 years respectively.12 The total number of deaths among males was 8678, including 2746 cardiovascular deaths and 2960 cancer cases. Those among females were 1255 total deaths, 2458 cardiovascular deaths and 5780 cancer cases. The relative risk of high protein low carbohydrate diet was estimated at 1.23 for total deaths, 1.14 cardiovascular deaths, and 1.28 cancers. Other studies have shown similar trends.13,14 The risk of chronic kidney diseases has not been described, but the risk of high-protein diet for kidney has been shown in many studies. We conducted a cross-sectional study on Chronic Kidney Disease (CKD) patients with very low protein diet (protein <0.5 g/kg/day). We found that they remained healthy for more than 6.7 years on average without clinical manifestation, starting from more than 5-6 mg serum creatinin/dl.15
IDEALLY BALANCED HEALTHY DIET AND DIETARY HABITS
Solon-Biet et al16 compared three regimens varying in protein to carbohydrate ratio under both Calorie Restriction (CR) and

Diabetes Research
Open Journalhttp://dx.doi.org/10.17140/DROJ-1-e003
Diabetes Res Open J
ISSN 2379-6391
Page e9
ad libitum conditions. These diets were classified as low-protein (5%), Low-protein high-carbohydrate (LPHC), medium-protein (33%), medium-carbohydrate and high-protein (60%), low-carbohydrate. Fat content was fixed at 20% of the total energy intake for all three diets. Ad libitum LPHC diets offered similar benefits to CR in terms of levels of insulin, glucose, lipids, and Homeostatic model assessment (HOMA), despite an increased energy intake. CR on LPHC diets did not provide additional benefits relative to ad libitum LPHC.
Whereas HPLC diets do not sustain optimal cardio-metabolic health in later ages, it is important to note that nutritional re-quirements change with age, and higher P:C diets are required to support reproduction rather than to sustain a maximal lifespan.17,18 You can prevent very severe health risks by improving your diet with an appropriate carbohydrate content, by exclusively eating natural foods with plenty of green vegetables, and by avoiding meat. Most of us know more or less what we should eat in order to feel well and have the weight which suits us. Fruits and vegetables should be part of our everyday meals. And whatever we eat should conform with our hunger and satiety.
Nettleton JA et al19 recently reported a meta-analysis investigating associations between healthy diet, fasting glucose, insulin levels, and genetic loci associated with glucose homeostasis. They utilized data from 15 USA and European cohort studies comprising 51,289 persons without diabetes to test whether genotype and diet interact to influence glucose or insulin concentration. Genome-wide association studies focusing on genomic regions of diabetes and obesity did not show statistically significant associa-tions.
Thus, dietary and other lifestyle habits are important for a healthy live. We all know these basic rules, but many of us are intoxicated by the food industry and so called ‘specialist’ messages. Rational thinking and emotions are disconnected . Brownell et al20 argue in favour of a tax system that could promote good nutrition and help the nation recover health care costs associated with the consumption of sugar-sweetened beverages. Such integrative approaches should be effective to make our world a healthier place. REFERENCES
1. ADA. Diagnosis and classification of diabetes mellitus. Diabetes Care. 2004; 27(Suppl 1): s5-s10. doi: 10.2337/diacare.27.2007.S5
2. WHO. Guideline: Sugar intake for adult and children. Geneva, 2015. Available at: http://www.who.int/nutrition/en/ 2011; Ac-cessed 2015.
3. Nagai Y, Kashiwagi A. Health effects of fructose. Clin & Funct Nutriol. 2010; 2: 303-306.
4. Stanhope KL, Schwarz JM, Keim NL, et al. Consuming fructose-sweetened, not glucose-sweetened, beverages increases vis-ceral adiposity and lipids and decreases insulin sensitivity in overweight/obese humans. J Clin Invest. 2009; 119: 1322-1334. doi: 10.1172/JCI37385
5. Wright JD, Borrud LG, McDowell MA, Wang CY, Radimer K, Johnson CL. Nutrition assessment in the National Health And Nutrition Examination Survey 1999-2002. J Am Diet Assoc. 2007; 107(5): 822-829. doi: 10.1016/j.jada.2007.02.017
6. Abid A, Taho O, Nseir W, Farah R, Grosovski M, Assy N. Soft drink consumption is associated with fatty liver disease indepen-dent of metabolic syndrome. J Hepatol. 2009; 51: 918-924. doi: 10.1016/j.jhep.2009.05.033
7. Cahill GF Jr. Starvation in man. New Engl J Med. 1970; 282: 668-675.
8. Hirakawa A, Watanabe S, Tanaka S. Koda’s fasting therapy: Energy balance and intestinal bacterial flora. Adv Food Technol Nutr Sci Open J. 2015; 1(5): 112-123. Available at: http://openventio.org/Volume1_Issue5/Kodas_Fasting_Therapy_Energy_Bal-ance_and_Intestinal_Bacterial_Flora_AFTNSOJ_1_120.pdf
9. Laffel L. Ketone bodies: a review of physiology, pathophysiology and application of monitoring to diabetes.Diabetes Metab Res Rev. 1999; 15(6): 412-426. doi: 10.1002/(SICI)1520-7560(199911/12)15:6<412::AID-DMRR72>3.0.CO;2-8 10. Ebbeling CB, Swain JF, Feldman HA, et al. Effects of dietary composition on energy expnditure during weight-loss mainte-nance. JAMA. 2012; 307(24): 2627-2634. doi: 10.1001/jama.2012.6607
11. Sjögren P, Becker W, Warensjö E, et al. Mediterranean and carbohydrate-restricted diets and mortality among elderly men: a cohort study in Sweden. Am J Clin Nutr. 2010; 92(4): 967-974. doi: 10.3945/ajcn.2010.29345

Diabetes Research
Open Journalhttp://dx.doi.org/10.17140/DROJ-1-e003
Diabetes Res Open J
ISSN 2379-6391
Page e10
12. Fung TT1, van Dam RM, Hankinson SE, Stampfer M, Willett WC, Hu FB. Low-carbohydrate diets and all-cause and cause-specific mortality: two cohort studies. Ann Intern Med. 2010; 153(5): 289-298. doi: 10.7326/0003-4819-153-5-201009070-00003
13. Lagiou P, Sandin S, Weiderpass E, et al. Low carbohydrate-high protein diet and mortality in a cohort of Swedish women. J Intern Med. 2007; 261(4): 366-374.
14. Trichopoulou A, Psaltopoulou T, Orfanos P, Hsieh CC, Trichopoulos D. Low-carbohydrate-high-protein diet and long-term sur-vival in a general population cohort. Eur J Clin Nut. 2007; 61(5): 575-581. doi: 10.1038/sj.ejcn.1602557
15. Watanabe S, Noboru M, Yasunari M, Ideura T. A cross-sectional study of the effects of long term very low protein diets in patient with chronic kidney disease: serum and urine, DEXA and aminoacid profiles. Anti Aging Med. 2010; 7: 7-13. Available at: http://www.anti-aging.gr.jp/english/pdf/2010/7(2)0713-0205.pdf
16. Solon-Bie SM, Mitchell SJ, Coogan SCP, et al. Dietary protein to carbohydrate ratio and caloric restriction: comparing metabolic outcomes in mice cell rep. 2015; 11(10): 1529-1534. doi: 10.1016/j.celrep.2015.05.007
17. Simpson SJ, Le Couteur DG, Raubenheimer D. Putting the balance back in diet. Cell. 2015; 161: 18-23. doi: 10.1016/j.cell.2015.02.033
18. Solon-Biet SM, Walters KA, Simanainen UK, et al. Macronutrient balance, reproductive function, and lifespan in aging mice. Proc. Natl. Acad. Sci. USA. 2015; 112: 3481-3486.
19. Nettleton JA, Hivert MF, Lemaitre RN, et al. Meta-analysis investigating associations between healthy diet and fasting glucose and insulin levels and modification by loci associated with glucose homeostasis in data from 15 cohorts. Am J Epidemiol. 2013; 177(2): 103-115. doi: 10.1093/aje/kws297
20. Brownell KD, Farley T, Willett WC, et al. The public health and economic benefits of taxing sugar-sweetened beverages. N Engl J Med. 2009; 361: 1599-1605. doi: 10.1056/NEJMhpr0905723

Diabetes Research
Open Journalhttp://dx.doi.org/10.17140/DROJ-1-119
Diabetes Res Open J
ISSN 2379-6391
The Use of Urtica dioica (Stinging Nettle) as a Blood Sugar Lowering Herb: A Case Report and a Review of the Literature
Bisrat Hailemeskel1* and Fekadu Fullas2
1Associate Professor and Director of Drug Information Services, College of Pharmacy, Howard University, 2300 4th Street, N.W, Washington, DC 20059, USA2Clinical Pharmacist, Unity Point Health-St. Luke’s, 2720 Stone Park Boulevard, Sioux City, IA 51104, USA
Case Report*Corresponding author:Bisrat Hailemeskel, PharmD, MS, RPh Associate Professor Director of Drug Information Services College of Pharmacy Howard University 2300 4th Street, N.W Washington, DC 20059, USATel. (202) 806-4214Fax: (202) 806-7748E-mail: [email protected]
Article History:Received: September 24th, 2015 Accepted: October 15th, 2015 Published: October 15th, 2015
CitationHailemeskel B, Fullas F. The use of Urtica dioica (stinging nettle) as a blood sugar lowering herb: a case re-port and a review of the literature. Di-abetes Res Open J. 2015; 1(5): 123-127. doi: 10.17140/DROJ-1-119
Copyright: © 2015 Hailemeskel B. This is an open access article distributed under the Creative Commons At-tribution License, which permits unrestricted use, distribution, and reproduction in any medium, pro-vided the original work is properly cited.
Volume 1 : Issue 5Article Ref. #: 1000DROJ1119
Page 123
ABSTRACT
Introduction: Medicinal plants have been used in traditional medicine to manage blood sugar levels in patients with diabetes, but only a few of them have received scientific investigation. Many patients tend to self-medicate with herbal supplements, based on information they obtain from various sources.Case Summary: A 57 year-old African-American male with diabetes had been prescribed met-formin. He started on his own taking Stinging Nettle concurrently with metformin, which led to hypoglycemia. He then stopped taking metformin and continued with the herb. His morning fasting blood sugar stayed at less than 120 mg/dL. Because of accessibility, several months later he then discontinued taking Stinging Nettle, at which time his blood glucose level climbed up to 140-160 mg/dL. At this point, he saw his healthcare provider who put him back on metfor-min, and his blood glucose was well managed after that.Conclusion: A systematic literature evaluation on Stinging Nettle showed some evidence of the blood sugar lowering effect of the plant. The patient in this case may have benefited from this property of the plant. Considering poor regulation and the possible variation of herbal supple-ment products in the market, routine use of Stinging Nettle should not be encouraged. However, there is some evidence on the blood lowering property of Stinging Nettle.
KEYWORDS: Urtica dioica; Stinging nettle; Diabetes.
ABBREVIATIONS: PPAR: Peroxisome Proliferator-Activated Receptor; TZDs: Thiazolidine-diones; SGOT: Serum Glutamic Oxaloacetic Transaminase; HbA1c: Glycated hemoglobin; IL-6: Interleukin 6; TNF-alpha: Tumor Necrosis Factor-alpha; hs-CRP: High Sensitive C-Reactive protein.
INTRODUCTION
Diabetes mellitus affects over 250 million people worldwide and is expected to affect some 380 million by 2025.1 Each year another 7 million people develop diabetes. The first line treatment for type 2 diabetes is diet, weight control and physical activity. If blood glucose level remains high despite a trial of these lifestyle measures, then medications are usually advised. Although, there are many effective drugs available on the market, the majority of persons with type 2 diabetes eventually fail to respond to a commonly used first-line oral medication (e.g. metformin). There are several categories of drugs for type 2 diabetes, including sulfonylureas, biguanides, thiazolidinediones, meglitinides, dipeptidyl peptidase IV, insulin, etc. Finding an effective alternative oral treatment to avoid administration of exogenous insulin and/or other therapies by daily needle injection would be desirable. Some persons with diabetes continue to self-medicate with alternative products such as herbs and other supplements. The blood glucose lowering effect of Stinging Nettle has been noted in old writings.

Diabetes Research
Open Journalhttp://dx.doi.org/10.17140/DROJ-1-119
Diabetes Res Open J
ISSN 2379-6391
Page 124
Recently, some investigations have reported on the hypoglyce-mic effect of Urtica dioica, but so far, the mechanism of this effect has not been deduced. Some studies show that it may work as a secretagogue, or as a Peroxisome Proliferator-Activated Receptor (PPAR) agonist. PPAR agonists are drugs that lower blood glucose level by enhancing insulin secretion by Langer-hans Islets.
CASE REPORT
A 57 year-old African-American contacted our drug information center regarding the use of Stinging Nettle in lower-ing his blood sugar. The caller admitted to having a history of diabetes mellitus and had been on metformin 500 mg twice dai-ly for a few years prior. His other medications included aspirin 81 mg daily, metoprolol 50 mg twice daily, and atorvastatin 40 mg once daily. He started using Stinging Nettle about a year or so ago previously. He prepared a tea by boiling the fresh leaves in hot water and straining out the leaves. He consumed the hot tea once daily in the morning. After experiencing a few hypo-glycemic episodes, he stopped taking metformin, but continued taking the herb. His follow up self-reported average morning fasting blood glucose was less than 120 mg/dL. After about 9 months, he moved to another city and stopped taking the herb because he was not able to get the fresh leaves anymore. Within 2 months, his blood glucose level started to rise to a range of 140-160 mg/dL. At the time of his call to our center, he was put back on metformin. The patient stated that his current metformin dosage regimen at the time he contacted us was 500 mg three times daily, which resulted in good blood sugar control. In a fol-low up call in preparation for this publication, the patient also admitted that after he moved to the new city, he has not been exercising as much. No other lab data or medical record was available for review. We now provide a critical review of the published literature to assess the potential therapeutic value of Stinging Nettle as a natural product with blood glucose lowering properties.
DISCUSSION
Urtica dioica L. (Family: Urticaceae)2
Stinging Nettle is a small plant that has fine hairs on the leaves and stems. The scientific name for the plant is Urtica dioica. The genus name Urtica comes from the Latin verb urere that means, “to burn” because of these stinging hairs. The spe-cies name dioica means “two houses” because the plant usually contains either male or female flowers. The species is divided into six subspecies, five of which have many hollow stinging hairs called trichomes on the leaves and stems, which act like hypodermic needles, injecting histamine, serotonin, and choline that produce a stinging sensation when they come into contact with humans and other animals.3 The plant has been used for hundreds of years as a diuretic and to treat painful muscles and joints, eczema, and arthritis. Today, many people use Stinging Nettle to treat benign prostatic hyperplasia. Stinging nettle prod-
ucts are usually made from the leaves and stems, and sometimes from the roots. (Figure 1)
LITERATURE REVIEW
Medicinal plants have been a repository of a wide vari-ety of biologically active compounds for many centuries but are still largely unexplored.4 More than 400 traditional plants have been recorded with antidiabetic effects, but very few of these traditional plants have received proper scientific or medical in-vestigation.5 It is estimated that today, plant materials are present in, or have provided models for development of about half of the Western drugs.6 Because of their perceived effectiveness, mini-mal side effects in clinical experience and relatively low cost herbal drugs are prescribed widely even when their biologically active compounds are unknown.7
Several studies suggest that the Stinging nettle works as a PPAR gamma agonistic and alpha-glucosidase inhibitory agent.8,9 The two most common receptor targets for a number of PPAR agonist marketed drugs are PPAR-alpha and PPAR-gamma receptors. PPAR-alpha receptors are the main target for fibrate drugs used in reducing triglycerides, while PPAR-gamma receptors are the main target of the drug class of Thiazolidin-ediones (TZDs) used for blood glucose lowering in persons with diabetes mellitus. Pancreatic α-amylase and intestinal α-glucosidase are enzymes that play major roles in the digestive system in cata-lyzing starch by hydrolyzing the α-1,4-glucoside linkages. The inhibition of these enzymes significantly decreases the digestion and uptake of carbohydrates, thereby decreasing the postpran-dial blood glucose level in persons with non-insulin dependent diabetes mellitus.8 Drugs such as acarbose, miglitol and vogli-bose are currently used as α-glucosidase and α-amylase inhibi-tors. The main drawback of these drugs is that their hypoglyce-mic effect is lower than that of other oral antidiabetic agents, including sulfonylureas. They are therefore recommended as add-on therapy only. Another drawback of these agents is their side effects such as abdominal distention, bloating, flatulence and possibly diarrhea if not titrated up slowly.10 It has been sug-gested that the gastrointestinal effects might be caused by the excessive inhibition of the pancreatic α-amylase, leading to the abnormal bacterial fermentation of undigested carbohydrates in the colon.11 It has been postulated that natural products such as Stinging Nettle that have been shown to possess a low inhibi-tory effect against α-amylase and high inhibitory activity against
Figure 1: Urtica dioica (stinging nettle).
Diabetes Research
Open Journalhttp://dx.doi.org/10.17140/DROJ-1-119
Diabetes Res Open J
ISSN 2379-6391
Page 125
α-glucosidase can be used as an effective means to reduce post-prandial hyperglycaemia with minimal adverse effects.12
One of the most recent studies published in the use of Stinging Nettle in lowering blood sugar was done by Kian-bakht, et al.9 The authors conducted a randomized double-blind placebo-controlled clinical trial to evaluate the effects of tak-ing Stinging Nettle leaf extract (one 500 mg capsule every 8 hours for 3 months) combined with the conventional oral anti-hyperglycemic drugs.9 The authors evaluated the effect of the extracts on the blood levels of fasting glucose, postprandial glu-cose, Glycated hemoglobin (HbA1c), creatinine, Serum Glutam-ic Oxaloacetic Transaminase (SGOT), serum glutamic pyruvic transaminase (SGPT), and systolic and diastolic blood pressures. The clinical trial included 46 patients in the treatment arm and 46 patients in the placebo group. The results demonstrated that the extract significantly lowered the blood levels of fasting glu-cose. It was also shown that it decreases the 2-hour postprandial glucose level and HbA1c. However, there was no significant ef-fect on the other parameters compared with placebo. The authors concluded that these results demonstrated that Stinging Nettle is safe and may have a beneficial effect on glycemic control in patients with advanced type 2 diabetes mellitus that typically require insulin therapy.
Another recent study in Iran on Stinging Nettle leaves has shown evidence that the plant may have potential in anti-diabetic therapy.13 In this study, the Stinging Nettle consisted of freeze-dried extract from 100 g of powdered dried leaves in 100 ml of water. The results showed time- and concentration-dependent inhibition of α-amylase. According to the authors, the Stinging Nettle extracts showed the same inhibitory pattern as that of acarbose, a known α-glycosidase inhibitor, which is only one among a class of drugs with similar activities. How-ever, drugs in this class also act as strong competitive inhibitors of α-amylase. Acarbose, for example, is a well-known, natural product produced by several species of Actinoplanes. This com-pound has a pseudosugar ring and the glycosidic nitrogen link-age that mimics the transition state for the enzymatic cleavage of glycosidic bond and hence competitively inhibits α-amylase.14 In this study, the authors reported that a 0.4 mg/ml of Stinging Nettle leaf extract demonstrated a 60% inhibition of α-amylase activity. The level of inhibition was also time-dependent. The inhibitory effect increased from 40% at 5 minutes to 60% at 30 minutes.
A study in 2011 by Namazi, et al. evaluated the effect of hydroalcoholic extract of Stinging Nettle on insulin sensitiv-ity and some inflammatory indicators on a cohort with type 2 diabetes.15 Diabetes is a metabolic disorder that is strongly asso-ciated with micro-complications, such as retinopathy, nephropa-thy, and neuropathy and macro-complications including cardio-vascular risk. Inflammation is a potential risk factor for diabetic complications particularly cardiovascular disease. These anti-inflammatory indicators were measured in this study along with insulin sensitivity. The study was a randomized double-blind
clinical trial and included 50 men and women with type 2 dia-betes. The study was done over 8 weeks. The authors adjusted the study participants for age, sex and duration of diabetes, and then randomly assigned them into two groups, an intervention and a control group. The treatment groups received 100 mg/kg body weight nettle extract or placebo in three portions a day for 8 weeks. The parameters measured included Interleukin 6 (IL-6), Tumor Necrosis Factor-alpha (TNF-alpha), high sensitive C-Reactive protein (hs-CRP), and fasting insulin concentration. The researchers calculated Insulin Sensitivity, at the beginning and the end of the study. After 8 weeks, IL-6 and hs-CRP showed a significant decrease in the intervention group compared to the control group (p<0.05). The findings showed that the hydro-alcoholic extract of Stinging Nettle lowered the inflammatory markers, IL-6 and hs-CRP, in patients with type 2 diabetes after eight weeks intervention.
A study by Ahngarpour, et al. showed the effect of hydro-alcoholic extract of Stinging Nettle on fructose-induced insulin resistance rats.16 Forty male Wistar rats were randomly divided into five groups: 1) Control; 2) Fructose; 3) Extract 50; 4) Extract 100; and 5) Extract 200. The control group received vehicle. The fructose and extract groups received fructose 10% for eight weeks. The extract groups received single daily injec-tion of 50, 100 or 200 mg/kg/day of extract for the two weeks. The results showed that the extract groups had a significant re-duction in serum glucose and insulin levels. The study also showed a reduction in LDL. Leptin and LDL/HDL ratio. The authors concluded that Stinging Nettle extract decreases serum glucose, and thus may be useful for treatment of type 2 diabetes. They also speculated that Stinging Nettle might improve meta-bolic syndrome by the positive effect shown on lipid profile and also by lowering effect on leptin levels.
SAFETY AND ADVERSE EFFECTS
Stinging Nettle is relatively a safe plant if used appro-priately. The major adverse effect that has been documented in animal studies is that it lowers blood pressure and heart rate.17 Those with heart conditions should seek the advice and supervi-sion of a health practitioner to determine if the herb is suitable for their condition. Nettle has been documented to have diuretic effects. Thus, chronic use of this plant may be contraindicated in various medical conditions where diuretics are not advised. Because of the herb’s diuretic effects, it may enhance the effect of blood pressure medications including ACE inhibitors, beta-blockers, or calcium channel blockers. It can also increase the ef-fects other diuretics, including thiazides and loop diuretics, thus raising the risk of dehydration and electrolyte disturbances.18
Other occasional side effects include mild stomach upset, fluid retention, sweating, diarrhea, and hives or rash (mainly from topical use). It is important to be careful when handling the nettle plant because touching it can cause an allergic rash. Stinging Nettle should never be applied to an open
Diabetes Research
Open Journalhttp://dx.doi.org/10.17140/DROJ-1-119
Diabetes Res Open J
ISSN 2379-6391
Page 126
wound. Because, Stinging Nettle can alter the menstrual cycle and may contribute to miscarriage, pregnant women should not use Stinging Nettle. LIMITATIONS
Detailed medical history and complete demographic data of the patient were not collected. The amount of Stinging Nettle leaves used by the patient each time to prepare tea was not obtained. In the literature reviewed in this paper, there are no reported large multi-center and placebo-controlled studies on the benefits of the Stinging Nettle in patients with diabetes. How-ever, based on the studies reviewed, the plant may have some potential benefits in this patient population. Further studies in-volving a large number of patients are required to confirm the benefits.
BENEFITS
If patients choose to use Stinging Nettle for manage-ment of diabetes on their own initiative, they should be encour-aged to monitor their blood sugar very closely. In addition, they should also be advised to notify their physician of such use. The herb is also rich in vitamins A and C, iron, potassium, manga-nese, and calcium. It has a flavor similar to spinach and cucum-ber when cooked. In its peak season, Stinging Nettle contains up to 25% protein, dry weight, which is high for a leafy green veg-etable.19 Soaking Stinging Nettles in water or cooking removes the stinging chemicals from the plant, which allows them to be handled and eaten without injury. CONCLUSION
Following a call to our drug information center by a patient regarding the use of Stinging Nettle for treating diabetes, we conducted a review of the literature on medicinal properties of Stinging nettle. Previously published small human clinical tri-als suggest that the plant may be considered for investigation as a natural product source of a novel as-yet-unidentified active compound with glucose lowering activity.
CONFLICTS OF INTEREST
The authors declare that they have no conflicts of interest.
CONSENT
The patient has provided written permission for publication of the case details.
REFERENCES
1. International Diabetes Federation. In: Peter Bennett, ed. New data, fresh perspectives: Diabetes Atlas. 3rd ed. Media and events, 2006.
2. Urtica dioica in Wikipedia. Available at: https://en.wikipedia.org/wiki/Urtica_dioica 2015; Accessed October 10, 2015.
3. Chrubasik JE, Roufogalis BD, Wagner H, et al. A comprehen-sive review on the stinging nettle effect and efficacy profiles. Part II: urticae radix. Phytomedicine. 2007; 14: 568-579. doi: 10.1016/j.phymed.2007.03.014 4. Singh R, Dar SA, Sharma P. Antibacterial activity and toxico-logical evaluation of semipurified hexane extract of Urtica dio-ica leaves. Res J Med Plants. 2012; 6: 123-135.
5. Hasani-Ranjbar S, Larijani B, Abdollahi M. A systematic review of Iranian medicinal plants useful in diabetes mellitus. Arch Med Sci. 2008; 3: 285-292.
6. Baker J, Borris RP, Carté B, et al. Natural product drug dis-covery and development: new perspectives on international collaboration. J Nat Prod. 1995; 58: 1325-1357. doi: 10.1021/np50123a003 7. Valiathan MS. Healing plants. Curr Sci. 1998: 5: 1122-1126.
8. Fred-Jaiyesimi A, Kio A, Richard W. α-Amylase inhibitory effect of 3β-olean-12-en-3-yl (9Z)-hexadec-9-enoate isolated from Spondiasmombin leaf. Food Chem. 2009; 116: 285-288.
9. Kianbakht S, Khalighi-Sigaroodi F, Dabaghian FH. Improved glycemic control in patients with advanced type 2 diabetes mel-litus taking Urtica dioica leaf extract: a randomized double-blind placebo-controlled clinical trial. Clin Lab. 2013; 59 (9-10): 1071-1076.
10. Precose package insert (Bayer-US), Rev 10/95, Rec 12/95. Available at: http://tabbeagelli.blogger.hu/2013/12/26/precose-package-insert 2015; Accessed 2015.
11. Horii S, Fukasse K, Matrua T, et al. Synthesis and α-D-glucosidase inhibitory activity of N-substituted valiolamine de-rivatives as potent oral antidiabetic agents. J Med Chem. 1987; 29: 1038-1046.
12. Kim GN, Shin JG, Jang HD. Antioxidant and antidiabetic ac-tivity of Dangyuja (Citrus grandis Osbeck) extract treated with Aspergillus saitoi. Food Chem. 2009; 117: 35-41. doi: 10.1016/j.foodchem.2009.03.072 13. Rahimzadeh M, Jahanshahi S, Moein S, et al. Evaluation of alpha- amylase inhibition by Urtica dioica and Juglans regia extracts. Iran J Basic Med Sci. 2014; 17: 465-469.
14. Robyt JF. Inhibition, activation, and stabilization of α-amylase family enzymes. Biologia Bratislava. 2005; 16: 17-26.
15. Namazi N1, Esfanjani AT, Heshmati J, et al. The effect of

Diabetes Research
Open Journalhttp://dx.doi.org/10.17140/DROJ-1-119
Diabetes Res Open J
ISSN 2379-6391
Page 127
hydro alcoholic Nettle (Urtica dioica) extracts on insulin sensi-tivity and some inflammatory indicators in patients with type 2 diabetes: a randomized double-blind control trial. Pak J Biol Sci. 2011; 14(15): 775-779.
16. Ahangarpour A, Mohammadian M, Dianat M. Antidiabetic effect of hydroalcholic Urtica dioica leaf extract in male rats with fructose-induced insulin resistance. Iran J Med Sci. 2012; 37(3): 181-186.
17. Tahri A, Yamani S, Legssyer A, et al. Acute diuretic, natri-uretic and hypotensive effects of a continuous perfusion of aque-ous extract of Urtica dioica in the rat. J Ethnopharmacol. 2000; 73(1-2): 95-100. doi: 10.1016/S0378-8741(00)00270-1 18. Johnson TA, Sohn J, Inman WD, et al. Lipophilic stinging nettle extracts possess potent antiinflammatory activity, are not cytotoxic and may be superior to traditional tinctures for treating inflammatory disorders. Phytomedicine. 2013; 20: 143-147. doi: 10.1016/j.phymed.2012.09.016 19. Hughes RE, Ellery P, Harry T, et al. The dietary potential of the common nettle. J Sc of Food and Agric. 1980; 31(12): 1279-1286. doi: 10.1002/jsfa.2740311210

Diabetes Research
Open Journalhttp://dx.doi.org/10.17140/DROJ-1-120
Diabetes Res Open J
ISSN 2379-6391
Diabetes in the Northwest Territories
Charlotte Warren1, Heather Hannah2 and Kami Kandola3*
1Epidemiologist, Department of Health and Social Services, Government of Northwest Ter-ritories, NT X1A 2L9, Canada 2Territorial Epidemiologist, Department of Health and Social Services, Government of North-west Territories, NT X1A 2L9, Canada 3Deputy Chief Public Health Officer, Department of Health and Social Services, Government of Northwest Territories, NT X1A 2L9, Canada
Review*Corresponding authorKami Kandola, MD, MPH, CCFP, FCFP, DTM&H, ABPM Deputy Chief Public Health Officer Office of the Chief Public Health Officer Government of the Northwest Territories Department of Health and Social Services P.O. BOX 1320 CP 1320, 5015-49th StreetYellowknife, NT X1A 2L9, CanadaTel. (867) 767-9063 E-mail: [email protected]
Article HistoryReceived: October 30th, 2015 Accepted: November 23rd, 2015 Published: November 23rd, 2015
CitationWarren C, Hannah H, Kandola K. Diabetes in the northwest territories. Diabetes Res Open J. 2015; 1(5): 128-130. doi: 10.17140/DROJ-1-120
Copyright© 2015 Kandola K. This is an open access article distributed under the Creative Commons Attribution Li-cense, which permits unrestricted use, distribution, and reproduction in any medium, provided the origi-nal work is properly cited.
Volume 1 : Issue 5Article Ref. #: 1000DROJ1120
Page 128
INTRODUCTION
An estimated 2.7 million (7.6%) Canadians were living with diabetes in 2012.1 Inter-nationally, Canada has the fourth highest rate of diabetes, behind Mexico, the United States and Portugal.2 The prevalence of diabetes in Canada has doubled since 2000, and is expected to keep increasing.2 The Northwest Territories (NWT) is one of three territories located in the most Northern part of Canada. In the NWT, the prevalence of diabetes was estimated to be 5.5% in 2008/2009.3 Approximately 200 new cases of diabetes are diagnosed each year in the NWT, contributing to the increasing prevalence of diabetes across the territory.3 Aboriginal populations are at a disproportionately higher risk of developing diabetes, post adoption of a more Westernized culture.4 With 51% of NWT’s population of 43623 identifying as Aboriginal, coupled with an aging population, the burden of diabetes in the NWT is expected to increase in the coming years.5
TohelpcombattheanticipatedgrowthintheburdenofdiseaseintheNWT,specificscreening and diagnosis clinical practice guidelines for type 2 diabetes were developed in 2014 in consultation with the Canadian Diabetes Association (CDA).6 According to the guidelines, a diagnosis of diabetes is made if any one of three tests for diabetes has a positive result: Fast-ing Plasma Glucose (FPG), two hour 75 g Oral Glucose Tolerance Test (OGTT) and Glycated hemoglobin (A1C) (Table 1). Screening for diabetes is implemented based on risk for develop-ing diabetes, established from an NWT adapted Canadian Diabetes Risk Questionnaire (CAN-RISK) assessment.7 These adapted guidelines recommend annual screening starting at age 30 for those at high risk, every two years starting at age 30 for those at moderate risk, and every three years starting at age 40 for those at low risk.
In addition to the implementation of the 2014 NWT Type 2 Diabetes Screening Di-agnosis Clinical Practice Guidelines, a territory-wide diabetes registry has been legislated andwillmakediabetesanotifiablediseasetotheDepartmentofHealthandSocialServices(DHSS)beginningonJanuary1,2016.Forthisregistrytobeimplementedeffectively,accurateterritory-wide prevalence rates were needed. In the winter of 2015, a prevalence review for the previous three year period (2012-2014) was undertaken.
Test Result required for diagnosis
Fasting plasma glucose (FPG) >7.0 mmol/L
2-hour plasma glucose in 75 g oral glucose tolerance test (OGTT) >11.1 mmol/L
Glycated hemoglobin (A1C) >6.5%
Table 1: Required results for a diabetes diagnosis, based on NWT screening and diagnosis guidelines.

Diabetes Research
Open Journalhttp://dx.doi.org/10.17140/DROJ-1-120
Diabetes Res Open J
ISSN 2379-6391
Page 129
METHODS AND ANALYSIS
To ensure the highest capture rate of diabetes, both lab data and community level data were used. Lab data included all FPG, OGTT and A1C tests performed between 2012 and 2014. Community level data was obtained from a nurse in charge for smaller communities, a chronic disease management nurse for regional centers, and from the Electronic Medical Record (EMR) in communities where installed, for the 33 communities across theNWT.Specifically,nurses in thecommunityhealthcenters provided line lists of those living with diabetes in their community, whereas the EMR data extracts were used as the source of data for the 2 communities where it was installed. An individual was considered a case of diabetes if any one of the three lab tests was positive or if they were included on any of the community lists of individuals with diabetes. Due to the reliance on lab data, it was impossible to differentiate between type 1 and type 2 diabetes.
Data was analyzed using Statistical Package for the Social Sciences (SPSS) version 22 and Microsoft Excel 2010. Crude prevalence rates were calculated for the seven health au-thorities in the NWT as well as by age group. Age standardized prevalence rates were calculated for all other variables of in-terest using the 1991 Canadian Standard Population.8 Standard errorsand95%confidenceintervalswerecalculatedforallvari-ables.
RESULTS
The crude prevalence for 2014 was 6.7%. The age stan-dardized prevalence for 2014 was 7.5%. The average age of the 2908 prevalent cases in 2014 was 58 years, with a range of 4 to 95 years. The average age of female cases was 57 years whereas it was 59 years in males. The oldest age group, 65 and older, had the highest prevalence rate at 31.6%. Rates decreased accord-ingly with decreasing age, with the youngest age group, 0-24 years, having the lowest prevalence of 0.3%. The 55-64 year old group had a prevalence of 18.9%, 45-54 had 10.5%, 35-44 years had 4.5% and 25-34 years had a prevalence of 1.6%. Males had an age standardized prevalence rate of 8.0%, while females had a rate of 6.9%.
NWT communities were grouped into three categories to describe community types: Yellowknife City, Regional Cen-tres(HayRiver,FortSmith,andInuvik,populationsizerange:2536 to 3689), and Small Communities (all remaining NWT communities, population size range: 71 to 2039).Regional Cen-tres had the highest age standardized prevalence at 9.7%, fol-lowed by Yellowknife at 7.3% and Small Communities had the lowest prevalence at 6.2%.
Results were age standardized by specific ethnicity(Dene, Metis, Inuit and Non-Aboriginal). Metis people had the highest prevalence of diabetes at 10.12%, followed by Non-Ab-
original people at 7.8%, Dene people at 7.3% and Inuit people had the lowest prevalence at 5.3%. Non-Aboriginal males had the highest prevalence of diabetes at 9.2%, followed by Aborigi-nal females at 7.8%. Aboriginal males had a prevalence rate of 6.8% and Non-Aboriginal females had the lowest rate at 6.1%.
LIMITATIONS
While the data review provided accurate prevalence estimates, it is only a starting point for a territory wide diabetes registry. There were several limitations with the data and consid-erations in implementing the new diabetes registry. Firstly, there was no way to differentiate between Type 1, Type 2, or gesta-tional diabetes from the lab data. The prevalence rates presented represent all diabetes in the NWT and are not limited to Type 2 diabetes. Additionally, without a date of diagnosis, it was impos-sible to calculate incidence or evaluate trends in prevalence. The implementation of the diabetes registry will eliminate some ele-ments of this as diagnosis date will be made available.
While the combination of lab data and community level data provided a robust estimate of diabetes prevalence, it is still possible that cases of diabetes were missing from the data, es-pecially if they were never screened or tested or don’t have an NWT healthcare number (non-residents were excluded from the analysis). It is also possible that the threshold of any one positive test is too low, thereby falsely including identifying some non-diabetics as having diabetes. Finally, while the active resident list provided the most up to date community data, it is possible that the population in the NWT is highly mobile and therefore geographic distribution would be misrepresented in the data.
CONCLUSIONS
These results provide evidence of the high risk groups for targeting future diabetes programming, including prevention and management. The information from this prevalence review will be used to inform implementation of a territory wide dia-betes registry and help establish where diabetes programming could best focus across the NWT. Diabetes prevalence rates have been increasing nationally and this is also the case in the NWT. The new diabetes registry will allow us to further monitor screening compliance with the new guidelines and better deter-mine rates for pre-diabetes as well as incident diabetes cases. It will also allow further delineation of type of diabetes melli-tus(Type1,Type2,otherspecified,unspecified)asperICD10classification(E10-E14).Thestepsbeingtakenwillhelpbetterinform programs and services in order to reduce the burden of disease from diabetes in the NWT, reduce strain on the health care system and improve quality of life for those living with dia-betes.
CONFLICTS OF INTEREST
Theauthorsdeclarethattheyhavenoconflictsofinterest.

Diabetes Research
Open Journalhttp://dx.doi.org/10.17140/DROJ-1-120
Diabetes Res Open J
ISSN 2379-6391
Page 130
REFERENCES
1. Greiver M, Williamson T, Barber D, et al. Prevalence and epidemiology of diabetes in Canadian primary care practices: a report from the Canadian primary care sentinel surveillance network. Canadian Journal of Diabetes. 2014; 38(3): 179-185. doi: 10.1016/j.jcjd.2014.02.030
2. Canadian Diabetes Association. Diabetes: Canada at the tip-ping point-charting a new path. Available at: http://www.dia-betes.ca/CDA/media/documents/publications-and-newsletters/advocacy-reports/canada-at-the-tipping-point-english.pdf 2011; Accessed April, 2015.
3. Wong K. The epidemiology of diabetes in the northwest ter-ritories: a descriptive analysis. Epi North. 2012; 22(2). Available at: http://www.hss.gov.nt.ca/sites/default/files/epinorth_news-letter_dec_2012.pdf 2012; Accessed 2015.
4.YuCHY,ZinmanB.Type2diabetes and impairedglucosetolerance in aboriginal populations: a global perspective. Dia-betes Research and Clinical Practice. 2007; 78: 159-170. doi: 10.1016/j.diabres.2007.03.022
5.GovernmentofNorthwestTerritoriesHealthandSocialSer-vices. NWT health status report. Available at: http://www.hss.gov.nt.ca/sites/default/files/nwt_health_status_report.pdf 2011; Accessed April, 2015.
6. Northwest Territories Health and Social Sciences. NWTType 2 Diabetes Screening and Diagnosis Clinical Practice Guidelines. Available at: http://choosenwt.com/wp-content/uploads/2014/11/NWT-Type-2-Diabetes-Screening-Diagnosis-Clinical-Practice-Guidelines.pdf 2014; Accessed 2015.
7. Public HealthAgency of Canada. Canadian Diabetes RiskQuestionnaire. Available at: http://choosenwt.com/wp-content/uploads/2014/09/NWT-version-CANRISK-Canadian-Diabetes-Risk-Questionnaire.pdf 2011; Accessed 2015.
8. Statistics Canada. No Date. Appendix A: Canadian standardpopulation, 1991. Available at: http://www.statcan.gc.ca/pub/82-003-x/2013008/article/11857/tbl/appa-eng.htm 1991; Accessed2015.

Diabetes Research
Open Journalhttp://dx.doi.org/10.17140/DROJ-1-121
Diabetes Res Open J
ISSN 2379-6391
Clinical and Experimental Evidence of Hypoglycemic Neuropathy
Yung-Chu Hsu1,2, Hui-Lun Zhan3# and Chun-Pai Yang4,5#*
#These authors contributed equally
1Division of Neurology, Department of Internal Medicine, Ditmanson Medical Foundation Chia-Yi Christian Hospital, Chiayi, Taiwan 2Min-Hwei Junior College of Health Care Management, Tainan, Taiwan3Department of Radiology, Kuang Tien General Hospital, Taichung, Taiwan4Department of Neurology, Kuang Tien General Hospital, Taichung, Taiwan5Department of Nutrition, Huang-Kuang University, Taichung, Taiwan
Review*Corresponding authorChun-Pai Yang, MD Department of NeurologyKuang Tien General Hospital; Department of Nutrition Huang-Kuang UniversityTaichung, TaiwanTel. 886-4-2688-5599 Fax: 886-4-2688-8989E-mail: [email protected]
Article HistoryReceived: October 27th, 2015 Accepted: November 26th, 2015 Published: November 30th, 2015
CitationHsu Y-C, Zhan H-L, Yang C-P. Clini-cal and experimental evidence of hypoglycemic neuropathy. Diabetes Res Open J. 2015; 1(5): 131-135. doi: 10.17140/DROJ-1-121
Copyright© 2015 Yang C-P. This is an open access article distributed under the Creative Commons Attribution Li-cense, which permits unrestricted use, distribution, and reproduction in any medium, provided the origi-nal work is properly cited.
Volume 1 : Issue 5Article Ref. #: 1000DROJ1121
Page 131
ABSTRACT
When compared with the extensive research on hypoglycemic impacts on Central Nervous System (CNS) and cardiovascular system, the effects of hypoglycemia on the Periph-eral Nervous System (PNS) have not been investigated as thoroughly. Epidemiologic data and risk factors for hypoglycemic neuropathy are still lacking. Interestingly, hyperglycemia mainly results in the damage of sensory and autonomic nerve fibers, whereas hypoglycemia predomi-nantly leads to the development of motor neuropathy. Most clinical features are concluded from patients with insulinoma, and neuropathology has shown axonal degeneration in large myelin-ated fibers. Experimental animal models support the clinical and histopathological findings. The exact pathophysiological mechanisms of hypoglycemic neuropathy remain elusive. The influence of hypoglycemia on peripheral nervous system warrants further investigations.
KEYWORDS: Hypoglycemic neuropathy; Hypoglycemia; Peripheral nervous system.
ABBREVIATIONS: CNS: Central Nervous System; PNS: Peripheral Nervous System; NCV: Nerve Conduction Velocity; IIH: Insulin-Induced Hypoglycemia; DPN: Diabetic Peripheral Neuropathy; DM: Diabetes Mellitus; HbA1c or A1C: Glycated hemoglobin; LDL-cholesterol: Low-Density Lipoprotein-cholesterol; HDL-cholesterol High-Density Lipoprotein-cholesterol.
INTRODUCTION
Hypoglycemia is a condition primarily affecting diabetic patients treated under exces-sive medication, such as insulin or other hypoglycemic agents.1-3 Other causes of hypoglycemia include insulinoma, poor intake, infections, liver, and kidney diseases.1-3
The incidence of hypoglycemia varies considerably among studies by means of us-ing different biochemical criteria to define an event.4,5 The symptoms of hypoglycemia vary between individuals. Neurogenic (autonomic) symptoms include tremor, palpitations, hunger, and cold sweating. Neuroglycopenic symptoms often include behavioral changes, confusion, seizure, coma, and death.4 Compared to the abundant and extensive data on hypoglycemia ef-fects on the Central Nervous System (CNS) and cardiovascular system, there is little evidence in humans and experimental animal studies toward hypoglycemic effects on the Peripheral Nervous System (PNS).6,7
Diabetic Peripheral Neuropathy (DPN) is the commonly reported vascular complica-tion affecting as many as 50% of patients with Type 1 and Type 2 Diabetes Mellitus (DM).4,5,8 The
Diabetes Research
Open Journalhttp://dx.doi.org/10.17140/DROJ-1-121
Diabetes Res Open J
ISSN 2379-6391
Page 132
common risk factors for DPN include diabetic duration, Glycat-ed hemoglobin (HbA1c or A1C).9 Recently, cardiovascular risk factors, such as elevated blood pressure, hyper-triglyceridemia, Low High-Density Lipoprotein-cholesterol (HDL-cholesterol), High Low-Density Lipoprotein-cholesterol (LDL-cholesterol), and decreased estimated glomerular filtration rate also appear to be related to newly diagnosed Diabetic Peripheral Neuropathy (DPN) in type 2 DM independent of HbA1c.9-12 Moreover, with diverse patterns of DPN in diabetes, it is possible that the de-velopment of DPN is not only influenced by hyperglycemia but by other factors, such as hypoglycemia, as well. Therefore, it is important to identify the role that hypoglycemia plays in DPN. In this article, we first introduce the clinical characteristics of hypoglycemic neuropathy. Then, we provide the evidence from animal studies. After which, we discuss the key issues of patho-genesis. Lastly, key points regarding hypoglycemic neuropathy are summarized in the conclusion.
CLINICAL EVIDENCE OF HYPOGLYCEMIC NEUROPATHY
There are very few reports on the effects of hypogly-cemia on the human PNS. In 1946, Silfverskiöld reported hy-poglycemia related motor symptoms in insulinoma patients.13 In 1956, Mulder, et al. presented similar cases and proposed the motor symptoms may be related to neuritis by abnormal high insulin levels.14 Afterwards, more and more patients with insu-linoma were reported.15-19 In 1982, Jaspan, et al. reported a case and reviewed previously reported twenty-eight cases with insuli-noma and frequent hypoglycemia.20 The average age of the cases was 38 year old with a mild male predominance. The most typi-cal presentation started with obvious distal paraesthesia with or without significant sensory loss, followed by motor-predominant distal symmetric peripheral neuropathy with obvious muscle at-rophy. Unlike the usual pattern of diabetic polyneuropathy, the upper extremities are generally more involved than the lower ones, but foot drop can occur frequently. Moreover, neuropsy-chiatric symptoms with fluctuated or episodic confusion were easily noted. The onset and course of neuropathy varied. Most patients ran sub-acute or chronic polyneuropathy pattern in 3-6 months. Some patients got acute polyneuropathy after coma re-covery. But these patients also experienced many hypoglycemia episodes before.20 Thus, whether severe hypoglycemia alone is sufficient to lead to polyneuropathy was still questionable. After removal of the insulinomas, sensory symptoms tend to regress greatly but definite improvement in motor weakness was uncom-mon.13-20 Nerve Conduction Velocity (NCV) study showed distal symmetric predominantly axonal motor neuropathy from most of their reports.13-20 There was also electromyographic evidence for denervation of skeletal muscles.15,16 Normal cerebrospinal fluid protein suggested peripheral axonal injury rather than dor-sal root ganglion involvement.10-12 With respect to neuropathol-ogy, axonal degeneration in large myelinated fibers and neuro-genic atrophy in muscle had been shown in peripheral nerves of insulinoma patients.21-23
In contrast, other researchers revealed that insulinoma
related hypoglycemia neuropathy affected both motor and sen-sory fibers or mainly the sensory symptoms in mice and hu-mans.19,24 This is the same situation of diverse presentations of neuropathy in diabetic patients. Some diabetic patients show mainly sensory disturbances and/or autonomic dysfunctions, others show mixed sensorimotor symptoms or motor problems predominant. It is possible that some of the clinical findings are not exclusively the consequence of hypoglycemia but also in combination of hyperglycemia and hypoglycemia states.12
Hypoglycemic effect may contribute to the diverse pattern of diabetic peripheral neuropathy in humans. Further studies are needed to investigate the co-existence effects of hypoglycemia in diabetic neuropathy.
EVIDENCE FROM ANIMAL STUDY
Investigators have used various experimental animal models, such as healthy and diabetic rats or mice to elucidate hypoglycemic neuropathy.10-12 Normal and diabetic rats under-went experimental hypoglycemia with excessive insulin injec-tion exhibit either abnormal NCV or nerve structure change with a combination of Wallerian-type axonal de-and regeneration.25-27
The pathological change indicates that hypoglycemia affects the neuron rather than the Schwann cell and the axonal degeneration affects large myelinated fibers preferentially.28-30 Furthermore, motor axons are more severely damaged than sensory axons in the peripheral nerve trunks.28-30 Both the duration and the sever-ity of the hypoglycemia can influence the occurrence of neurop-athy.29,30 These findings of animal studies are highly compatible with hypoglycemic neuropathy reported by Jaspan.20
When looking at the rats, pathological changes of hy-poglycemic neuropathy at the nerve trunk level are much more obvious than at the spinal root level, including ventral horn and dorsal root ganglion.26-31 This discovery is again compatible with cerebrospinal fluid and pathologic results in human beings.10-12
The investigators also studied the Insulin-Induced Hy-poglycemia (IIH) effects on non-diabetic and diabetic rats by analysis of tibial nerves. They demonstrated that the Wallerian-type axonal degeneration happens only in treated diabetic rats, especially more severe in the daily insulin injection group. Other investigators studied hyperglycemic rats, and selectively gave them either small or high doses of insulin to the point of hypo-glycemia, or just left them remained hyperglycemic state with-out insulin.32 In the hypoglycemic rats, loss of large myelinated fibers and decreased NCVs were noted, while the other groups had mainly sensory fiber abnormalities.32,33
PATHOGENESIS OF HYPOGLYCEMIA NEUROPATHY
IIH is one of the most common forms of hypoglyce-mia in diabetes. Thus, it is also the most frequently aroused re-search interest to explain the pathophysiology of hypoglpycemic neuropathy.11,12 In addition, histopathological findings induced by IIH are similar to those findings in cases of hypoglycemic

Diabetes Research
Open Journalhttp://dx.doi.org/10.17140/DROJ-1-121
Diabetes Res Open J
ISSN 2379-6391
Page 133
agents, other than insulin or insulinoma, in human.10,12 It indi-cates that pathogenesis of hypoglycemia neuropathy induced by IIH does not represent a species-specific effect.10-12 We highlight the key issues herein, and more detailed descriptions of patho-genesis of hypoglycemia neuropathy induced by IIH have been described elsewhere in another review article.12
Mechanisms Involved in the Pathogenesis are Complex and Multifactorial
Because hypoglycemia is involved, energy depletion appears to be a likely mechanism in IIH induced hypoglyce-mia neuropathy; however, other mechanisms such as ischemia, might also play an important role as well.10-12
The depletion of energy within neurons may result in altered intraneural concentrations of various metabolites and lead to axonal degeneration seen during IIH.12 Furthermore, neu-ron axons and Schwann cells are not only physical neighbours but also influence and support each other.34,35 Hence, the myelin breakdown seen on Schwann cells during IIH may be caused directly by ATP depletion or caused indirectly by ATP depletion in neurons.10-12 Local ischemia caused by decreased nerve blood flow leads to local hypoxia, which may result in axonal degen-eration and myelin breakdown.36,37 This phenomenon caused by ischemia change corresponds with energy deprivation as the cause of the changes in IIH related neuropathy.12,34
However, it is somewhat difficult at present to explain
why large diameter myelinated motor fibers are particular vul-nerable to IIH only based on mechanisms of energy deprivation or nerve ischemia.12 If energy deprivation or nerve ischemia is the only mechanism involved in pathogenesis, it may be expect-ed that small myelinated axons, which have higher per-volume metabolic rates than large myelinated axons, are more suscep-tible to oxygen deprivation or ischemia.12,35 Since the opposite appears to be true, it is reasonable to hypothesize that the un-derlying mechanism involved in the pathogenesis of IIH related hypoglycemic neuropathy is complex and multifactorial.
Hypoglycemia Or Hyperinsulinemia is the Main Cause of PNS Changes
Previous studies have considered insulin to be a major cause in PNS images.26-31 However, growing evidence suggests that insulin is beneficial for PNS function and serves as a pro-motor of axonal regeneration after injuries.10-12 On the contrary, hypoglycemia during normal insulin levels causes axonal degen-eration in the PNS.12 Thus, the present available data seems to support that hypoglycemia, not hyperinsulinaemia, plays a more important role in IIH peripheral neuropathy.10-12 It raises the question of whether hypoglycemia rather than hyperinsulinae-mia or a combination of the two is the main cause of peripheral nerve injury. Further studies are needed to clarify this important issue.
In conclusion, the mechanisms involved in the patho-
genesis remain poorly understood. Deeper understanding in pathogenesis from basic research is needed.
CONCLUSION
Clinical observational studies in human suggest that large myelinated motor fibers appear to be vulnerable to hypo-glycemia. This is different from the common pattern of diabetic polyneuropathy with predominant sensory and autonomic neu-ropathy. Experimental animal models confirm the clinical ob-servations. Future studies are needed to investigate the effects of frequency, severity and duration of hypoglycemia events on the progression, and the outcomes of hypoglycemic neuropathy in clinical setting. More experimental studies are also needed to provide mechanistic insights into the pathophysiology of hypo-glycemic effects toward PNS.
CONFLICTS OF INTEREST
The authors declare that they have no conflicts of interest.
DISCLOSURES
All authors report no disclosures.
REFERENCE
1. Cryer PE, Davis SN, Shamoon H. Hypoglycemia in dia-betes diabetes care. 2003; 26: 1902-1912. doi: 10.2337/dia-care.26.6.1902
2. Shafiee G1, Mohajeri-Tehrani M, Pajouhi M, et al. The im-portance of hypoglycemia in diabetic patients. J Diabetes Metab Disord. 2012; 11(1): 17-24. doi: 10.1186/2251-6581-11-17
3. Workgroup on Hypoglycemia, American Diabetes Associa-tion. Defining and reporting hypoglycemia in diabetes: a report from the American Diabetes Association workgroup on hypo-glycemia. Diabetes Care. 2005; 28: 1245-1249. doi: 10.2337/diacare.28.5.1245
4. American Diabetes Association. Standard of medical care in diabetes-2015. Diabetes Care. 2015; 38(1): S1-S2. doi: 10.2337/dc15-S001
5. Gabriely I, Shamoon H. Hypoglycemia in diabetes: common, often unrecognized. Cleve Clin J Med. 2004; 71: 335-342.
6. Zoungas S, Patel A, Chalmers J, et al. Severe hypoglycemia and risks of vascular events and death. N Engl J Med. 2010; 363: 1410-1418. doi: 10.1056/NEJMoa1003795
7. Hanefeld M, Duetting E, Bramlage P. Cardiac implications of hypoglycaemia in patients with diabetes: a systematic re-view. Cardiovascular Diabetology. 2013; 12: 135-146. doi: 10.1186/1475-2840-12-135
Diabetes Research
Open Journalhttp://dx.doi.org/10.17140/DROJ-1-121
Diabetes Res Open J
ISSN 2379-6391
8. Lin KYH, Huang KJ, Yang CP. Glycemic variability: clinical and prognostic significance. Diabetes Res Open J. 2015; 1: 48-53. doi: 10.17140/DROJ-1-108
9. Yang CP, Lin CC, Li CI, et al. Cardiovascular risk factors increase the risks of diabetic peripheral neuropathy in patients with type 2 diabetes mellitus. Medicine (Baltimore). 2015; 94: e1783. doi: 10.1097/MD.0000000000001783 10. Mohseni S. Hypoglycemic neuropathy. Acta Neuropathol. 2001; 102: 413-421.
11. Mohseni S. Neurologic damage in hypoglycemia. Handb Clin Neurol. 2014; 126: 513-532.
12. Jensen VF, Mølck AM, Bøgh IB, et al. Effect of insulin-in-duced hypoglycaemia on the peripheral nervous system: focus on adaptive mechanisms, pathogenesis and histopathological changes. J Neuroendocrinol. 2014; 26: 482-496. doi: 10.1111/jne.12170 13. Silfverskiöld BP. Polyneuritis hypoglycemica. Late periph-eral paresis after hypoglycemic attacks in two insulinoma pa-tients. Acta Med Scand. 1946; 125: 502-504.
14. Mulder DW, Bastron JA, Lambert EH. Hyperinsulin neu-ronopathy. Neurology. 1956; 6: 627-635. doi: 10. 1212/ WNL. 6. 9. 627 15. Harrison MJG Muscle wasting after prolonged hypoglyce-mic coma: case report with electrophysiological data. J Neurol Neurosurg Psychiatry. 1976; 39: 465-470.
16. Williams CJ. Amyotrophy due to hypoglycemia. Br Med J. 1955; 1: 707-708.
17. Tom MI, Richardson JC. Hypoglycemia from islet celltu-mor of pancreas with amyotrophy and cerebrospinal nervecell changes. J Neuropathol Exp Neurol. 1951; 10: 57-66.
18. Jayasinghe KS, Nimalasuriya A, Dharmadasa K. A case of insulinoma with peripheral neuropathy. Postgrad Med J. 1983; 59: 189-190.
19. Tintore M, Montalban J, Cervera C, et al. Peripheral neu-ropathy in association with insulinoma: clinical features and neuropathology of a new case. J Neurol Neurosurg Psychiatry. 1994; 57: 1009-1010.
20. Jaspan JB, Wollman RL, Bernstein L, et al. Hypoglycemic peripheral neuropathy in association with insulinoma: implica-tion of glucopenia rather than hyperinsulinism. Medicine (Balti-more). 1982; 61: 33–44.
21. Tamburrano G, Locuratolo N, Pozzessere G, et al. Changes in central and peripheral nervous system function during hypo-
glycemia in man: an electro-physiological quantification. J En-docrinol Invest. 1992; 15: 279-282. doi: 10.1007/BF03348728 22. Heckmann JG, Dietrich W, Hohenberger W, et al. Hy-poglycemic sensorimotor polyneuropathy associated with insulinoma. Muscle Nerve. 2000; 23: 1891-1894. doi: 10.1002/1097-4598(200012)23:12<1891::AID-MUS17>3.0. CO;2-Y 23. Striano S, Striano P, Manganelli F, et al. Distal hypoglycemic neuropathy. An insulinoma-associated case, misdiagnosed as temporal lobe epilepsy. Neurophysiol Clin. 2003; 33: 223-227. doi: 10.1016/j.neucli.2003.08.001 24. Brown AM, Evans RD, Black J, et al. Schwann cell glyco-gen selectively supports myelinated axon function. Ann Neurol. 2012; 3: 406-418.
25. Mohseni S, Hildebrand C. Neuropathy in diabetic BB/W or rats treated with insulin implants. Acta Neuropathol. 1998; 96: 144-150.
26. Potter CG, Sharma AK, Farber MO, et al. Hypoglycemic neuropathy in experimental diabetes. J Neurol Sci. 1988; 88: 293-301. doi: 10.1016/0022-510X(88)90226-2 27. Sidenius P, Jakobsen J. Peripheral neuropathy in rats induced by insulin treatment. Diabetes. 1983; 32: 383-386. doi: 10.2337/diab.32.4.383 28. Sima AAF, Zhang WX, Greene DA. Diabetic and hypogly-cemic neuropathy-a comparison in the BB rat. Diabetes Res Clin Pract. 1989; 6: 279-296.
29. Yasaki S, Dyck PJ. Duration and severity of hypoglycemia needed to induce neuropathy. Brain Res. 1990; 531: 8-15. doi: 10.1016/0006-8993(90)90752-W 30. Yasaki S, Dyck PJ. Spatial distribution of fiber degeneration in acute hypoglycemic neuropathy in rat. J Neuropath Exp Neu-rol. 1991; 50: 681-692.
31. Mohseni S. Hypoglycemic neuropathy in diabetic BB/W or rats treated with insulin implants affects ventral root axons but not dorsal root axons. Acta Neuropathol. 2000; 100: 415-420. doi: 10.1007/s004010000204 32. Sima AA, Zhang WX, Greene DA. Diabetic and hypoglyce-mic neuropathy-a comparison in the BB rat. Diabetes Res Clin Pract. 1989; 6: 279-296. doi: 10.1016/0168-8227(89)90068-5 33. Westfall SG, Felten DL, Mandelbaum JA, et al. Degenera-tive neuropathy in insulin-treated diabeticrats. J Neurol Sci. 1983; 61: 93-107. doi: 10.1016/0022-510X(83)90057-6 34. Ohshima J, Nukada H. Hypoglycaemic neuropathy: micro-
Page 134
Diabetes Research
Open Journalhttp://dx.doi.org/10.17140/DROJ-1-121
Diabetes Res Open J
ISSN 2379-6391
vascular changes due to recurrent hypoglycaemic episodes in rat sciatic nerve. Brain Res. 2002; 1: 84-89. doi: 10.1016/S0006-8993(02)02910-4 35. Corfas G, Velardez M, Ko C, et al. Mechanisms and roles of axon-Schwann cell interactions. J Neurosci. 2004; 42: 9250-9260. doi: 10. 1523/ JNEUROSCI. 3649-04. 2004 36. Low P, Yao J, Kishi Y, et al. Peripheral nerve energy metabolism in experimental diabetic neuropathy. Neuro-sci Res Commun. 1997; 1: 49-56. doi: 10.1002/(SICI)1520-6769(199707)21:1<49::AID-NRC207>3.0.CO;2-T 37. Low P, Lagerlund T, McManis P. Nerve blood-flow and oxygen delivery in normal, diabetic, and ischemic neuropathy. Int Rev Neurobiol. 1989; 31: 355-438. doi: 10.1016/S0074-7742(08)60283-4
Page 135
Diabetes Research
Open Journalhttp://dx.doi.org/10.17140/DROJ-1-122
Diabetes Res Open J
ISSN 2379-6391
Changes of Fat Volume and Adipocytokines by the Randomized Intervention Program for Obesity Control Program (SCOP)
Nobuhisa Kawashima1,2, Shaw Watanabe3*, Akemi Morita2, Naomi Aiba4, Motohiko Miya-chi5, Tohru Sakai1 for Saku Control Obesity Program (SCOP) Study Group
1Department of Public Health and Applied Nutrition, The University of Tokushima Graduate School, Tokushima, Japan2Department of Nutrition, College of Nutrition, Koshien University, Hyogo, Japan3Life Science Promoting Association, Tokyo, Japan4Department of Nutrition and Life Science, Kanagawa Institute of Technology, Kanagawa, Japan5National Institute of Health and Nutrition, Tokyo, Japan
Research *Corresponding authorShaw Watanabe, MD, PhD PresidentLife Science Promoting Association25-3-1004, Daikyocho, Shinkuju, Tokyo 160-0015, Japan E-mail: [email protected]
Article HistoryReceived: December 22nd, 2015 Accepted: January 28th, 2016 Published: January 28th, 2016
CitationKawashima N, Watanabe S, Mori-ta A, Aiba N, Miyachi M, Sakai T. Changes of fat volume and adipocy-tokines by the randomized interven-tion program for obesity control pro-gram (SCOP). Diabetes Res Open J. 2015; 1(5): 136-146. doi: 10.17140/DROJ-1-122
Copyright© 2016 Watanabe S. This is an open access article distributed under the Creative Commons At-tribution License, which permits unrestricted use, distribution, and reproduction in any medium, pro-vided the original work is properly cited.
Volume 1 : Issue 5Article Ref. #: 1000DROJ1122
Page 136
ABSTRACT
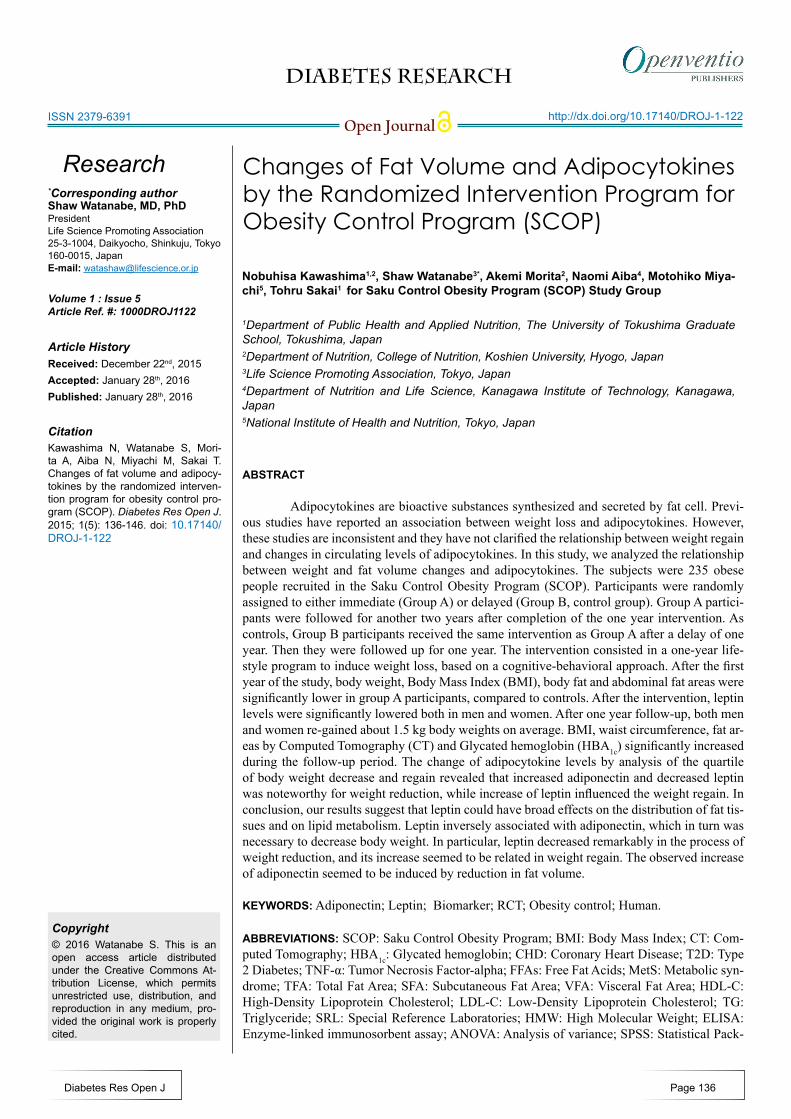
Adipocytokines are bioactive substances synthesized and secreted by fat cell. Previ-ous studies have reported an association between weight loss and adipocytokines. However, these studies are inconsistent and they have not clarified the relationship between weight regain and changes in circulating levels of adipocytokines. In this study, we analyzed the relationship between weight and fat volume changes and adipocytokines. The subjects were 235 obese people recruited in the Saku Control Obesity Program (SCOP). Participants were randomly assigned to either immediate (Group A) or delayed (Group B, control group). Group A partici-pants were followed for another two years after completion of the one year intervention. As controls, Group B participants received the same intervention as Group A after a delay of one year. Then they were followed up for one year. The intervention consisted in a one-year life-style program to induce weight loss, based on a cognitive-behavioral approach. After the first year of the study, body weight, Body Mass Index (BMI), body fat and abdominal fat areas were significantly lower in group A participants, compared to controls. After the intervention, leptin levels were significantly lowered both in men and women. After one year follow-up, both men and women re-gained about 1.5 kg body weights on average. BMI, waist circumference, fat ar-eas by Computed Tomography (CT) and Glycated hemoglobin (HBA1c) significantly increased during the follow-up period. The change of adipocytokine levels by analysis of the quartile of body weight decrease and regain revealed that increased adiponectin and decreased leptin was noteworthy for weight reduction, while increase of leptin influenced the weight regain. In conclusion, our results suggest that leptin could have broad effects on the distribution of fat tis-sues and on lipid metabolism. Leptin inversely associated with adiponectin, which in turn was necessary to decrease body weight. In particular, leptin decreased remarkably in the process of weight reduction, and its increase seemed to be related in weight regain. The observed increase of adiponectin seemed to be induced by reduction in fat volume.
KEYWORDS: Adiponectin; Leptin; Biomarker; RCT; Obesity control; Human.
ABBREVIATIONS: SCOP: Saku Control Obesity Program; BMI: Body Mass Index; CT: Com-puted Tomography; HBA1c: Glycated hemoglobin; CHD: Coronary Heart Disease; T2D: Type 2 Diabetes; TNF-α: Tumor Necrosis Factor-alpha; FFAs: Free Fat Acids; MetS: Metabolic syn-drome; TFA: Total Fat Area; SFA: Subcutaneous Fat Area; VFA: Visceral Fat Area; HDL-C: High-Density Lipoprotein Cholesterol; LDL-C: Low-Density Lipoprotein Cholesterol; TG: Triglyceride; SRL: Special Reference Laboratories; HMW: High Molecular Weight; ELISA: Enzyme-linked immunosorbent assay; ANOVA: Analysis of variance; SPSS: Statistical Pack-

Diabetes Research
Open Journalhttp://dx.doi.org/10.17140/DROJ-1-122
Diabetes Res Open J
ISSN 2379-6391
Page 137
age for the Social Science; CRP: C-reactive protein; RCT: Ran-domised Controlled Trial; SBP: Systolic Blood Pressure; DBP: Diastolic Blood Pressure; FFA: Free Fatty Acid; AMPK: AMP-activated protein kinase.
INTRODUCTION
Overweight and obese individuals are at a greater risk for developing Coronary Heart Disease (CHD), Type 2 Diabetes (T2D), and certain type of cancer compared with their normal-weight counterparts.1,2 Weight loss can reduce these risks, but weight maintenance after weight loss is difficult to achieve.3-5
Adipose tissue has been considered to be the energy storage tissue, but recent studies have shown that fat cells synthe-size and secrete various bioactive substances called adipocyto-kines, such as leptin, adiponectin, Tumor Necrosis Factor-alpha (TNF-α), Free Fat Acids (FFAs), resistin and angiotensinogen.6 Most of the studies on adipocyte-derived cytokines have so far focused on the two adipocytokines, adiponectin and leptin, be-cause of their role in the regulation of the metabolic homeosta-sis.7-9
Adiponectin is associated with insulin sensitivity and atherosclerosis. Despite the fact that adiponectin is secreted by the adipose tissue, plasma levels are lower in individuals with obesity, insulin resistance and T2D.10-12
Leptin inhibits food intake, stimulates energy expendi-ture, and regulating immune function.13 In humans, serum leptin levels are positively correlated with obesity, T2D, hypertension and Metabolic syndrome (MetS).14,15 Therefore, it is generally considered that obese people are associated with a state of resis-tance to the effects of leptin.16,17
Thus, adiponectin and leptin play an important role on obesity and metabolic disorders. Previous studies have reported an association between weight loss and adipocytokines.18 How-ever, these studies are inconsistent and they have not clarified the relationship between weight regain and changes of adipocy-tokines.19-21 For example, Ambeba et al19 conducted a 24-month weight loss trial and reported that adiponectin increased with weight reduction and decreased with weight regain. On the other hand, Bluher et al20 reported continued increase in adiponectin levels with both weight loss and weight regain. They also re-ported that leptin levels decreased with weight reduction and in-creased with weight regain. In addition, Crujeiras et al21 reported that leptin continued to decrease throughout weight reduction and regain. Using the effective intervention program for obesity control developed by our group, a nested randomized interven-tion trial in human dock examinees was designed to evaluate the multiple metabolic changes and factors involved in weight reduction. Plasma levels of adiponectin, leptin and other bio-markers could be analyzed in relationship with the body weight reduction and changes in fat volume.
SUBJECTS AND METHODS
Study Subjects
This study was performed as part of the Saku Con-trol Obesity Program (SCOP). The outline of SCOP has been described previously.22 The SCOP study protocol initially in-cluded 235 Japanese obese subjects (116 men and 119 wom-en) recruited from the database of medical checkup record of Saku Central Hospital Human Dock Center, Nagano, Japan. The study participants had medical checkups since 2000 and were aged 40-64 years old, with a body mass index (Body Mass Index (BMI): kg/m2)) greater than 28.3 (the upper 5 percentile of all examinees). They were asked to participate in an intervention program for weight control, i.e. SCOP. Exclusion criteria were: psychiatric disease; physical conditions (i.e., morbid hepatic or renal dysfunction; cardiovascular disease such as heart failure, stroke, and transient ischemic attacks); patients who were under treatment for obesity or any treatment known to affect eating or weight. Participants were randomly assigned to either immedi-ate (Group A) or delayed intervention (Group B, control group). After guidance with written and oral information, including the purpose of the study, assurance of refusal, and confidentiality of personal information, written informed consent was obtained from all participants. The study protocol was approved by the Ethics Committee of the National Institute of Health and Nutri-tion.
Study Design
Participants were given a one-year lifestyle interven-tion program for weight loss, based on a cognitive-behavioral approach.23-32 The program was conducted at the Saku Central Hospital Human Dock Center from July, 2006. The participants received individual counseling (30 minutes) from a registered dietician, and group sessions about effective physical activity (20 minutes) by exercise instructors. Body composition param-eters were measured at baseline and at 1, 3, 6 and 9 months. The integrative interventions have been reported in detail previ-ously.23-32 Group A participants were followed for two years after one year intervention, without any period. Clinical and biologi-cal parameters were assessed at baseline (0 month), after the end of intervention (12 month) and during the follow-up (24 month) (Figure 1).
As controls, Group B participants received the same in-tervention as Group A after a delay of one year. Then they were followed up for one year. They received precise health check-up at 0 month, 12 month, 24 month and 36 month in the same way as Group A participants (Figure 1).
The height and weight of the subjects were measured with an automatic scale (Tanita, BF-220, Tokyo, Japan). Their BMI was calculated as weight in kilograms divided by height in meters squared. Waist circumference was measured twice at the umbilicus level while the subject was in a standing position,

Diabetes Research
Open Journalhttp://dx.doi.org/10.17140/DROJ-1-122
Diabetes Res Open J
ISSN 2379-6391
Page 138
using a fiberglass measuring tape. The average measurement was used for the analysis. Blood pressure was measured while the subject was in a sitting position using a validated automated blood pressure monitor (ES-H55; Terumo, Tokyo, Japan). Total fat areas were assessed by a computed tomography scan at the level of the umbilicus, with the subjects in the supine position. The Total Fat Area (TFA), Subcutaneous Fat Area (SFA) and Visceral Fat Area (VFA) were calculated using commercially available software (Fat Scan; N2 System Corp, Osaka, Japan). Following an overnight fast, blood samples were collected at the time of each health checkup at the Saku Human Dock Center. High-Density Lipoprotein Cholesterol (HDL-C), Low-Density Lipoprotein Cholesterol (LDL-C), Triglyceride (TG), HbA1c and other blood and biochemical values were analyzed at the clinical laboratory of the Saku Central Hospital.
Adipocytokines (adiponectin, leptin, TNF-α, FFA) were measured using laboratory testing services provided by Special Reference Laboratories (SRL) Inc. (Tokyo, Japan). The High Molecular Weight (HMW) form of adiponectin (μg/mL) was measured by Enzyme-linked immunosorbent assay (ELISA) with a detection limit of 0.18 µg/mL. Leptin (ng/mL) was measured by a radioimmunoassay (Human Leptin RIA Kit, LINCO Research, St. Charles, MO, USA) with a sensitivity of 0.5 ng/mL.
Prevalence of metabolic abnormality, hypertension, dyslipidemia and diabetes mellitus, was determined according to Japanese diagnostic criteria for metabolic syndrome. The cut-off values defining metabolic abnormalities were established at 130/85 mmHg for high blood pressure; ≥150 mg/dL triglyceride and/or <40 mg/dL HDL cholesterol for dyslipidemia; and 110 mg/dL for high blood glucose; or patients being treated for hy-pertension, dyslipidemia, and/or diabetes .
Data Analysis
Statistical analysis was focused on the effect of inter-vention by Randomised Controlled Trial (RCT) design so that we compared Group A as intervention group and Group B as control group. Furthermore, we analyzed degree of rebound af-ter intervention by combined group A and B data (Group A+B). Data are presented as mean±SD. Adipocytokines and C-reactive protein (CRP) were log-transformed to fit normality or linearity assumption for statistical analysis. The serum level of adipocy-
tokines and CRP are presented the median and range (25 per-centile and 75 percentile). Independent sample t-test was used to compare intervention group and control group in baseline and 1 year later. Spearman correlations were used to test the asso-ciations between body composition and blood data. In Group A+B, paired t-test was used to compare end point of intervention and follow-up. Weight reduction was calculated as the differ-ence between before and after the intervention. Weight regain was calculated as the difference during follow-up period. Weight reduction and regain values are separated quartile groups, re-spectively. The significance of differences among that quartile were analyzed with one-way Analysis of variance (ANOVA) followed by Bonferroni and Games-Howell post hoc test. Statis-tical analysis was performed by Statistical Package for the So-cial Sciences (SPSS) version 20.0 software (SPSS Inc., Chicago, IL, USA).
Results
Effect of the Intervention by RCT
Baseline characteristics for men and women are dis-played in Table 1. The mean age of the study population was 53.8 years for men and 54.7 years for women. BMI was 30.2±3.1 kg/m2 for men and 31.0±3.0 kg/m2 for women, the waist circumfer-ence was 100.0±6.5 cm and 103.2±8.1 cm, and the visceral fat area was 157±48 cm2 and 129±47 cm2 (mean±SD) (Table 1).
After one year of intervention we observed a 5% body weight reduction (6.1 kg in men and 4.0 kg in women in av-erage) in 51% participants, 10% reduction in about one fourth participants. The changes of body weight, BMI, fat% in body composition, waist circumference, fat area by CT, and selected biochemical data by group are shown in Table 2. After the in-tervention, body weight, BMI, body fat and abdominal fat areas were significantly less than those of controls.
Adipocytokines, lipid, glucose and HbA1c levels of in-tervention and control groups are shown in Table 3. Leptin was significantly lowered than control in both men and women after the intervention. Systolic Blood Pressure (SBP) and Diastolic Blood Pressure (DBP) improved after the intervention. Only in women, TNF-α was significantly increased by intervention (Table 3).
Figure 1: Study design.

Diabetes Research
Open Journalhttp://dx.doi.org/10.17140/DROJ-1-122
Diabetes Res Open J
ISSN 2379-6391
Page 139
At baseline health examination revealed the prevalence of dyslipidemia was 64.3% and 40.4% in men and women, high blood pressure was 69.6% and 67.3%, and high blood glucose was 35.7% and 38.5%. The prevalence were improved 19% in both sex in dyslipidemia, 21% and 11% in men and women in high blood pressure, 5% and 30% in high blood glucose, respec-tively.
Effect of Intervention with Group A+B
Effect of intervention in fat tissues and adipocytokines: BMI and fat area usually showed good correlations in both males and females (Table 4). TG correlated with visceral fat and Free Fatty Acid (FFA). After the intervention TG showed strong positively correlation with leptin and negatively correlation with adiponec-tin than before the intervention, except for adiponectin in women. Adiponectin and leptin inversely correlated only in men. Leptin was widely interrelated among BMI and various fat areas, but
not with TG, FFA and HbA1c in women before the intervention and FFA and HbA1c after the intervention. In men leptin and TG was significantly correlated. TNF-α correlated with visceral fat, TG, FFA, leptin, and HbA1c in women before the intervention, but after the intervention only TG and HbA1c remained. In men TNF-α did not show any association with the above variables.
The change of weight, adiponectin and leptin between before and after the intervention is shown by the quartile of body weight reduction (Figure 2). Leptin decrease and increase of adi-ponectin was noticed in upper quartile of body weight reduction by intervention both men and women.
Weight regain during follow-up period: Weight, BMI, waist cir-cumference, HBA1c, TFA and VFA were significantly increased at the end of follow-up in Group A+B analysis. Both men and women gained about 1.5 kg body weight gain on average. How-ever, these the end of follow-up values remained significantly
Table 1: Baseline data of the participants.
n unit 116 119
Age years 53.8±6.5 54.7±6.4
Height cm 168.4±6 155.1±5.7
Weight kg 85.7±10.4 74.8±9.4
BMI kg/m2 30.2±3.1 31.0±3.0
Waist circumference cm 100.0±6.5 103.2±8.1
Body fat % 28.8±4.1 40.7±5.4
Total fat area cm2 404±111 468±111
Sq fat area cm2 247±91 339±90
Vis fat area cm2 157±48 129±47
Total cholesterole mg/dl 204±29 217±39
HDL-cholesterole mg/dl 50±10 56±12
LDL-cholesterole mg/dl 121±28 131±33
Triglyceride mg/dl 171±120 151±81
FFA mEq/L 0.5±0.2 0.6±0.2
TNF-α pg/ml 1.1(0.9-1.4) 1.2(0.9-1.4)
Leptin ng/mL 6.7(4.9-9.2) 18.0(13.6-25.3)
Adiponectin µg/mL 2.2(1.6-3.6) 4.8(3.5-7.4)
CRP mg/dl 0.12(0.07-0.18) 0.11(0.07-0.24)
SBP mmHg 133±15 136±18
DBP mmHg 82±13 83±12
Fasting glucose mg/dl 111±26 114±27
HBA1C % 5.8±1.1 5.9±1.2
Mean±SD. Adipocytokines and CRP showed median and range (25 percentile and 75 percentile).

Diabetes Research
Open Journalhttp://dx.doi.org/10.17140/DROJ-1-122
Diabetes Res Open J
ISSN 2379-6391
Page 140
Sq: subcutaneous, abd: abdominal.
*:P<0.05,**:P<0.01Significantly different between intervention and control groups.
Table 2: Baseline and post intervention data of the participants by the arm.
A: Intervention group B: Control group
M(n=56) F(n=52) M(n=49) F(n=52)
Age 53.7±6.7 55.0±6.6 53.9±6.3 54.5±6.2
Height 167.9±5.9 155.1±5.7 168.9±6.0 155.2±5.7
Body wt 0y 84.2±8.5 74.5±8.4 87.3±12.1 75.2±10.3
Body wt 1y 79.3±8.7 70.7±9.3 87.5±13 ** 75±11 *
Body wt difference 0_1y 5.0±5.1 3.8±3.7 -0.2±2.8 ** 0.2±2.5 **
BMI 0y 29.8±2.3 31.0±2.9 30.6±3.8 31.1±3.0
BMI 1y 28.1±2.5 29.4±3.4 30.5±4.2 ** 31.0±3.2 *
BMI difference 0_1y 1.7±1.8 1.6±1.5 0±1.0 ** 0.1±1.0 **
Body fat 0y 28.5±3.6 39.7±5.2 29.2±4.6 41.8±5.4 *
Body fat 1y 26.8±4.4 37.8±5.9 29.6±5.1 ** 41.8±5.8 **
total fat 0y 393±82 467±98 417±137 468±123
sq fat 0y 243±66 343±80 253±114 335±100
abd fat 0y 150±48 125±47 164±48 133±47
total fat 1y 333±81 402±93 397±104 ** 455±108 **
sq fat 1y 207±62 302±76 238±96 * 326±88
abd fat 1y 126±46 100±38 159±48 ** 130±45 **
total fat difference 0_1y 60±64 65±57 19.7±57.9 ** 13.2±44.0 **
sq fat difference 0_1y 36±38 41±44 14.3±32.6 ** 9.7±30.7 **
abd fat difference 0_1y 24±33 24±26 5.4±33.3 ** 3.5±22.4 **
lower than those before the intervention (Table 5).
Leptin value at the end of follow-up showed signifi-cantly lower than the end of intervention for men and women. Adiponectin and TNF-α was significantly decreased at the end of follow-up than at the end of intervention both men and women (Table 5).
The change of weight and adipocytokine levels for weight regain groups between follow-up periods is shown by the quartile of body weight regain (Figure 3). Leptin was signifi-cantly higher in upper quartile of weight regain.
DISCUSSION
In this study, we achieved a 5 percent body weight loss through a one-year lifestyle intervention program using a be-
havioral approach. In parallel with the weight reduction, many metabolic syndrome-related factors significantly improved. Dur-ing the intervention, energy source, crops and diary decreased, while the intake of green yellow vegetables increased.27 Eating speed improved and physical activity also increased compared to the control group.32 Especially in Group A, women increased their daily physical activity and improved their irregular eating habits during the follow-up period. Eating motivation could be changed through the cognitive-behavior approach.
Following encouragements from trainers, physical ac-tivity seemed to be more frequent during the intervention period. This did not last during the follow-up period, while dietary habits seemed to be maintained even after intervention. Altered dietary habit could contribute to the later life. As body weight signifi-cantly increased at the end of follow-up examination compared to the weight at the end of the intervention program, fixation of
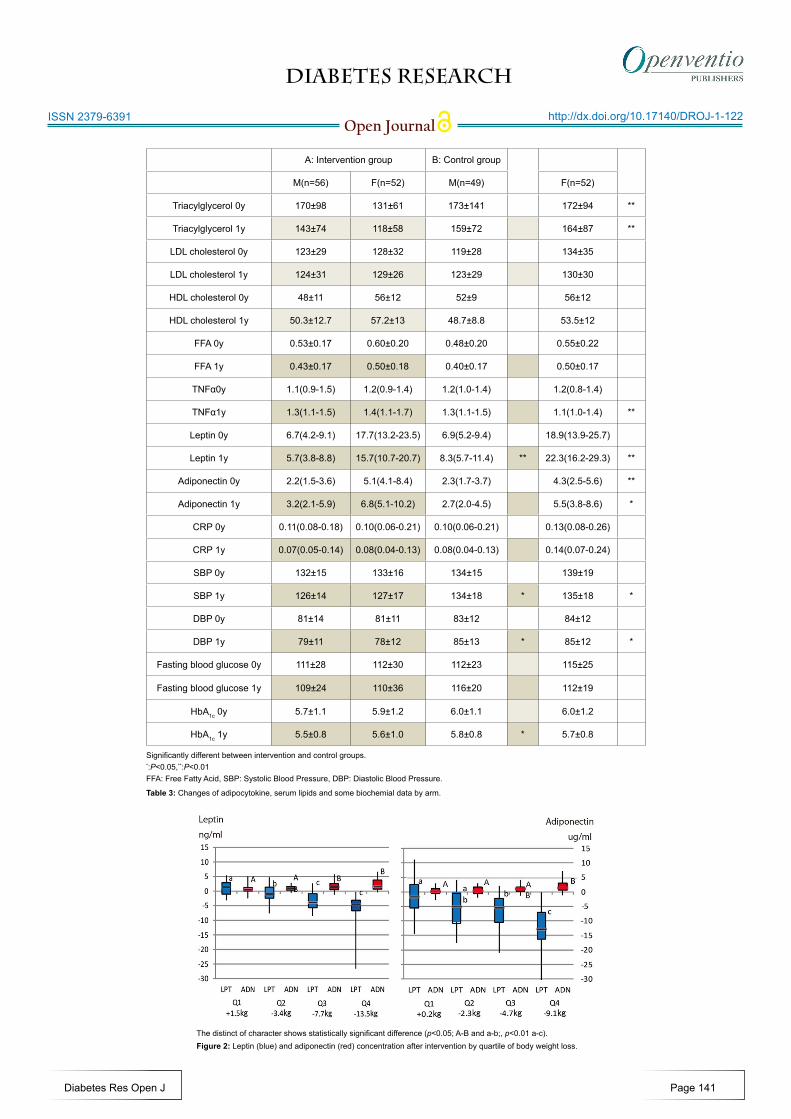
Diabetes Research
Open Journalhttp://dx.doi.org/10.17140/DROJ-1-122
Diabetes Res Open J
ISSN 2379-6391
Significantly different between intervention and control groups.*:P<0.05,**:P<0.01FFA: Free Fatty Acid, SBP: Systolic Blood Pressure, DBP: Diastolic Blood Pressure.
Table 3: Changes of adipocytokine, serum lipids and some biochemial data by arm.
Figure 2: Leptin (blue) and adiponectin (red) concentration after intervention by quartile of body weight loss.
Page 141
The distinct of character shows statistically significant difference (p<0.05; A-B and a-b;, p<0.01 a-c).
A: Intervention group B: Control group
M(n=56) F(n=52) M(n=49) F(n=52)
Triacylglycerol 0y 170±98 131±61 173±141 172±94 **
Triacylglycerol 1y 143±74 118±58 159±72 164±87 **
LDL cholesterol 0y 123±29 128±32 119±28 134±35
LDL cholesterol 1y 124±31 129±26 123±29 130±30
HDL cholesterol 0y 48±11 56±12 52±9 56±12
HDL cholesterol 1y 50.3±12.7 57.2±13 48.7±8.8 53.5±12
FFA 0y 0.53±0.17 0.60±0.20 0.48±0.20 0.55±0.22
FFA 1y 0.43±0.17 0.50±0.18 0.40±0.17 0.50±0.17
TNFα0y 1.1(0.9-1.5) 1.2(0.9-1.4) 1.2(1.0-1.4) 1.2(0.8-1.4)
TNFα1y 1.3(1.1-1.5) 1.4(1.1-1.7) 1.3(1.1-1.5) 1.1(1.0-1.4) **
Leptin 0y 6.7(4.2-9.1) 17.7(13.2-23.5) 6.9(5.2-9.4) 18.9(13.9-25.7)
Leptin 1y 5.7(3.8-8.8) 15.7(10.7-20.7) 8.3(5.7-11.4) ** 22.3(16.2-29.3) **
Adiponectin 0y 2.2(1.5-3.6) 5.1(4.1-8.4) 2.3(1.7-3.7) 4.3(2.5-5.6) **
Adiponectin 1y 3.2(2.1-5.9) 6.8(5.1-10.2) 2.7(2.0-4.5) 5.5(3.8-8.6) *
CRP 0y 0.11(0.08-0.18) 0.10(0.06-0.21) 0.10(0.06-0.21) 0.13(0.08-0.26)
CRP 1y 0.07(0.05-0.14) 0.08(0.04-0.13) 0.08(0.04-0.13) 0.14(0.07-0.24)
SBP 0y 132±15 133±16 134±15 139±19
SBP 1y 126±14 127±17 134±18 * 135±18 *
DBP 0y 81±14 81±11 83±12 84±12
DBP 1y 79±11 78±12 85±13 * 85±12 *
Fasting blood glucose 0y 111±28 112±30 112±23 115±25
Fasting blood glucose 1y 109±24 110±36 116±20 112±19
HbA1c 0y 5.7±1.1 5.9±1.2 6.0±1.1 6.0±1.2
HbA1c 1y 5.5±0.8 5.6±1.0 5.8±0.8 * 5.7±0.8

Diabetes Research
Open Journalhttp://dx.doi.org/10.17140/DROJ-1-122
Diabetes Res Open J
ISSN 2379-6391
BMI 1y total fat 1y sq fat 1y vis fat 1y TG 1y FFA 1y HBA1C 1y L_leptin 1y L_adipo 1y L_TNF 1y after the intervention
BMI 0y .873** .807** .461** .278** .195 .281** .622** -.336** -.026 BMI 1y
total fat 0y .846** .852** .635** .293** .164 .279** .738** -.219* -.095 total fat 1y
sq fat 0y .817** .859** .136 .091 .145 .101 .632** -.106 -.064 sq fat 1y
vis fat 0y .266** .495** -.021 .421** .097 .378** .464** -.257** -.085 vis fat 1y
TG 0y .125 .088 -.043 .246* .233* .122 .429** -.436** -.039 TG 1y
FFA 0y -.006 .032 .015 .037 .311** .062 .129 -.192 -.141 FFA 1y
HBA1C 0y .185 .128 .008 .236* .124 .127 .241* -.147 .038 HBA1C 1y
L_leptin 0y .608** .668** .618** .255** .227* -.036 .166 -.356** -.028 L_leptin 1y
L_adipo 0y -.128 -.067 .018 -.162 -.275** -.244* -.105 -.080 -.081 L_adipo 1y
L_TNF 0y .059 .013 .076 -.103 -.094 -.014 .026 .079 -.108 L_TNF 1y
baseline BMI 0y total fat 0y sq fat 0y vis fat 0y TG 0y FFA 0y HBA1C 0y L_leptin 0y L_adipo 0y L_TNF 0y
*:P<0.05,**:P<0.01
BMI 1y total fat 1y sq fat 1y vis fat 1y TG 1y FFA 1y HBA1C 1y L_leptin 1y L_adipo 1y L_TNF 1y after the intervention
BMI 0y .846** .777** .535** .253* .175 .185 .620** -.057 .040 BMI 1y
total fat 0y .802** .924** .622** .253* .103 .189 .622** -.127 .019 total fat 1y
sq fat 0y .722** .904** .274** .128 .031 .049 .546** -.039 -.046 sq fat 1y
vis fat 0y .477** .588** .186 .372** .196 .375** .445** -.238* .141 vis fat 1y
TG 0y .077 .092 -.054 .314** .137 .212* .260** -.150 .245* TG 1y
FFA 0y .227* .118 .033 .208* .153 .275** .000 .072 .157 FFA 1y
HBA1C 0y .022 .055 -.107 .328** .217* .382** .139 -.260** .254* HBA1C 1y
L_leptin 0y .550** .549** .462** .387** .126 -.062 -.061 -.150 .118 L_leptin 1y
L_adipo 0y .054 .072 .125 -.072 -.192 .008 -.171 -.050 -.112 L_adipo 1y
L_TNF 0y .145 .210* .032 .421** .248* .250* .268** .218* -.202* L_TNF 1y
baseline BMI 0y total fat 0y sq fat 0y vis fat 0y TG 0y FFA 0y HBA1C 0y L_leptin 0y L_adipo 0y L_TNF 0y
1y end
1y end
baseline
baseline
Men(n=102)
Women(n=98)*:P<0.05,**:P<0.01Table 4: Correlation analysis between fat and adipocytokines.
good health habit would be very difficult without decision of individuals.
Decrease and increase of fatty tissue should be a ba-sis of body weight change. Adipose tissue is a major source of energy for the human body. It is also a source of major adipo-cytokines, adiponectin and leptin.6 In this study, leptin changed markedly in the process of weight reduction and regain. Adi-ponectin decreased according to the weight reduction, but not changed between weights regain quartile. Leptin seemed to be highly sensitive to weight changes than adiponectin.
A few studies have explored the relationship between weight change and changes of adipocytokines, but results are inconsistent.
Leptin inhibits food intake, stimulates energy expendi-ture, and regulating immune function.13 In humans, serum leptin levels are positively correlated with obesity, T2D, hypertension and Metabolic syndrome (MetS).14,15 Leptin levels increase in obesity and subcutaneous fat has been a major determinant of circulating leptin levels. The net action of leptin is to inhibit ap-petite, stimulate thermogenesis, enhance fatty acid oxidation,
Page 142

Diabetes Research
Open Journalhttp://dx.doi.org/10.17140/DROJ-1-122
Diabetes Res Open J
ISSN 2379-6391
Figure 3: Difference of leptin (blue) and adiponectin (red) concentration during follow-up period by quar-tile of body weight gain.
The distinct of character shows statistically significant difference (p<0.05; A-B and a-b;, p<0.01 a-c).
Men(n=102) Women(n=98)
End intervention End follow-up End intervention End follow-up
mean±SD mean±SD t mean±SD mean±SD t
Weight kg 79.9±10.1 81.5±10.3 ** 70.7±10.1 72.0±10.2 **
BMI kg/m2 28.2±3.0 28.8±3.1 ** 29.3±3.4 29.9±3.4 **
Waist circumference cm 95.8±8.6 97.5±8.4 ** 99.1±9.4 100.7±9.2 **
Total fat area cm2 333±95 366±103 ** 403±100 425±99 **
Sq fat area cm2 204±74 213±75 ** 302±82 307±84
Vis fat area cm2 129±50 153±61 ** 102±40 118±44 **
Total cholesterol mg/dl 194±34 196±31 210±27 213±33
HDL-cholest mg/dl 52±11 52±12 57±12 57±12
LDL-cholest mg/dl 118±30 121±29 129±26 133±30
Triglyceride mg/dl 132±76 143±79 117±58 120±54
Leptin ng/mL 4.9(3.3-7.4) 5.5(3.8-7.7) * 14.0±(8.4-19.0) 15.0±(10.2-21.7) **
Adiponectin µg/mL 3.4(2.2-5.6) 2.9(1.8-5.0) ** 6.3±(4.8-9.6) 5.6±(4.1-8.4) **
TNF-α pg/ml 1.3(1.1-1.5) 1.2(1.0-1.5) * 1.3±(1.0-1.6) 1.2±(1.0-1.3) *
FFA mEq/L 0.5±0.2 0.4±0.2 0.5±0.2 0.5±0.2
CRP mg/dl 0.07(0.04-0.15) 0.08(0.04-0.18) 0.08(0.04-0.13) 0.09±(0.04-0.16)
SBP mmHg 128±15 128±14 128±18 126±16
DBP mmHg 80±11 80±11 80±11 77±10 **
Fast glucose mg/dl 108±22 108±20 109±29 108±23
HBA1C % 5.6±0.9 5.7±0.8 * 5.7±0.9 5.8±0.9 *
Significantly different between end of intervention and follow-up.*:P<0.05,**:P<0.01Table 5: Changes of body weight and biomarkers during follow-up.
Page 143

Diabetes Research
Open Journalhttp://dx.doi.org/10.17140/DROJ-1-122
Diabetes Res Open J
ISSN 2379-6391
decrease glucose, and reduce body weight and fat. Our results suggest that leptin change associated with weight reduction and regain, and other effects on metabolic markers.
Weight loss significantly elevates plasma adiponectin levels. We measured HMW-adiponectin in this study. Adiponec-tin is present in serum as a trimer, hexamer, or high molecular weight form. HMW adiponectin is closely related to coronary artery disease and weight reduction, it affects insulin-sensitiz-ing.33,34 Moreover, HMW-adiponectin contributes to the activa-tion of AMP-activated protein kinase (AMPK), to the suppres-sion of endothelial cell apoptosis, and to cytostatic activity.35,36
We propose that early reports describing variable effects of adiponectin should be interpreted with caution, as HMW adipo-nectin is a more reliable assay reflecting the active form of adi-ponectin. A reduction in adiponectin has previously been associ-ated with insulin resistance, dyslipidemia, and atherosclerosis in humans.
TNF-α significantly increased by intervention in wom-en even though body weight and fat area decreased. At the end of follow-up, TNF-α significantly decreased than at the end of intervention both in men and women even though body weight and fat area increased. TNF-α is secreted from not only fat cells but also macrophages. Thus, the changes of TNF-α may be influ-enced by other factors independently from body weight, obesity or fat cell. It may need further study in the future.
Ambeba et al19 conducted the 24 month weight loss tri-al. They reported that adiponectin increased with weight reduc-tion and decreased with weight regain. These results are similar to our observations. On the other hand, Bluher et al20 reported an increase in adiponectin with weight loss. However, there was a continued increase in adiponectin levels with weight regain. There are several differences between Bluher’s and our study. First, we conducted separate statistical analysis between sexes, while they analyzed aggregate data. Furthermore, most of the participants were men (86%). Bluher et al20 conducted a 2-year intervention for weight loss, using calorie or carbohydrate diet restrictions.
Our study has several limitations. We could set control group in intervention phase by cross-over design, as Group B participants waited their intervention for one year as a control group of A. However, follow-up period of Group A could not be combined to control group of intervention, because they trailed the effect of intervention. It was impossible to set monthly or yearly wash out period, so this problem should be elaborated in the future epidemiological design of human study. So, there was no control group in follow-up phase. Secondly, the relation-ship between dietary and physical activity was not sufficiently connected to the adipocytokine changes. Individual health con-ditions, different absorption capacities, and different intestinal microbiota could affect the metabolism of individuals and their predisposition to obesity or leanness.37 Further studies are neces-sary to better integrate individual holistic variables.
In conclusion, our results suggest that leptin should have broad effects among fat tissues and lipid metabolism. Leptin inversely associated with adiponectin, which in turn was necessary to decrease body weight. In particular, leptin de-creased remarkably in the process of weight reduction, and its increase seemed to be related in weight regain. Increase of adi-ponectin seemed to be induced by the reduction of fat volume.
ACKNOWLEDGMENTS
The authors appreciate the participants for their enthusiastic co-operation. We express special thanks to the staffs of Saku Con-trol Obesity Program (SCOP) for their excellent support of the study. Dr. Masahiro Morioka, and other members of Saku Hu-man Doc Center contributed to our study in various aspects.
This study was supported by Grant-in-aid for Scientific Re-search from the Japan Ministry of Health, Labour and Welfare (MHLW).
CONFLICTS OF INTEREST
The authors declare that they has no conflicts of interest.
REFERENCES
1. Poirier P, Giles TD, Bray GA, et al. Obesity and cardiovas-cular disease: pathophysiology, evaluation, and effect of weight loss. Arterioscler Thromb Vasc Biol. 2006; 26: 968-976.
2. Ford ES, Williamson DF, Liu S. Weight change and diabetes incidence: findings from a national cohort of US adults. Am J Epidemiol. 1997; 146(3): 214-222.
3. Gary DF, Angela PM, Brooke AB. Behavioral treatment of obesity. Am J Clin Nutr. 2005; 82: 230S-235S.
4. Stevens VL, Jacobs EJ, Sun J, et al. Weight cycling and mor-tality in a large prospective US study. Am J Epidemiol. 2012; 175: 785-792. doi: 10.1093/aje/kwr378 5. Kraschnewski JL, Boan J, Esposito J, et al. Long-term weight loss maintenance in the United States. Int J Obes (Lond). 2010; 34: 1644-1654. doi: 10.1038/ijo.2010.94
6. Matsuzawa Y, Funahashi T, Nakamura T. Molecu-lar mechanism of metabolic syndrome X: contribution of adipocytokines·adipocyte-derived bioactive substances. Ann N Y Acad Sci. 1999; 892: 146-154. doi: 10.1111/j.1749-6632.1999.tb07793.x 7. Ahima RS, Flier JS. Adipose tissue as an endocrine organ. Trends Endocrinol Metab. 2000; 11: 327-332. doi: 10.1210/jc.2004-0395 8. Berg AH, Combs TP, Scherer PE. ACRP30/adiponectin: an
Page 144

Diabetes Research
Open Journalhttp://dx.doi.org/10.17140/DROJ-1-122
Diabetes Res Open J
ISSN 2379-6391
adipokine regulating glucose and lipid metabolism. Trends En-docrinol Metab. 2002; 13: 84-89.
9. Baskin DG, Blevins JE, Schwartz MW. How the brain regu-lates food intake and body weight: the role of leptin. J Pediatr Endocrinol Metab. 2001; 14: 1417-1429.
10. Cnop M, Havel PJ, Utzschneider KM, et al. Relationship of adiponectin to body fat distribution, insulin sensitivity and plasma lipoproteins: evidence for independent roles of age and sex. Diabetologia. 2003; 46: 459-469.
11. Arita Y, Kihara S, Ouchi N, Takahashi M, et al. Paradoxical decrease of an adipose-specific protein, adiponectin, in obesity. Biochem Biophys Res Commun. 1999; 257: 79-83. doi: 10.1006/bbrc.1999.0255 12. Weyer C, Funahashi T, Tanaka S, Hotta K, et al. Hypoadi-ponectinemia in obesity and type 2 diabetes: close association with insulin resistance and hyperinsulinemia. J Clin Endocrinol Metab. 2001; 86: 1930-1935.
13. Otero M, Lago R, Lago F, et al. Leptin, from fat to inflamma-tion: old questions and new insights. FEBS Lett. 2005; 579(2): 295-301. doi: 10.1016/j.febslet.2004.11.024
14. Patel SB, Reams GP, Spear RM, et al. Leptin: linking obe-sity, the metabolic syndrome, and cardiovascular disease. Curr Hypertens. 2008; 10: 131-137. doi: 10.1007/s11906-008-0025-y 15. Miyanaga F, Ogawa Y, Ebihara K, et al. Leptin as an adjunct of insulin therapy in insulin-deficient diabetes. Diabetologia. 2003; 46: 1329-1337. doi: 10.1007/s00125-003-1193-6 16. Scarpace PJ, Zhang Y. Leptin resistance: a prediposing factor for diet-induced obesity. Am J Physiol Regul Integr Comp Physi-ol. 2009; 296(3): 493-500. doi: 10.1152/ajpregu.90669.2008 17. Yadav A, Kataria MA, Saini V, Yadav A. Role of leptin and adiponectin in insulin resistance. Clin Chim Acta. 2013; 18(417): 80-84. doi: 10.1016/j.cca.2012.12.007 18. Klempel MC, Varady KA. Reliability of leptin, but not adiponectin, as a biomarker for diet-induced weight loss in humans. Nutr Rev. 2011; 69(3): 145-154. doi: 10.1111/j.1753-4887.2011.00373.x
19. Ambeba EJ, Styn MA, Kuller LH, et al. Longitudinal effects of weight loss and regain on cytokine concentration of obese adults. Metabolism. 2013; 62(9): 1218-1222. doi: 10.1016/j.me-tabol.2013.04.004 20. Blüher M, Rudich A, Klöting N, et al. Two patterns of adi-pokine and other biomarker dynamics in a long-term weight loss intervention. Diabetes Care. 2012; 35(2): 342-349. doi: 10.2337/dc11-1267
21. Crujeiras AB, Goyenechea E, Abete I, et al. Weight regain after a diet-induced loss is predicted by higher baseline leptin and lower ghrelin plasma levels. J Clin Endocrinol Metab. 2010; 95(11): 5037-5044. doi: 10.1210/jc.2009-2566 22. Watanabe S, Morita A, Aiba N, et al. Study design of the saku control obesity program (SCOP). Anti-aging Medicine. 2007; 4(2): 70-73.
23. Morita A, Ohmori Y, Suzuki N, et al. Anthropometric and clinical findings in obese Japanese: the saku control obesity pro-gram (SCOP). Anti-aging Medicine. 2008; 5(1): 13-16.
24. Watanabe S. Tailor made nutrition for the elderly. Clin Funct Nutr. 2010; 2(1): 50-53.
25. Okubo H, Murakami K, Sasaki S, et al. Relative validity of dietary patterns derived from a self-administered diet his-tory questionnaire using factor analysis among Japanese adults. Public Health Nutr. 2010; 13(7): 1080-1089. doi: 10.1017/S1368980009993211 26. Takahashi Y, Murakami K, Morita A, et al. Baseline dietary intake in the saku control obesity program (SCOP). Anti-aging Medicine. 2008; 5(1): 6-12.
27. Aiba N, Watanabe S, Morita A, et al. Nutritional education and exercise treatment based on cognitive behavioral treatment in the saku control obesity program (SCOP). Anti-Aging Medi-cine. 2008; 5(2): 39-45.
28. Miyachi M, Ohmari Y, Yamamoto K, et al. The use of a uni-axial accelerometer to assess physical-activity-related energy expenditure in obese men and women. Anti-aging Med. 2006; 5: 1-5.
29. Ozaki H, Miyachi M, Nakajima T, Abe T. Muscle volume and strength and arterial compliance after walk training with blood flow reduction in elderly women. J Am Geriatr Soc. 2010; 58(8): 1597-1598. doi: 10.1111/j.1532-5415.2010.02989.x 30. Noda M, Kato M, Takahashi Y, et al. Fasting plasma glucose and 5-year incidence of diabetes in the JPHC diabetes study: suggestion for the threshold for impaired fasting glucose among Japanese. Endocr J. 2010; 57: 629-637. doi: 10.1507/endocrj.K10E-010 31. Noto H, Osame K, Sasazuki T, Noda M. Substantially in-creased risk of cancer in patients with diabetes mellitus. A sys-tematic review and meta-analysis of epidemiologic evidence in Japan. J Diabetes Complications. 2010; 24: 345-353. doi: 10.1016/j.jdiacomp.2010.06.004
32. Nakade M, Aiba N, Suda N, et al. Behavioral change dur-ing weight loss program and one-year follow-up: saku control
Page 145

Diabetes Research
Open Journalhttp://dx.doi.org/10.17140/DROJ-1-122
Diabetes Res Open J
ISSN 2379-6391
obesity program (SCOP) in Japan. Asia Pac J Clin Nutr. 2012; 21(1): 22-34.
33. Kobayashi H, Ouchi N, Kihara S, et al. Selective suppression of endothelial cell apoptosis by the high molecular weight form of adiponectin. Circ Res. 2004; 94: e27-e23. doi: 10.1161/01.RES.0000119921.86460.37 34. Pajvani UB, Hawkins M, Combs TP, et al. Complex distribu-tion, not absolute amount of adiponectin, correlates with thia-zolidinedionemediated improvement in insulin sensitivity. J Biol Chem. 2004; 279: 12152-12162. doi: 10.1074/jbc.M311113200 35. Waki H, Yamauchi T, Kamon J, et al. Impaired multimer-ization of human adiponectin mutants associated with diabetes: morecular structure and multimer formation of adiponectin. J Biol Chem. 2003; 278: 40352-40363.
36. Wang Y, Lam KS, Xu JY, et al. Adiponectin inhibits cell pro-liferation by interacting with several growth factors in an oligo-merization-dependent manner. J Biol Chem. 2005; 280: 18341-18347. doi: 10.1074/jbc.M501149200 37. Musso G, Gambino R, Cassaader M. Obesity, diabetes and gut microbiota. Diabetes Care. 2010; 33(10): 2277-2284. doi: 10.2337/dc10-0556
Page 146