diabetes and the heart glycaemic control and cvd/file/sh_diabetes.pdf · glycaemic control and cvd...
TRANSCRIPT

Glycaemic control and CVDSimon Heller
University of Sheffield
Diabetes and the Heart

Outline
Knowledge of glucose lowering benefits in 1998ADVANCE and ACCORDContrasting the two studiesAdditional lessons from VADT?Speculating on mechanismsOther recent evidence
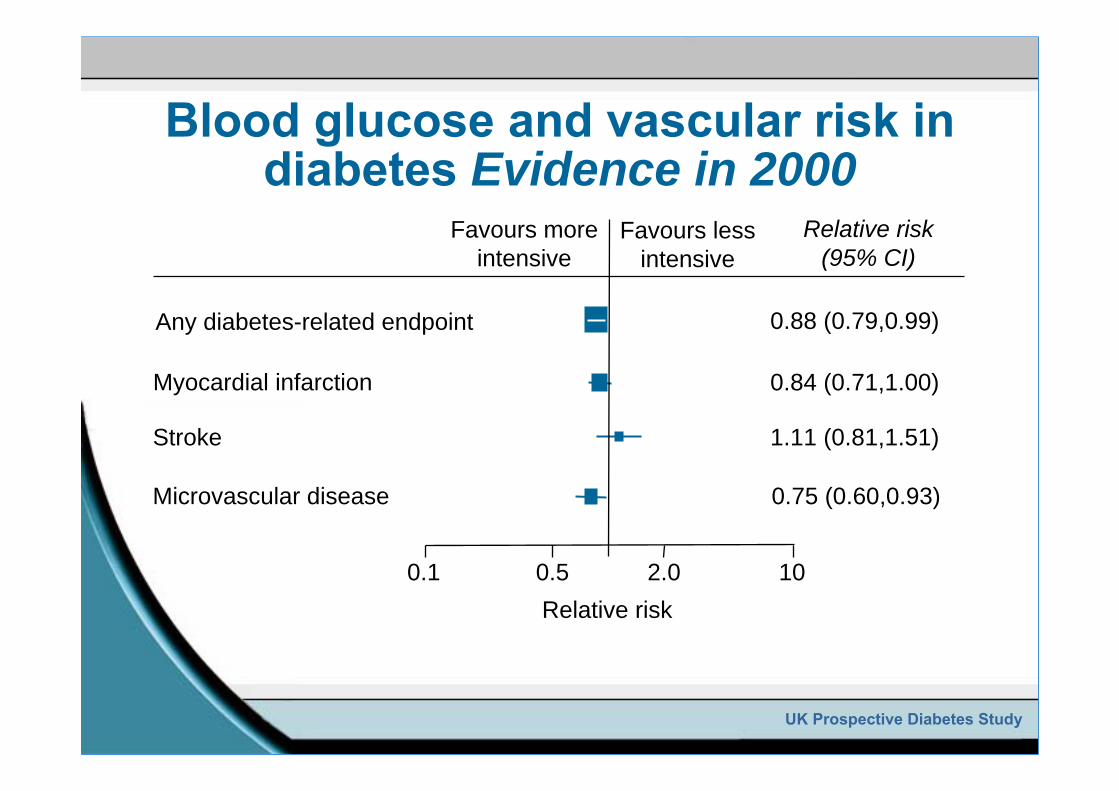
Blood glucose and vascular risk in diabetes Evidence in 2000
UK Prospective Diabetes Study
0.88 (0.79,0.99)Any diabetes-related endpoint
0.84 (0.71,1.00)Myocardial infarction
1.11 (0.81,1.51)Stroke
0.75 (0.60,0.93)Microvascular disease
Relative risk (95% CI)
Relative risk0.1 0.5 2.0 10
Favours more intensive
Favours less intensive
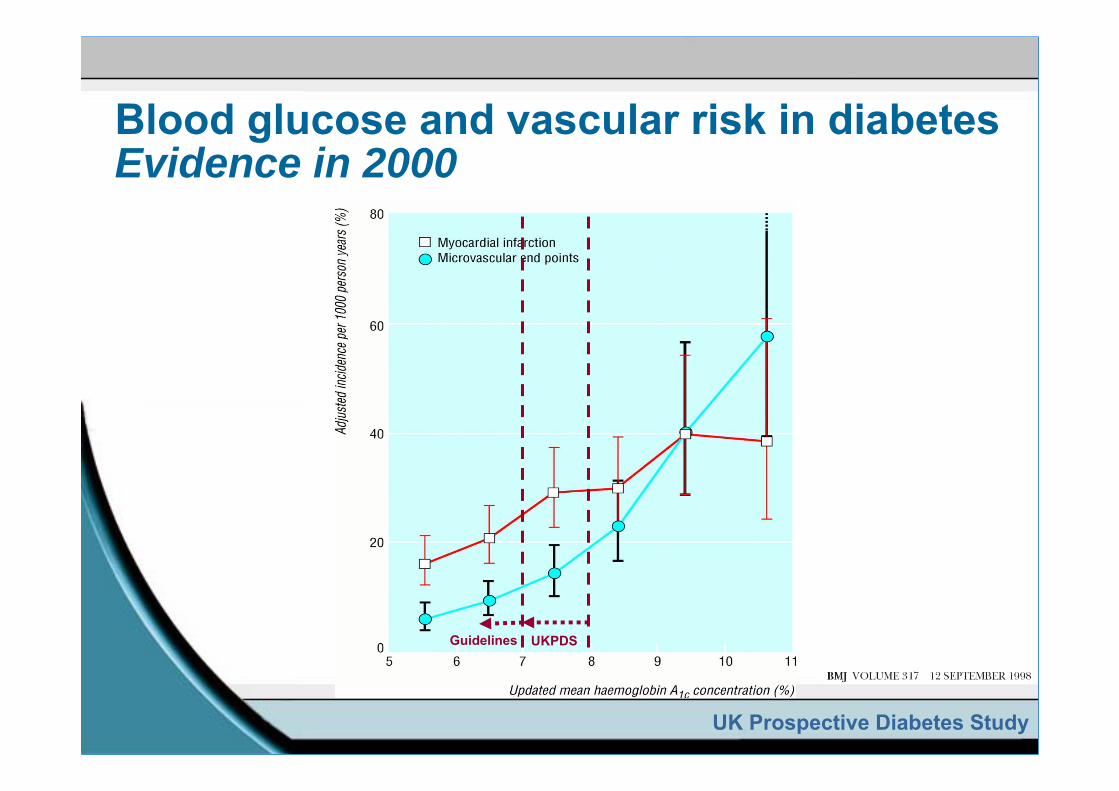
UKPDSGuidelines
UK Prospective Diabetes Study
Blood glucose and vascular risk in diabetes Evidence in 2000
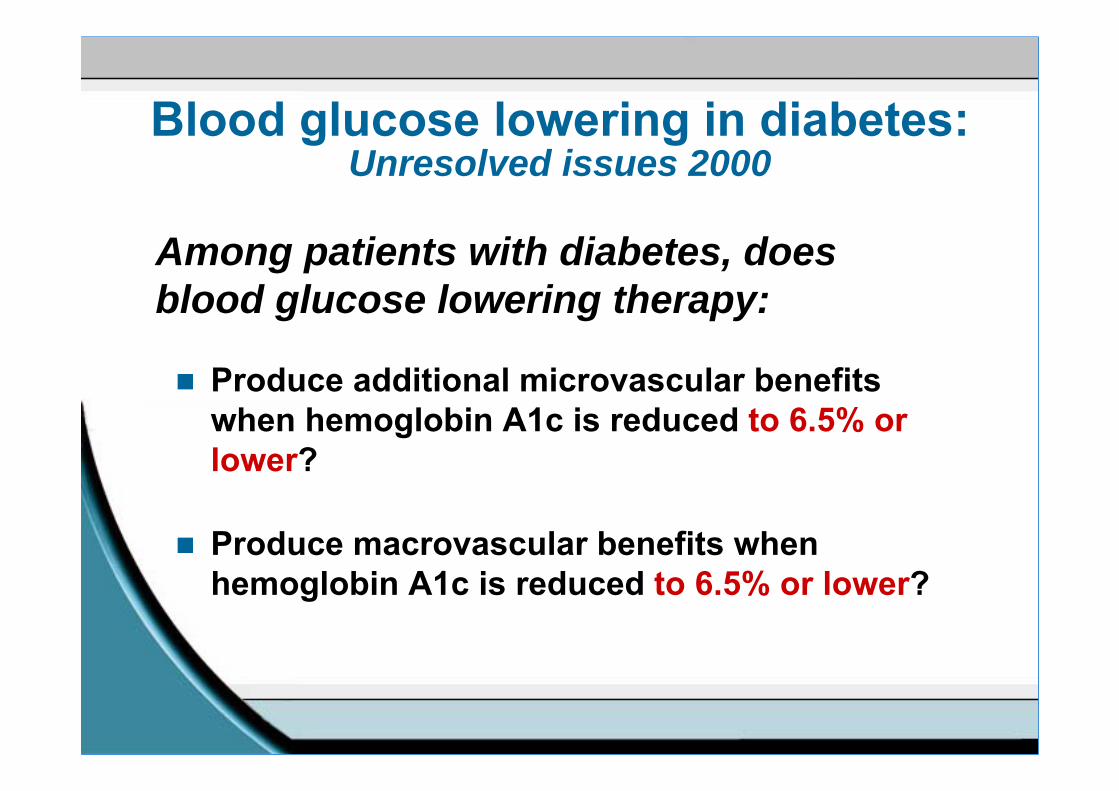
Among patients with diabetes, does blood glucose lowering therapy:
Produce additional microvascular benefits when hemoglobin A1c is reduced to 6.5% or lower?
Produce macrovascular benefits when hemoglobin A1c is reduced to 6.5% or lower?
Blood glucose lowering in diabetes: Unresolved issues 2000

Action in Diabetes and Vascular Disease-Preterax and Diamicron Modified Release Controlled Evaluation (ADVANCE)
n=11,140, embedded BP trialAction to Control Cardiovascular Risk in Diabetes (ACCORD)
n=10,251, embedded BP and lipid trialsVeteran Administration Diabetes Trial (VADT)
n=1,791, intensive BP and lipid control in both arms
Three major trials have addressedthese questions

Major macrovascular events-ADVANCE(MI, Stroke, CV death)
Follow-up (months)
Cum
ula t
ive
i nci
den c
e (%
)
25
20
15
10
5
0
StandardIntensive
0 6 12 18 24 30 36 42 48 54 60 66
Relative risk reduction6%: 95% CI: -6 to 16%
p=0.32

Major macrovascular events-ADVANCE(MI, Stroke, CV death)
Macrovascular 557 590 6% (-6 to 16)
Non-fatal stroke 214 209 -2% (-24 to 15)
Non-fatal MI 153 156 2% (-23 to 22)
Cardiovascular death 253 289 12% (-4 to 26)
Number of patients with eventIntensive Standard(n=5,571) (n=5,569)
Relative riskreduction (95% CI)
FavorsIntensive
FavorsStandard
Hazard ratio0.5 1.0 2.0

Major microvascular events-ADVANCE
Follow-up (months)
Cum
ula t
ive
i nci
den c
e (%
)
25
20
15
10
5
0
StandardIntensive
0 6 12 18 24 30 36 42 48 54 60 66
Relative risk reduction14%: 95% CI: 3 to 23%
p=0.015
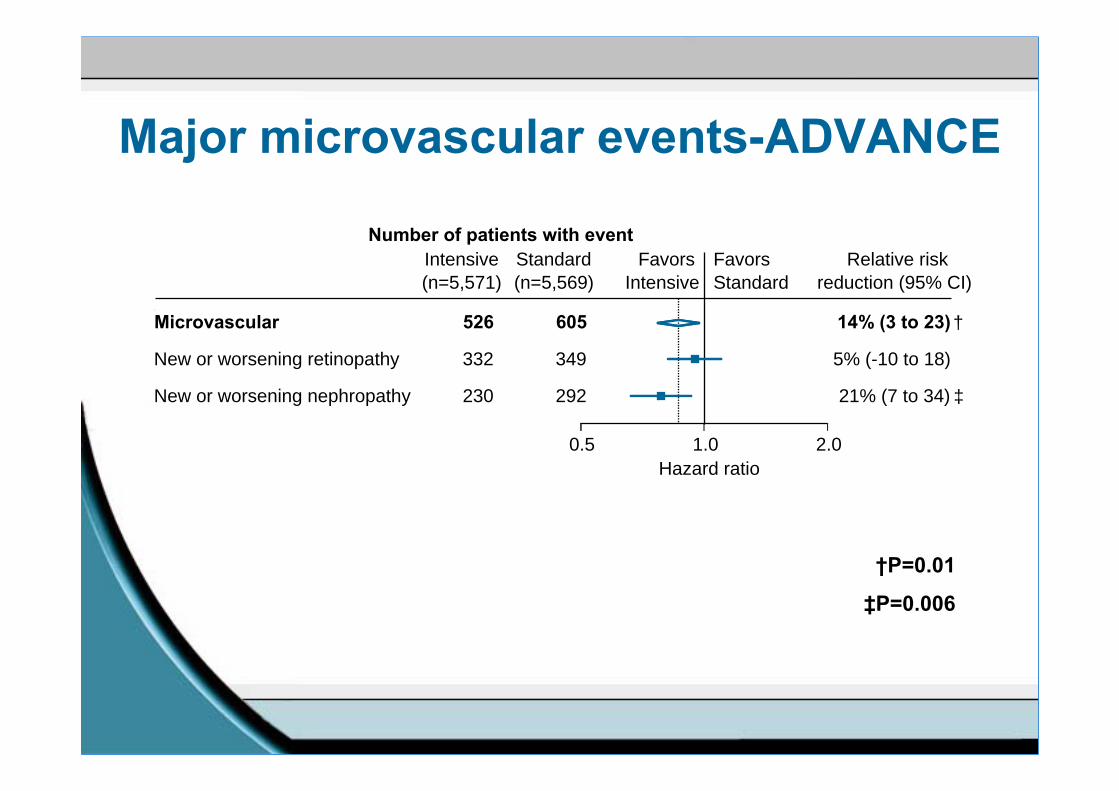
Major microvascular events-ADVANCE
Microvascular 526 605 14% (3 to 23)
New or worsening nephropathy 230 292 21% (7 to 34)
New or worsening retinopathy 332 349 5% (-10 to 18)
Number of patients with eventIntensive Standard(n=5,571) (n=5,569)
Relative riskreduction (95% CI)
FavorsIntensive
FavorsStandard
Hazard ratio0.5 1.0 2.0
†P=0.01
‡P=0.006
†
‡

All-cause mortality-ADVANCE
Relative risk reduction 7%: 95% CI -6 to 17%
p=0.28
Follow-up (months)
Cum
ula t
ive
i nci
den c
e (%
)
25
20
10
5
0
StandardIntensive
0 6 12 18 24 30 36 42 48 54 60 66
15

Death-ADVANCE
Cardiovascular death 253 289 12% (-4 to 26)
All deaths 498 533 7% (-6 to 17)
Non-cardiovascular death 245 244 0% (-20 to 16)
Number of patients with eventIntensive Standard(n=5,571) (n=5,569)
Relative riskreduction (95%CI)
FavorsIntensive
FavorsStandard
Hazard ratio0.5 1.0 2.0

Risk ratio (95% CI)
0.5 1 2
Combined
ADVANCE
UKPDS 0.94 (0.80, 1.10)
0.93(0.83, 1.06)
Favours intensified glycaemic control Favours conventional glycaemic control
Risk ratio (95% CI)
Mortality (meta-analysis)
1.26 (1.06, 1.51)ACCORD
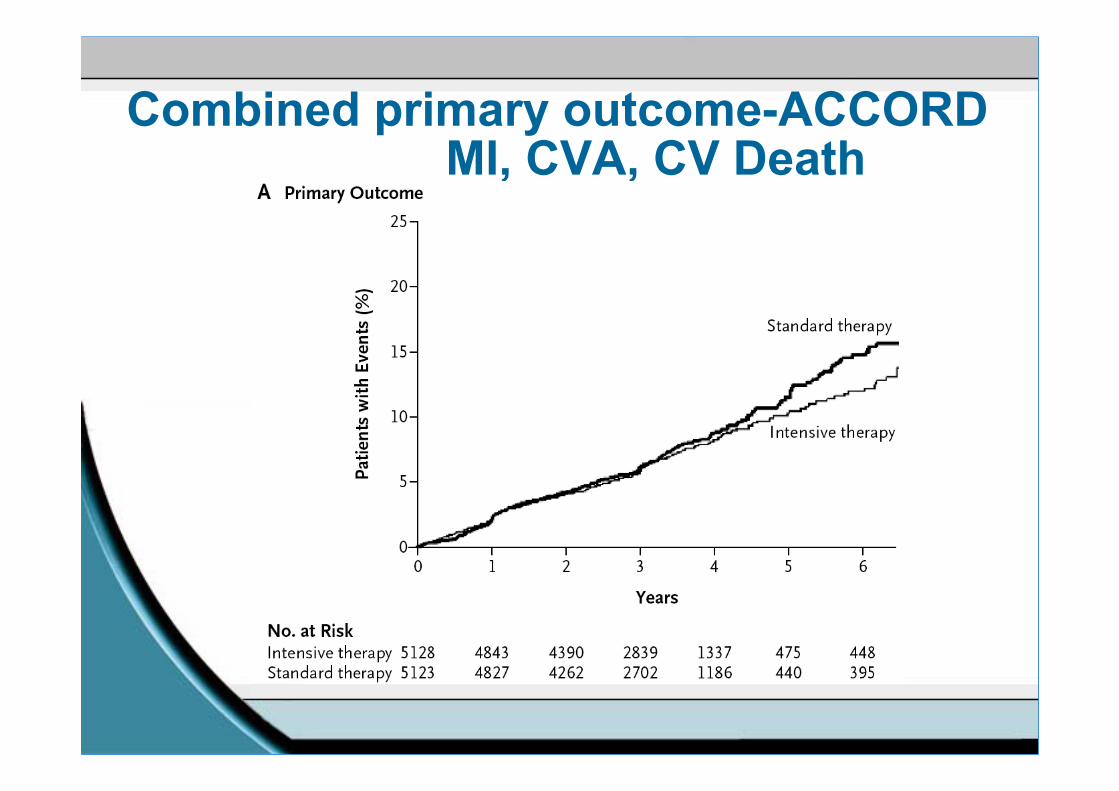
Combined primary outcome-ACCORDMI, CVA, CV Death
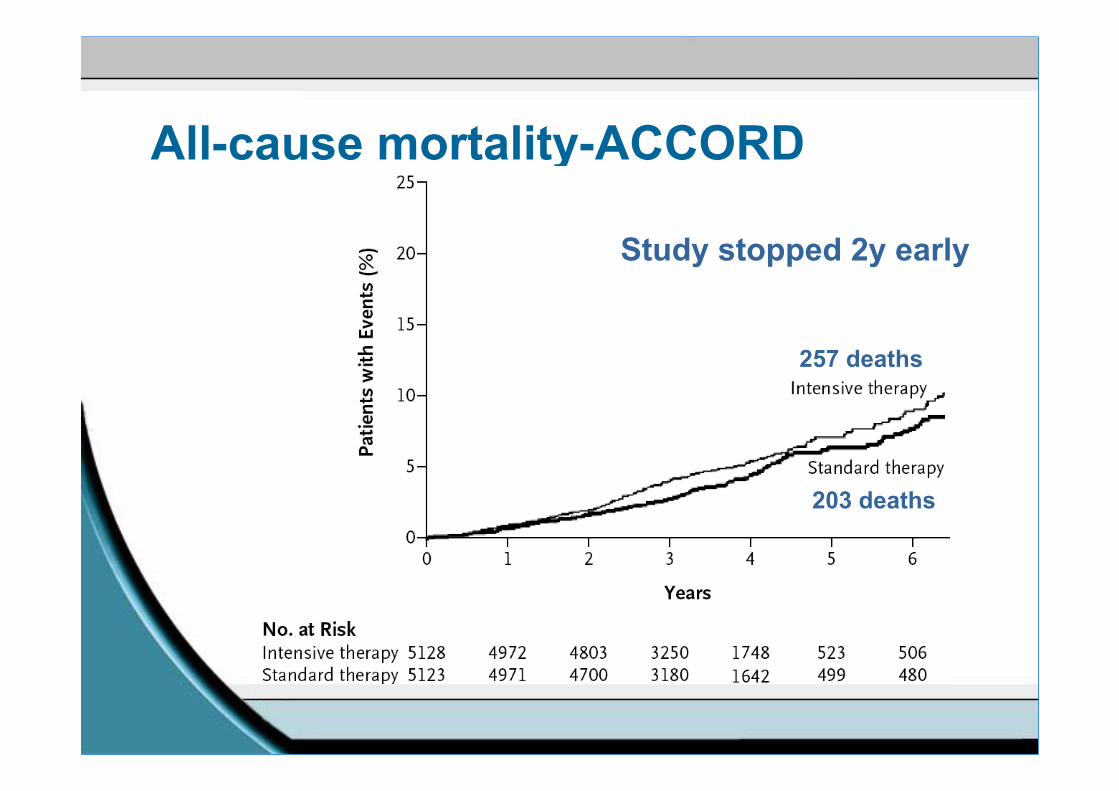
All-cause mortality-ACCORD
257 deaths
203 deaths
Study stopped 2y early

ADVANCE vs ACCORDWhat differences in the two trials may
explain the different effects on CV mortality in the two trials?

ACCORD28%
Hispanic/African american
ADVANCE30% Chinese

ADVANCE ACCORD
(n=1140) (n=1028)
Age (years)Known duration of diabetes (years)
668
6210
Systolic blood pressure (mmHg)Diastolic blood pressure (mmHg)
14581
13674
BMI 28 32Haemoglobin A1c (%) 7.5 8.3History of macrovascular disease 32% 35%Insulin treated 1% 30%
Baseline characteristics-
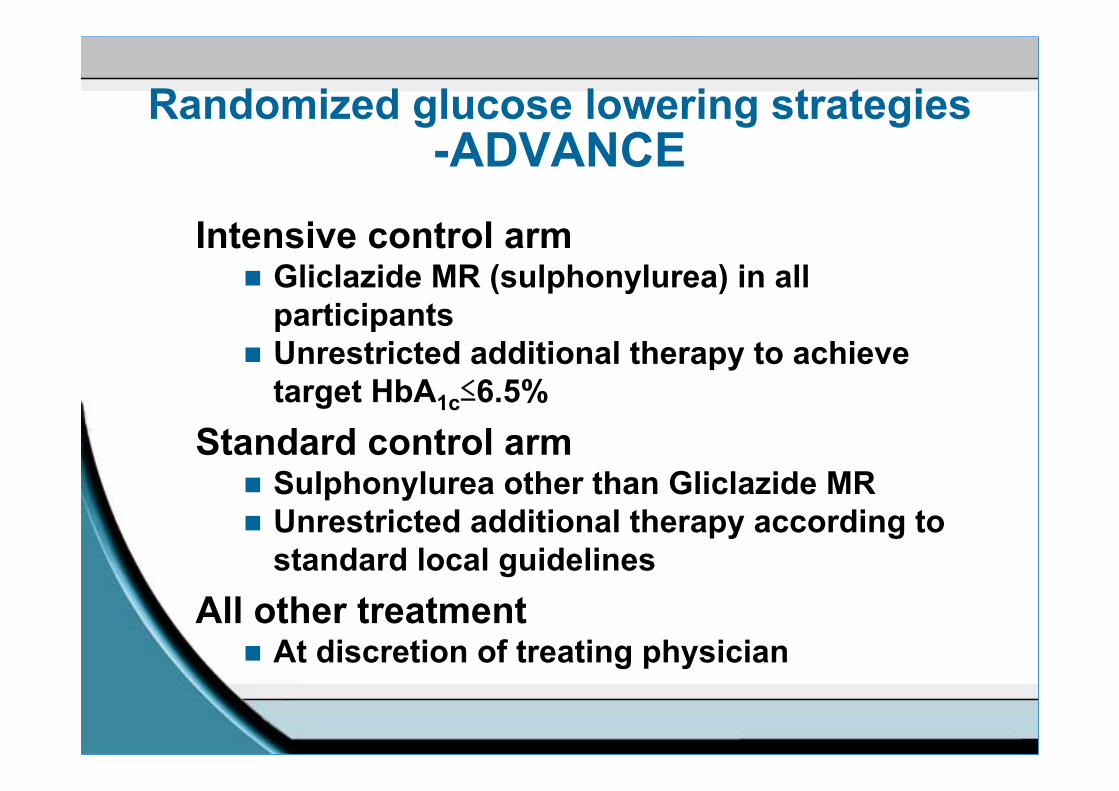
Randomized glucose lowering strategies-ADVANCE
Intensive control armGliclazide MR (sulphonylurea) in all participantsUnrestricted additional therapy to achieve target HbA1c≤6.5%
Standard control armSulphonylurea other than Gliclazide MRUnrestricted additional therapy according to standard local guidelines
All other treatmentAt discretion of treating physician

Intensive glucose control strategyADVANCE
More frequent visitsEmphasis on lifestyle managementDrug titration at physician’s discretion based on HbA1c and FBG levels:
Maximize gliclazide MR doseAdd other oral agentsAdd long-acting insulinUse multiple insulin injection therapy

Randomized glucose lowering strategiesACCORD
Intensive control armIndividualised therapy at discretion of investigatorsTarget HbA1c≤6.0% as early as possibleEarly and aggressive use of insulin, including multiple injectionsMonthly visits for first 6 months then 2 monthly
Standard control armVisits at 4 monthly intervals

Glucose control drugs-ADVANCEAt end of follow-up
Randomized treatmentIntensive (n=4828)
Standard (n=4741)
Sulphonylurea 91% 59%Metformin 74% 67%Thiazolidinediones 17% 11%Acarbose 19% 13%Glinides 1% 3%Insulin 40% 24%

Glucose control drugs-ACCORDAt end of follow-up
Randomized treatmentIntensive (n=5128)
Standard (n=5123)
Sulphonylurea 78% 74%Metformin 95% 87%Rosiglitazone 92% 58%Acarbose 23% 5%Glinides 50% 18%InsulinBolus Insulin
77%55%
55%35%
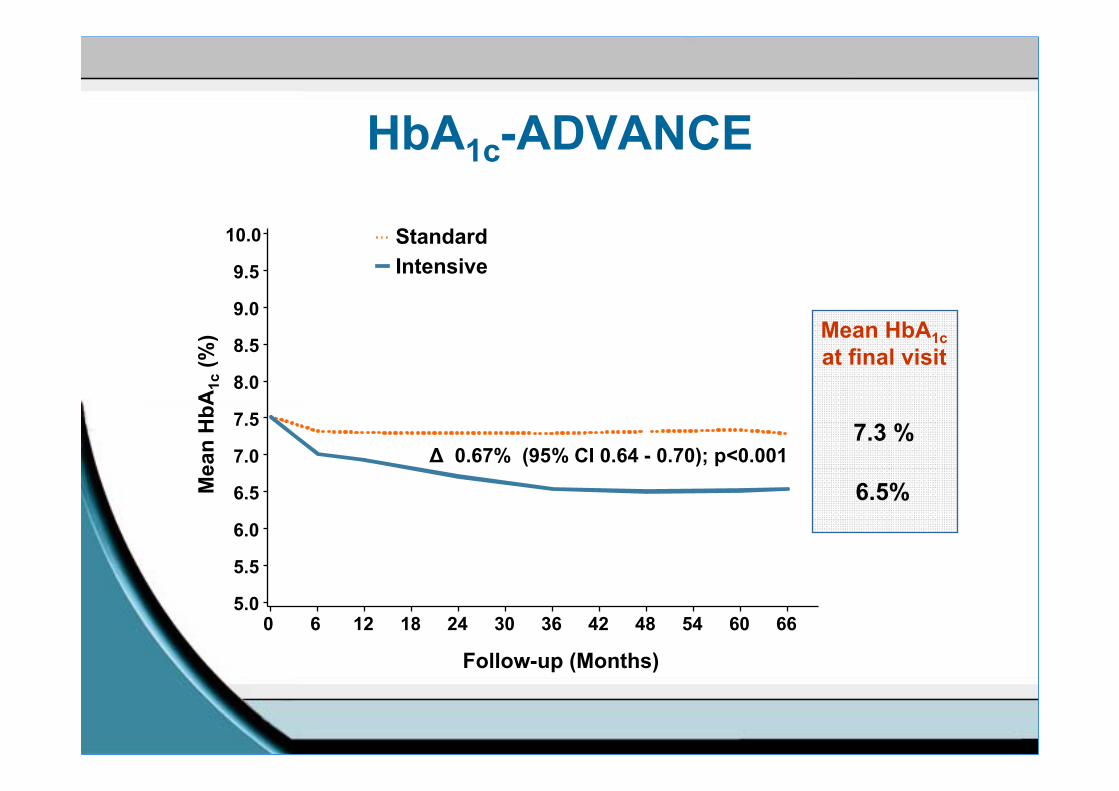
HbA1c-ADVANCE
∆ 0.67% (95% CI 0.64 - 0.70); p<0.001
Mea
n H
bA1c
(%)
5.0
5.5
6.0
6.5
7.0
7.5
8.0
8.5
9.0
9.5
10.0
Follow-up (Months)
0 6 12 18 24 30 36 42 48 54 60 66
7.3 %
Mean HbA1cat final visit
6.5%
StandardIntensive

HbA1c ACCORD

Severe hypoglycaemia
0
5
10
15
20
ACCORD ADVANCE
Intensive controlStandard control
% p
atie
nts
with
at l
east
on
e ev
ent d
urin
g th
e tr
ial

Side effectsACCORD
Severe hypoglycaemia (% of patients experiencing at least 1 episode)
16% (intensive) vs 5% (standard)Weight (% of patients gaining >10kg from baseline)
28% (intensive) vs 14% (standard)
ADVANCESevere hypoglycaemia
3% (intensive) vs 2% (standard)Weight
Weight stable (intensive) vs 1kg wt loss (standard)

VADTSubjects
N=1800 97% maleyounger (60y), longer duration (11.5y), poorer control (HbA1c 9.4%), 50% insulin treated
HbA1c at end of study (6.9 vs 8.5%)Hypoglycaemia (21 vs 10%)Weight gain (7.8 vs 3.4kg)
Duration of 5.6y, no differences in:Primary endpoint HR 0.88 (0.74–1.05)Mortality 1.07 (0.81–1.42)

Potential causes of increased mortality during intensified therapy
Specific medication
Weight gain
Hypoglycaemia

Potential mechanisms of hypoglycaemia induced mortalityCardiac arrhythmias due to abnormal cardiac repolarisation in high risk patients (IHD, cardiac autonomic neuropathy)Increased thrombotic tendency/decreased thrombolysisCardiovascular changes induced by catecholamines
Increased heart rateSilent myocardial ischaemiaAngina and myocardial infarction
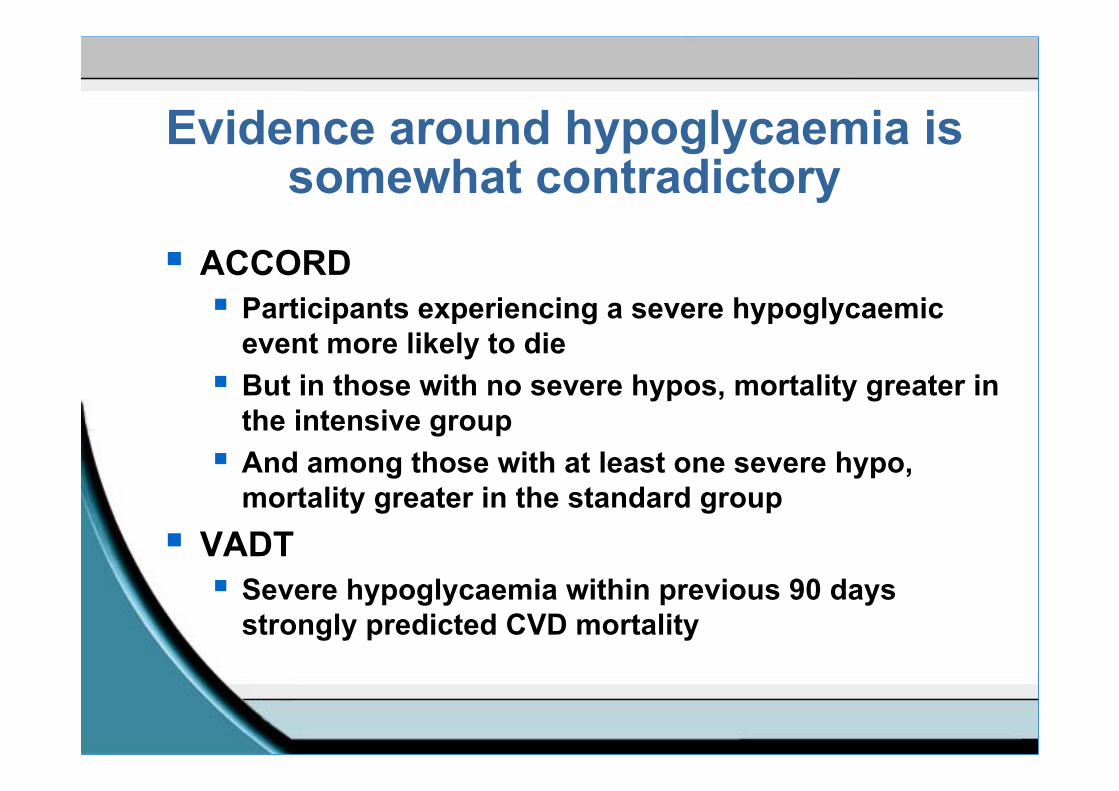
Evidence around hypoglycaemia is somewhat contradictory
ACCORDParticipants experiencing a severe hypoglycaemic event more likely to dieBut in those with no severe hypos, mortality greater in the intensive groupAnd among those with at least one severe hypo, mortality greater in the standard group
VADTSevere hypoglycaemia within previous 90 days strongly predicted CVD mortality

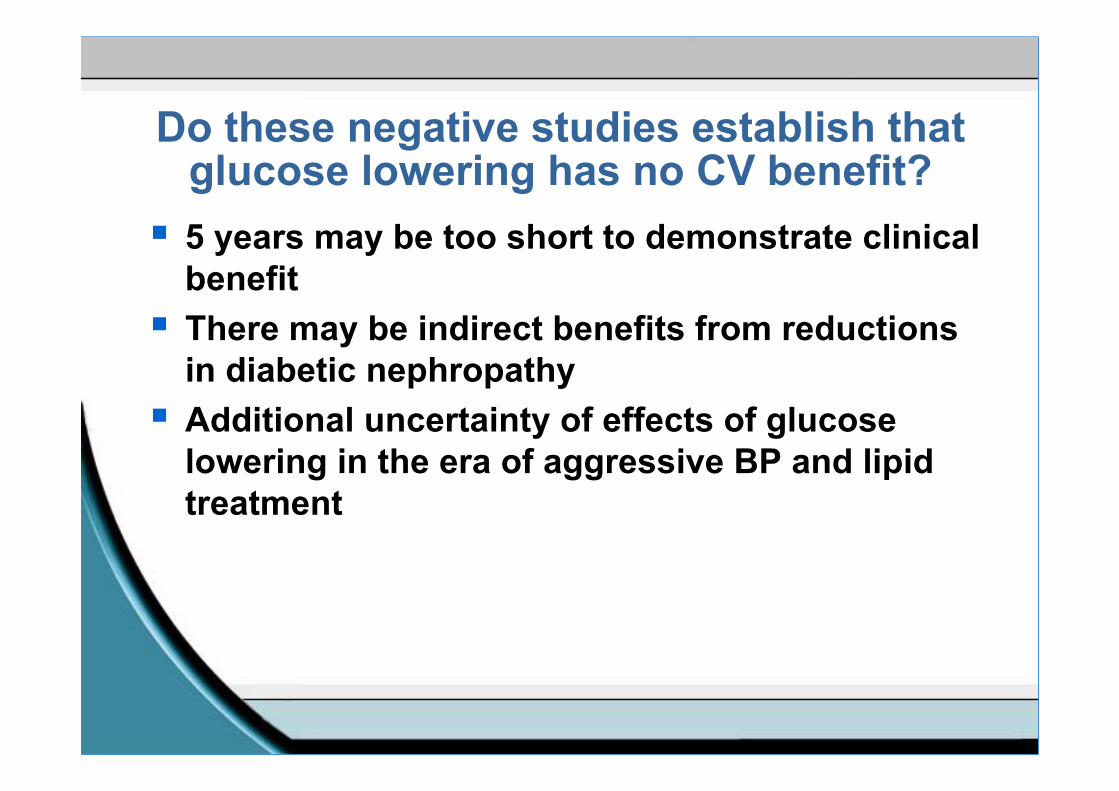
Do these negative studies establish that glucose lowering has no CV benefit?5 years may be too short to demonstrate clinical benefitThere may be indirect benefits from reductions in diabetic nephropathyAdditional uncertainty of effects of glucose lowering in the era of aggressive BP and lipid treatment

Steno-2: all-cause mortality
NEJM 2008;358:580-91

Myocardial Infarction Hazard Ratio(fatal or non-fatal myocardial infarction or sudden death)
Intensive (SU/Ins) vs. Conventional glucose control
HR (95%CI)

ConclusionsIntensive glucose lowering with traditional therapy in patients with established Type 2 diabetes and tight glycaemic control:
Can achieve and maintain HbA1c values of c. 6.5% safelyHas no significant effect on macrovascular disease over 5yReduces the onset of diabetic nephropathy
Intensive glucose lowering to HbA1c levels of 6% + multiple therapies with aggressive use of insulin may be hazardousThe following hypotheses should be explored
Hypoglycaemia contributes to mortality in Type 2 diabetes Intensifying glycaemic control in patients with established microvascular/macrovascular disease is of no benefit
HbA1c targets of between 6.5 and 7% in current guidelines seem appropriateMacrovascular disease can be reduced in the short-term by aggressive treatment of BP and lipids