di video questions
TRANSCRIPT
http://bit.ly/handaCAT13 [email protected] +91-‐9765142632
Video 1 – Tables 1
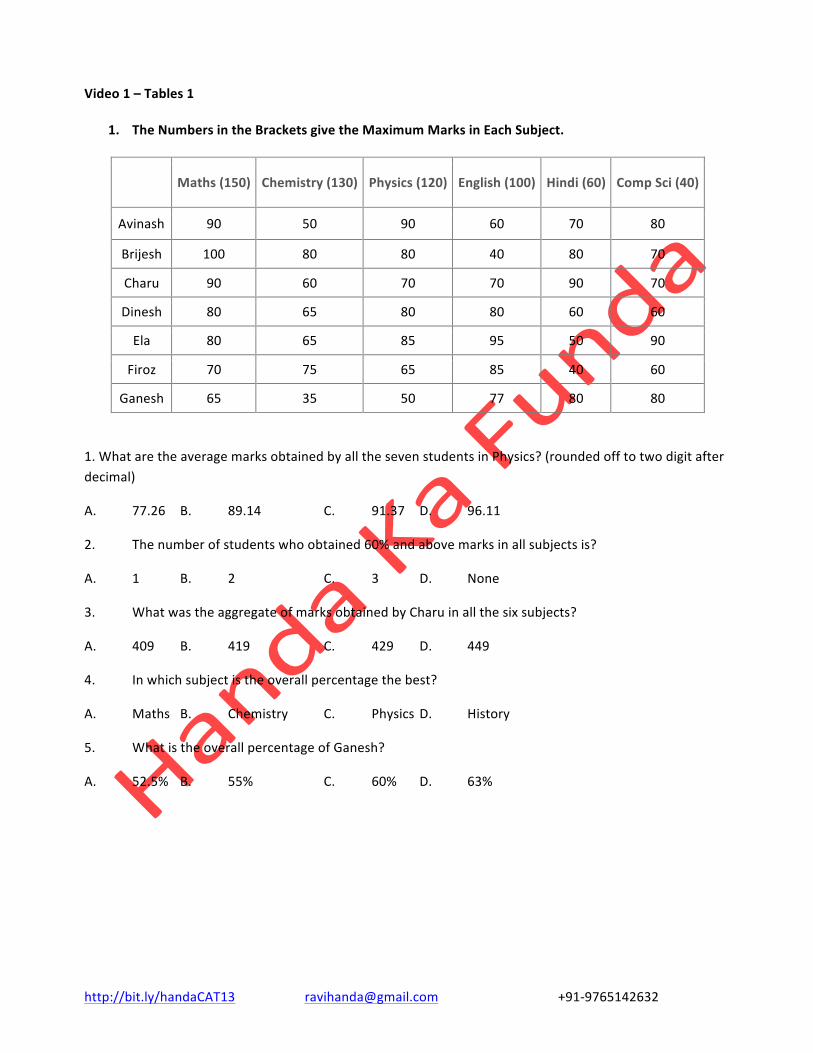
1. The Numbers in the Brackets give the Maximum Marks in Each Subject.
Maths (150) Chemistry (130) Physics (120) English (100) Hindi (60) Comp Sci (40)
Avinash 90 50 90 60 70 80
Brijesh 100 80 80 40 80 70
Charu 90 60 70 70 90 70
Dinesh 80 65 80 80 60 60
Ela 80 65 85 95 50 90
Firoz 70 75 65 85 40 60
Ganesh 65 35 50 77 80 80
1. What are the average marks obtained by all the seven students in Physics? (rounded off to two digit after decimal)
A. 77.26 B. 89.14 C. 91.37 D. 96.11
2. The number of students who obtained 60% and above marks in all subjects is?
A. 1 B. 2 C. 3 D. None
3. What was the aggregate of marks obtained by Charu in all the six subjects?
A. 409 B. 419 C. 429 D. 449
4. In which subject is the overall percentage the best?
A. Maths B. Chemistry C. Physics D. History
5. What is the overall percentage of Ganesh?
A. 52.5% B. 55% C. 60% D. 63%

http://bit.ly/handaCAT13 [email protected] +91-‐9765142632
Video2 – Tables 2
2. For admission to various affiliated colleges, a university conducts a written test with four different sections, each with a maximum of 50 marks. The following table gives the aggregate as well as the sectional cut-‐off marks fixed by six different colleges affiliated to the university. A student will get admission only if he/she gets marks greater than or equal to the cut-‐off marks in each of the section and his/her aggregate marks are at least equal to the aggregate cut-‐off marks as specified by the college.
Sectional Cut-‐off Marks Cut-‐off Marks Section A Section B Section C Section D
College 1 42 42 42 176 College 2 45 45 175 College 3 46 171 College 4 43 45 178 College 5 45 43 180 College 6 41 44 176
1. Aditya did not get a call from even a single college. What could be the maximum aggregate marks obtained by him?
(1) 181 (2) 176 (3) 184 (4) 196 (5) 190
2. Bhama got calls from all colleges. What could be the minimum aggregate marks obtained by her?
(1) 180 (2) 181 (3) 196 (4) 176 (5) 184
3. Charlie got calls from two colleges. What could be the minimum marks obtained by him in a section?
(1) 0 (2) 21 (3) 25 (4) 35 (5) 41

http://bit.ly/handaCAT13 [email protected] +91-‐9765142632
Video 3-‐ Pie1
3. The following pie-‐chart shows the sources of funds to be collected by the National Highways Authority of India (NHAI) for its Phase II projects. Study the pie-‐chart and answers the question that follow.
Sources of funds to be arranged by NHAI for Phase II projects (in crores Rs.)
1. Near about 20% of the funds are to be arranged through:
A. SPVS B. External Assistance
C. Annuity D. Market Borrowing
2. The central angle corresponding to Market Borrowing is
A. 52º B. 137.8º C. 187.2º D. 192.4º
3. The approximate ratio of the funds to be arranged through Toll and that through Market Borrowing is
A. 2 : 9 B. 1 : 6 C. 3 : 11 D. 2 : 5
4. If NHAI could receive a total of Rs. 9695 crores as External Assistance, by what percent (approximately) should it increase the Market Borrowing to arrange for the shortage of funds?
Market Borrowing, 29952 External
Assistance, 11486
SPVS, 5252
Toll, 4910
Annuity, 6000

http://bit.ly/handaCAT13 [email protected] +91-‐9765142632
A. 4.5% B. 7.5% C. 6% D. 8%
5. If the toll is to be collected through an outsourced agency by allowing a maximum 10% commission, how much amount should be permitted to be collected by the outsourced agency, so that the project is supported with Rs. 4910 crores?
A. Rs. 6213 Cr B. Rs. 5827 Cr C. Rs. 5401 Cr D. Rs. 5316 Cr
http://bit.ly/handaCAT13 [email protected] +91-‐9765142632
Video4 – Pie 2
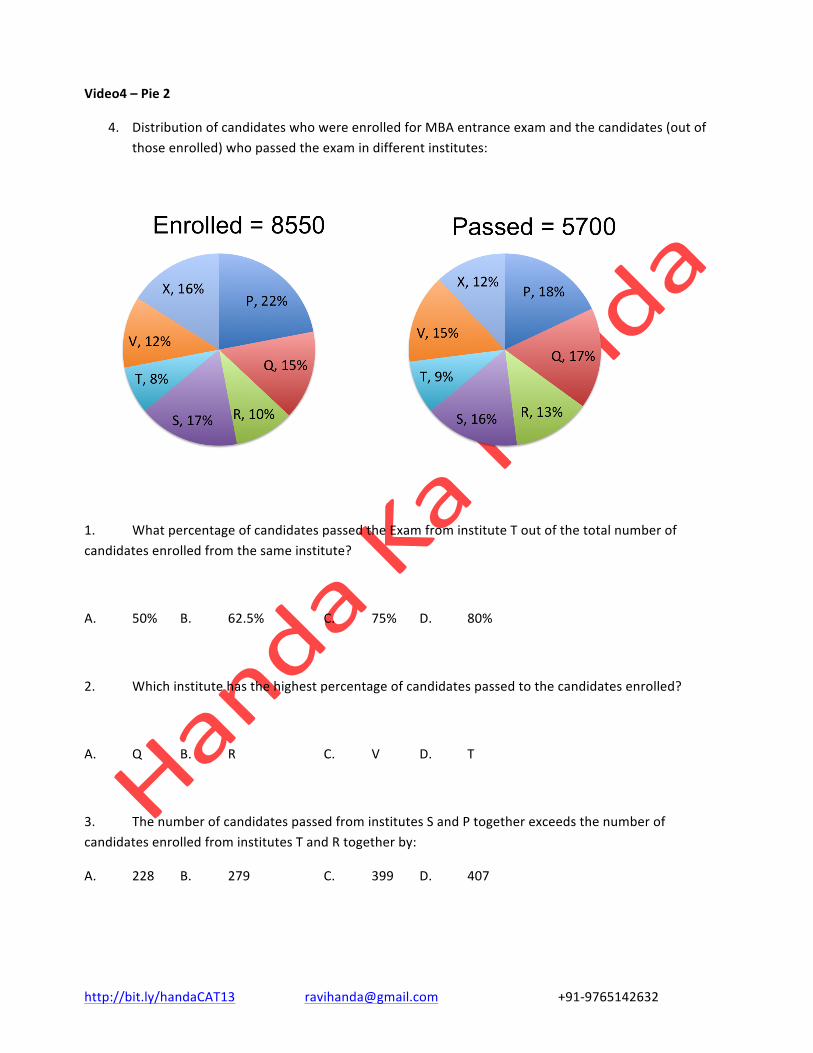
4. Distribution of candidates who were enrolled for MBA entrance exam and the candidates (out of those enrolled) who passed the exam in different institutes:
1. What percentage of candidates passed the Exam from institute T out of the total number of candidates enrolled from the same institute?
A. 50% B. 62.5% C. 75% D. 80%
2. Which institute has the highest percentage of candidates passed to the candidates enrolled?
A. Q B. R C. V D. T
3. The number of candidates passed from institutes S and P together exceeds the number of candidates enrolled from institutes T and R together by:
A. 228 B. 279 C. 399 D. 407

http://bit.ly/handaCAT13 [email protected] +91-‐9765142632
4. What is the percentage of candidates passed to the candidates enrolled for institutes Q and R together?
A. 68% B. 80% C. 74% D. 65%

http://bit.ly/handaCAT13 [email protected] +91-‐9765142632
Video5 – Bar 1
5. What is the ratio of candidates passed to the candidates enrolled from institute P?
A. 9 : 11 B. 14 : 17 C. 6 : 11 D. 9 : 17
Purana and Naya are two brands of kitchen mixer grinders available in the local market. Purana is an old brand that was introduced in 1990, while Naya was introduced in 1997. For both these brands, 20% of the mixer grinders bought in a particular year are disposed off as junk exactly two years later. It is known that 10 Purana mixer-‐grinders were disposed off in 1997. The following figures show the number of Purana and Naya mixer-‐ grinders in operation from 1995 to 2000, as at the end of the year.
1. How many Naya mixer-‐grinders were purchased in 1999?
a. 44 b. 50 c. 55 d. 64 e. 66
2. How many Naya mixer-‐grinders were disposed off by the end of 2000?
a. 10 b. 16 c. 22 d. 26 e. Cannot be determined
3. How many Purana mixer-‐grinders were purchased in 1999?
a. 20 b. 23 c. 50 d. 55 e. Cannot be determined
120
162
182
222 236 236
0 0
30
80
124 134
1995 1996 1997 1998 1999 2000
Purana Naya
http://bit.ly/handaCAT13 [email protected] +91-‐9765142632
4. How many Purana mixer-‐grinders were disposed off in 2000?
a. 0 b. 5 c. 6 d. 7 e. Cannot be determined

http://bit.ly/handaCAT13 [email protected] +91-‐9765142632
Video6 – Bar 2
A management institute was established on January 1, 2000 with 3, 4, 5, and 6 faculty members in the Marketing, Organisational Behaviour (OB), Finance, and Operations Management (OM) areas respectively, to start with. No faculty member retired or joined the institute in the first three months of the year 2000. In the next four years, the institute recruited one faculty member in each of the four areas. All these new faculty members, who joined the institute subsequently over the years, were 25 years old at the time of their joining the institute. All of them joined the institute on April 1. During these four years, one of the faculty members retired at the age of 60. The following diagram gives the area-‐wise average age (in terms of number of completed years) of faculty members as one April 1 of 2000, 2001, 2002, and 2003.
1. In which year did the new faculty member join the Finance area?
a. 2000 b. 2001 c. 2002 d. 2003
2. From which area did the faculty member retire?
a. Finance b. Marketing c. OB d. OM
3. What was the age of the new faculty member, who joined the OM area, as on April 1, 2003?
a. 25 b. 26 c. 27 d. 28
49.33
50.5 50.2
45 44
51.5
49
43
45
52.5
45 44
46
47.8
46 45
40
42
44
46
48
50
52
54
Markefng OB Finance OM
2000
2001
2002
2003

http://bit.ly/handaCAT13 [email protected] +91-‐9765142632
4. Professors Naresh and Devesh, two faculty members in the Marketing area, who have been with the Institute since its inception, share a birthday, which falls on 20th November. One was born in 1947 and the other one in 1950. On April 1, 2005, what was the age of the third faculty member, who has been in the same area since inception?
a. 47 b. 50 c. 51 d. 52
http://bit.ly/handaCAT13 [email protected] +91-‐9765142632
Video7 – Line 1
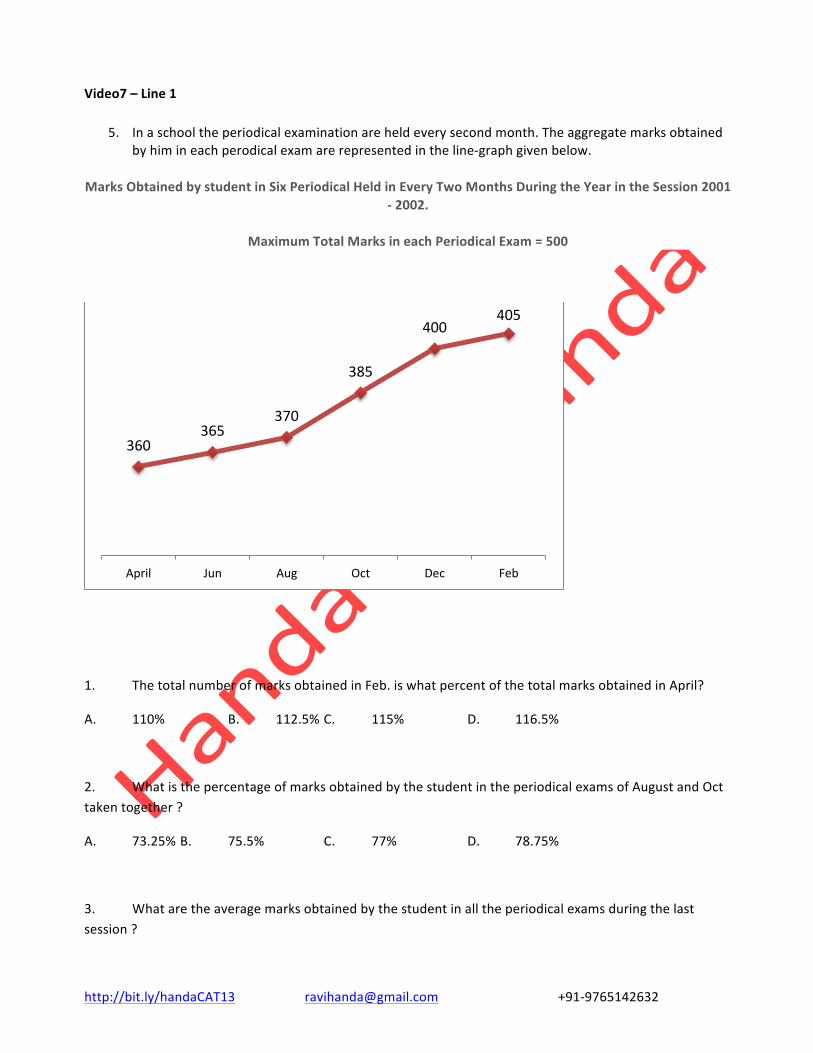
5. In a school the periodical examination are held every second month. The aggregate marks obtained by him in each perodical exam are represented in the line-‐graph given below.
Marks Obtained by student in Six Periodical Held in Every Two Months During the Year in the Session 2001 -‐ 2002.
Maximum Total Marks in each Periodical Exam = 500
1. The total number of marks obtained in Feb. is what percent of the total marks obtained in April?
A. 110% B. 112.5% C. 115% D. 116.5%
2. What is the percentage of marks obtained by the student in the periodical exams of August and Oct taken together ?
A. 73.25% B. 75.5% C. 77% D. 78.75%
3. What are the average marks obtained by the student in all the periodical exams during the last session ?
360 365
370
385
400 405
April Jun Aug Oct Dec Feb

http://bit.ly/handaCAT13 [email protected] +91-‐9765142632
Video 8 – Line 2
6. The line chart shows the revenue received, in million US Dollars (USD), from subscribers to a particular Internet service. The data covers the period 2003 to 2007 for the United States (US) and Europe. The line chart also shows the estimate revenues from the subscription to this service for the period 2008 to 2010.
1) While the subscription in Europe has been growing steadily towards that of the US, the growth rate in Europe seems to be declining. Which of the following is closest to the percent change in growth rate of 2007 (over 2006) relative to the growth rate of 2005 (over 2004)?
a. 17 b. 20 c. 35 d. 60 e. 100
2) The difference between the estimated subscription in Europe in 2008 and what it would have been if it were computed using the percentage growth rate of 2007 (over 2006), is closest to :
a. 50 b. 80 c. 20 d. 10 e. 0
0
200
400
600
800
1000
03 04 05 06 07 08 09 10
Europe
US
http://bit.ly/handaCAT13 [email protected] +91-‐9765142632
3) In 2003, sixty percent of subscribers in Europe were men. Given that woman subscribers increase at the rate of 10 percent per annum and men at the rate of 5 percent per annum, what is the approximate percentage growth of subscribers between 2003 and 2010 in Europe? The subscription prices are volatile and may change each year.
a. 62 b. 15 c. 78 d. 84 e. 50
http://bit.ly/handaCAT13 [email protected] +91-‐9765142632
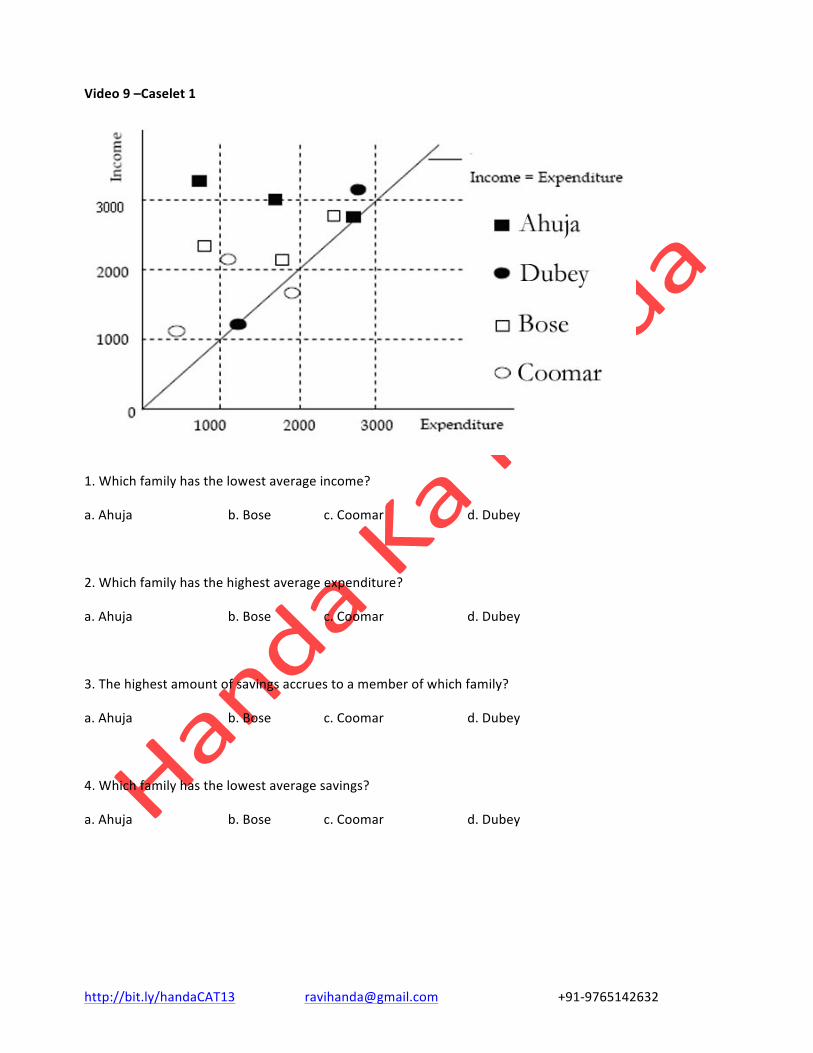
Video 9 –Caselet 1
1. Which family has the lowest average income?
a. Ahuja b. Bose c. Coomar d. Dubey
2. Which family has the highest average expenditure?
a. Ahuja b. Bose c. Coomar d. Dubey
3. The highest amount of savings accrues to a member of which family?
a. Ahuja b. Bose c. Coomar d. Dubey
4. Which family has the lowest average savings?
a. Ahuja b. Bose c. Coomar d. Dubey

http://bit.ly/handaCAT13 [email protected] +91-‐9765142632
Video 10 – Caselet 1
7. Telecom operators get revenue from tranfer of data and voice. Average revenue received from tranfer of each unit of data is known as ARDT. In the diagram below, the revenue received from data transfer as percentage of total revenue received and the ARDT in US Dollors(USD) are given for various countries.
Q.1. It was found that the volume of data transfer in India is the same as that of Singapore. Then which of the following statements is true?
a) Total revenue is the same in both countries
b) Total revenue in India is about 2 times that of Singapore
c) Total revenue in India is about 4 times that of Singapore
d) Total revenue in Singapore is about 2 times that of India
e) Total revenue in Singapore is about 4 times that of India

http://bit.ly/handaCAT13 [email protected] +91-‐9765142632
Q.2. It is expected that by 2010, revenue from india data tranfer as a percentage of total revenue will triple for India and double for Sweden. Assume that in 2010, the revenue in India is twice that of Sweden and that the volume of data transfer is the same in both the countries. What is the percentage increase of ARDT in india if there is no change in ARDT is Sweden?
a) 400 % b) 550 % c) 800% d) 950 % e) Cannot be determind
Q.3 If the total revenue is the same for the pairs of countries listed in the chocies below, choose the pair that has approximately the same volume of data tranfer.
a) Philippines and Aurtria b) Canada and Ploand c) Germany and USA
d) UK and Spain e) Denmark and Mexico

http://bit.ly/handaCAT13 [email protected] +91-‐9765142632
CRITICAL PATH VIDEO
A significant amount of traffic flows from point S to point T in the one-‐way street network shown below. Points A, B, C, and D are junctions in the network, and the arrows mark the direction of traffic flow. The fuel cost in rupees for travelling along a street is indicated by the number adjacent to the arrow representing the street.
Motorists travelling from point S to point T would obviously take the route for which the total cost of travelling is the minimum. If two or more routes have the same least travel cost, then motorists are indifferent between them. Hence, the traffic gets evenly distributed among all the least cost routes.
The government can control the flow of traffic only by levying appropriate toll at each junction. For example, if a motorist takes the route S-‐A-‐T (using junction A alone), then the total cost of travel would be Rs 14 (i.e., Rs 9 + Rs 5) plus the toll charged at junction A.
16. If the government wants to ensure that all motorists travelling from S to T pay the same amount (fuel costs and toll combined) regardless of the route they choose and the street from B to C is under repairs (and hence unusable), then a feasible set of toll charged (in rupees) at junctions A, B, C, and D respectively to achieve this goal is:
(1)2,5,3,2 (2) 0, 5, 3, 1
(3) 2, 3, 5, 1 (4)1, 3, 5, 1
17. If the government wants to ensure that no traffic flows on the street from D to T, while equal amount of traffic flows through junctions A and C, then a feasible set of toll charged (in rupees) at junctions A, B, C, and D respectively to achieve this goal is:
(1)1,5,3,3 (2) 1, 4, 4, 3
(3)1,5,4,2 (4) 0, 5, 2, 3 (5) 0, 5, 2, 2

Answer Questions 16 to 19 on the basis of the information given below:
http://bit.ly/handaCAT13 [email protected] +91-‐9765142632
18. If the government wants to ensure that all routes from S to T get the same amount of traffic, then a feasible set of toll charged (in rupees) at junctions A, B, C, and D respectively to achieve this goal is:
(1)0,5,2,2 (2) 0, 5, 4, 1
(3)1,5,3,3 (4) 1, 5, 3, 2 (5) 1, 5, 4, 2
19. If the government wants to ensure that the traffic at S gets evenly distributed along streets from S to A, from S to B, and from S to D, then a feasible set of toll charged (in rupees) at junctions A, B, C, and D respectively to achieve this goal is:
(1)0,5,4, 1 (2) 0, 5, 2, 2 (3)1,5,3,3 (4) 1, 5, 3, 2 (5) 0, 4, 3, 2
20. The government wants to devise a toll policy such that the total cost to the commuters per trip is minimized. The policy should also ensure that not more than 70 per cent of the total traffic passes through junction B. The cost incurred by the commuter travelling from point S to point T under this policy will be:
(1) Rs 7 (2) Rs 9 (3) Rs 10 (4) Rs 13 (5) Rs 14
