dhruv s karanjkar - ijser · pdf filedhruv s karanjkar . ... equipment performance, building...
TRANSCRIPT

_______________________________________________________________________________________ IJSER © 2016
http://www.ijser.org
Case study on ONGC Commercial Center BKC, Mumbai Dhruv S Karanjkar
Abstract— Though term "Green Buildings" is becoming popular these days in various events of Social awareness campaigns of
Save Environment but people are still bit skeptical to invest in the Green Buildings due to the fact that it costs more than regular
buildings but however they fail to understand that extra cost invested would be returned in one eighth to one fifth of building life
through energy savings and also it would give long term benefits in terms of maintenance also it would give an insurance to volatile
fluctuations in prices of fossil fuels. This paper is intending to show exactly same with a help of case study about the Green Building
and environmental friendly technologies used in the building. This case study is aimed at creating awareness by reflecting the
reduction in energy usage, carbon emissions and a savings by using green technologies in the building.
Keywords —Green Buildings, carbon emissions energy. environment, cost, green technologies, savings
—————————— ——————————
1. INTRODUCTION Buildings have been an evolving with complexity with
a lifetime of decades. Issues relating to the overall environmental impacts have strengthened the awareness of the role buildings play on our well-being. Continuous efforts have been made to improve all aspects of the environmental qualities of buildings (i.e. energy codes, automation & control schemes and thermal comfort etc.), however, a detailed approach in designing stages of the building are lacking, due to which the motive of the “green buildings” is not achieved to its potential.
However it is in the designing stages where the most
of opportunities are available to make the changes which will benefit the building and help it sustaining.
In last decade many methods have been developed to
determine the environmental impacts of the building and to help it in making it more environmental friendly. Many fields such as simulation of building physics, equipment performance, building materials etc. have now become a integrated part of the building designing Also research is being done in order to improve indoor air quality, reduce energy consumption, recycled content in the structural components of the building to reduce the environmental damage of the building .
LEED (Leadership in Energy & Environmental Design)
is a Green Building Rating System developed by USGBC in order to certify and promote standard for developing optimized power consumption in sustainable Buildings.
It evaluates the environmental performance from the
whole building perspective over building’s complete life cycle, which enhances the buildings retail value, importance and adds to its social value.
LEED Rating System also evaluates the building
during its construction process various different
parameters such as to, Energy consumption, reduction in carbon emissions , onsite energy generation , ecofriendly material selection to achieve the four possible levels of certification. This four are classified into Platinum, Gold, Silver and LEED certified.
Each credit in the LEED rating system consists of a
detailed description and documentation required for the projects assessment to achieve the certification by USGBC.
To compare the performance proposed designed case
of the project it has been compared with the performance of the Building that agrees with ASHRAE 90.1-2004. The energy simulation and analysis performed on the building is the process of comparison of design case with respect to base case.
2 ENERGY SIMULATIONS ONGC is located in Mumbai, which is being designed
by Architect Hafeez Contractor which is contending for LEED (Leadership in Energy & Environmental Design) NC rating by USGBC. It requires energy simulation of buildings to demonstrate energy savings in order to get LEED rating.
It is a powerful tool to determine optimum size,
engineering system, form and orientation which affects the energy consumption of overall building.
Energy performance of buildings can be improved
in designing stages itself. Hence, it becomes necessary to run energy simulation in the designing stage of the project in order to get optimum energy saving results. The energy impact of HVAC system sizing, glazing selection, envelope optimizations lighting design can minimized and so designed by using the results of energy simulation system.
International Journal of Scientific & Engineering Research, Volume 7, Issue 1, January-2016 ISSN 2229-5518
87
IJSER

_______________________________________________________________________________________ IJSER © 2016
http://www.ijser.org
For under design project estimating the annual cost
of energy associated with operating a building is difficult as it depends on many factory’s related to construction details such as efficiency of lighting, local climate profile, operating schedules ,orientations of walls and windows, HVAC systems and the equipment loading within the building.
10 potential points can be earned if the energy
performance level is above the perquisite standards. Calculations are done by comparing it with Base case. The table below highlights potential LEED credits that can be gained by maximizing the energy performance over the Base case.
With the architectural Building plans and
specifications virtual model of the building base is developed for simulation. A base case model that is similar to ASHRAE/IESNA 90.1-2004 is then compared with the design case model and accordingly changes are made to add Energy efficiency measures to case model. The eligibility criteria for LEED is determine by percentage of operation cost saving of case model.
The simulation will help in determining the
performances of the designed project and thus will help in finding out the overall effect building’s energy consumption.
.
It is not possible to find out the actual annual
energy costs required for operating a building, as it is still under construction. Many factors such as occupying density, building orientation, wall to window ratio, construction processes , HVAC systems, Lightings systems etc. will play a major role in determining the same.
The simulation is done by developing a “virtual
model” of the Building designed on the basis of architectural plans and specifications. Also a base line model has been developed that is similar to ASHRAE/IESNA 90.1-2004 The Model is then designed by necessary making changes to the Base case Model by adding the energy efficiency measures that could reduce the power consumption of the. With reduction in consumption of the annual we would be able to determine the percentage of operation cost savings of the designed model which in turn will help in determining the eligibility criterion for LEED credit points. This will be expressed in rupees per unit, which then will be compared to the rates of purchased electricity.
Table -1: LEED points rating system
Energy
Cost
Savings
LEED
Points
Energy
Cost
Savings
LEED
Points
10.5% 1 28.0% 6
14% 2 31.5% 7
17.5% 3 35.0% 8
21.0% 4 38.5% 9
24.5% 5 42.0% 10
3 PROJECT DESCRIPTION
The ONGC Mumbai consists of G + 8 floors and two basements. The proposed building has a conditioned area of approximately 3, 38,600 sq.ft. The building is being designed by “Architect Hafeez Contractor”. The services of building are being designed by AECOM MEP. The overall window wall ratio is approximately 48%.
For each floor a zoning plan was developed & data
was feed into the simulation model. Properties such, occupancy rate, outside air requirement equipment power density as lighting power density and many others. Physical properties such as of floor-to-floor height, material conductivity & fenestration area etc. were included.
Many of energy conservation methods such as
lighting controls & systems, , double glazed windows , insulation for roofs , chillers type, sizing will be added to the Base case to optimize the performance of the proposed building.
4 BASE CASE MODEL
The ASHRAE 90.1-2004 Minimally Compliant Base case model is used to benchmark the proposed design, as well as determine the LEED points.
This model is based upon the proposed design, but
the performance parameters listed above are defined to reflect the minimum efficiency levels that ASHRAE 90.1-2004 defines for various building components. These parameters are listed below.
International Journal of Scientific & Engineering Research, Volume 7, Issue 1, January-2016 ISSN 2229-5518
88
IJSER

_______________________________________________________________________________________ IJSER © 2016
http://www.ijser.org
Chart -1: Energy Consumption for
Baseline (1,000 Kwh)
5 PROPOSED DESIGN
Proposed case assumptions are based on project
drawings.
Building Envelope
Exterior wall construction: Spandrel glass with U-
value = 0.520 Btu/ hr.ft2⁰ F and 50mm glass wool insulation. Overall U-Value = 0.09 Btu/ hr.ft2⁰ F
Roof Construction: 9” thick RCC with 3” Extruded Polystyrene insulation entirely above deck, (R-15). Roof assembly U-Value = 0.054 Btu/ hr.ft2⁰ F
Window to wall ratio: 48% Fenestration properties for glazing facade(vision
area): Refer Appendix-IV Shading Devices: Automatic Roller blinds installed
at Central Atrium Lighting Equipment
An average lighting power density of 0.63 W/sqft
(Building area method) in office & 0.3W/sqft in parking
Occupancy Sensors installed in non-regularly
occupied areas Daylight control (Photo sensors) installed in
occupied perimeter spaces
Air Side HVAC System AHU system with reheat, VAV Boxes VSD’s on AHU’s
DCV, CO2 sensors installed Heat Recovery Wheel installed No Economizer
Central Plant
2 nos. Water cooled Centrifugal chillers with COP of
6.3 and 2 nos. Vapor Absorption Machine with COP of 1.0 at ARI conditions
VSD’s on Secondary pumps and Cooling towers
High efficiency pumps
Utility Rates -
Electricity
charge : Rs
7.5/Kwh
Gas : Rs
20/SCM Domestic Hot Water
Requirement – 5000 liters/day Source – Solar Panels
Chart -2: Energy Consumption Comparison
Design case vs Base Case (1,000 kWh)
41%
27%
1% 6%
10%
1% 0% 0% 14%
LightEquipmentExt. lightsPumpsFansHot WaterHeatingHeat RXNCooling
BASELINEPROPOSED
CASE
COOLING 343 178.3
HEAT RXN 5 13.4
HEATING 7 0
HOT WATER 33 0
FANS 242 133.3
PUMPS 158 103.8
EXT. LIGHTS 33 33
EQUIPMENT 696 695.7
LIGHTS 1059 557.4
0
500
1000
1500
2000
2500
3000
International Journal of Scientific & Engineering Research, Volume 7, Issue 1, January-2016 ISSN 2229-5518
89
IJSER
_______________________________________________________________________________________ IJSER © 2016
http://www.ijser.org
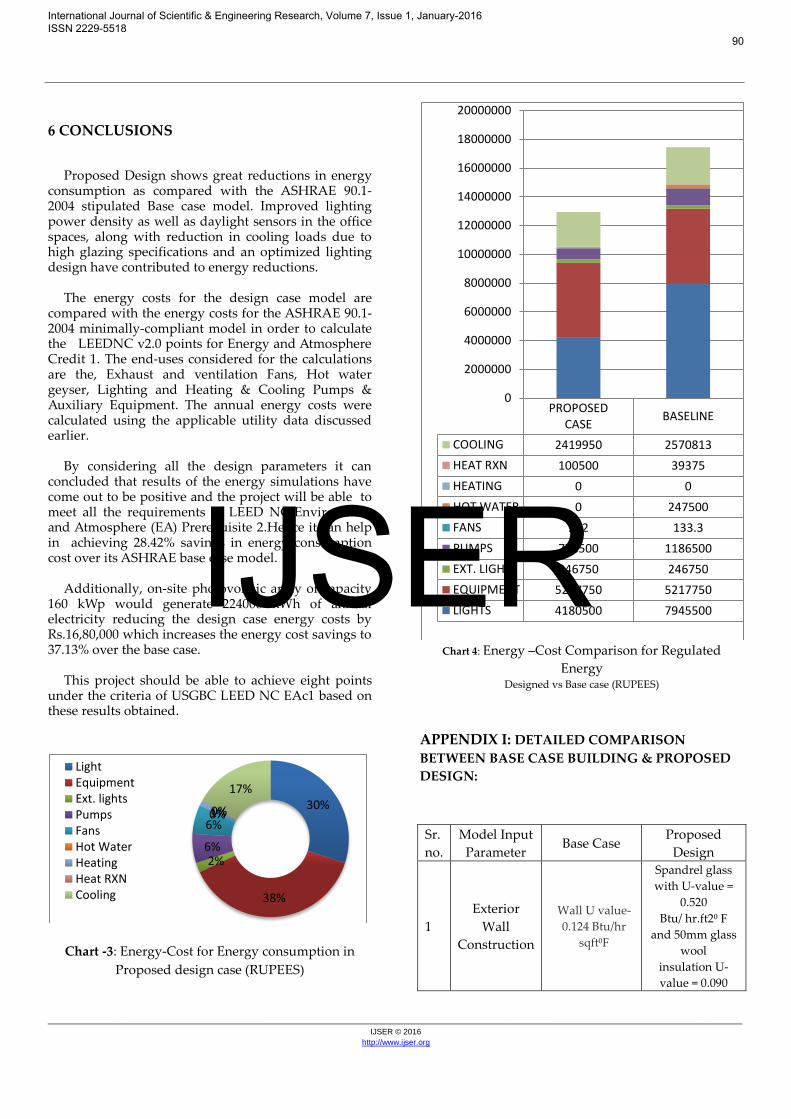
6 CONCLUSIONS
Proposed Design shows great reductions in energy
consumption as compared with the ASHRAE 90.1-2004 stipulated Base case model. Improved lighting power density as well as daylight sensors in the office spaces, along with reduction in cooling loads due to high glazing specifications and an optimized lighting design have contributed to energy reductions.
The energy costs for the design case model are
compared with the energy costs for the ASHRAE 90.1-2004 minimally-compliant model in order to calculate the LEEDNC v2.0 points for Energy and Atmosphere Credit 1. The end-uses considered for the calculations are the, Exhaust and ventilation Fans, Hot water geyser, Lighting and Heating & Cooling Pumps & Auxiliary Equipment. The annual energy costs were calculated using the applicable utility data discussed earlier.
By considering all the design parameters it can
concluded that results of the energy simulations have come out to be positive and the project will be able to meet all the requirements of LEED NC-Environment and Atmosphere (EA) Prerequisite 2.Hence it can help in achieving 28.42% savings in energy consumption cost over its ASHRAE base case model.
Additionally, on-site photovoltaic array of capacity
160 kWp would generate 224000 kWh of annual electricity reducing the design case energy costs by Rs.16,80,000 which increases the energy cost savings to 37.13% over the base case.
This project should be able to achieve eight points
under the criteria of USGBC LEED NC EAc1 based on these results obtained.
Chart -3: Energy-Cost for Energy consumption in Proposed design case (RUPEES)
Chart 4: Energy –Cost Comparison for Regulated
Energy Designed vs Base case (RUPEES)
APPENDIX I: DETAILED COMPARISON
BETWEEN BASE CASE BUILDING & PROPOSED
DESIGN:
Sr.
no.
Model Input
Parameter Base Case
Proposed
Design
1
Exterior
Wall
Construction
Wall U value-
0.124 Btu/hr
sqft⁰F
Spandrel glass
with U-value =
0.520
Btu/ hr.ft2⁰ F
and 50mm glass
wool
insulation U-
value = 0.090
30%
38%
2% 6%
6% 0% 1% 0%
17%
LightEquipmentExt. lightsPumpsFansHot WaterHeatingHeat RXNCooling
PROPOSEDCASE
BASELINE
COOLING 2419950 2570813
HEAT RXN 100500 39375
HEATING 0 0
HOT WATER 0 247500
FANS 242 133.3
PUMPS 778500 1186500
EXT. LIGHTS 246750 246750
EQUIPMENT 5217750 5217750
LIGHTS 4180500 7945500
0
2000000
4000000
6000000
8000000
10000000
12000000
14000000
16000000
18000000
20000000
International Journal of Scientific & Engineering Research, Volume 7, Issue 1, January-2016 ISSN 2229-5518
90
IJSER

_______________________________________________________________________________________ IJSER © 2016
http://www.ijser.org
2 Roof
Construction
Insulation
entirely above
deck, U
value-0.063
Btu/hr sqft⁰F
9” thick RCC
with 3”
Extruded
Polystyrene
insulation
entirely above
deck, (R-15) U-
value = 0.054
3 Glazing U Value: 1.22
Btu/hrsqft°F
SC (All) :0.29
As per
Appendix- IV
4 Shading
Device None
Roller blinds
installed at
Central Atrium
5 Window
Wall Ratio 40% 48%
6
Lighting
Power
Density
An average
LPD of 1.0
W/sqft(Building
Area Method)
in
Office &
0.3W/sqft in
parking
An average LPD
of 0.63
W/sqft(Building
Area Method) in
Office &
0.2W/sqft in
parking
7 Occupancy
sensors None
Installed in non-
regularly
occupied areas
8 Daylight
Sensors None
Installed in
occupied per
space
9 Chiller
Parameter
Water cooled
Centrifugal
Chillers,
COP 6.1
2 nos. Water
cooled
Centrifugal
Chillers, COP
6.3 and 2 no.
Vapour
Absorption
Machine, COP-
1.0
APPENDIX II
FENESTRATION PROPERTIES FOR
GLAZING FACADE (VISION AREA):
Energy Cost
Savings
U-
value
(W/sq
m K)
SC SHGC VLT
Central
Atrium 2.78 0.91 0.79 79%
East & West
(Vision panel) 1.76 0.26 0.23 31%
East & West
(Spandrel
panel)
5.8 0.52 0.45 33%
North &
South
(Vision
panel)
1.76 0.26 0.23 31%
North &
South
(Spandrel
panel)
5.8 0.52 0.45 33%
Side Atrium
(Vision
panel)
1.70 0.44 0.38 58%
Side Atrium
(Spandrel
panel)
1.70 0.44 0.38 58%
7. FUTURE SCOPE Though this case study broadly glorifies the benefits of
the Green Building and its pivotal role in reducing the
carbon emissions in the environmental atmosphere,
this case study still has a great depth to be discovered
in terms of detailed analysis of green technologies
used in the building. Also there happens to be a lot of
scope in finding the cost and return on investment
period. There are few researchers who are working on
to conclude that the investment made on the green
technologies of the building may yield more returns
than fixed deposits in banks during the life cycle of the
building.
Millions of square feet of spaces are being generated
every year which relies heavily on the power
generated by the thermal power plants. This
dependency on conventional energies needs to be
reduced drastically in order to preserve earth’s
environment. Hence green building agencies need to
promote new and green technologies. Other than that,
there seems to be a lot of voids in the will of
government of India to promote green technologies.
International Journal of Scientific & Engineering Research, Volume 7, Issue 1, January-2016 ISSN 2229-5518
91
IJSER

_______________________________________________________________________________________ IJSER © 2016
http://www.ijser.org
8 ACKNOWLEDGEMENTS
I am profoundly grateful to Prof. Tejaswini D.N. for
her expert guidance and continuous encouragement
throughout to see that this case study rights its target.
I thank Mr Vipul Jain for providing us with an
opportunity to conduct a case study at their upcoming
commercial office. I would also like to thank Mr
Swapnil Joshi for his undivided attention in helping us
throughout the complete case study.
9 REFERENCES
Websites:
http://www.scribd.com/doc/23231709/technical-paper-
green-buildings
http://www.documents.dgs.ca.gov/dgs/pio/facts/LA%
20workshop/climate.pdf css.snre.umich.edu
http://www.ijsrp.org/research-paper-0214/ijsrp-
p26103.pdf
http://www.expresstowers.in/images/whitepapers/311
22010120058.pdf
http://green.answers.com/building/what-is-a-green-
roof-or-eco-roof
http://www.globaltech.ae/ https://energydesignresources.com/
https://www.scottsdaleaz.gov/Assets/Public+Website/
greenbuilding/EnviroBldClass.pdf
http://www.vmerealty.com/
Research Papers:
OPTIMAL DESIGN OF ENERGY EFFICIENT
IT PARK BUILDING -- A CASE STUDY
By: Velan, Chidambaranathan and Partheeban,
Pachaivannan. "
ENERGY CONSERVATION: INDIAN SCENARIO
AND GREEN BUILDING CONCEPT
By: Jay Prakash, Scientist ‘C’, CCE(R&D)North, New
Delhi
GREEN BUILDING ARCHITECHTURE: DESIGNING
TECHNIQUES
By Kushagra Varma, Mayank Chaurasia, Prasenjit
Shukla, Tariq Ahmed
(Students, Architecture & Planning, MANIT, Bhopal
(M.P), India)
GREEN BUILDINGS IN INDIA: A ROAD AHEAD
FOR SUSTAINABLE ENVIRONMENT
By: Rakhshanda F Fazli&Rashid Aziz Farid
PROMOTING ECOSYSTEM & HUMAN HEALTH IN
URBAN AREAS USING GREEN INFRASTRUCTURE
By: Konstantinos Tzoulas, Kalevi Korpela, Stephen
Venn, Philip James, Jari Niemela,
AleksandraKaźmierczak
(University of Finland)
BIOGRAPHY
Er Dhruv S Karanjkar
B.E. Civil
Rizvi College of Engineering (University of Mumbai)
International Journal of Scientific & Engineering Research, Volume 7, Issue 1, January-2016 ISSN 2229-5518
92
IJSER