dhanuka agritechlimited is the second largest indian agrochemicals formulation company in domestic...
TRANSCRIPT
Un-audited Financial Results for the
Quarter and Nine Months ended 14th February, 2018
Dhanuka Agritech Limited
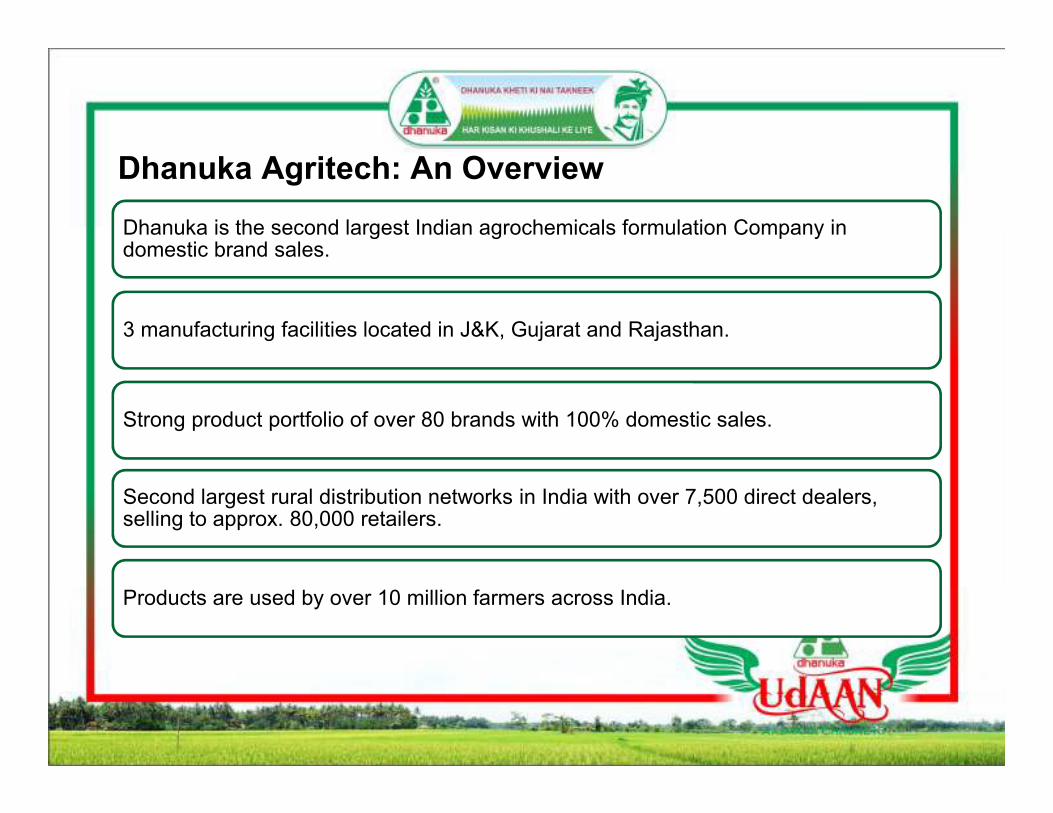
Dhanuka is the second largest Indian agrochemicals formulation Company in domestic brand sales.
3 manufacturing facilities located in J&K, Gujarat and Rajasthan.
Strong product portfolio of over 80 brands with 100% domestic sales.
Second largest rural distribution networks in India with over 7,500 direct dealers, selling to approx. 80,000 retailers.
Products are used by over 10 million farmers across India.
Dhanuka Agritech: An Overview
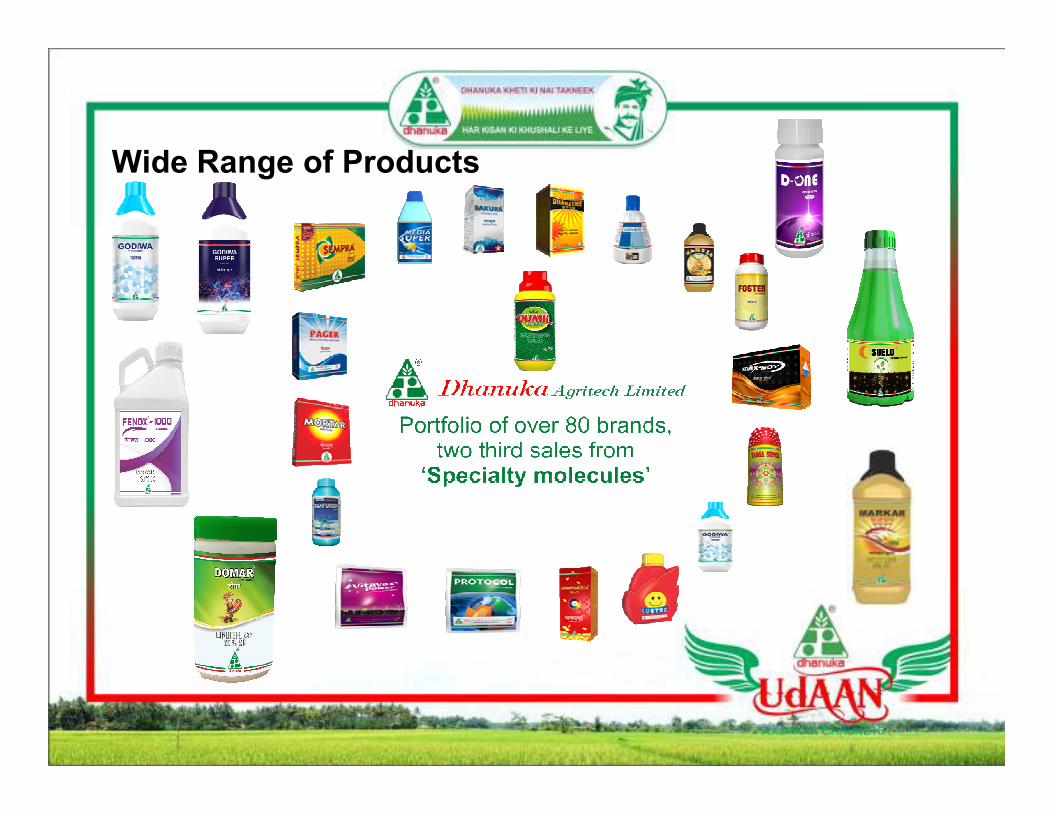
Wide Range of Products
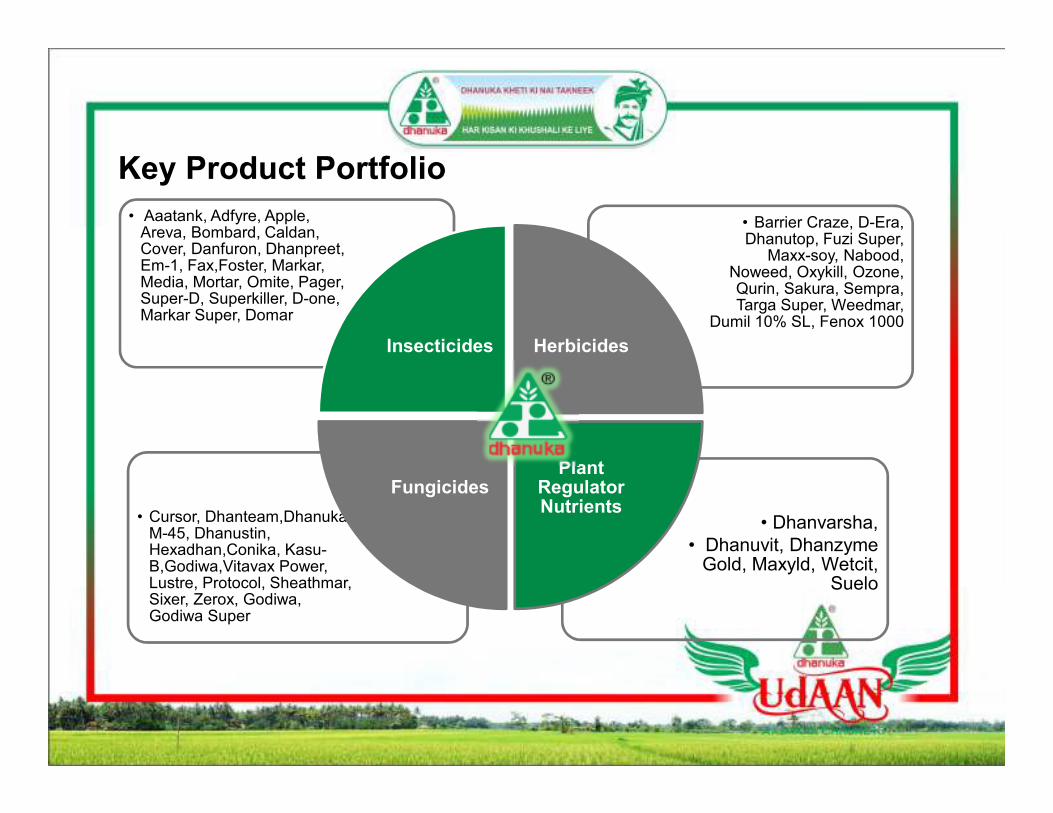
Key Product Portfolio
• Dhanvarsha,
• Dhanuvit, DhanzymeGold, Maxyld, Wetcit,
Suelo
• Cursor, Dhanteam,DhanukaM-45, Dhanustin, Hexadhan,Conika, Kasu-B,Godiwa,Vitavax Power, Lustre, Protocol, Sheathmar, Sixer, Zerox, Godiwa, Godiwa Super
• Barrier Craze, D-Era, Dhanutop, Fuzi Super,
Maxx-soy, Nabood, Noweed, Oxykill, Ozone, Qurin, Sakura, Sempra, Targa Super, Weedmar,
Dumil 10% SL, Fenox 1000
• Aaatank, Adfyre, Apple, Areva, Bombard, Caldan, Cover, Danfuron, Dhanpreet, Em-1, Fax,Foster, Markar, Media, Mortar, Omite, Pager, Super-D, Superkiller, D-one, Markar Super, Domar
Insecticides Herbicides
Plant Regulator Nutrients
Fungicides

Strategic Partnerships
Nissan Chemical
Japan
Sumitomo
Chemical
Japan
Arysta Life Science
Hokko Chemical
Japan
FMC Corporation
USADUPONT
USA
The Company enjoys long standing relationships with its global partners.
Most of the relationships have been active for more than a decade.
Mitsui Chemicals
Inc.
Japan
ORO AGRI
USA
Oat Agri Japan
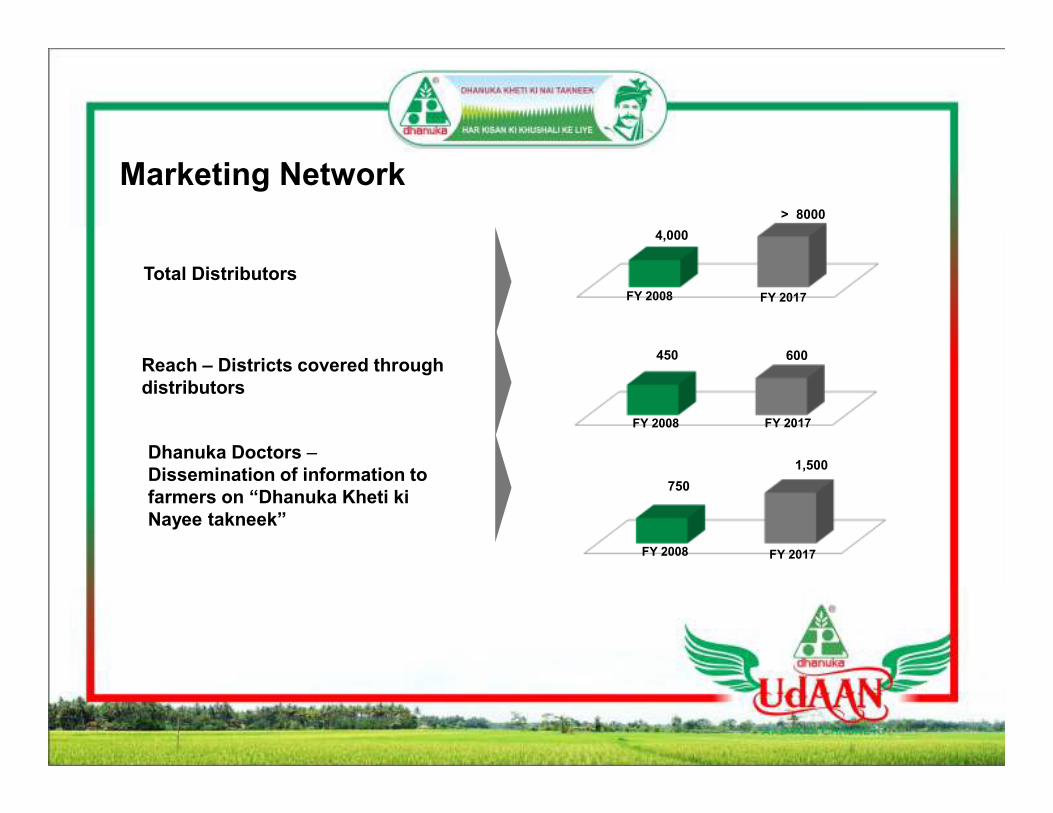
Marketing Network
Products are used by over 10 million farmers across India
4,000
> 8000
Total Distributors
Reach – Districts covered through
distributors
450 600
750
1,500 Dhanuka Doctors –
Dissemination of information to
farmers on “Dhanuka Kheti ki
Nayee takneek”
FY 2008 FY 2017
FY 2008 FY 2017
FY 2008 FY 2017

Key Growth Drivers (1/2)
• Governmentguaranteedminimum pricesfor the majorityof crops haveincreased by 30-110% in the pastseven yearsgiving thrust torural incomes
Manifold
increase
in rural
income
• One of thelowestconsumptionlevels in theworld, at ~0.5 kgper hectare
Low
level consumpti
on of plant-
protection chemicals
in India
Source: Reply to unstarred question no.3732 by the Union Minister in Loksabha, 10 Sept, 2007
and the report of Joint Parliamentary Committee, 14-2-2004
0
4
8
12
Consumption of Agrochemicals (Kg / Hectare)
Minimum Support Prices India
Crop Marketing Season (Price in INR/quintal)
Commodity 2011-12 2012-13 2013-14 2014-15 2015-16 2016-17 2017-18
% increase
from FY12 to
FY18
Paddy 1,080 1,250 1,310 1,360 1,410 1460 155043.52%
Red Gram
(Arhar/Tur)3,200 3,850 4,300 4,350 4,625 4800 5450
70.31%
Green Gram
(Moong)3,500 4,400 4,500 4,600 4,850 4900 5575
59.29%
Black Gram
(Urad)3,300 4,300 4,300 4,350 4,625 4800 5400
63.64%
Groundnut 2,700 3,700 4,000 4,000 4,030 4100 445064.81%
Soyabean 1,690 1,690 2,560 2,560 2,600 2650 305080.47%
Cotton 2,800 3,600 3,700 3,750 3,800 3850 402043.57%
Wheat 1,285 1,350 1,400 1,450 1,450 1500 162526.46%

Key Growth Drivers (2/2) • Insects, fungus and
weeds destroy cropsworth billions of dollarsannually
• Despite large area under cultivation of paddy and wheat, we lag behind in total production
Prevention of large crop wastages
• Herbicides share inIndia quite low at20%, versus ~ 48%globally
• Rising farm labourprices are lifting herbicide demand; replacing manual weeding
• Dhanuka is a beneficiary with strong herbicides portfolio
Disruptive growth in herbicides
Source: Varshney, 2009
Category
Area
(Mn Ha)
World
Ranking
In Area
Production
(Mn tons)
World
Ranking
In Production
Paddy 44 #1 91 #2
Wheat 28 #1 74 #2
Maize 8 #4 14 #6
Gram 8 #1 6 #1
Red Gram 4 #1 3 #1
Soybean 8 #5 9.0 #5
Cotton 9 #1 21 #2
Sugarcane 5 #2 323 #2
InsecticideFungicide
sHerbicides Others
India 62% 16% 20% 2%
Global 23% 26% 48% 3%
0%
20%
40%
60%
80%
Break-up of agrochemical consumption (2009)
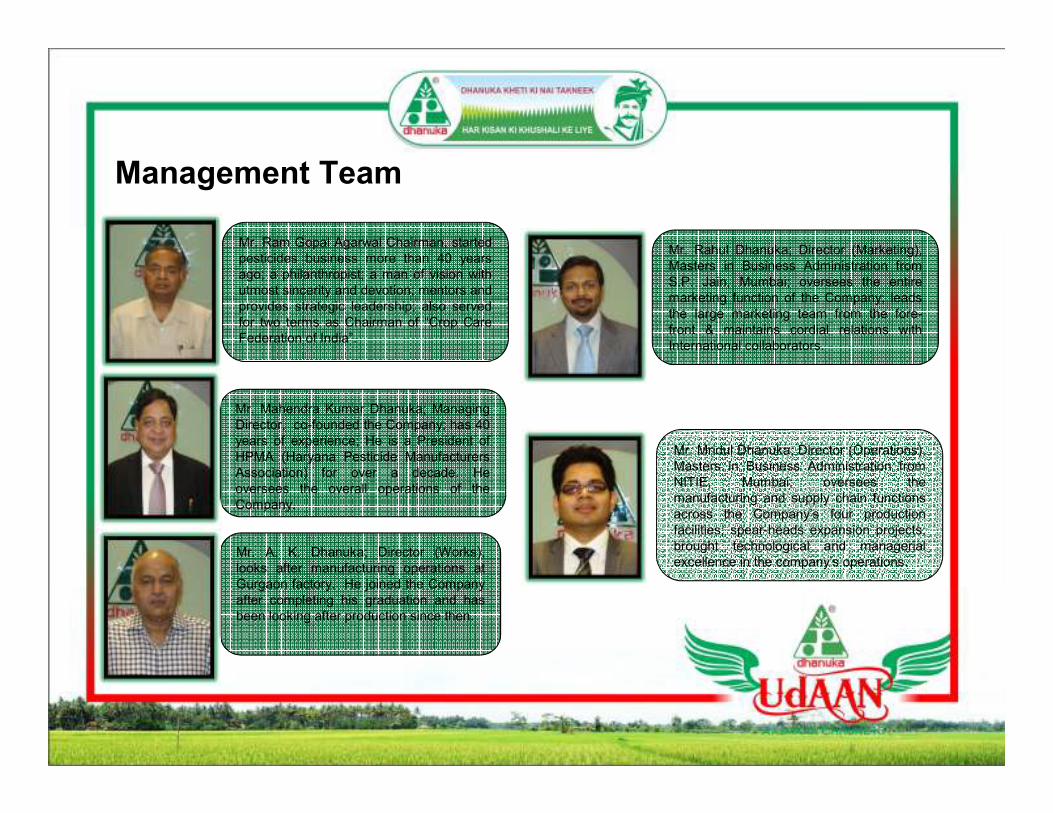
Mr. Ram Gopal Agarwal Chairman, started
pesticides business more than 40 years
ago; a philanthropist; a man of vision with
utmost sincerity and devotion; mentors and
provides strategic leadership; also served
for two terms as Chairman of “Crop Care
Federation of India”.
Mr. Mahendra Kumar Dhanuka; Managing
Director, co-founded the Company; has 40
years of experience; He is a President of
HPMA (Haryana Pesticide Manufacturers
Association) for over a decade. He
oversees the overall operations of the
Company.
Mr. Rahul Dhanuka; Director (Marketing),
Masters in Business Administration from
S.P. Jain, Mumbai; oversees the entire
marketing function of the Company; leads
the large marketing team from the fore-
front & maintains cordial relations with
International collaborators.
Mr. Mridul Dhanuka; Director (Operations),
Masters in Business Administration from
NITIE, Mumbai; oversees the
manufacturing and supply chain functions
across the Company’s four production
facilities; spear-heads expansion projects;
brought technological and managerial
excellence in the company’s operations.Mr. A. K. Dhanuka; Director (Works),
looks after manufacturing operations at
Gurgaon factory. He joined the Company
after completing his graduation and has
been looking after production since then.
Management Team
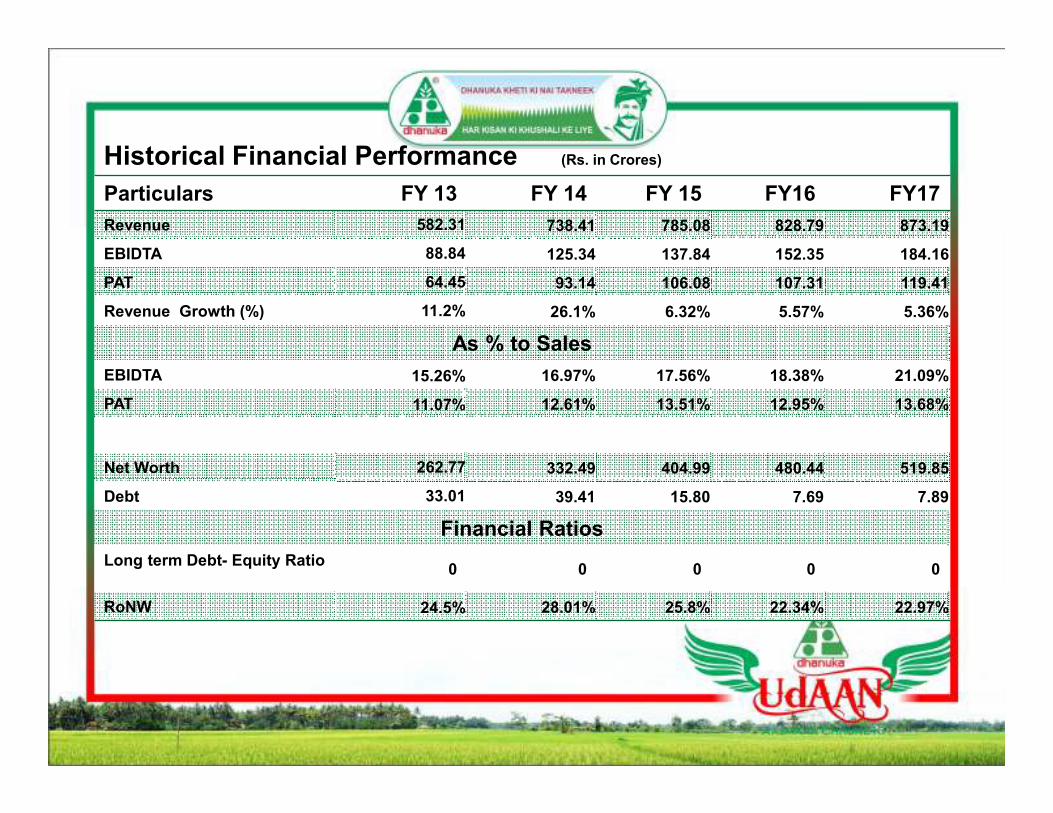
Historical Financial Performance (Rs. in Crores)
Particulars FY 13 FY 14 FY 15 FY16 FY17
Revenue 582.31 738.41 785.08 828.79 873.19
EBIDTA 88.84 125.34 137.84 152.35 184.16
PAT 64.45 93.14 106.08 107.31 119.41
Revenue Growth (%) 11.2% 26.1% 6.32% 5.57% 5.36%
As % to Sales
EBIDTA 15.26% 16.97% 17.56% 18.38% 21.09%
PAT 11.07% 12.61% 13.51% 12.95% 13.68%
Net Worth 262.77 332.49 404.99 480.44 519.85
Debt 33.01 39.41 15.80 7.69 7.89
Financial Ratios
Long term Debt- Equity Ratio0 0 0 0 0
RoNW 24.5% 28.01% 25.8% 22.34% 22.97%

Historical Financial Performance
0
200
400
600
800
1000
529.18 582.31738.41 785.06 828.79 873.19
Revenue (Rs. In Crores)
0
20
40
60
80
100
120
57.1364.45
93.14106.08 107.31
119.41
PAT (Rs. In Crores)
0
100
200
300
400
500
600
214.6262.77
332.49
404.98
480.44519.85
Net Worth (Rs. In Crores)
0
5
10
15
20
25
11.4212.88
18.6221.22 21.45
23.88
EPS (in Rs.)
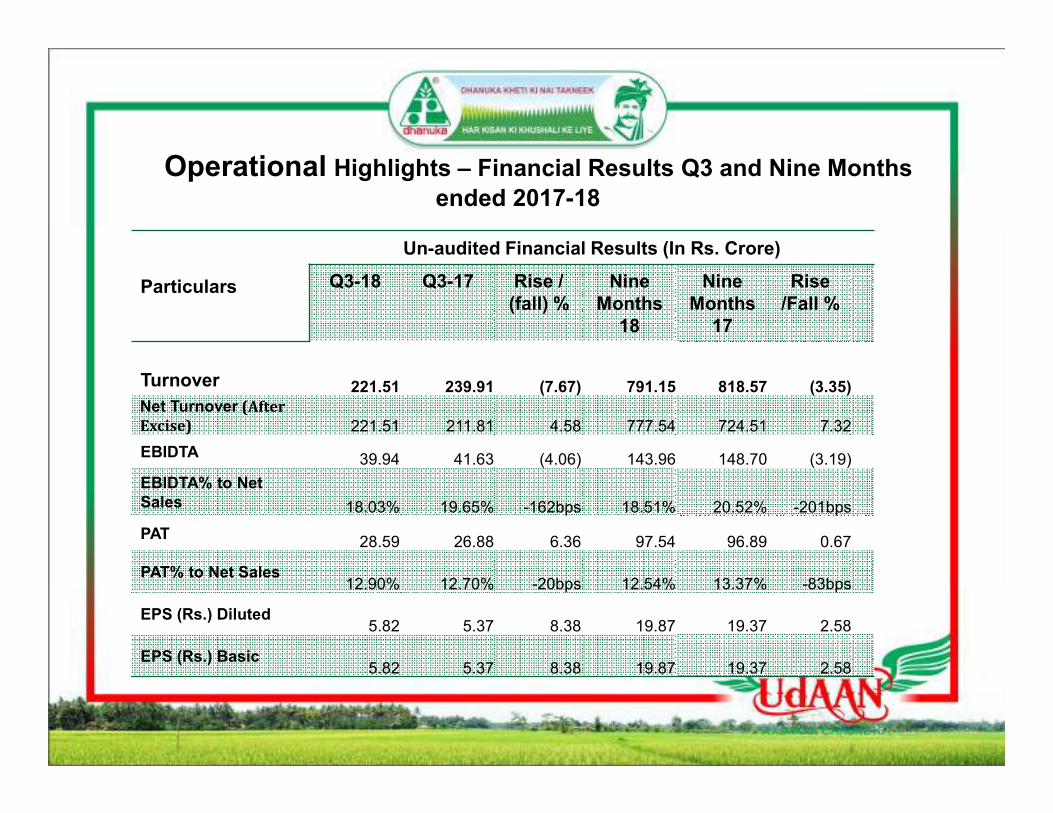
Operational Highlights – Financial Results Q3 and Nine Months
ended 2017-18
Particulars
Un-audited Financial Results (In Rs. Crore)
Q3-18 Q3-17 Rise /
(fall) %
Nine
Months
18
Nine
Months
17
Rise
/Fall %
Turnover 221.51 239.91 (7.67) 791.15 818.57 (3.35)
Net Turnover (After
Excise) 221.51 211.81 4.58 777.54 724.51 7.32
EBIDTA 39.94 41.63 (4.06) 143.96 148.70 (3.19)
EBIDTA% to Net
Sales 18.03% 19.65% -162bps 18.51% 20.52% -201bps
PAT28.59 26.88 6.36 97.54 96.89 0.67
PAT% to Net Sales12.90% 12.70% -20bps 12.54% 13.37% -83bps
EPS (Rs.) Diluted 5.82 5.37 8.38 19.87 19.37 2.58
EPS (Rs.) Basic 5.82 5.37 8.38 19.87 19.37 2.58

Products launched
FY 2016-17 FY 2017-18
MAXX-SOY(Herbicide) Godiwa Super (Fungicide)
CONIKA (Fungicide) Godiwa (Fungicide)
FUJITA (Fungicide) D-One (Insecticide)
HI-DICE SUPER (Fungicide)Markar Super (Insecticide)
BULLON (Insecticide)Dumil 10% SL (Herbicide)
AASHITO (Insecticide)DOMAR (Insecticide)
DELIGHT (Fungicide)FENOX 1000 (Herbicide)
SUELO (Soil Conditioner)

THANK
YOU!!