dhading - central bureau of statistics
TRANSCRIPT
Volume 06, NPHC2011
National Population and Housing Census 2011
(Village Development Committee/Municipality)
DHADING
Government of Nepal
National Planning Commission Secretariat
Central Bureau of Statistics
Kathmandu, Nepal
March, 2014

Preface
Central Bureau of Statistics (CBS) Nepal is pleased to bring out the series of results of the
National Population and Housing Census 2011 (NPHC 2011). The final result of this census
was disseminated in November 2012. Additional national level and disaggregated tables
are still under way to disseminate. In fact, the census has enormous potentiality of analyses
to be done on demographic, social, economic and spatial characteristics of the population.
This report contains statistical tables derived from the questions maintain in 'Form 2' which
is administered in sampling basis. Attempt has also been made herein to provide major
highlights of the result. I hope, this volume will be very useful and meet the demand of the
users related to the information on migration, fertility pattern of child bearing aged married
women and economic activities of the population aged 10 years and over. CBS always
welcomes comments and suggestions from users which would be valuable for the
improvement of our future publications.
On this occasion, I would like to thank Dr. Rudra Suwal, Chief of the Population Section of
the bureau for his valuable contribution in the census. I also would like to thank Director
Gyanendra Bajracharya and Statistical Officer Yadu Nath Acharya of the Section for their
contribution in the operation from preparatory works to the management of the field work,
data processing, data analysis, preparation and dissemination of the report. Hearty thanks
go to Computer Officer Dol Narayan Shrestha for his valuable contribution in preliminary
work of data processing, analysis and tabulation. I want to thank ex‐Director Damodar
Gnawali, Directors Indra Bahadur Karki and Mahesh Chand Pradhan, Statistical Officers Dina
Nath Lamsal, Sunil Kumar Shrestha and Statistical Assistant Bimal Bhattarai for handling
census administration and data processing. I also appreciate Statistical Officer Prakash
Pokharel and Cartographer Officer Damodar Dahal who sincerely fulfilled the responsibilities
mainly of logistics management and transportation of census materials to and from districts.
Director Shanker Lal Shrestha and a team of Computer Officers Lila Nath Pandey, Suresh
Prasad Kayastha, Shyam Prasad Neupane and Raju Pokhrel were devoted in data processing
and tabulation. Similarly, Directors of the GIS Section Pramod Raj Regmi and Shailendra
Ghimire, Statistical Officer Binod sharan Acharya and Computer Officer Puspa Poudel had
contributed in producing Enumeration Area (EA) maps. They all deserve special thanks.
I would like to thank Mr. Uttam Narayan Malla, the outgoing DG, for his overall guidance
and contribution in various census activities.
I would like to thank Mr. Suman Raj Aryal, DDG and Director Mr. Nebin Lal Shrestha who
contributed in various stages of the census operation particularly in data verification.
Also, I am thankful to Mr. Prabodh Sagar Dhakal, the then DDG, under‐secretaries of the
bureau, Ram Bahadur Ghimire, Krishna Rana and Jib Narayan Baral, and Section Officers

Narayan Bhandari, Kiran Raut, Shanker Khanal and Nayab Subba Rishi Kesh Timilsina who
did handle administrative, financial matters and census procurement. I would like to thank
all Census Officers, Area Supervisors, Supervisors, Enumerators, member of Census
Management Groups, staff of CBS and Branch Statistics Offices (BSOs) who were actively
engaged in the field work and other census activities. Also, I would like to thank all members
of District Census Coordination Committees led by respective Chief District Officer in all
districts for their contribution in successfully completing the challenging job of field
operation of the census.
Special thanks go to Siddhakali Offset Press who took responsibility of printing census
questionnaires and manuals. Also, HDNCG, PHDG & OBCI JV deserves special thanks for
undertaking the data procession operation.
I am grateful to all media including telecommunication centers (Nepal Telecom and NCELL)
and Civil bank who contributed in raising census awareness among the mass.
I would like to thank all school teachers, government staff of various ministries,
departments and offices and also university students who contributed in data collection and
supervision of the field work.
Also, I appreciate and would like to thank the members of the National Census 2011 Citizens
Observation Committee who did observe the fieldwork in all 75 districts.
I express my gratitude to UNFPA, UNWOMEN, JICA, UNDP, DANIDA, US Census Bureau and
other international experts who provided assistance in different stages of the census
operation.
Finally, I would like to thank all respondents who provided invaluable information during the
field operation and appreciate all those who had extended hands in this national endeavor
and helped to make the census a grand success.
March, 2014
Bikash Bista
Director General
Central Bureau of Statistics
Kathmandu, Nepal
Content Dhading
Table no. Title Page no.
1. Household Tables
Table 1.1: Households by ownership of house/housing unit In use ................................. 1
Table 1.2: Households by foundation of house/housing unit ........................................... 2
Table 1.3: Households by outer wall of house/housing unit ............................................. 3
Table 1.4: Households by roof of house/housing unit ...................................................... 4
Table 1.5: Households by source of drinking water .......................................................... 5
Table 1.6: Households by usual type of fuel used for cooking .......................................... 7
Table 1.7: Households by usual source of lighting ............................................................ 9
Table 1.8: Households by type of toilet ........................................................................... 10
Table 1.9: Households by types of household facilities .................................................. 12
Table 1.10: Absentee population and household ............................................................. 14
2. Individual Tables
Table 2.1: Households, population and average household size .................................... 15
Table 2.2: Population by 5 years age group and sex ....................................................... 17
Table 2.3: Population by caste/ethnicity and sex ............................................................ 24
Table 2.4: Population by mother tongue and sex ........................................................... 39
Table 2.5: Population by disability and sex ..................................................................... 47
Table 2.6: Population aged 5 years and above by literacy status and sex ...................... 52
Table 2.7: Population aged 5 years and above by educational attainment (level passed) and sex ............................................................................................................ 57
Table 2.8: Population aged 5 ‐ 25 years by school attendance and sex .......................... 65


Household Tables


DhadingTable 1.1: Households by ownership of house/housing unit In use.
Owned Rented Institutional Others
Aginchok 873 862 4 1 6Baireni 2,795 2,374 373 14 34Baseri 859 854 2 0 3Benighat 2,123 1,676 390 23 34Bhumesthan 2,145 1,987 145 3 10Budhathum 866 846 17 0 3Chainpur 1,514 1,488 10 1 15Chhatredeurali 1,655 1,599 32 3 21Darkha 1,121 1,092 22 0 7Dhola 998 985 9 1 3Dhussa 1,361 1,264 78 4 15Dhuwakot 1,063 1,042 18 0 3Gajuri 2,223 1,713 452 23 35Goganpani 1,133 1,101 26 0 6Gumdi 1,109 1,077 24 0 8Jeewanpur 1,920 1,862 36 4 18Jharlang 770 756 14 0 0Jogimara 1,442 1,362 71 2 7Jyamrung 1,653 1,613 28 1 11Kalleri 1,921 1,888 13 2 18Katunje 1,425 1,383 31 0 11Kewalpur 1,104 1,083 9 1 11Khalte 1,566 1,544 12 1 9Khari 1,051 1,028 11 2 10Kiranchok 1,163 1,152 4 0 7Kumpur 2,122 2,068 37 3 14Lapa 853 834 11 2 6Mahadevsthan 1,243 1,210 24 3 6Maidi 2,167 2,138 24 0 5Marpak 849 819 30 0 0Mulpani 749 734 8 0 7Murali Bhanjyang 1,673 1,600 59 1 13Nalang 1,876 1,833 30 0 13Naubise 3,184 2,847 293 20 24Nilkantha 5,255 3,040 2,088 85 42Phulkharka 920 887 5 1 27Pida 2,214 2,051 133 13 17Ree Gaun 1,110 1,105 4 1 0Salang 1,140 1,130 7 1 2Salyankot 1,123 1,096 10 1 16Salyantar 1,791 1,673 89 4 25Sangkosh 1,244 1,181 51 0 12Satyadevi 760 727 25 0 8Semjong 847 841 5 0 1Sertung 817 801 11 4 1Sunaula Bazar 1,530 1,502 14 1 13Tasarpu 1,098 1,016 36 1 45Thakre 2,141 1,699 364 7 71Tipling 464 462 1 1 0Tripureswor 819 781 34 0 4Total 73,842 67,706 5,224 235 677
Ownership of house/housing unitTotalV.D.C. / Municipality
1

DhadingTable 1.2: Households by foundation of house/housing unit.
Mud bonded bricks/stone
Cement bonded
bricks/stone
RCC with pillar
Wooden pillar Others Not
Stated
Aginchok 873 838 7 7 16 2 3Baireni 2,795 2,208 162 338 25 34 28Baseri 859 853 1 0 0 0 5Benighat 2,123 1,352 241 379 124 20 7Bhumesthan 2,145 1,955 62 86 28 13 1Budhathum 866 850 11 0 3 1 1Chainpur 1,514 1,493 7 1 9 1 3Chhatredeurali 1,655 1,613 25 4 10 1 2Darkha 1,121 1,110 2 0 0 0 9Dhola 998 989 0 0 6 0 3Dhussa 1,361 892 153 37 268 1 10Dhuwakot 1,063 1,052 0 1 1 0 9Gajuri 2,223 1,381 236 364 224 4 14Goganpani 1,133 1,069 43 9 6 0 6Gumdi 1,109 1,093 6 0 8 0 2Jeewanpur 1,920 1,869 28 10 6 1 6Jharlang 770 769 0 0 0 0 1Jogimara 1,442 1,163 135 56 73 2 13Jyamrung 1,653 1,627 2 1 18 0 5Kalleri 1,921 1,888 13 0 6 2 12Katunje 1,425 1,403 14 0 5 0 3Kewalpur 1,104 1,087 8 2 1 1 5Khalte 1,566 1,561 2 0 2 0 1Khari 1,051 980 0 1 65 1 4Kiranchok 1,163 1,130 3 0 6 3 21Kumpur 2,122 2,012 43 27 19 0 21Lapa 853 830 1 0 14 0 8Mahadevsthan 1,243 820 7 4 408 1 3Maidi 2,167 2,111 20 3 19 2 12Marpak 849 841 1 0 2 0 5Mulpani 749 739 1 1 4 1 3Murali Bhanjyang 1,673 1,577 84 0 4 0 8Nalang 1,876 1,825 6 28 2 1 14Naubise 3,184 2,629 422 79 30 7 17Nilkantha 5,255 2,149 929 2,117 19 1 40Phulkharka 920 915 3 0 1 0 1Pida 2,214 1,870 156 130 49 2 7Ree Gaun 1,110 1,052 42 2 12 0 2Salang 1,140 1,106 12 3 13 0 6Salyankot 1,123 1,095 1 0 19 0 8Salyantar 1,791 1,319 177 55 231 3 6Sangkosh 1,244 1,148 45 25 3 0 23Satyadevi 760 735 8 0 1 1 15Semjong 847 844 0 1 0 0 2Sertung 817 815 0 0 2 0 0Sunaula Bazar 1,530 1,514 3 7 4 0 2Tasarpu 1,098 1,015 29 5 47 1 1Thakre 2,141 1,623 198 172 78 7 63Tipling 464 453 0 0 7 0 4Tripureswor 819 723 67 3 26 0 0Total 73,842 63,985 3,416 3,958 1,924 114 445
VDC / Municipality Total
Type of foundation of house
2

DhadingTable 1.3: Households by outer wall of house/housing unit.
Mud bonded bricks/stone
Cement bonded
bricks/stone
Wood/ planks Bamboo Unbaked
brick Others Not Stated
Aginchok 873 838 17 7 7 0 1 3Baireni 2,795 2,132 562 31 6 0 36 28Baseri 859 847 7 0 0 0 0 5Benighat 2,123 1,401 641 36 23 0 15 7Bhumesthan 2,145 1,929 158 8 17 1 30 2Budhathum 866 846 14 3 1 0 1 1Chainpur 1,514 1,459 29 8 14 0 0 4Chhatredeurali 1,655 1,603 37 4 9 0 0 2Darkha 1,121 1,109 2 1 0 0 0 9Dhola 998 973 5 7 1 1 0 11Dhussa 1,361 995 190 121 39 0 5 11Dhuwakot 1,063 1,035 13 5 0 0 0 10Gajuri 2,223 1,365 662 113 56 0 12 15Goganpani 1,133 1,029 89 5 0 0 4 6Gumdi 1,109 1,071 23 2 7 1 1 4Jeewanpur 1,920 1,847 57 1 7 0 2 6Jharlang 770 764 1 3 0 0 0 2Jogimara 1,442 1,146 203 44 34 0 2 13Jyamrung 1,653 1,601 32 5 8 0 2 5Kalleri 1,921 1,858 41 3 4 0 1 14Katunje 1,425 1,368 45 0 8 0 0 4Kewalpur 1,104 1,084 12 2 0 0 0 6Khalte 1,566 1,549 11 4 0 0 1 1Khari 1,051 987 6 2 48 0 1 7Kiranchok 1,163 1,113 13 2 5 0 4 26Kumpur 2,122 1,963 104 17 10 2 3 23Lapa 853 830 1 7 7 0 0 8Mahadevsthan 1,243 980 18 159 76 0 7 3Maidi 2,167 2,056 23 16 58 1 0 13Marpak 849 837 2 1 4 0 0 5Mulpani 749 702 37 4 2 0 1 3Murali Bhanjyang 1,673 1,505 152 2 3 0 2 9Nalang 1,876 1,793 62 2 4 0 1 14Naubise 3,184 2,538 575 15 18 1 13 24Nilkantha 5,255 2,074 3,081 31 24 1 2 42Phulkharka 920 909 8 2 0 0 0 1Pida 2,214 1,842 311 41 11 0 1 8Ree Gaun 1,110 986 88 21 11 1 0 3Salang 1,140 1,097 19 9 6 0 0 9Salyankot 1,123 1,060 37 7 11 0 0 8Salyantar 1,791 1,214 408 10 146 1 5 7Sangkosh 1,244 1,143 72 3 3 0 0 23Satyadevi 760 730 12 1 0 0 2 15Semjong 847 840 5 0 0 0 0 2Sertung 817 814 0 1 2 0 0 0Sunaula Bazar 1,530 1,494 26 6 2 0 0 2Tasarpu 1,098 1,019 24 11 40 0 2 2Thakre 2,141 1,567 405 27 59 0 18 65Tipling 464 447 0 9 3 0 0 5Tripureswor 819 597 198 11 12 0 1 0Total 73,842 62,986 8,538 830 806 10 176 496
TotalVDC / Municipality
Type of outer wall
3

DhadingTable 1.4: Households by roof of house/housing unit.
Thatch/ straw
Galvanized iron
Tile / slate RCC Wood/
planks Mud Others Not Stated
Aginchok 873 77 593 191 9 0 0 0 3Baireni 2,795 59 1,437 915 354 0 0 1 29Baseri 859 61 693 98 0 1 0 0 6Benighat 2,123 166 891 614 433 1 0 7 11Bhumesthan 2,145 40 1,438 544 100 1 1 19 2Budhathum 866 94 521 247 3 0 0 0 1Chainpur 1,514 158 803 539 10 0 0 1 3Chhatredeurali 1,655 27 1,499 103 21 1 0 1 3Darkha 1,121 32 290 788 0 1 0 0 10Dhola 998 43 455 496 0 1 0 0 3Dhussa 1,361 405 619 233 93 1 0 0 10Dhuwakot 1,063 9 487 557 1 0 0 0 9Gajuri 2,223 332 926 482 460 1 0 5 17Goganpani 1,133 12 870 223 17 4 0 0 7Gumdi 1,109 38 602 458 1 1 0 0 9Jeewanpur 1,920 22 1,810 67 10 0 0 1 10Jharlang 770 20 381 217 2 149 0 0 1Jogimara 1,442 427 604 284 107 1 1 3 15Jyamrung 1,653 81 1,153 407 2 3 0 0 7Kalleri 1,921 53 203 1,646 4 0 0 0 15Katunje 1,425 38 1,316 59 8 0 0 1 3Kewalpur 1,104 9 996 62 5 0 0 0 32Khalte 1,566 48 61 1,454 1 0 0 0 2Khari 1,051 113 389 543 0 0 1 1 4Kiranchok 1,163 75 780 284 1 0 0 0 23Kumpur 2,122 129 378 1,538 53 0 0 1 23Lapa 853 26 169 182 3 463 0 2 8Mahadevsthan 1,243 796 271 160 8 1 0 2 5Maidi 2,167 278 936 927 7 4 1 0 14Marpak 849 68 684 91 0 0 0 0 6Mulpani 749 57 570 119 0 0 0 0 3Murali Bhanjyang 1,673 28 589 982 65 1 0 0 8Nalang 1,876 218 561 1,044 31 2 1 5 14Naubise 3,184 67 2,708 92 262 2 0 10 43Nilkantha 5,255 40 961 1,573 2,624 4 1 3 49Phulkharka 920 39 734 142 1 0 0 1 3Pida 2,214 299 923 825 152 2 1 3 9Ree Gaun 1,110 43 80 870 3 110 0 1 3Salang 1,140 225 329 569 9 1 0 0 7Salyankot 1,123 142 770 192 1 0 0 10 8Salyantar 1,791 124 1,368 128 158 5 0 0 8Sangkosh 1,244 21 553 609 34 0 0 4 23Satyadevi 760 39 398 300 0 1 0 0 22Semjong 847 12 807 25 1 0 0 0 2Sertung 817 8 306 174 0 328 0 0 1Sunaula Bazar 1,530 33 139 1,342 12 0 1 1 2Tasarpu 1,098 82 932 76 3 0 0 4 1Thakre 2,141 59 1,661 137 213 2 0 2 67Tipling 464 12 25 18 1 401 0 0 7Tripureswor 819 41 672 86 19 1 0 0 0Total 73,842 5,325 37,341 23,712 5,302 1,494 8 89 571
VDC / Municipality Total
Roof of the House
4
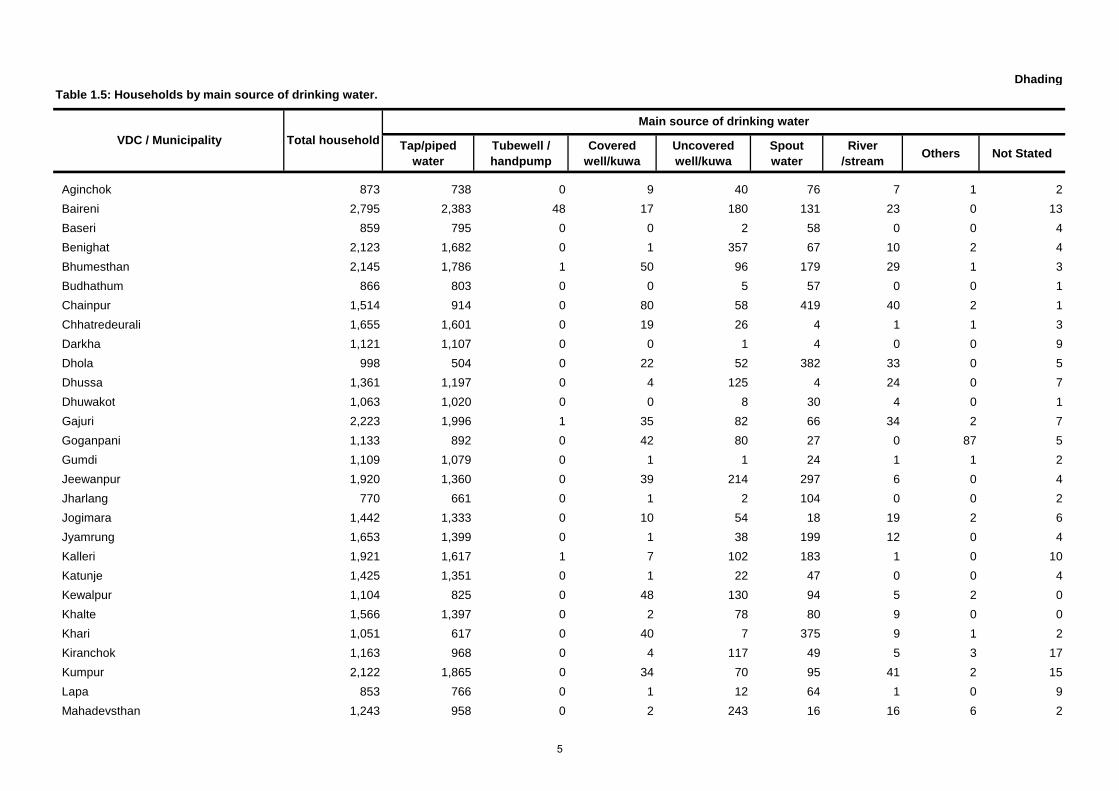
DhadingTable 1.5: Households by main source of drinking water.
Tap/piped water
Tubewell / handpump
Covered well/kuwa
Uncovered well/kuwa
Spout water
River /stream Others Not Stated
Aginchok 873 738 0 9 40 76 7 1 2Baireni 2,795 2,383 48 17 180 131 23 0 13Baseri 859 795 0 0 2 58 0 0 4Benighat 2,123 1,682 0 1 357 67 10 2 4Bhumesthan 2,145 1,786 1 50 96 179 29 1 3Budhathum 866 803 0 0 5 57 0 0 1Chainpur 1,514 914 0 80 58 419 40 2 1Chhatredeurali 1,655 1,601 0 19 26 4 1 1 3Darkha 1,121 1,107 0 0 1 4 0 0 9Dhola 998 504 0 22 52 382 33 0 5Dhussa 1,361 1,197 0 4 125 4 24 0 7Dhuwakot 1,063 1,020 0 0 8 30 4 0 1Gajuri 2,223 1,996 1 35 82 66 34 2 7Goganpani 1,133 892 0 42 80 27 0 87 5Gumdi 1,109 1,079 0 1 1 24 1 1 2Jeewanpur 1,920 1,360 0 39 214 297 6 0 4Jharlang 770 661 0 1 2 104 0 0 2Jogimara 1,442 1,333 0 10 54 18 19 2 6Jyamrung 1,653 1,399 0 1 38 199 12 0 4Kalleri 1,921 1,617 1 7 102 183 1 0 10Katunje 1,425 1,351 0 1 22 47 0 0 4Kewalpur 1,104 825 0 48 130 94 5 2 0Khalte 1,566 1,397 0 2 78 80 9 0 0Khari 1,051 617 0 40 7 375 9 1 2Kiranchok 1,163 968 0 4 117 49 5 3 17Kumpur 2,122 1,865 0 34 70 95 41 2 15Lapa 853 766 0 1 12 64 1 0 9Mahadevsthan 1,243 958 0 2 243 16 16 6 2
VDC / Municipality Total householdMain source of drinking water
5

Table 1.5: Households by main source of drinking water.
Tap/piped water
Tubewell / handpump
Covered well/kuwa
Uncovered well/kuwa
Spout water
River /stream Others Not Stated
VDC / Municipality Total householdMain source of drinking water
Maidi 2,167 1,356 0 175 88 461 17 64 6Marpak 849 839 0 0 5 1 0 0 4Mulpani 749 524 0 4 17 198 3 1 2Murali Bhanjyang 1,673 1,276 2 54 45 279 9 0 8Nalang 1,876 1,259 0 30 75 490 10 0 12Naubise 3,184 2,897 1 8 48 52 136 35 7Nilkantha 5,255 5,106 0 37 22 67 3 1 19Phulkharka 920 832 0 4 2 82 0 0 0Pida 2,214 1,960 0 64 150 15 18 1 6Ree Gaun 1,110 1,109 0 0 0 0 0 0 1Salang 1,140 1,069 0 0 38 25 4 0 4Salyankot 1,123 696 0 59 123 222 15 0 8Salyantar 1,791 1,487 1 3 4 250 39 0 7Sangkosh 1,244 1,055 2 11 49 111 13 0 3Satyadevi 760 736 0 0 0 2 8 0 14Semjong 847 844 0 0 0 0 0 2 1Sertung 817 484 0 1 1 325 0 5 1Sunaula Bazar 1,530 1,061 0 70 110 287 2 0 0Tasarpu 1,098 1,020 0 3 10 61 3 1 0Thakre 2,141 1,996 0 1 40 96 0 0 8Tipling 464 396 0 0 5 54 6 0 3Tripureswor 819 802 0 0 1 9 7 0 0Total 73,842 62,418 57 994 3,035 6,236 623 223 256
6

DhadingTable 1.6: Households by usual type of fuel used for cooking
Wood / firewood Kerosene LP gas Santhi/ guitha
(cow dung) Bio gas Electricity Others Not Stated
Aginchok 873 837 1 11 0 22 0 0 2
Baireni 2,795 2,180 31 513 0 44 10 4 13
Baseri 859 829 1 12 0 13 0 0 4
Benighat 2,123 1,466 24 560 1 36 16 16 4
Bhumesthan 2,145 1,909 18 161 1 50 0 3 3
Budhathum 866 823 2 22 0 17 0 1 1
Chainpur 1,514 1,327 1 23 0 161 1 0 1
Chhatredeurali 1,655 1,601 11 38 0 2 0 0 3
Darkha 1,121 1,095 4 12 0 0 1 0 9
Dhola 998 753 6 13 0 220 1 0 5
Dhussa 1,361 1,190 3 139 0 17 3 2 7
Dhuwakot 1,063 1,032 5 17 0 8 0 0 1
Gajuri 2,223 1,510 15 635 1 50 3 1 8
Goganpani 1,133 1,097 0 10 0 20 0 1 5
Gumdi 1,109 1,041 1 33 0 32 0 0 2
Jeewanpur 1,920 1,828 2 62 0 23 1 0 4
Jharlang 770 765 3 0 0 0 0 0 2
Jogimara 1,442 1,268 15 95 1 50 4 1 8
Jyamrung 1,653 1,519 6 35 0 87 1 1 4
Kalleri 1,921 1,794 6 23 0 88 0 0 10
Katunje 1,425 1,325 32 50 0 10 1 3 4
Kewalpur 1,104 1,027 0 20 0 57 0 0 0
Khalte 1,566 1,491 10 9 0 56 0 0 0
Khari 1,051 996 4 23 0 26 0 0 2
Kiranchok 1,163 1,104 4 11 1 26 0 0 17
Kumpur 2,122 1,903 5 42 0 155 0 2 15
Total householdVDC/ Municipality
Fuel usually used for cooking
7
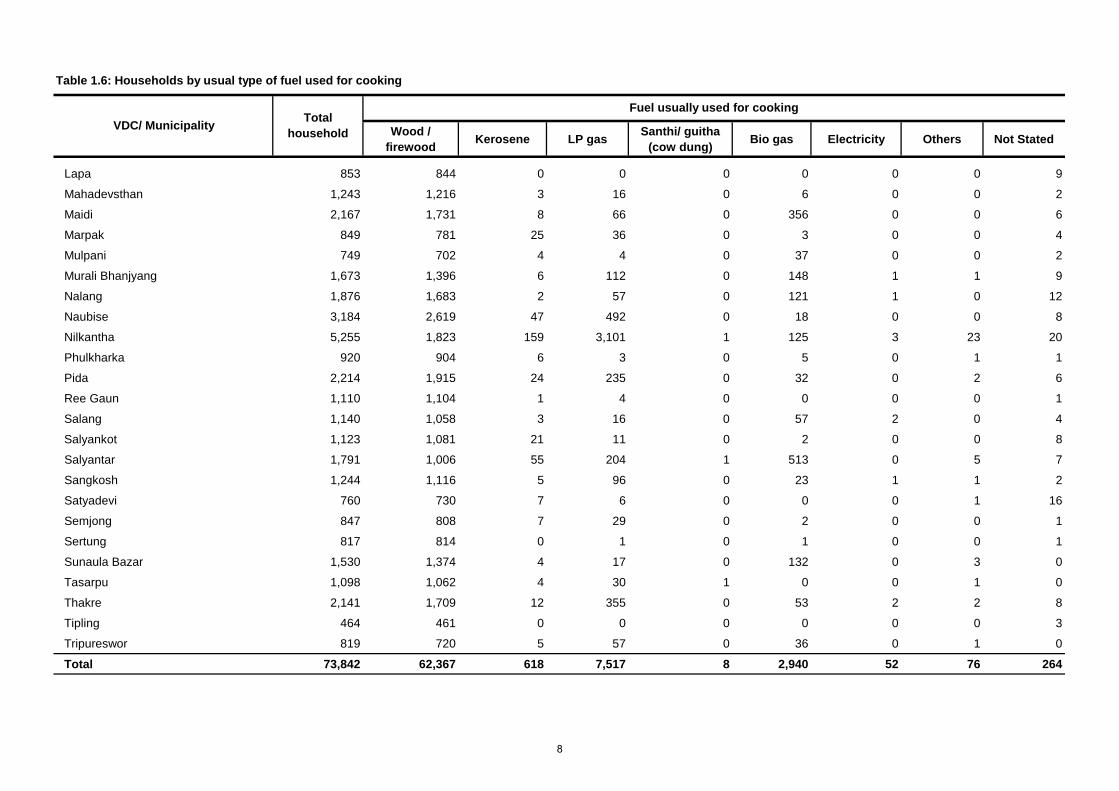
Table 1.6: Households by usual type of fuel used for cooking
Wood / firewood Kerosene LP gas Santhi/ guitha
(cow dung) Bio gas Electricity Others Not Stated
Total householdVDC/ Municipality
Fuel usually used for cooking
Lapa 853 844 0 0 0 0 0 0 9
Mahadevsthan 1,243 1,216 3 16 0 6 0 0 2
Maidi 2,167 1,731 8 66 0 356 0 0 6
Marpak 849 781 25 36 0 3 0 0 4
Mulpani 749 702 4 4 0 37 0 0 2
Murali Bhanjyang 1,673 1,396 6 112 0 148 1 1 9
Nalang 1,876 1,683 2 57 0 121 1 0 12
Naubise 3,184 2,619 47 492 0 18 0 0 8
Nilkantha 5,255 1,823 159 3,101 1 125 3 23 20
Phulkharka 920 904 6 3 0 5 0 1 1
Pida 2,214 1,915 24 235 0 32 0 2 6
Ree Gaun 1,110 1,104 1 4 0 0 0 0 1
Salang 1,140 1,058 3 16 0 57 2 0 4
Salyankot 1,123 1,081 21 11 0 2 0 0 8
Salyantar 1,791 1,006 55 204 1 513 0 5 7
Sangkosh 1,244 1,116 5 96 0 23 1 1 2
Satyadevi 760 730 7 6 0 0 0 1 16
Semjong 847 808 7 29 0 2 0 0 1
Sertung 817 814 0 1 0 1 0 0 1
Sunaula Bazar 1,530 1,374 4 17 0 132 0 3 0
Tasarpu 1,098 1,062 4 30 1 0 0 1 0
Thakre 2,141 1,709 12 355 0 53 2 2 8
Tipling 464 461 0 0 0 0 0 0 3
Tripureswor 819 720 5 57 0 36 0 1 0
Total 73,842 62,367 618 7,517 8 2,940 52 76 264
8

DhadingTable 1.7: Households by usual source of lighting.
Electricity Kerosene Bio gas Solar Others Not Stated
Aginchok 873 203 349 0 299 20 2Baireni 2,795 1,918 772 0 70 22 13Baseri 859 196 369 0 227 63 4Benighat 2,123 1,639 351 0 35 94 4Bhumesthan 2,145 1,868 243 0 11 20 3Budhathum 866 666 145 0 24 30 1Chainpur 1,514 902 358 0 110 143 1Chhatredeurali 1,655 1,575 76 0 1 0 3Darkha 1,121 638 372 0 95 7 9Dhola 998 807 164 1 5 16 5Dhussa 1,361 619 236 1 88 410 7Dhuwakot 1,063 713 278 0 70 1 1Gajuri 2,223 1,745 314 0 17 139 8Goganpani 1,133 1,092 34 1 1 0 5Gumdi 1,109 146 429 2 471 59 2Jeewanpur 1,920 1,817 95 0 3 1 4Jharlang 770 1 155 0 236 376 2Jogimara 1,442 515 426 0 178 315 8Jyamrung 1,653 696 495 1 372 85 4Kalleri 1,921 1,604 286 0 8 13 10Katunje 1,425 360 514 1 545 1 4Kewalpur 1,104 1,051 52 1 0 0 0Khalte 1,566 676 515 4 300 71 0Khari 1,051 316 316 0 341 76 2Kiranchok 1,163 11 383 2 460 290 17Kumpur 2,122 1,608 319 2 66 112 15Lapa 853 502 7 0 324 11 9Mahadevsthan 1,243 388 217 0 98 538 2Maidi 2,167 733 545 2 653 228 6Marpak 849 165 322 0 322 36 4Mulpani 749 673 65 0 9 0 2Murali Bhanjyang 1,673 1,525 121 1 2 15 9Nalang 1,876 1,608 248 6 2 0 12Naubise 3,184 2,638 444 0 87 7 8Nilkantha 5,255 5,052 168 2 2 11 20Phulkharka 920 453 198 0 143 125 1Pida 2,214 844 602 1 240 521 6Ree Gaun 1,110 499 71 0 384 155 1Salang 1,140 749 240 0 90 57 4Salyankot 1,123 95 690 0 298 32 8Salyantar 1,791 292 646 7 730 109 7Sangkosh 1,244 1,120 96 0 21 4 3Satyadevi 760 554 185 0 3 2 16Semjong 847 495 252 0 73 26 1Sertung 817 4 0 1 301 510 1Sunaula Bazar 1,530 1,140 341 1 40 8 0Tasarpu 1,098 773 312 0 8 5 0Thakre 2,141 2,039 93 0 0 1 8Tipling 464 391 0 1 68 1 3Tripureswor 819 143 373 0 265 38 0Total 73,842 46,257 14,282 38 8,196 4,804 265
Total householdVDC/ Municipality
Fuel usually used for lighting
9

DhadingTable 1.8: Households by type of toilet.
Flush toilet Ordinary toilet
Aginchok 873 186 542 143 2
Baireni 2,795 1,057 1,151 574 13
Baseri 859 220 353 282 4
Benighat 2,123 612 1,255 252 4
Bhumesthan 2,145 846 959 337 3
Budhathum 866 374 303 188 1
Chainpur 1,514 215 560 738 1
Chhatredeurali 1,655 560 661 431 3
Darkha 1,121 396 294 422 9
Dhola 998 222 462 309 5
Dhussa 1,361 316 558 480 7
Dhuwakot 1,063 198 447 417 1
Gajuri 2,223 773 1,140 302 8
Goganpani 1,133 460 512 156 5
Gumdi 1,109 354 559 194 2
Jeewanpur 1,920 649 743 524 4
Jharlang 770 549 38 182 1
Jogimara 1,442 330 912 192 8
Jyamrung 1,653 425 695 529 4
Kalleri 1,921 808 782 321 10
Katunje 1,425 432 543 447 3
Kewalpur 1,104 421 498 185 0
Khalte 1,566 439 679 448 0
Khari 1,051 351 164 534 2
Kiranchok 1,163 588 193 366 16
Kumpur 2,122 622 1,002 483 15
Lapa 853 464 125 255 9
Mahadevsthan 1,243 645 279 317 2
Maidi 2,167 163 1,449 549 6
Marpak 849 200 269 376 4
Mulpani 749 233 266 249 1
Murali Bhanjyang 1,673 145 1,316 203 9
Nalang 1,876 597 1,007 260 12
Naubise 3,184 791 1,812 573 8
Nilkantha 5,255 380 4,108 747 20
Phulkharka 920 332 351 236 1
Pida 2,214 884 1,106 218 6
Ree Gaun 1,110 317 416 376 1
Salang 1,140 242 471 423 4
Salyankot 1,123 304 429 383 7
Salyantar 1,791 555 1,029 200 7
Toilet facility
not statedV.D.C. / Municipality Total
households
Households without toilet
facility
Households with toilet facility of
10

Table 1.8: Households by type of toilet.
Flush toilet Ordinary toilet
Toilet facility
not statedV.D.C. / Municipality Total
households
Households without toilet
facility
Households with toilet facility of
Sangkosh 1,244 431 624 186 3
Satyadevi 760 119 156 469 16
Semjong 847 159 526 161 1
Sertung 817 666 32 118 1
Sunaula Bazar 1,530 265 780 485 0
Tasarpu 1,098 467 229 402 0
Thakre 2,141 657 937 539 8
Tipling 464 299 21 141 3
Tripureswor 819 160 573 86 0
Total 73,842 21,878 34,316 17,388 260
11

DhadingTable 1.9: Households by types of household facilities
Radio Television Cable Television Computer Internet Telephone Mobile
Phone Motor Motor- cycle Cycle Other
vehicleRefri-
gerator
Aginchok 873 95 778 657 129 0 1 0 29 665 1 8 1 1 1 0Baireni 2,795 435 2,304 1,598 271 608 111 20 246 1,662 25 156 95 8 155 56Baseri 859 71 759 645 94 1 1 0 7 657 1 2 0 0 0 29Benighat 2,123 248 1,832 1,145 277 653 87 24 138 1,443 10 143 38 9 203 43Bhumesthan 2,145 225 1,855 1,336 306 186 39 7 29 1,522 33 74 26 3 58 65Budhathum 866 57 760 590 296 21 9 0 32 637 0 9 6 2 1 49Chainpur 1,514 141 1,354 1,214 400 28 8 5 29 955 1 17 5 0 10 19Chhatredeurali 1,655 183 1,440 1,008 988 31 26 2 20 1,168 6 108 37 2 14 32Darkha 1,121 206 836 707 180 1 4 0 62 631 2 1 0 0 1 79Dhola 998 99 845 641 273 24 6 1 17 690 0 14 0 0 6 54Dhussa 1,361 339 1,004 778 177 192 33 14 74 570 8 38 24 1 57 18Dhuwakot 1,063 63 980 848 361 17 10 0 49 734 2 13 10 0 2 20Gajuri 2,223 332 1,884 1,125 158 584 112 37 34 1,525 22 151 41 2 262 7Goganpani 1,133 78 1,009 763 408 57 9 3 18 752 1 15 12 0 7 46Gumdi 1,109 136 947 821 182 12 1 0 106 733 4 2 1 9 0 26Jeewanpur 1,920 245 1,666 1,273 890 66 24 8 23 1,296 18 93 29 2 20 9Jharlang 770 178 526 499 14 0 1 0 17 231 0 1 0 0 0 66Jogimara 1,442 322 1,109 869 63 171 18 4 46 667 2 49 28 5 56 11Jyamrung 1,653 163 1,412 1,200 323 43 4 0 38 1,044 0 10 1 4 0 78Kalleri 1,921 292 1,577 1,262 455 54 17 2 17 1,169 3 6 6 1 4 52Katunje 1,425 196 1,218 1,077 259 1 6 2 26 877 2 15 2 0 0 11Kewalpur 1,104 126 958 666 582 19 14 7 14 749 9 36 6 0 4 20Khalte 1,566 234 1,303 1,071 271 1 4 1 2 1,094 1 0 3 0 0 29Khari 1,051 127 904 727 120 1 3 0 14 673 0 3 6 0 1 20Kiranchok 1,163 330 790 604 8 0 0 0 7 567 3 10 9 0 0 43Kumpur 2,122 357 1,738 1,326 473 114 29 10 12 1,324 4 30 16 4 21 27Lapa 853 385 446 387 103 0 3 0 4 137 0 0 0 1 0 22Mahadevsthan 1,243 400 838 758 40 14 0 0 7 456 1 8 5 0 1 5Maidi 2,167 272 1,846 1,612 257 82 22 4 47 1,418 3 25 7 2 9 49Marpak 849 43 769 734 178 1 4 0 18 596 1 0 0 0 0 37Mulpani 749 125 621 490 214 35 3 0 35 492 0 5 1 1 1 3Murali Bhanjyang 1,673 195 1,456 1,136 581 113 36 7 74 1,235 12 62 27 5 35 22
Not statedArea Total
Without any
facility
At least one
facility
Household having facility of
12
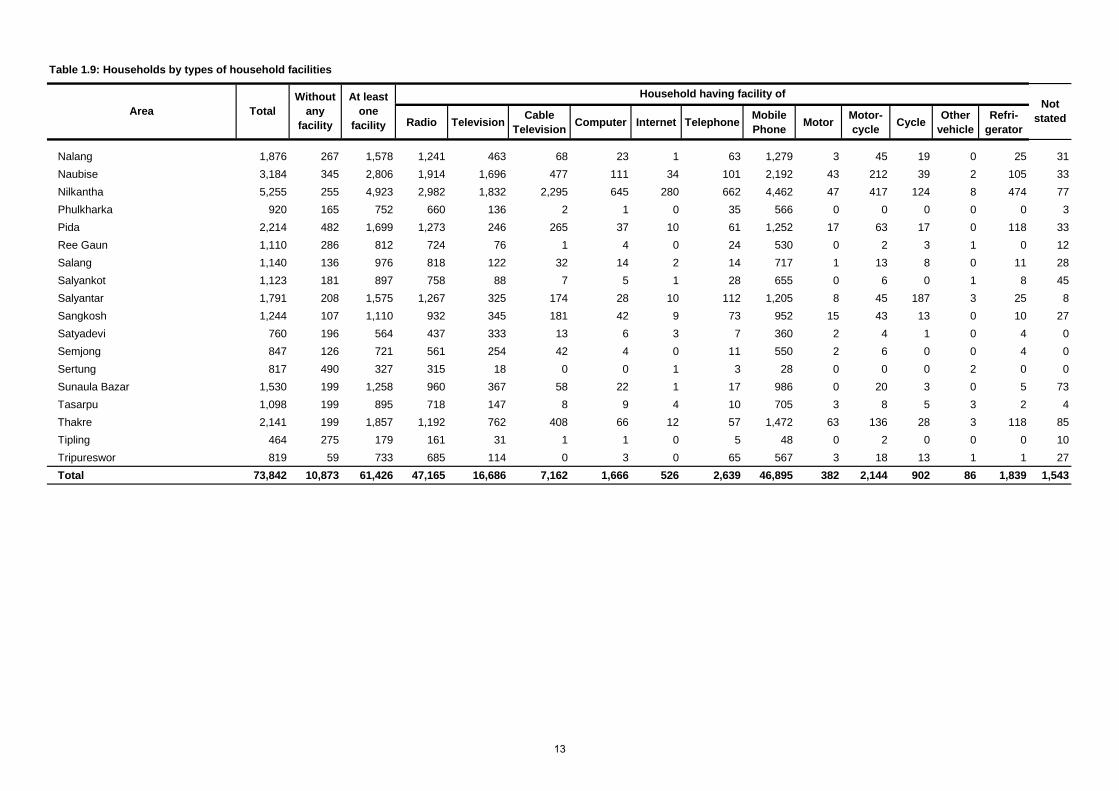
Table 1.9: Households by types of household facilities
Radio Television Cable Television Computer Internet Telephone Mobile
Phone Motor Motor- cycle Cycle Other
vehicleRefri-
gerator
Not statedArea Total
Without any
facility
At least one
facility
Household having facility of
Nalang 1,876 267 1,578 1,241 463 68 23 1 63 1,279 3 45 19 0 25 31Naubise 3,184 345 2,806 1,914 1,696 477 111 34 101 2,192 43 212 39 2 105 33Nilkantha 5,255 255 4,923 2,982 1,832 2,295 645 280 662 4,462 47 417 124 8 474 77Phulkharka 920 165 752 660 136 2 1 0 35 566 0 0 0 0 0 3Pida 2,214 482 1,699 1,273 246 265 37 10 61 1,252 17 63 17 0 118 33Ree Gaun 1,110 286 812 724 76 1 4 0 24 530 0 2 3 1 0 12Salang 1,140 136 976 818 122 32 14 2 14 717 1 13 8 0 11 28Salyankot 1,123 181 897 758 88 7 5 1 28 655 0 6 0 1 8 45Salyantar 1,791 208 1,575 1,267 325 174 28 10 112 1,205 8 45 187 3 25 8Sangkosh 1,244 107 1,110 932 345 181 42 9 73 952 15 43 13 0 10 27Satyadevi 760 196 564 437 333 13 6 3 7 360 2 4 1 0 4 0Semjong 847 126 721 561 254 42 4 0 11 550 2 6 0 0 4 0Sertung 817 490 327 315 18 0 0 1 3 28 0 0 0 2 0 0Sunaula Bazar 1,530 199 1,258 960 367 58 22 1 17 986 0 20 3 0 5 73Tasarpu 1,098 199 895 718 147 8 9 4 10 705 3 8 5 3 2 4Thakre 2,141 199 1,857 1,192 762 408 66 12 57 1,472 63 136 28 3 118 85Tipling 464 275 179 161 31 1 1 0 5 48 0 2 0 0 0 10Tripureswor 819 59 733 685 114 0 3 0 65 567 3 18 13 1 1 27Total 73,842 10,873 61,426 47,165 16,686 7,162 1,666 526 2,639 46,895 382 2,144 902 86 1,839 1,543
13

DhadingTable 1.10: Absentee population and household.
Total Male Female Sex Not Stated
Aginchok 873 324 463 416 47 0Baireni 2,795 271 322 286 36 0Baseri 859 372 551 488 63 0Benighat 2,123 313 406 344 62 0Bhumesthan 2,145 253 300 215 85 0Budhathum 866 256 342 327 15 0Chainpur 1,514 534 692 643 49 0Chhatredeurali 1,655 152 174 153 21 0Darkha 1,121 434 621 545 76 0Dhola 998 274 360 324 36 0Dhussa 1,361 140 156 139 17 0Dhuwakot 1,063 480 667 608 59 0Gajuri 2,223 296 369 317 52 0Goganpani 1,133 112 131 114 17 0Gumdi 1,109 500 716 657 59 0Jeewanpur 1,920 125 152 133 19 0Jharlang 770 269 346 273 73 0Jogimara 1,442 151 170 164 6 0Jyamrung 1,653 519 716 653 63 0Kalleri 1,921 386 455 442 13 0Katunje 1,425 621 856 788 68 0Kewalpur 1,104 86 102 80 22 0Khalte 1,566 487 703 624 79 0Khari 1,051 320 401 376 25 0Kiranchok 1,163 132 143 138 5 0Kumpur 2,122 498 586 553 33 0Lapa 853 275 439 374 65 0Mahadevsthan 1,243 131 153 132 21 0Maidi 2,167 766 1,047 929 118 0Marpak 849 336 520 453 67 0Mulpani 749 200 265 246 19 0Murali Bhanjyang 1,673 354 458 403 55 0Nalang 1,876 448 605 532 73 0Naubise 3,184 232 297 251 46 0Nilkantha 5,255 1,444 1,684 1,575 109 0Phulkharka 920 272 332 309 23 0Pida 2,214 238 286 263 23 0Ree Gaun 1,110 336 425 416 9 0Salang 1,140 281 339 322 17 0Salyankot 1,123 361 534 471 63 0Salyantar 1,791 675 947 830 117 0Sangkosh 1,244 321 391 374 17 0Satyadevi 760 341 444 412 32 0Semjong 847 487 863 725 138 0Sertung 817 324 449 374 75 0Sunaula Bazar 1,530 306 386 356 30 0Tasarpu 1,098 88 99 88 11 0Thakre 2,141 176 206 185 21 0Tipling 464 135 175 121 54 0Tripureswor 819 223 293 266 27 0
Total 73,842 17,055 22,537 20,207 2,330 0
Total household
Absent householdV.D.C. / Municipality
Absent population
14
Individual Tables


DhadingTable 2.1: Households, population and average household size.
Total Male Female
TOTAL 73,851 336,067 157,834 178,233 4.55 88.55Aginchok 873 3,580 1,539 2,041 4.10 75.40
Baireni 2,795 13,369 6,630 6,739 4.78 98.38
Baseri 859 3,660 1,609 2,051 4.26 78.45
Benighat 2,123 9,717 4,854 4,863 4.58 99.81
Bhumesthan 2,145 10,786 5,323 5,463 5.03 97.44
Budhathum 866 3,732 1,543 2,189 4.31 70.49
Chainpur 1,514 6,349 2,747 3,602 4.19 76.26
Chhatredeurali 1,655 7,687 3,665 4,022 4.64 91.12
Darkha 1,121 5,269 2,431 2,838 4.70 85.66
Dhola 998 4,033 1,772 2,261 4.04 78.37
Dhussa 1,361 7,190 3,548 3,642 5.28 97.42
Dhuwakot 1,063 4,762 2,152 2,610 4.48 82.45
Gajuri 2,223 10,035 4,968 5,067 4.51 98.05
Goganpani 1,133 5,563 2,696 2,867 4.91 94.04
Gumdi 1,109 4,833 2,135 2,698 4.36 79.13
Jeewanpur 1,920 8,789 4,329 4,460 4.58 97.06
Jharlang 770 4,158 1,962 2,196 5.40 89.34
Jogimara 1,442 7,744 3,842 3,902 5.37 98.46
Jyamrung 1,653 6,998 3,024 3,974 4.23 76.09
Kalleri 1,921 8,852 4,059 4,793 4.61 84.69
Katunje 1,425 5,906 2,559 3,347 4.14 76.46
Kewalpur 1,104 5,010 2,412 2,598 4.54 92.84
Khalte 1,566 7,177 3,223 3,954 4.58 81.51
Khari 1,051 4,381 1,944 2,437 4.17 79.77
Kiranchok 1,163 6,006 2,928 3,078 5.16 95.13
Kumpur 2,122 10,012 4,636 5,376 4.72 86.24
Lapa 853 3,893 1,818 2,075 4.56 87.61
Mahadevsthan 1,243 6,824 3,416 3,408 5.49 100.23
Maidi 2,167 9,203 4,110 5,093 4.25 80.70
Marpak 849 3,658 1,590 2,068 4.31 76.89
Mulpani 749 3,175 1,347 1,828 4.24 73.69
Murali Bhanjyang 1,673 7,253 3,277 3,976 4.34 82.42
Nalang 1,876 8,067 3,674 4,393 4.30 83.63
Naubise 3,184 14,553 7,203 7,350 4.57 98.00
Nilkantha 5,255 20,182 9,406 10,776 3.84 87.29
Phulkharka 920 4,125 1,769 2,356 4.48 75.08
Pida 2,214 11,043 5,415 5,628 4.99 96.22
Ree Gaun 1,110 5,434 2,471 2,963 4.90 83.40
Salang 1,140 5,650 2,655 2,995 4.96 88.65
Salyankot 1,123 4,920 2,113 2,807 4.38 75.28
Salyantar 1,791 7,892 3,539 4,353 4.41 81.30
Sangkosh 1,244 5,521 2,496 3,025 4.44 82.51
V.D.C. / Municipality HouseholdPopulation Average
Household Size
Sex Ratio
15
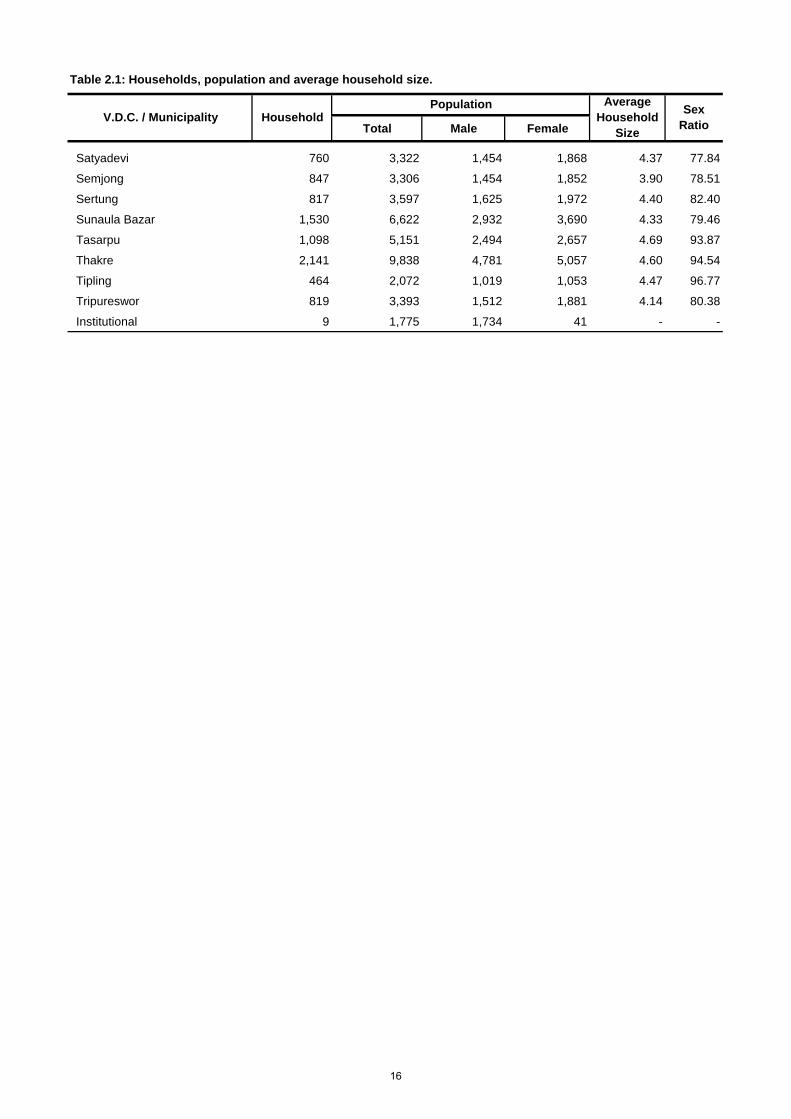
Table 2.1: Households, population and average household size.
Total Male FemaleV.D.C. / Municipality Household
Population Average Household
Size
Sex Ratio
Satyadevi 760 3,322 1,454 1,868 4.37 77.84
Semjong 847 3,306 1,454 1,852 3.90 78.51
Sertung 817 3,597 1,625 1,972 4.40 82.40
Sunaula Bazar 1,530 6,622 2,932 3,690 4.33 79.46
Tasarpu 1,098 5,151 2,494 2,657 4.69 93.87
Thakre 2,141 9,838 4,781 5,057 4.60 94.54
Tipling 464 2,072 1,019 1,053 4.47 96.77
Tripureswor 819 3,393 1,512 1,881 4.14 80.38
Institutional 9 1,775 1,734 41 - -
16

DhadingTable 2.2: Population by 5 years age group and sex.
00 - 04 05 - 09 10 - 14 15 - 19 20 - 24 25 - 29 30 - 34 35 - 39 40 - 44 45 - 49 50 - 54 55 - 59 60 - 64 65 - 69 70 - 74 75 +
TotalBoth Sex 336,067 30,082 38,801 46,756 39,300 26,656 22,774 18,919 18,060 17,115 15,297 14,726 11,357 10,644 8,798 6,770 10,012Male 157,834 15,401 19,500 23,181 17,783 10,417 9,453 7,974 7,843 7,714 7,191 7,432 5,738 5,250 4,577 3,368 5,012Female 178,233 14,681 19,301 23,575 21,517 16,239 13,321 10,945 10,217 9,401 8,106 7,294 5,619 5,394 4,221 3,402 5,000
AginchokBoth Sex 3,580 323 325 464 452 266 196 172 170 196 174 200 160 151 117 82 132Male 1,539 160 189 230 183 81 54 44 46 76 73 92 74 78 63 33 63Female 2,041 163 136 234 269 185 142 128 124 120 101 108 86 73 54 49 69
BaireniBoth Sex 13,369 1,149 1,634 1,936 1,616 1,183 961 874 779 652 560 547 360 286 267 198 367Male 6,630 580 791 982 780 547 462 426 378 326 275 299 206 155 142 91 190Female 6,739 569 843 954 836 636 499 448 401 326 285 248 154 131 125 107 177
BaseriBoth Sex 3,660 323 311 489 543 274 197 140 169 149 168 191 168 165 117 99 157Male 1,609 182 164 252 230 78 60 50 54 50 69 90 74 73 64 46 73Female 2,051 141 147 237 313 196 137 90 115 99 99 101 94 92 53 53 84
BenighatBoth Sex 9,717 905 1,151 1,400 1,101 872 739 646 591 438 435 350 280 277 221 119 192Male 4,854 461 591 716 545 382 330 323 296 219 219 197 144 134 133 65 99Female 4,863 444 560 684 556 490 409 323 295 219 216 153 136 143 88 54 93
BhumesthanBoth Sex 10,786 1,027 1,329 1,536 1,288 922 754 616 586 557 420 441 323 294 252 169 272Male 5,323 538 690 787 606 410 353 299 279 261 198 241 169 139 136 89 128Female 5,463 489 639 749 682 512 401 317 307 296 222 200 154 155 116 80 144
BudhathumBoth Sex 3,732 310 390 513 474 279 198 163 179 176 190 203 150 154 120 78 155Male 1,543 158 177 235 189 90 56 40 56 61 83 86 79 72 57 34 70Female 2,189 152 213 278 285 189 142 123 123 115 107 117 71 82 63 44 85
ChainpurBoth Sex 6,349 559 687 848 716 449 382 318 334 364 341 360 233 188 198 154 218Male 2,747 291 360 403 289 133 121 103 107 141 141 160 111 102 99 70 116Female 3,602 268 327 445 427 316 261 215 227 223 200 200 122 86 99 84 102
TotalAge groupsVDC/
Municipality and sex
17
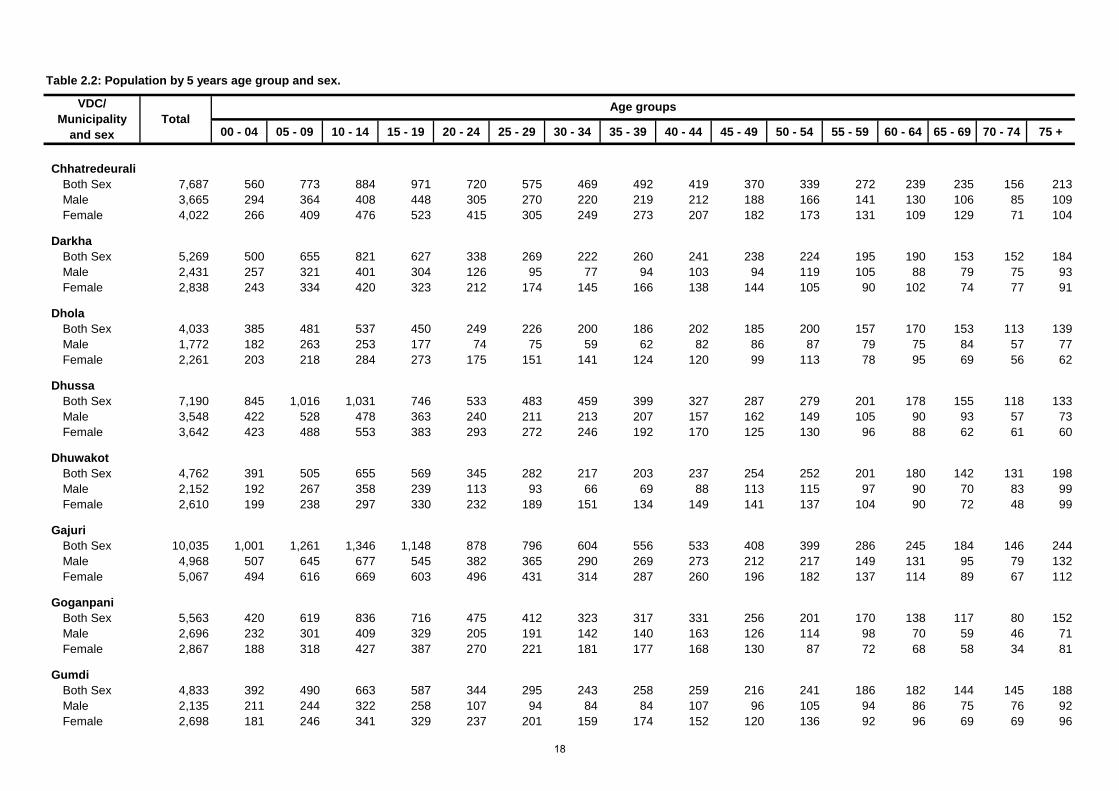
Table 2.2: Population by 5 years age group and sex.
00 - 04 05 - 09 10 - 14 15 - 19 20 - 24 25 - 29 30 - 34 35 - 39 40 - 44 45 - 49 50 - 54 55 - 59 60 - 64 65 - 69 70 - 74 75 +Total
Age groupsVDC/ Municipality
and sex
ChhatredeuraliBoth Sex 7,687 560 773 884 971 720 575 469 492 419 370 339 272 239 235 156 213Male 3,665 294 364 408 448 305 270 220 219 212 188 166 141 130 106 85 109Female 4,022 266 409 476 523 415 305 249 273 207 182 173 131 109 129 71 104
DarkhaBoth Sex 5,269 500 655 821 627 338 269 222 260 241 238 224 195 190 153 152 184Male 2,431 257 321 401 304 126 95 77 94 103 94 119 105 88 79 75 93Female 2,838 243 334 420 323 212 174 145 166 138 144 105 90 102 74 77 91
DholaBoth Sex 4,033 385 481 537 450 249 226 200 186 202 185 200 157 170 153 113 139Male 1,772 182 263 253 177 74 75 59 62 82 86 87 79 75 84 57 77Female 2,261 203 218 284 273 175 151 141 124 120 99 113 78 95 69 56 62
DhussaBoth Sex 7,190 845 1,016 1,031 746 533 483 459 399 327 287 279 201 178 155 118 133Male 3,548 422 528 478 363 240 211 213 207 157 162 149 105 90 93 57 73Female 3,642 423 488 553 383 293 272 246 192 170 125 130 96 88 62 61 60
DhuwakotBoth Sex 4,762 391 505 655 569 345 282 217 203 237 254 252 201 180 142 131 198Male 2,152 192 267 358 239 113 93 66 69 88 113 115 97 90 70 83 99Female 2,610 199 238 297 330 232 189 151 134 149 141 137 104 90 72 48 99
GajuriBoth Sex 10,035 1,001 1,261 1,346 1,148 878 796 604 556 533 408 399 286 245 184 146 244Male 4,968 507 645 677 545 382 365 290 269 273 212 217 149 131 95 79 132Female 5,067 494 616 669 603 496 431 314 287 260 196 182 137 114 89 67 112
GoganpaniBoth Sex 5,563 420 619 836 716 475 412 323 317 331 256 201 170 138 117 80 152Male 2,696 232 301 409 329 205 191 142 140 163 126 114 98 70 59 46 71Female 2,867 188 318 427 387 270 221 181 177 168 130 87 72 68 58 34 81
GumdiBoth Sex 4,833 392 490 663 587 344 295 243 258 259 216 241 186 182 144 145 188Male 2,135 211 244 322 258 107 94 84 84 107 96 105 94 86 75 76 92Female 2,698 181 246 341 329 237 201 159 174 152 120 136 92 96 69 69 96
18

Table 2.2: Population by 5 years age group and sex.
00 - 04 05 - 09 10 - 14 15 - 19 20 - 24 25 - 29 30 - 34 35 - 39 40 - 44 45 - 49 50 - 54 55 - 59 60 - 64 65 - 69 70 - 74 75 +Total
Age groupsVDC/ Municipality
and sex
JeewanpurBoth Sex 8,789 636 863 1,095 1,019 853 647 640 566 491 386 380 318 261 233 175 226Male 4,329 333 400 565 477 407 301 302 273 262 181 201 171 133 117 88 118Female 4,460 303 463 530 542 446 346 338 293 229 205 179 147 128 116 87 108
JharlangBoth Sex 4,158 517 564 629 362 296 231 167 188 185 209 152 109 155 105 143 146Male 1,962 250 270 312 177 111 92 74 87 88 101 82 49 81 55 65 68Female 2,196 267 294 317 185 185 139 93 101 97 108 70 60 74 50 78 78
JogimaraBoth Sex 7,744 864 1,034 1,101 895 668 517 419 391 364 350 279 200 214 150 127 171Male 3,842 429 526 541 435 317 250 191 179 182 179 156 111 108 83 70 85Female 3,902 435 508 560 460 351 267 228 212 182 171 123 89 106 67 57 86
JyamrungBoth Sex 6,998 607 745 1,015 833 517 382 319 308 365 346 340 322 260 224 183 232Male 3,024 311 350 493 354 156 114 94 106 134 133 152 164 119 115 100 129Female 3,974 296 395 522 479 361 268 225 202 231 213 188 158 141 109 83 103
KalleriBoth Sex 8,852 756 1,065 1,328 1,076 654 500 473 431 434 387 441 324 264 243 167 309Male 4,059 378 527 610 460 249 177 194 176 200 174 232 179 137 120 79 167Female 4,793 378 538 718 616 405 323 279 255 234 213 209 145 127 123 88 142
KatunjeBoth Sex 5,906 473 599 839 730 404 309 298 266 308 288 306 257 272 193 139 225Male 2,559 245 307 426 323 113 88 85 96 111 115 140 128 131 95 57 99Female 3,347 228 292 413 407 291 221 213 170 197 173 166 129 141 98 82 126
KewalpurBoth Sex 5,010 344 558 671 614 426 333 286 290 298 257 245 184 145 138 81 140Male 2,412 170 276 328 301 195 159 122 120 141 128 126 95 71 73 40 67Female 2,598 174 282 343 313 231 174 164 170 157 129 119 89 74 65 41 73
KhalteBoth Sex 7,177 704 921 1,083 785 492 400 315 332 378 334 319 230 244 237 176 227Male 3,223 363 471 522 302 172 125 115 124 153 154 176 122 98 128 77 121Female 3,954 341 450 561 483 320 275 200 208 225 180 143 108 146 109 99 106
19

Table 2.2: Population by 5 years age group and sex.
00 - 04 05 - 09 10 - 14 15 - 19 20 - 24 25 - 29 30 - 34 35 - 39 40 - 44 45 - 49 50 - 54 55 - 59 60 - 64 65 - 69 70 - 74 75 +Total
Age groupsVDC/ Municipality
and sex
KhariBoth Sex 4,381 406 515 605 519 277 226 216 201 249 217 211 186 168 129 93 163Male 1,944 217 247 335 213 72 65 68 74 94 96 100 87 79 70 47 80Female 2,437 189 268 270 306 205 161 148 127 155 121 111 99 89 59 46 83
KiranchokBoth Sex 6,006 676 837 934 638 426 384 354 274 263 239 224 196 163 127 95 176Male 2,928 353 405 461 316 171 181 163 138 124 119 114 107 81 67 41 87Female 3,078 323 432 473 322 255 203 191 136 139 120 110 89 82 60 54 89
KumpurBoth Sex 10,012 853 1,229 1,519 1,193 783 624 546 541 519 465 412 326 290 282 168 262Male 4,636 459 605 746 522 273 242 207 235 230 220 221 168 159 142 85 122Female 5,376 394 624 773 671 510 382 339 306 289 245 191 158 131 140 83 140
LapaBoth Sex 3,893 440 489 504 413 298 249 161 199 168 197 141 112 145 124 130 123Male 1,818 231 249 265 183 117 93 51 84 68 98 74 55 70 57 62 61Female 2,075 209 240 239 230 181 156 110 115 100 99 67 57 75 67 68 62
MahadevsthanBoth Sex 6,824 870 1,037 983 711 529 441 353 334 289 229 260 202 191 125 120 150Male 3,416 436 504 513 340 249 219 175 167 149 112 137 109 111 69 61 65Female 3,408 434 533 470 371 280 222 178 167 140 117 123 93 80 56 59 85
MaidiBoth Sex 9,203 758 1,025 1,331 1,073 610 504 427 452 496 418 461 360 356 332 245 355Male 4,110 386 544 644 484 178 142 141 151 205 177 221 171 173 179 126 188Female 5,093 372 481 687 589 432 362 286 301 291 241 240 189 183 153 119 167
MarpakBoth Sex 3,658 289 368 492 493 246 211 157 199 184 166 170 163 154 118 90 158Male 1,590 149 167 236 209 70 76 49 66 82 71 77 73 81 65 43 76Female 2,068 140 201 256 284 176 135 108 133 102 95 93 90 73 53 47 82
MulpaniBoth Sex 3,175 236 315 464 405 202 147 134 132 161 165 199 176 114 112 72 141Male 1,347 109 166 217 163 61 41 42 42 52 65 99 91 57 51 30 61Female 1,828 127 149 247 242 141 106 92 90 109 100 100 85 57 61 42 80
20

Table 2.2: Population by 5 years age group and sex.
00 - 04 05 - 09 10 - 14 15 - 19 20 - 24 25 - 29 30 - 34 35 - 39 40 - 44 45 - 49 50 - 54 55 - 59 60 - 64 65 - 69 70 - 74 75 +Total
Age groupsVDC/ Municipality
and sex
Murali BhanjyangBoth Sex 7,253 631 832 993 840 556 492 410 385 369 317 341 261 259 212 133 222Male 3,277 342 413 473 379 177 184 150 159 159 137 169 129 121 111 64 110Female 3,976 289 419 520 461 379 308 260 226 210 180 172 132 138 101 69 112
NalangBoth Sex 8,067 774 976 1,088 917 517 518 408 405 439 389 389 293 286 244 155 269Male 3,674 386 516 553 392 161 159 161 149 178 196 178 144 163 126 73 139Female 4,393 388 460 535 525 356 359 247 256 261 193 211 149 123 118 82 130
NaubiseBoth Sex 14,553 1,120 1,398 1,839 1,681 1,365 1,187 963 914 846 677 704 491 422 349 237 360Male 7,203 577 702 934 814 643 578 446 455 424 330 370 252 207 169 116 186Female 7,350 543 696 905 867 722 609 517 459 422 347 334 239 215 180 121 174
NilkanthaBoth Sex 20,182 1,803 2,537 2,848 2,340 1,902 1,754 1,409 1,137 965 801 707 523 429 349 288 390Male 9,406 982 1,348 1,508 1,098 668 609 563 489 444 392 354 246 209 159 155 182Female 10,776 821 1,189 1,340 1,242 1,234 1,145 846 648 521 409 353 277 220 190 133 208
PhulkharkaBoth Sex 4,125 357 450 565 510 291 206 219 207 208 180 213 143 161 124 101 190Male 1,769 171 207 273 212 83 63 81 73 81 83 103 71 65 69 51 83Female 2,356 186 243 292 298 208 143 138 134 127 97 110 72 96 55 50 107
PidaBoth Sex 11,043 1,127 1,501 1,650 1,265 904 779 640 640 489 454 403 300 259 229 146 257Male 5,415 571 770 815 595 406 322 289 298 255 223 228 149 146 134 87 127Female 5,628 556 731 835 670 498 457 351 342 234 231 175 151 113 95 59 130
Ree GaunBoth Sex 5,434 489 560 780 634 438 359 259 324 262 256 220 148 198 125 163 219Male 2,471 240 260 359 270 161 145 107 153 110 119 100 83 94 61 85 124Female 2,963 249 300 421 364 277 214 152 171 152 137 120 65 104 64 78 95
SalangBoth Sex 5,650 444 583 817 755 446 361 334 265 321 256 248 193 165 155 110 197Male 2,655 233 287 400 356 177 138 142 116 148 114 133 99 82 76 55 99Female 2,995 211 296 417 399 269 223 192 149 173 142 115 94 83 79 55 98
21

Table 2.2: Population by 5 years age group and sex.
00 - 04 05 - 09 10 - 14 15 - 19 20 - 24 25 - 29 30 - 34 35 - 39 40 - 44 45 - 49 50 - 54 55 - 59 60 - 64 65 - 69 70 - 74 75 +Total
Age groupsVDC/ Municipality
and sex
SalyankotBoth Sex 4,920 409 546 635 664 347 296 231 239 246 231 234 194 185 164 130 169Male 2,113 217 264 293 292 98 104 63 88 90 94 117 76 89 78 64 86Female 2,807 192 282 342 372 249 192 168 151 156 137 117 118 96 86 66 83
SalyantarBoth Sex 7,892 657 878 1,089 962 584 514 450 414 427 441 360 290 287 222 119 198Male 3,539 345 454 546 417 186 162 166 167 174 195 179 147 129 118 63 91Female 4,353 312 424 543 545 398 352 284 247 253 246 181 143 158 104 56 107
SangkoshBoth Sex 5,521 418 628 861 692 398 320 333 293 320 286 240 175 154 150 104 149Male 2,496 190 325 446 316 138 100 123 111 148 135 112 83 68 78 50 73Female 3,025 228 303 415 376 260 220 210 182 172 151 128 92 86 72 54 76
SatyadeviBoth Sex 3,322 334 403 440 346 247 181 146 148 161 161 144 105 153 95 114 144Male 1,454 152 210 212 147 83 56 53 51 59 62 71 53 71 49 48 77Female 1,868 182 193 228 199 164 125 93 97 102 99 73 52 82 46 66 67
SemjongBoth Sex 3,306 249 280 424 406 238 144 124 144 180 199 184 136 182 138 124 154Male 1,454 114 130 196 170 87 52 32 52 66 88 88 58 92 79 59 91Female 1,852 135 150 228 236 151 92 92 92 114 111 96 78 90 59 65 63
SertungBoth Sex 3,597 399 371 474 353 254 186 136 206 148 240 147 127 173 98 144 141Male 1,625 201 193 213 139 81 73 48 93 68 96 73 64 83 52 74 74Female 1,972 198 178 261 214 173 113 88 113 80 144 74 63 90 46 70 67
Sunaula BazarBoth Sex 6,622 572 766 956 749 441 375 304 327 373 324 324 252 273 208 155 223Male 2,932 266 384 467 320 122 120 116 116 141 173 164 119 112 125 79 108Female 3,690 306 382 489 429 319 255 188 211 232 151 160 133 161 83 76 115
TasarpuBoth Sex 5,151 439 673 770 575 399 351 311 254 284 223 208 180 142 122 104 116Male 2,494 238 331 370 261 178 164 148 120 134 118 101 95 77 64 40 55Female 2,657 201 342 400 314 221 187 163 134 150 105 107 85 65 58 64 61
22
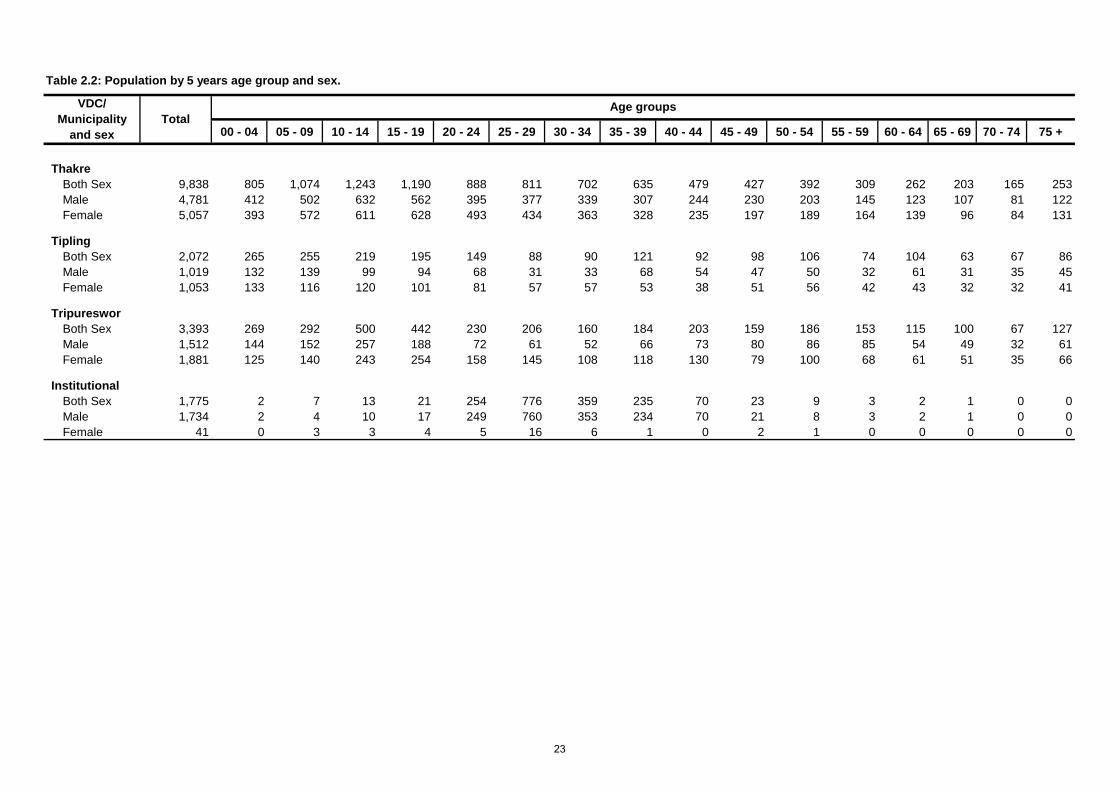
Table 2.2: Population by 5 years age group and sex.
00 - 04 05 - 09 10 - 14 15 - 19 20 - 24 25 - 29 30 - 34 35 - 39 40 - 44 45 - 49 50 - 54 55 - 59 60 - 64 65 - 69 70 - 74 75 +Total
Age groupsVDC/ Municipality
and sex
ThakreBoth Sex 9,838 805 1,074 1,243 1,190 888 811 702 635 479 427 392 309 262 203 165 253Male 4,781 412 502 632 562 395 377 339 307 244 230 203 145 123 107 81 122Female 5,057 393 572 611 628 493 434 363 328 235 197 189 164 139 96 84 131
TiplingBoth Sex 2,072 265 255 219 195 149 88 90 121 92 98 106 74 104 63 67 86Male 1,019 132 139 99 94 68 31 33 68 54 47 50 32 61 31 35 45Female 1,053 133 116 120 101 81 57 57 53 38 51 56 42 43 32 32 41
TripuresworBoth Sex 3,393 269 292 500 442 230 206 160 184 203 159 186 153 115 100 67 127Male 1,512 144 152 257 188 72 61 52 66 73 80 86 85 54 49 32 61Female 1,881 125 140 243 254 158 145 108 118 130 79 100 68 61 51 35 66
InstitutionalBoth Sex 1,775 2 7 13 21 254 776 359 235 70 23 9 3 2 1 0 0Male 1,734 2 4 10 17 249 760 353 234 70 21 8 3 2 1 0 0Female 41 0 3 3 4 5 16 6 1 0 2 1 0 0 0 0 0
23

DhadingTable 2.3 : Population by caste/ethnicity and sex
Total Male Female
AginchokAll Caste 3580 1539 2041Chhetree 1319 545 774Brahman - Hill 455 197 258Magar 248 93 155Newar 344 163 181Kami 106 43 63Damai/Dholi 171 72 99Thakuri 380 183 197Sarki 440 182 258Sanyasi/Dashnami 79 39 40Brahman - Tarai 12 6 6Others 26 16 10
BaireniAll Caste 13369 6630 6739Chhetree 2700 1335 1365Brahman - Hill 2394 1186 1208Magar 482 226 256Tharu 15 10 5Tamang 4509 2191 2318Newar 701 348 353Musalman 125 88 37Kami 738 370 368Rai 33 22 11Gurung 54 27 27Damai/Dholi 322 144 178Thakuri 43 19 24Sarki 590 305 285Sanyasi/Dashnami 64 34 30Sherpa 21 16 5Gharti/Bhujel 435 220 215Majhi 14 13 1Kamar 80 42 38Others 38 28 10Undefined Others 11 6 5
BaseriAll Caste 3660 1609 2051Chhetree 1022 450 572Brahman - Hill 546 246 300Magar 22 10 12Newar 233 110 123Kami 181 80 101Rai 57 29 28Gurung 879 376 503Damai/Dholi 84 37 47Sarki 142 57 85Ghale 492 212 280Others 2 2 0
BenighatAll Caste 9717 4854 4863Chhetree 1758 858 900Brahman - Hill 2224 1102 1122Magar 611 310 301
VDC/Municipality and caste/ethnicity
24

Table 2.3 : Population by caste/ethnicity and sex
Total Male FemaleVDC/Municipality and
caste/ethnicity
Tharu 43 31 12Tamang 487 258 229Newar 669 334 335Musalman 124 81 43Kami 860 406 454Rai 13 8 5Gurung 296 145 151Damai/Dholi 546 270 276Thakuri 26 12 14Sarki 691 325 366Teli 31 22 9Gharti/Bhujel 49 26 23Majhi 13 7 6Nuniya 16 10 6Chepang/Praja 804 414 390Brahmu/Baramo 64 27 37Ghale 332 160 172Others 60 48 12
BhumesthanAll Caste 10786 5323 5463Chhetree 1386 680 706Brahman - Hill 1855 901 954Magar 188 97 91Tamang 5029 2512 2517Newar 53 30 23Musalman 48 22 26Kami 579 277 302Rai 655 312 343Damai/Dholi 275 138 137Thakuri 145 70 75Sarki 16 8 8Sanyasi/Dashnami 142 72 70Gharti/Bhujel 91 44 47Kamar 291 144 147Others 33 16 17
BudhathumAll Caste 3732 1543 2189Chhetree 1098 466 632Brahman - Hill 374 155 219Magar 220 84 136Newar 536 228 308Kami 159 73 86Gurung 135 55 80Damai/Dholi 111 53 58Sarki 308 127 181Ghale 777 295 482Others 14 7 7
ChainpurAll Caste 6349 2747 3602Chhetree 655 285 370Brahman - Hill 1851 794 1057Magar 504 224 280Tamang 150 71 79
25
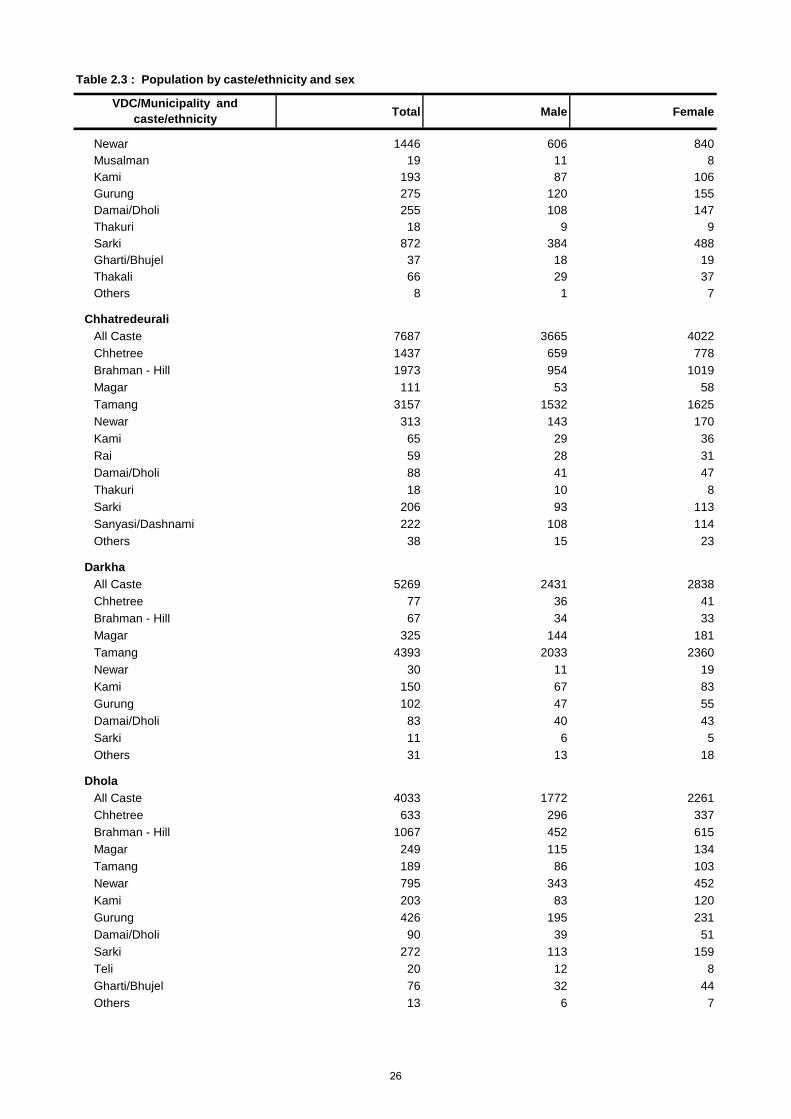
Table 2.3 : Population by caste/ethnicity and sex
Total Male FemaleVDC/Municipality and
caste/ethnicity
Newar 1446 606 840Musalman 19 11 8Kami 193 87 106Gurung 275 120 155Damai/Dholi 255 108 147Thakuri 18 9 9Sarki 872 384 488Gharti/Bhujel 37 18 19Thakali 66 29 37Others 8 1 7
ChhatredeuraliAll Caste 7687 3665 4022Chhetree 1437 659 778Brahman - Hill 1973 954 1019Magar 111 53 58Tamang 3157 1532 1625Newar 313 143 170Kami 65 29 36Rai 59 28 31Damai/Dholi 88 41 47Thakuri 18 10 8Sarki 206 93 113Sanyasi/Dashnami 222 108 114Others 38 15 23
DarkhaAll Caste 5269 2431 2838Chhetree 77 36 41Brahman - Hill 67 34 33Magar 325 144 181Tamang 4393 2033 2360Newar 30 11 19Kami 150 67 83Gurung 102 47 55Damai/Dholi 83 40 43Sarki 11 6 5Others 31 13 18
DholaAll Caste 4033 1772 2261Chhetree 633 296 337Brahman - Hill 1067 452 615Magar 249 115 134Tamang 189 86 103Newar 795 343 452Kami 203 83 120Gurung 426 195 231Damai/Dholi 90 39 51Sarki 272 113 159Teli 20 12 8Gharti/Bhujel 76 32 44Others 13 6 7
26

Table 2.3 : Population by caste/ethnicity and sex
Total Male FemaleVDC/Municipality and
caste/ethnicity
DhussaAll Caste 7190 3548 3642Chhetree 650 307 343Brahman - Hill 640 314 326Magar 569 267 302Tamang 39 23 16Newar 868 422 446Musalman 39 23 16Kami 312 163 149Gurung 162 81 81Damai/Dholi 152 71 81Thakuri 15 8 7Sarki 139 67 72Sanyasi/Dashnami 78 34 44Sunuwar 13 5 8Chepang/Praja 3416 1718 1698Ghale 25 11 14Others 30 15 15Dalit Others 43 19 24
DhuwakotAll Caste 4762 2152 2610Chhetree 465 206 259Brahman - Hill 1167 546 621Magar 362 164 198Tamang 1200 515 685Newar 453 221 232Kami 192 85 107Gurung 719 316 403Damai/Dholi 102 52 50Thakuri 14 8 6Gharti/Bhujel 14 5 9Ghale 59 26 33Others 15 8 7
GajuriAll Caste 10035 4968 5067Chhetree 1301 620 681Brahman - Hill 1776 878 898Magar 525 244 281Tharu 23 13 10Tamang 2229 1120 1109Newar 646 315 331Musalman 75 52 23Kami 597 298 299Gurung 101 46 55Damai/Dholi 375 195 180Thakuri 18 8 10Sarki 591 288 303Sanyasi/Dashnami 74 41 33Gharti/Bhujel 44 20 24Majhi 17 10 7Chepang/Praja 1405 711 694Ghale 181 80 101Others 57 29 28
27

Table 2.3 : Population by caste/ethnicity and sex
Total Male FemaleVDC/Municipality and
caste/ethnicity
GoganpaniAll Caste 5563 2696 2867Chhetree 727 346 381Brahman - Hill 1003 487 516Magar 618 298 320Tamang 1722 828 894Newar 387 188 199Kami 195 89 106Rai 155 75 80Damai/Dholi 103 59 44Sarki 310 149 161Sanyasi/Dashnami 30 16 14Gharti/Bhujel 153 77 76Chepang/Praja 86 42 44Badi 27 16 11Others 22 12 10Dalit Others 25 14 11
GumdiAll Caste 4833 2135 2698Chhetree 627 267 360Brahman - Hill 410 190 220Magar 185 91 94Tamang 648 288 360Newar 246 111 135Kami 247 118 129Gurung 1440 636 804Damai/Dholi 101 49 52Sarki 58 23 35Ghale 853 357 496Others 18 5 13
JeewanpurAll Caste 8789 4329 4460Chhetree 1856 923 933Brahman - Hill 2434 1181 1253Magar 691 346 345Tharu 16 9 7Tamang 1458 726 732Newar 666 332 334Kami 146 70 76Rai 96 48 48Damai/Dholi 182 96 86Thakuri 188 90 98Sarki 758 363 395Sanyasi/Dashnami 13 6 7Gharti/Bhujel 140 64 76Danuwar 88 50 38Bhote 23 8 15Others 34 17 17
JharlangAll Caste 4158 1962 2196Brahman - Hill 12 1 11Tamang 3959 1873 2086Kami 162 75 87Others 25 13 12
28

Table 2.3 : Population by caste/ethnicity and sex
Total Male FemaleVDC/Municipality and
caste/ethnicity
JogimaraAll Caste 7744 3842 3902Chhetree 708 347 361Brahman - Hill 512 247 265Magar 837 417 420Tamang 35 15 20Newar 524 266 258Musalman 44 19 25Kami 248 113 135Rai 33 14 19Gurung 572 283 289Damai/Dholi 102 46 56Thakuri 507 251 256Sanyasi/Dashnami 170 81 89Chepang/Praja 3223 1635 1588Ghale 180 87 93Others 49 21 28
JyamrungAll Caste 6998 3024 3974Chhetree 1557 683 874Brahman - Hill 1214 540 674Magar 875 375 500Newar 1525 667 858Kami 172 73 99Gurung 649 257 392Damai/Dholi 206 92 114Thakuri 182 81 101Sarki 564 233 331Sanyasi/Dashnami 33 14 19Others 21 9 12
KalleriAll Caste 8852 4059 4793Chhetree 558 267 291Brahman - Hill 2005 906 1099Magar 2034 909 1125Newar 1086 505 581Kami 520 250 270Damai/Dholi 269 123 146Thakuri 216 100 116Sarki 1430 649 781Sanyasi/Dashnami 44 23 21Gharti/Bhujel 302 143 159Majhi 84 42 42Danuwar 274 131 143Others 30 11 19
KatunjeAll Caste 5906 2559 3347Chhetree 448 192 256Brahman - Hill 619 267 352Magar 248 97 151Tamang 2163 918 1245Newar 924 409 515
29

Table 2.3 : Population by caste/ethnicity and sex
Total Male FemaleVDC/Municipality and
caste/ethnicity
Kami 267 112 155Gurung 827 379 448Damai/Dholi 173 82 91Ghale 213 93 120Others 24 10 14
KewalpurAll Caste 5010 2412 2598Chhetree 806 410 396Brahman - Hill 1797 854 943Magar 63 25 38Tamang 1033 498 535Newar 450 218 232Kami 214 97 117Gurung 29 11 18Damai/Dholi 178 78 100Sarki 227 111 116Gharti/Bhujel 178 88 90Chepang/Praja 12 6 6Others 23 16 7
KhalteAll Caste 7177 3223 3954Chhetree 301 150 151Brahman - Hill 1133 518 615Magar 1212 541 671Tamang 460 206 254Newar 1168 540 628Kami 102 47 55Gurung 1916 839 1077Damai/Dholi 29 14 15Sarki 687 293 394Sanyasi/Dashnami 57 22 35Brahmu/Baramo 96 44 52Others 16 9 7
KhariAll Caste 4381 1944 2437Chhetree 1023 447 576Brahman - Hill 373 175 198Magar 1077 469 608Tamang 284 140 144Newar 334 141 193Kami 150 60 90Gurung 367 161 206Damai/Dholi 81 37 44Sarki 277 126 151Gharti/Bhujel 92 40 52Kumal 305 138 167Others 18 10 8
KiranchokAll Caste 6006 2928 3078Chhetree 1357 645 712Brahman - Hill 751 346 405Magar 161 78 83
30

Table 2.3 : Population by caste/ethnicity and sex
Total Male FemaleVDC/Municipality and
caste/ethnicity
Tamang 3029 1512 1517Newar 258 118 140Kami 77 41 36Damai/Dholi 111 56 55Sarki 208 103 105Chepang/Praja 23 11 12Others 18 12 6Undefined Others 13 6 7
KumpurAll Caste 10012 4636 5376Chhetree 449 209 240Brahman - Hill 1445 668 777Magar 1366 640 726Tamang 36 14 22Newar 2182 1005 1177Kami 547 253 294Rai 21 11 10Gurung 302 124 178Damai/Dholi 324 140 184Limbu 11 5 6Sarki 1053 492 561Sanyasi/Dashnami 334 164 170Gharti/Bhujel 256 128 128Majhi 250 126 124Chepang/Praja 35 16 19Ghale 1377 631 746Others 24 10 14
LapaAll Caste 3893 1818 2075Brahman - Hill 16 9 7Tamang 2866 1331 1535Kami 126 53 73Gurung 590 294 296Ghale 232 103 129Others 18 9 9Dalit Others 45 19 26
MahadevsthanAll Caste 6824 3416 3408Chhetree 179 90 89Brahman - Hill 156 78 78Magar 637 317 320Tamang 2642 1332 1310Newar 142 70 72Kami 116 55 61Gurung 224 106 118Damai/Dholi 101 43 58Gharti/Bhujel 90 42 48Chepang/Praja 2510 1271 1239Others 27 12 15
31

Table 2.3 : Population by caste/ethnicity and sex
Total Male FemaleVDC/Municipality and
caste/ethnicity
MaidiAll Caste 9203 4110 5093Chhetree 1020 439 581Brahman - Hill 1415 621 794Magar 1725 763 962Tamang 750 353 397Newar 1572 722 850Kami 389 170 219Gurung 62 24 38Damai/Dholi 231 97 134Thakuri 166 74 92Sarki 682 292 390Sanyasi/Dashnami 267 123 144Gharti/Bhujel 35 16 19Kumal 758 353 405Hajam/Thakur 43 19 24Majhi 61 33 28Others 27 11 16
MarpakAll Caste 3658 1590 2068Chhetree 1028 457 571Brahman - Hill 129 55 74Magar 491 223 268Tamang 1145 479 666Newar 25 9 16Kami 236 99 137Gurung 242 102 140Damai/Dholi 181 80 101Badi 18 8 10Ghale 153 71 82Others 10 7 3
MulpaniAll Caste 3175 1347 1828Chhetree 1407 567 840Brahman - Hill 80 38 42Magar 874 383 491Tamang 19 7 12Newar 156 70 86Kami 101 45 56Gurung 101 45 56Damai/Dholi 64 34 30Sarki 306 130 176Ghale 43 19 24Others 13 4 9Terai Others 11 5 6
Murali BhanjyangAll Caste 7253 3277 3976Chhetree 999 450 549Brahman - Hill 1272 602 670Magar 221 87 134Tamang 232 101 131Newar 1920 855 1065Kami 667 292 375
32
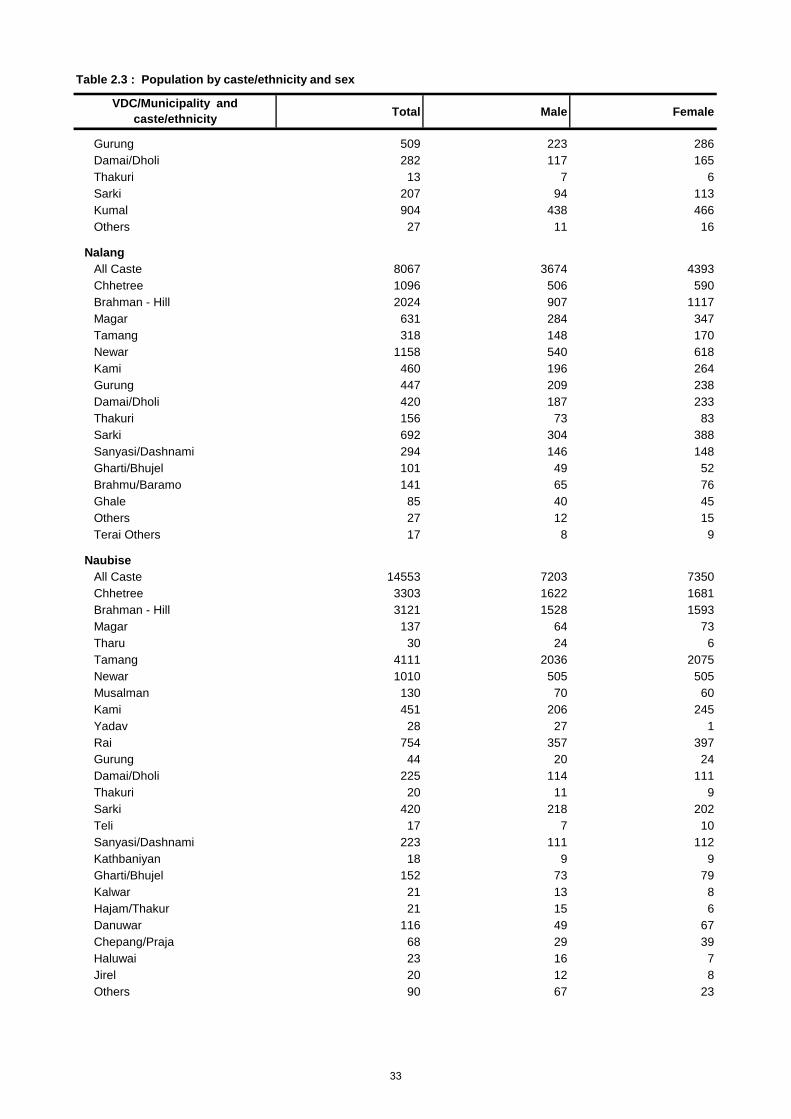
Table 2.3 : Population by caste/ethnicity and sex
Total Male FemaleVDC/Municipality and
caste/ethnicity
Gurung 509 223 286Damai/Dholi 282 117 165Thakuri 13 7 6Sarki 207 94 113Kumal 904 438 466Others 27 11 16
NalangAll Caste 8067 3674 4393Chhetree 1096 506 590Brahman - Hill 2024 907 1117Magar 631 284 347Tamang 318 148 170Newar 1158 540 618Kami 460 196 264Gurung 447 209 238Damai/Dholi 420 187 233Thakuri 156 73 83Sarki 692 304 388Sanyasi/Dashnami 294 146 148Gharti/Bhujel 101 49 52Brahmu/Baramo 141 65 76Ghale 85 40 45Others 27 12 15Terai Others 17 8 9
NaubiseAll Caste 14553 7203 7350Chhetree 3303 1622 1681Brahman - Hill 3121 1528 1593Magar 137 64 73Tharu 30 24 6Tamang 4111 2036 2075Newar 1010 505 505Musalman 130 70 60Kami 451 206 245Yadav 28 27 1Rai 754 357 397Gurung 44 20 24Damai/Dholi 225 114 111Thakuri 20 11 9Sarki 420 218 202Teli 17 7 10Sanyasi/Dashnami 223 111 112Kathbaniyan 18 9 9Gharti/Bhujel 152 73 79Kalwar 21 13 8Hajam/Thakur 21 15 6Danuwar 116 49 67Chepang/Praja 68 29 39Haluwai 23 16 7Jirel 20 12 8Others 90 67 23
33

Table 2.3 : Population by caste/ethnicity and sex
Total Male FemaleVDC/Municipality and
caste/ethnicity
NilkanthaAll Caste 20182 9406 10776Chhetree 2566 1214 1352Brahman - Hill 2783 1351 1432Magar 2040 897 1143Tharu 26 16 10Tamang 2432 1118 1314Newar 3436 1644 1792Musalman 150 83 67Kami 848 404 444Yadav 20 14 6Rai 36 15 21Gurung 3658 1625 2033Damai/Dholi 424 194 230Thakuri 323 146 177Sarki 766 333 433Teli 39 22 17Sanyasi/Dashnami 56 30 26Gharti/Bhujel 73 34 39Kalwar 69 38 31Kumal 65 34 31Hajam/Thakur 23 18 5Kanu 17 11 6Badi 19 11 8Ghale 218 94 124Others 78 48 30Dalit Others 17 12 5
PhulkharkaAll Caste 4125 1769 2356Chhetree 1371 580 791Brahman - Hill 132 55 77Magar 516 228 288Tamang 589 264 325Newar 56 22 34Kami 262 116 146Gurung 525 218 307Damai/Dholi 120 57 63Sarki 120 51 69Gharti/Bhujel 90 38 52Ghale 338 138 200Others 6 2 4
PidaAll Caste 11043 5415 5628Chhetree 1813 881 932Brahman - Hill 1403 661 742Magar 692 344 348Tamang 1645 816 829Newar 623 316 307Musalman 39 19 20Kami 519 233 286Rai 69 37 32Gurung 77 35 42Damai/Dholi 289 151 138
34

Table 2.3 : Population by caste/ethnicity and sex
Total Male FemaleVDC/Municipality and
caste/ethnicity
Sarki 360 179 181Gharti/Bhujel 491 245 246Danuwar 464 216 248Chepang/Praja 2499 1255 1244Ghale 29 14 15Others 31 13 18
Ree GaunAll Caste 5434 2471 2963Tamang 5293 2404 2889Kami 109 53 56Ghale 14 5 9Others 18 9 9
SalangAll Caste 5650 2655 2995Chhetree 131 67 64Brahman - Hill 869 424 445Magar 2662 1248 1414Newar 582 276 306Kami 172 79 93Damai/Dholi 154 74 80Thakuri 57 21 36Sarki 520 242 278Sanyasi/Dashnami 372 163 209Gharti/Bhujel 19 11 8Majhi 53 25 28Gaine 28 14 14Others 31 11 20
SalyankotAll Caste 4920 2113 2807Chhetree 1126 461 665Brahman - Hill 826 370 456Magar 1365 607 758Tamang 18 7 11Newar 313 140 173Kami 257 103 154Rai 11 4 7Gurung 138 66 72Damai/Dholi 235 104 131Thakuri 136 57 79Sarki 462 178 284Sanyasi/Dashnami 18 6 12Others 15 10 5
SalyantarAll Caste 7892 3539 4353Chhetree 793 360 433Brahman - Hill 870 371 499Magar 69 28 41Tamang 88 40 48Newar 1253 572 681Musalman 53 26 27Kami 292 137 155Gurung 195 80 115
35
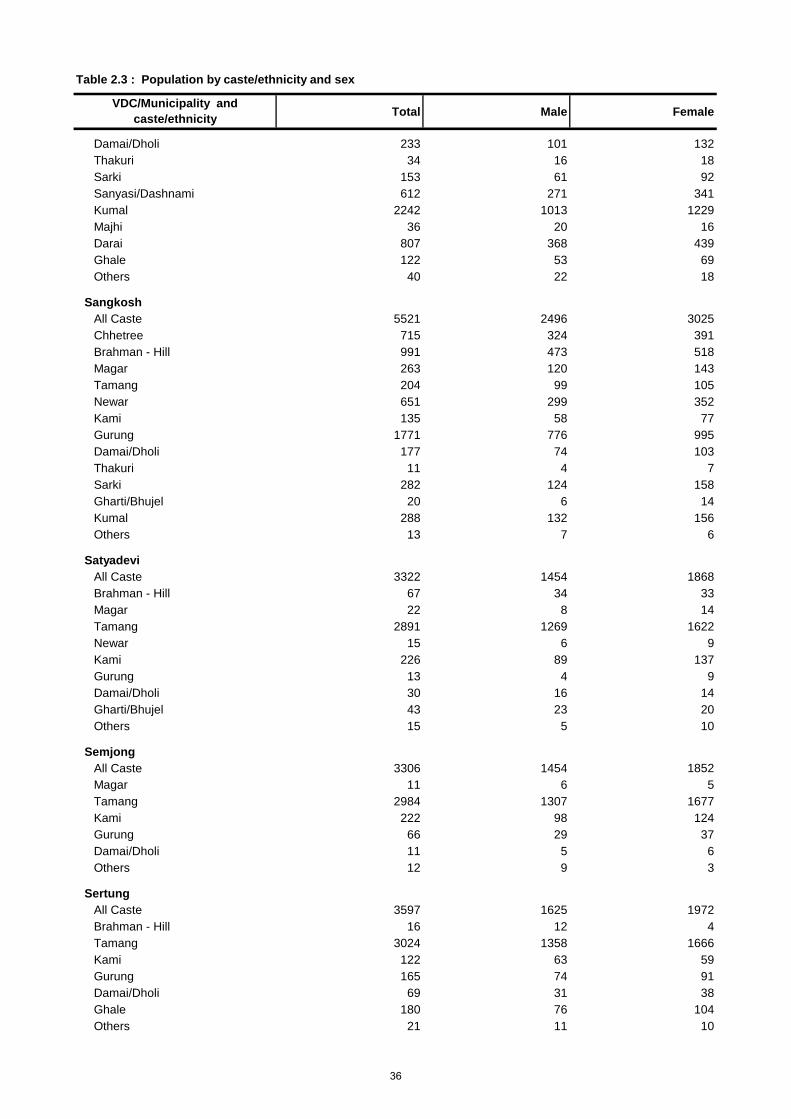
Table 2.3 : Population by caste/ethnicity and sex
Total Male FemaleVDC/Municipality and
caste/ethnicity
Damai/Dholi 233 101 132Thakuri 34 16 18Sarki 153 61 92Sanyasi/Dashnami 612 271 341Kumal 2242 1013 1229Majhi 36 20 16Darai 807 368 439Ghale 122 53 69Others 40 22 18
SangkoshAll Caste 5521 2496 3025Chhetree 715 324 391Brahman - Hill 991 473 518Magar 263 120 143Tamang 204 99 105Newar 651 299 352Kami 135 58 77Gurung 1771 776 995Damai/Dholi 177 74 103Thakuri 11 4 7Sarki 282 124 158Gharti/Bhujel 20 6 14Kumal 288 132 156Others 13 7 6
SatyadeviAll Caste 3322 1454 1868Brahman - Hill 67 34 33Magar 22 8 14Tamang 2891 1269 1622Newar 15 6 9Kami 226 89 137Gurung 13 4 9Damai/Dholi 30 16 14Gharti/Bhujel 43 23 20Others 15 5 10
SemjongAll Caste 3306 1454 1852Magar 11 6 5Tamang 2984 1307 1677Kami 222 98 124Gurung 66 29 37Damai/Dholi 11 5 6Others 12 9 3
SertungAll Caste 3597 1625 1972Brahman - Hill 16 12 4Tamang 3024 1358 1666Kami 122 63 59Gurung 165 74 91Damai/Dholi 69 31 38Ghale 180 76 104Others 21 11 10
36

Table 2.3 : Population by caste/ethnicity and sex
Total Male FemaleVDC/Municipality and
caste/ethnicity
Sunaula BazarAll Caste 6622 2932 3690Chhetree 393 192 201Brahman - Hill 1046 467 579Magar 1205 510 695Newar 1133 522 611Kami 307 129 178Gurung 373 160 213Damai/Dholi 381 168 213Thakuri 291 126 165Sarki 1270 548 722Sanyasi/Dashnami 154 79 75Sherpa 22 10 12Gharti/Bhujel 32 13 19Others 15 8 7
TasarpuAll Caste 5151 2494 2657Chhetree 503 244 259Brahman - Hill 376 176 200Magar 613 311 302Tamang 3328 1594 1734Newar 110 59 51Kami 47 20 27Rai 39 18 21Damai/Dholi 51 31 20Sanyasi/Dashnami 13 8 5Gharti/Bhujel 18 8 10Chepang/Praja 13 5 8Others 40 20 20
ThakreAll Caste 9838 4781 5057Chhetree 3960 1901 2059Brahman - Hill 1633 783 850Magar 262 121 141Tharu 11 4 7Tamang 1926 954 972Newar 272 139 133Musalman 83 50 33Kami 269 131 138Rai 112 50 62Gurung 68 30 38Damai/Dholi 188 92 96Limbu 23 11 12Thakuri 90 40 50Sarki 40 23 17Sanyasi/Dashnami 30 12 18Gharti/Bhujel 307 153 154Kalwar 18 8 10Chepang/Praja 382 183 199Badi 89 48 41Ghale 13 8 5Others 62 40 22
37

Table 2.3 : Population by caste/ethnicity and sex
Total Male FemaleVDC/Municipality and
caste/ethnicity
TiplingAll Caste 2072 1019 1053Tamang 1197 595 602Kami 88 43 45Ghale 776 375 401Others 11 6 5
TripuresworAll Caste 3393 1512 1881Chhetree 1434 641 793Brahman - Hill 795 354 441Magar 250 115 135Tamang 211 90 121Newar 212 83 129Kami 213 101 112Gurung 17 9 8Damai/Dholi 129 58 71Thakuri 19 8 11Sarki 77 34 43Ghale 18 8 10Others 18 11 7
InstitutionalAll Caste 1775 1734 41Chhetree 671 657 14Brahman - Hill 212 205 7Magar 165 161 4Tharu 81 80 1Tamang 108 106 2Newar 96 96 0Musalman 19 19 0Kami 45 41 4Yadav 18 18 0Rai 19 19 0Gurung 57 53 4Damai/Dholi 30 29 1Thakuri 39 39 0Sarki 22 21 1Sanyasi/Dashnami 32 31 1Kathbaniyan 15 15 0Kumal 17 17 0Hajam/Thakur 11 11 0Others 118 116 2
38

DhadingTable 2.4 : Population by mother tongue and sex.
Total Male Female
AginchokAll Mother Tongue 3,580 1,539 2,041Nepali 3,567 1,530 2,037Others 13 9 4
BaireniAll Mother Tongue 13,369 6,630 6,739Nepali 9,061 4,469 4,592Maithili 34 32 2Bhojpuri 76 57 19Tamang 3,968 1,921 2,047Newar 44 25 19Magar 37 18 19Gurung 20 9 11Urdu 23 19 4Sherpa 13 13 0Hindi 60 48 12Others 13 7 6Not Reported 20 12 8
BaseriAll Mother Tongue 3,660 1,609 2,051Nepali 2,527 1,128 1,399Gurung 668 284 384Ghale 459 196 263Others 6 1 5
BenighatAll Mother Tongue 9,717 4,854 4,863Nepali 8,359 4,110 4,249Maithili 49 40 9Bhojpuri 85 66 19Tharu 24 18 6Tamang 356 189 167Newar 35 19 16Magar 189 86 103Gurung 14 5 9Hindi 38 33 5Chepang 555 278 277Others 13 10 3
BhumesthanAll Mother Tongue 10,786 5,323 5,463Nepali 5,769 2,821 2,948Tamang 4,910 2,448 2,462Newar 27 12 15Magar 15 8 7Urdu 20 10 10Rai 23 12 11Others 22 12 10
BudhathumAll Mother Tongue 3,732 1,543 2,189Nepali 2,953 1,249 1,704Gurung 18 7 11Ghale 754 284 470Others 7 3 4
VDC/Municipality and mother tongue
39

Table 2.4 : Population by mother tongue and sex.
Total Male FemaleVDC/Municipality and
mother tongue
ChainpurAll Mother Tongue 6,349 2,747 3,602Nepali 5,905 2,535 3,370Tamang 124 61 63Newar 65 35 30Magar 200 93 107Gurung 42 19 23Others 13 4 9
ChhatredeuraliAll Mother Tongue 7,687 3,665 4,022Nepali 5,000 2,366 2,634Tamang 2,401 1,171 1,230Newar 267 120 147Others 19 8 11
DarkhaAll Mother Tongue 5,269 2,431 2,838Nepali 925 421 504Tamang 4,242 1,960 2,282Gurung 58 25 33Others 15 9 6Not Reported 29 16 13
DholaAll Mother Tongue 4,033 1,772 2,261Nepali 3,586 1,579 2,007Tamang 186 84 102Newar 209 87 122Magar 27 9 18Others 14 6 8Not Reported 11 7 4
DhussaAll Mother Tongue 7,190 3,548 3,642Nepali 3,807 1,837 1,970Tamang 21 12 9Newar 39 21 18Magar 35 20 15Gurung 12 5 7Urdu 24 10 14Hindi 15 13 2Chepang 3,216 1,620 1,596Others 10 7 3Not Reported 11 3 8
DhuwakotAll Mother Tongue 4,762 2,152 2,610Nepali 3,799 1,731 2,068Tamang 862 378 484Gurung 71 25 46Others 30 18 12
40

Table 2.4 : Population by mother tongue and sex.
Total Male FemaleVDC/Municipality and
mother tongue
GajuriAll Mother Tongue 10,035 4,968 5,067Nepali 8,069 3,975 4,094Maithili 12 11 1Bhojpuri 43 38 5Tamang 1,614 801 813Newar 66 23 43Magar 105 47 58Urdu 27 18 9Chepang 60 32 28Others 39 23 16
GoganpaniAll Mother Tongue 5,563 2,696 2,867Nepali 3,944 1,920 2,024Tamang 1,355 644 711Newar 39 22 17Magar 202 97 105Others 11 6 5Not Reported 12 7 5
GumdiAll Mother Tongue 4,833 2,135 2,698Nepali 2,351 1,048 1,303Tamang 641 285 356Newar 39 18 21Gurung 1,323 586 737Ghale 471 195 276Others 8 3 5
JeewanpurAll Mother Tongue 8,789 4,329 4,460Nepali 8,149 4,018 4,131Tharu 11 7 4Tamang 403 188 215Newar 217 111 106Others 9 5 4
JharlangAll Mother Tongue 4,158 1,962 2,196Nepali 186 83 103Tamang 3,957 1,872 2,085Others 15 7 8
JogimaraAll Mother Tongue 7,744 3,842 3,902Nepali 4,306 2,122 2,184Tamang 31 12 19Newar 97 49 48Magar 514 261 253Gurung 325 165 160Urdu 34 15 19Chepang 2,289 1,149 1,140Ghale 93 45 48Rai 21 10 11Others 34 14 20
41

Table 2.4 : Population by mother tongue and sex.
Total Male FemaleVDC/Municipality and
mother tongue
JyamrungAll Mother Tongue 6,998 3,024 3,974Nepali 6,928 2,996 3,932Newar 44 15 29Gurung 11 3 8Others 15 10 5
KalleriAll Mother Tongue 8,852 4,059 4,793Nepali 8,804 4,037 4,767Newar 30 15 15Magar 15 6 9Others 3 1 2
KatunjeAll Mother Tongue 5,906 2,559 3,347Nepali 4,629 2,023 2,606Tamang 1,228 512 716Newar 26 14 12Others 23 10 13
KewalpurAll Mother Tongue 5,010 2,412 2,598Nepali 4,170 2,019 2,151Tamang 791 371 420Newar 35 15 20Others 14 7 7
KhalteAll Mother Tongue 7,177 3,223 3,954Nepali 5,323 2,407 2,916Tamang 458 205 253Magar 22 6 16Gurung 1,367 601 766Others 7 4 3
KhariAll Mother Tongue 4,381 1,944 2,437Nepali 3,964 1,752 2,212Maithili 12 7 5Tamang 281 139 142Magar 121 43 78Others 3 3 0
KiranchokAll Mother Tongue 6,006 2,928 3,078Nepali 3,082 1,464 1,618Tamang 2,905 1,456 1,449Others 2 2 0Not Reported 17 6 11
KumpurAll Mother Tongue 10,012 4,636 5,376Nepali 9,884 4,577 5,307Magar 98 40 58Others 30 19 11
42
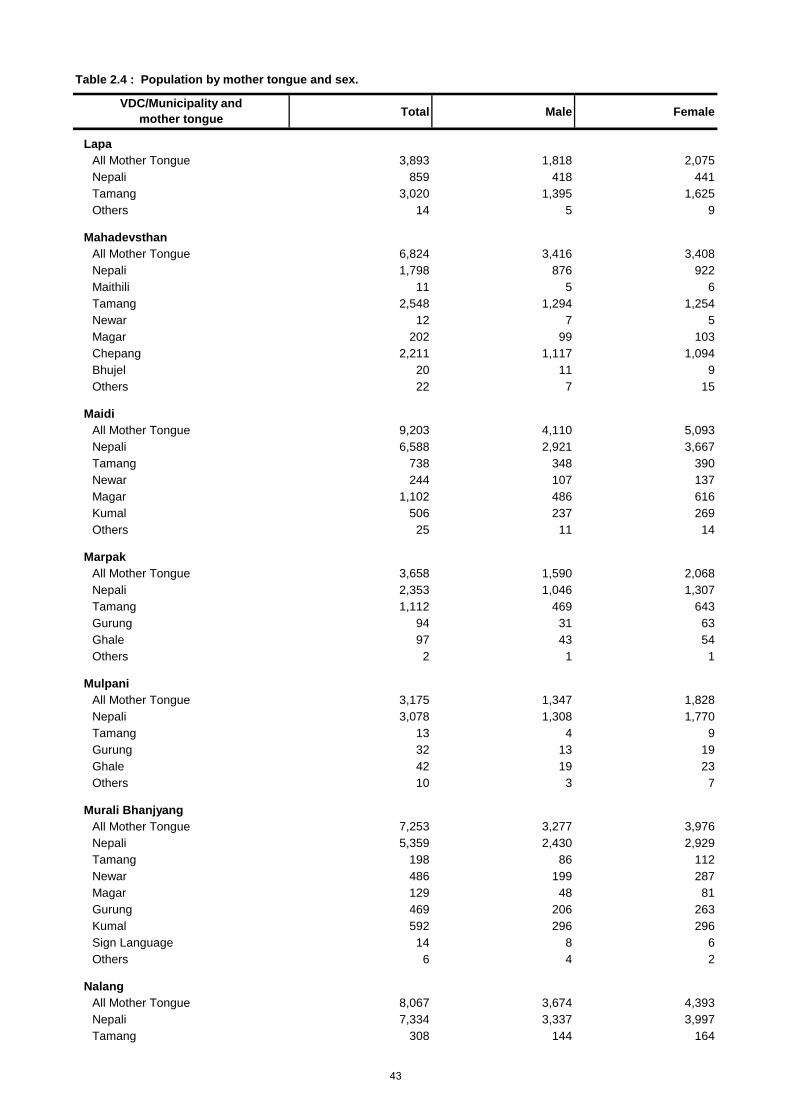
Table 2.4 : Population by mother tongue and sex.
Total Male FemaleVDC/Municipality and
mother tongue
LapaAll Mother Tongue 3,893 1,818 2,075Nepali 859 418 441Tamang 3,020 1,395 1,625Others 14 5 9
MahadevsthanAll Mother Tongue 6,824 3,416 3,408Nepali 1,798 876 922Maithili 11 5 6Tamang 2,548 1,294 1,254Newar 12 7 5Magar 202 99 103Chepang 2,211 1,117 1,094Bhujel 20 11 9Others 22 7 15
MaidiAll Mother Tongue 9,203 4,110 5,093Nepali 6,588 2,921 3,667Tamang 738 348 390Newar 244 107 137Magar 1,102 486 616Kumal 506 237 269Others 25 11 14
MarpakAll Mother Tongue 3,658 1,590 2,068Nepali 2,353 1,046 1,307Tamang 1,112 469 643Gurung 94 31 63Ghale 97 43 54Others 2 1 1
MulpaniAll Mother Tongue 3,175 1,347 1,828Nepali 3,078 1,308 1,770Tamang 13 4 9Gurung 32 13 19Ghale 42 19 23Others 10 3 7
Murali BhanjyangAll Mother Tongue 7,253 3,277 3,976Nepali 5,359 2,430 2,929Tamang 198 86 112Newar 486 199 287Magar 129 48 81Gurung 469 206 263Kumal 592 296 296Sign Language 14 8 6Others 6 4 2
NalangAll Mother Tongue 8,067 3,674 4,393Nepali 7,334 3,337 3,997Tamang 308 144 164
43
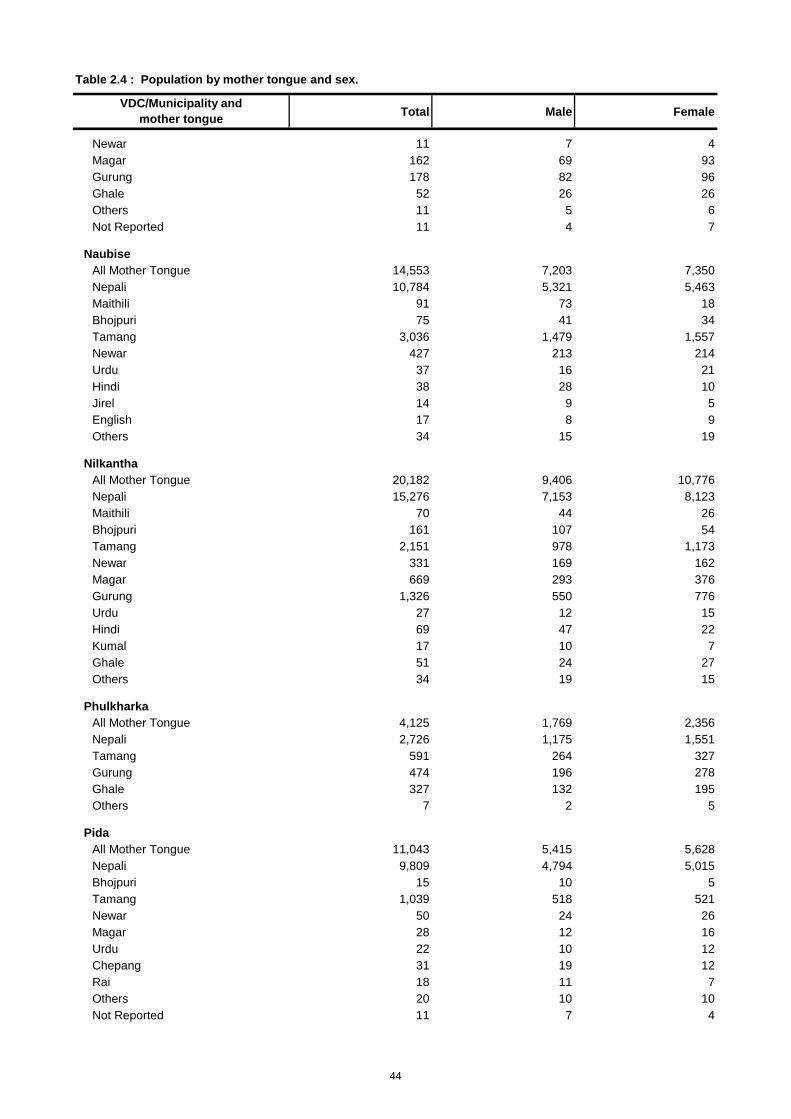
Table 2.4 : Population by mother tongue and sex.
Total Male FemaleVDC/Municipality and
mother tongue
Newar 11 7 4Magar 162 69 93Gurung 178 82 96Ghale 52 26 26Others 11 5 6Not Reported 11 4 7
NaubiseAll Mother Tongue 14,553 7,203 7,350Nepali 10,784 5,321 5,463Maithili 91 73 18Bhojpuri 75 41 34Tamang 3,036 1,479 1,557Newar 427 213 214Urdu 37 16 21Hindi 38 28 10Jirel 14 9 5English 17 8 9Others 34 15 19
NilkanthaAll Mother Tongue 20,182 9,406 10,776Nepali 15,276 7,153 8,123Maithili 70 44 26Bhojpuri 161 107 54Tamang 2,151 978 1,173Newar 331 169 162Magar 669 293 376Gurung 1,326 550 776Urdu 27 12 15Hindi 69 47 22Kumal 17 10 7Ghale 51 24 27Others 34 19 15
PhulkharkaAll Mother Tongue 4,125 1,769 2,356Nepali 2,726 1,175 1,551Tamang 591 264 327Gurung 474 196 278Ghale 327 132 195Others 7 2 5
PidaAll Mother Tongue 11,043 5,415 5,628Nepali 9,809 4,794 5,015Bhojpuri 15 10 5Tamang 1,039 518 521Newar 50 24 26Magar 28 12 16Urdu 22 10 12Chepang 31 19 12Rai 18 11 7Others 20 10 10Not Reported 11 7 4
44

Table 2.4 : Population by mother tongue and sex.
Total Male FemaleVDC/Municipality and
mother tongue
Ree GaunAll Mother Tongue 5,434 2,471 2,963Nepali 126 63 63Tamang 5,297 2,402 2,895Others 11 6 5
SalangAll Mother Tongue 5,650 2,655 2,995Nepali 3,236 1,525 1,711Newar 33 18 15Magar 2,302 1,075 1,227Majhi 48 24 24Others 9 4 5Not Reported 22 9 13
SalyankotAll Mother Tongue 4,920 2,113 2,807Nepali 4,888 2,097 2,791Others 16 8 8Not Reported 16 8 8
SalyantarAll Mother Tongue 7,892 3,539 4,353Nepali 7,135 3,169 3,966Bhojpuri 21 14 7Tamang 88 42 46Newar 109 56 53Gurung 97 43 54Urdu 30 13 17Hindi 11 5 6Kumal 274 138 136Ghale 105 43 62Others 22 16 6
SangkoshAll Mother Tongue 5,521 2,496 3,025Nepali 5,090 2,301 2,789Tamang 144 65 79Newar 18 10 8Magar 16 6 10Gurung 54 23 31Kumal 198 91 107Others 1 0 1
SatyadeviAll Mother Tongue 3,322 1,454 1,868Nepali 441 193 248Tamang 2,862 1,252 1,610Others 8 3 5Not Reported 11 6 5
SemjongAll Mother Tongue 3,306 1,454 1,852Nepali 326 150 176Tamang 2,972 1,301 1,671Others 8 3 5
45

Table 2.4 : Population by mother tongue and sex.
Total Male FemaleVDC/Municipality and
mother tongue
SertungAll Mother Tongue 3,597 1,625 1,972Nepali 394 192 202Tamang 3,175 1,419 1,756Gurung 14 6 8Others 14 8 6
Sunaula BazarAll Mother Tongue 6,622 2,932 3,690Nepali 6,123 2,713 3,410Newar 13 8 5Magar 167 71 96Gurung 305 132 173Others 14 8 6
TasarpuAll Mother Tongue 5,151 2,494 2,657Nepali 1,794 889 905Tamang 3,311 1,585 1,726Magar 12 6 6Others 34 14 20
ThakreAll Mother Tongue 9,838 4,781 5,057Nepali 7,931 3,840 4,091Maithili 43 25 18Bhojpuri 32 22 10Tamang 1,609 792 817Newar 25 12 13Magar 23 9 14Gurung 20 6 14Urdu 29 16 13Hindi 19 13 6Chepang 75 29 46Others 32 17 15
TiplingAll Mother Tongue 2,072 1,019 1,053Nepali 101 51 50Tamang 1,968 968 1,000Others 3 0 3
TripuresworAll Mother Tongue 3,393 1,512 1,881Nepali 3,188 1,424 1,764Tamang 194 80 114Others 11 8 3
InstitutionalAll Mother Tongue 1,775 1,734 41Nepali 1,559 1,524 35Maithili 31 31 0Bhojpuri 40 40 0Tamang 56 54 2Newar 13 13 0Magar 19 18 1Gurung 17 16 1Urdu 12 12 0Others 28 26 2
46

DhadingTable 2.5 : Population by disability and sex.
Physical Blindness/ low vision
Deaf / hard to hearing
Deaf – blind
Speech problem
Mental disable
Intellectual disable
Multiple disable
TotalBoth Sex 336,067 328,240 2,562 1,440 1,208 144 974 440 419 640Male 157,834 153,570 1,477 688 655 73 565 222 237 347Female 178,233 174,670 1,085 752 553 71 409 218 182 293
AginchokBoth Sex 3,580 3,450 26 29 31 2 21 11 0 10Male 1,539 1,469 16 13 13 1 14 6 0 7Female 2,041 1,981 10 16 18 1 7 5 0 3
BaireniBoth Sex 13,369 13,103 98 42 29 6 41 10 19 21Male 6,630 6,485 46 22 19 3 24 5 13 13Female 6,739 6,618 52 20 10 3 17 5 6 8
BaseriBoth Sex 3,660 3,469 52 41 46 5 18 5 2 22Male 1,609 1,501 27 18 28 1 13 3 2 16Female 2,051 1,968 25 23 18 4 5 2 0 6
BenighatBoth Sex 9,717 9,509 73 28 21 3 36 6 17 24Male 4,854 4,734 40 16 16 2 16 2 13 15Female 4,863 4,775 33 12 5 1 20 4 4 9
BhumesthanBoth Sex 10,786 10,594 93 25 13 1 26 14 7 13Male 5,323 5,216 58 9 7 1 17 4 2 9Female 5,463 5,378 35 16 6 0 9 10 5 4
BudhathumBoth Sex 3,732 3,630 35 21 24 0 17 5 0 0Male 1,543 1,491 22 7 11 0 8 4 0 0Female 2,189 2,139 13 14 13 0 9 1 0 0
ChainpurBoth Sex 6,349 6,187 55 28 33 3 12 14 11 6Male 2,747 2,663 31 15 15 2 5 6 8 2Female 3,602 3,524 24 13 18 1 7 8 3 4
ChhatredeuraliBoth Sex 7,687 7,595 28 17 13 4 18 9 3 0Male 3,665 3,619 15 8 3 3 10 5 2 0Female 4,022 3,976 13 9 10 1 8 4 1 0
DarkhaBoth Sex 5,269 5,174 39 15 10 0 18 7 5 1Male 2,431 2,373 23 8 8 0 11 3 5 0Female 2,838 2,801 16 7 2 0 7 4 0 1
DholaBoth Sex 4,033 3,934 27 17 19 3 14 12 4 3Male 1,772 1,723 14 9 8 0 9 4 2 3Female 2,261 2,211 13 8 11 3 5 8 2 0
Population having disability ofTotal
population
Population without
disability
VDC/Muni-cipality and sex
47
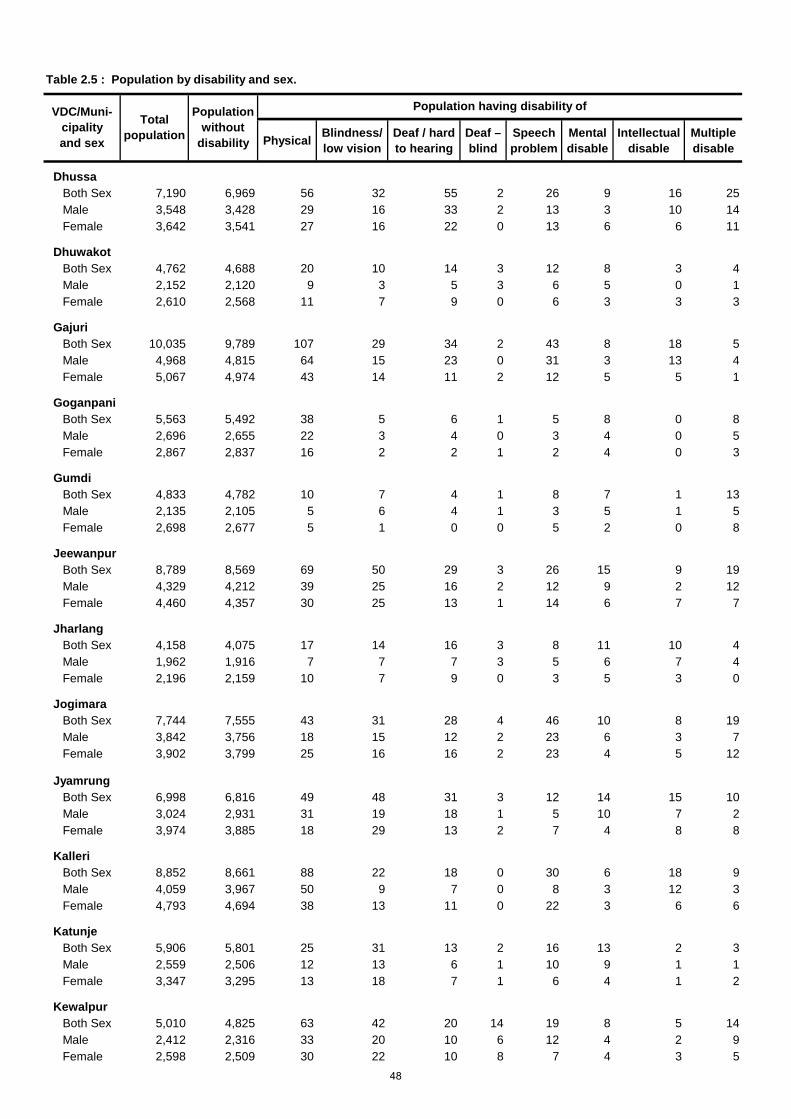
Table 2.5 : Population by disability and sex.
Physical Blindness/ low vision
Deaf / hard to hearing
Deaf – blind
Speech problem
Mental disable
Intellectual disable
Multiple disable
Population having disability ofTotal
population
Population without
disability
VDC/Muni-cipality and sex
DhussaBoth Sex 7,190 6,969 56 32 55 2 26 9 16 25Male 3,548 3,428 29 16 33 2 13 3 10 14Female 3,642 3,541 27 16 22 0 13 6 6 11
DhuwakotBoth Sex 4,762 4,688 20 10 14 3 12 8 3 4Male 2,152 2,120 9 3 5 3 6 5 0 1Female 2,610 2,568 11 7 9 0 6 3 3 3
GajuriBoth Sex 10,035 9,789 107 29 34 2 43 8 18 5Male 4,968 4,815 64 15 23 0 31 3 13 4Female 5,067 4,974 43 14 11 2 12 5 5 1
GoganpaniBoth Sex 5,563 5,492 38 5 6 1 5 8 0 8Male 2,696 2,655 22 3 4 0 3 4 0 5Female 2,867 2,837 16 2 2 1 2 4 0 3
GumdiBoth Sex 4,833 4,782 10 7 4 1 8 7 1 13Male 2,135 2,105 5 6 4 1 3 5 1 5Female 2,698 2,677 5 1 0 0 5 2 0 8
JeewanpurBoth Sex 8,789 8,569 69 50 29 3 26 15 9 19Male 4,329 4,212 39 25 16 2 12 9 2 12Female 4,460 4,357 30 25 13 1 14 6 7 7
JharlangBoth Sex 4,158 4,075 17 14 16 3 8 11 10 4Male 1,962 1,916 7 7 7 3 5 6 7 4Female 2,196 2,159 10 7 9 0 3 5 3 0
JogimaraBoth Sex 7,744 7,555 43 31 28 4 46 10 8 19Male 3,842 3,756 18 15 12 2 23 6 3 7Female 3,902 3,799 25 16 16 2 23 4 5 12
JyamrungBoth Sex 6,998 6,816 49 48 31 3 12 14 15 10Male 3,024 2,931 31 19 18 1 5 10 7 2Female 3,974 3,885 18 29 13 2 7 4 8 8
KalleriBoth Sex 8,852 8,661 88 22 18 0 30 6 18 9Male 4,059 3,967 50 9 7 0 8 3 12 3Female 4,793 4,694 38 13 11 0 22 3 6 6
KatunjeBoth Sex 5,906 5,801 25 31 13 2 16 13 2 3Male 2,559 2,506 12 13 6 1 10 9 1 1Female 3,347 3,295 13 18 7 1 6 4 1 2
KewalpurBoth Sex 5,010 4,825 63 42 20 14 19 8 5 14Male 2,412 2,316 33 20 10 6 12 4 2 9Female 2,598 2,509 30 22 10 8 7 4 3 5
48
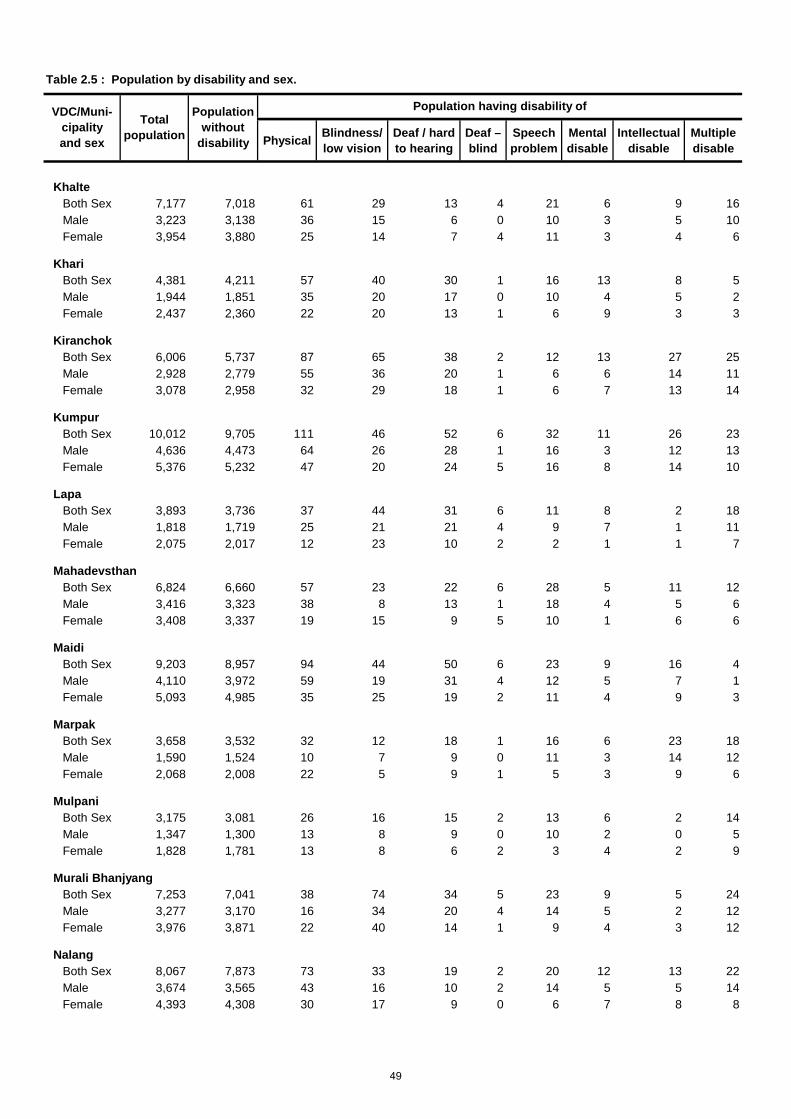
Table 2.5 : Population by disability and sex.
Physical Blindness/ low vision
Deaf / hard to hearing
Deaf – blind
Speech problem
Mental disable
Intellectual disable
Multiple disable
Population having disability ofTotal
population
Population without
disability
VDC/Muni-cipality and sex
KhalteBoth Sex 7,177 7,018 61 29 13 4 21 6 9 16Male 3,223 3,138 36 15 6 0 10 3 5 10Female 3,954 3,880 25 14 7 4 11 3 4 6
KhariBoth Sex 4,381 4,211 57 40 30 1 16 13 8 5Male 1,944 1,851 35 20 17 0 10 4 5 2Female 2,437 2,360 22 20 13 1 6 9 3 3
KiranchokBoth Sex 6,006 5,737 87 65 38 2 12 13 27 25Male 2,928 2,779 55 36 20 1 6 6 14 11Female 3,078 2,958 32 29 18 1 6 7 13 14
KumpurBoth Sex 10,012 9,705 111 46 52 6 32 11 26 23Male 4,636 4,473 64 26 28 1 16 3 12 13Female 5,376 5,232 47 20 24 5 16 8 14 10
LapaBoth Sex 3,893 3,736 37 44 31 6 11 8 2 18Male 1,818 1,719 25 21 21 4 9 7 1 11Female 2,075 2,017 12 23 10 2 2 1 1 7
MahadevsthanBoth Sex 6,824 6,660 57 23 22 6 28 5 11 12Male 3,416 3,323 38 8 13 1 18 4 5 6Female 3,408 3,337 19 15 9 5 10 1 6 6
MaidiBoth Sex 9,203 8,957 94 44 50 6 23 9 16 4Male 4,110 3,972 59 19 31 4 12 5 7 1Female 5,093 4,985 35 25 19 2 11 4 9 3
MarpakBoth Sex 3,658 3,532 32 12 18 1 16 6 23 18Male 1,590 1,524 10 7 9 0 11 3 14 12Female 2,068 2,008 22 5 9 1 5 3 9 6
MulpaniBoth Sex 3,175 3,081 26 16 15 2 13 6 2 14Male 1,347 1,300 13 8 9 0 10 2 0 5Female 1,828 1,781 13 8 6 2 3 4 2 9
Murali BhanjyangBoth Sex 7,253 7,041 38 74 34 5 23 9 5 24Male 3,277 3,170 16 34 20 4 14 5 2 12Female 3,976 3,871 22 40 14 1 9 4 3 12
NalangBoth Sex 8,067 7,873 73 33 19 2 20 12 13 22Male 3,674 3,565 43 16 10 2 14 5 5 14Female 4,393 4,308 30 17 9 0 6 7 8 8
49
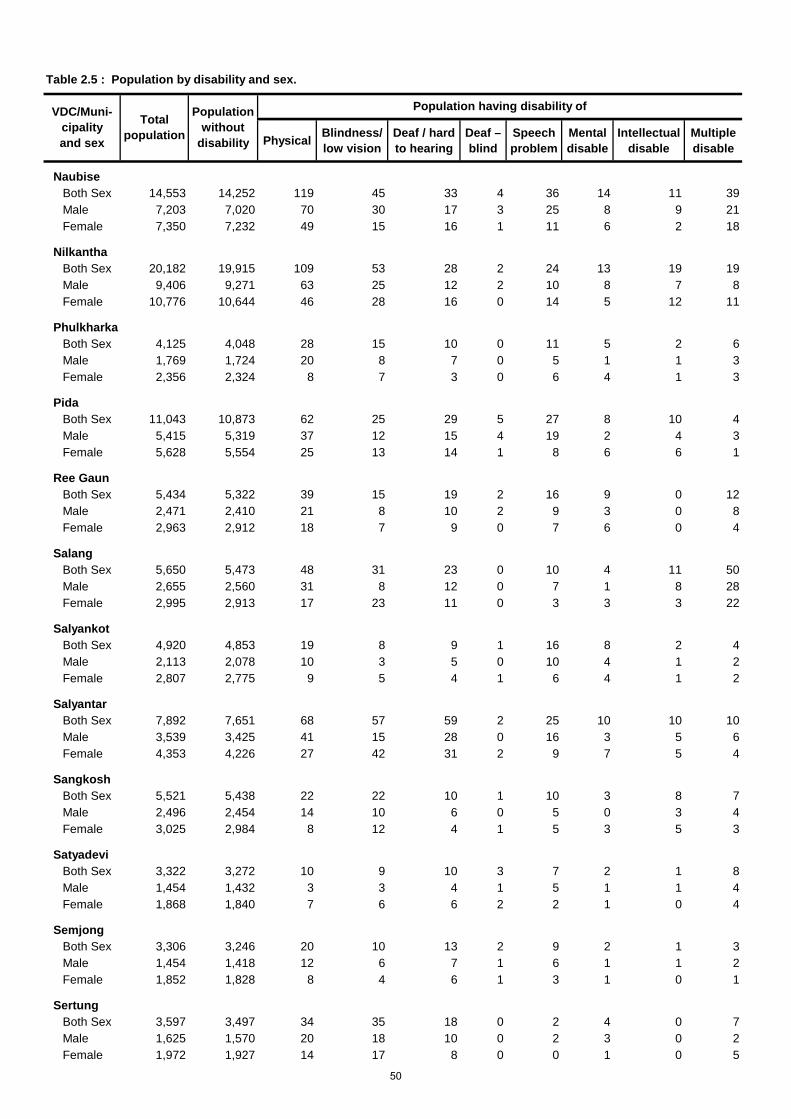
Table 2.5 : Population by disability and sex.
Physical Blindness/ low vision
Deaf / hard to hearing
Deaf – blind
Speech problem
Mental disable
Intellectual disable
Multiple disable
Population having disability ofTotal
population
Population without
disability
VDC/Muni-cipality and sex
NaubiseBoth Sex 14,553 14,252 119 45 33 4 36 14 11 39Male 7,203 7,020 70 30 17 3 25 8 9 21Female 7,350 7,232 49 15 16 1 11 6 2 18
NilkanthaBoth Sex 20,182 19,915 109 53 28 2 24 13 19 19Male 9,406 9,271 63 25 12 2 10 8 7 8Female 10,776 10,644 46 28 16 0 14 5 12 11
PhulkharkaBoth Sex 4,125 4,048 28 15 10 0 11 5 2 6Male 1,769 1,724 20 8 7 0 5 1 1 3Female 2,356 2,324 8 7 3 0 6 4 1 3
PidaBoth Sex 11,043 10,873 62 25 29 5 27 8 10 4Male 5,415 5,319 37 12 15 4 19 2 4 3Female 5,628 5,554 25 13 14 1 8 6 6 1
Ree GaunBoth Sex 5,434 5,322 39 15 19 2 16 9 0 12Male 2,471 2,410 21 8 10 2 9 3 0 8Female 2,963 2,912 18 7 9 0 7 6 0 4
SalangBoth Sex 5,650 5,473 48 31 23 0 10 4 11 50Male 2,655 2,560 31 8 12 0 7 1 8 28Female 2,995 2,913 17 23 11 0 3 3 3 22
SalyankotBoth Sex 4,920 4,853 19 8 9 1 16 8 2 4Male 2,113 2,078 10 3 5 0 10 4 1 2Female 2,807 2,775 9 5 4 1 6 4 1 2
SalyantarBoth Sex 7,892 7,651 68 57 59 2 25 10 10 10Male 3,539 3,425 41 15 28 0 16 3 5 6Female 4,353 4,226 27 42 31 2 9 7 5 4
SangkoshBoth Sex 5,521 5,438 22 22 10 1 10 3 8 7Male 2,496 2,454 14 10 6 0 5 0 3 4Female 3,025 2,984 8 12 4 1 5 3 5 3
SatyadeviBoth Sex 3,322 3,272 10 9 10 3 7 2 1 8Male 1,454 1,432 3 3 4 1 5 1 1 4Female 1,868 1,840 7 6 6 2 2 1 0 4
SemjongBoth Sex 3,306 3,246 20 10 13 2 9 2 1 3Male 1,454 1,418 12 6 7 1 6 1 1 2Female 1,852 1,828 8 4 6 1 3 1 0 1
SertungBoth Sex 3,597 3,497 34 35 18 0 2 4 0 7Male 1,625 1,570 20 18 10 0 2 3 0 2Female 1,972 1,927 14 17 8 0 0 1 0 5
50

Table 2.5 : Population by disability and sex.
Physical Blindness/ low vision
Deaf / hard to hearing
Deaf – blind
Speech problem
Mental disable
Intellectual disable
Multiple disable
Population having disability ofTotal
population
Population without
disability
VDC/Muni-cipality and sex
Sunaula BazarBoth Sex 6,622 6,482 40 22 28 3 18 12 13 4Male 2,932 2,844 27 11 20 2 9 8 9 2Female 3,690 3,638 13 11 8 1 9 4 4 2
TasarpuBoth Sex 5,151 5,033 44 17 23 2 20 7 3 2Male 2,494 2,417 30 12 13 2 11 5 3 1Female 2,657 2,616 14 5 10 0 9 2 0 1
ThakreBoth Sex 9,838 9,596 77 47 20 5 43 22 5 23Male 4,781 4,640 47 27 8 2 26 13 5 13Female 5,057 4,956 30 20 12 3 17 9 0 10
TiplingBoth Sex 2,072 1,990 25 15 20 5 5 2 8 2Male 1,019 977 15 4 10 2 5 0 5 1Female 1,053 1,013 10 11 10 3 0 2 3 1
TripuresworBoth Sex 3,393 3,308 13 4 27 1 7 7 0 26Male 1,512 1,464 10 2 14 1 6 5 0 10Female 1,881 1,844 3 2 13 0 1 2 0 16
InstitutionalBoth Sex 1,775 1,773 1 0 0 0 1 0 0 0Male 1,734 1,732 1 0 0 0 1 0 0 0Female 41 41 0 0 0 0 0 0 0 0
51

DhadingTable 2.6: Population aged 5 years and above by literacy status and sex
Can read & write
Can read only
Can't read & write
TotalBoth Sex 305,985 192,337 7,745 105,681 222 62.86Male 142,433 101,240 3,765 37,348 80 71.08Female 163,552 91,097 3,980 68,333 142 55.70
AginchokBoth Sex 3,257 1,913 185 1,159 0 58.74Male 1,379 944 88 347 0 68.46Female 1,878 969 97 812 0 51.60
BaireniBoth Sex 12,220 8,152 247 3,815 6 66.71Male 6,050 4,459 129 1,459 3 73.70Female 6,170 3,693 118 2,356 3 59.85
BaseriBoth Sex 3,337 2,132 62 1,143 0 63.89Male 1,427 1,098 18 311 0 76.94Female 1,910 1,034 44 832 0 54.14
BenighatBoth Sex 8,812 6,347 139 2,326 0 72.03Male 4,393 3,464 68 861 0 78.85Female 4,419 2,883 71 1,465 0 65.24
BhumesthanBoth Sex 9,759 5,991 404 3,357 7 61.39Male 4,785 3,298 212 1,271 4 68.92Female 4,974 2,693 192 2,086 3 54.14
BudhathumBoth Sex 3,422 2,386 37 999 0 69.73Male 1,385 1,135 13 237 0 81.95Female 2,037 1,251 24 762 0 61.41
ChainpurBoth Sex 5,790 3,796 74 1,910 10 65.56Male 2,456 1,815 40 597 4 73.90Female 3,334 1,981 34 1,313 6 59.42
ChhatredeuraliBoth Sex 7,127 4,655 79 2,393 0 65.31Male 3,371 2,518 42 811 0 74.70Female 3,756 2,137 37 1,582 0 56.90
DarkhaBoth Sex 4,769 3,161 113 1,494 1 66.28Male 2,174 1,589 45 540 0 73.09Female 2,595 1,572 68 954 1 60.58
DholaBoth Sex 3,648 2,308 81 1,258 1 63.27Male 1,590 1,150 39 401 0 72.33Female 2,058 1,158 42 857 1 56.27
Population who arePopulation aged 5 years & above
Literacy not
stated
VDC/ Municipality
and sex
Literacy rate
52
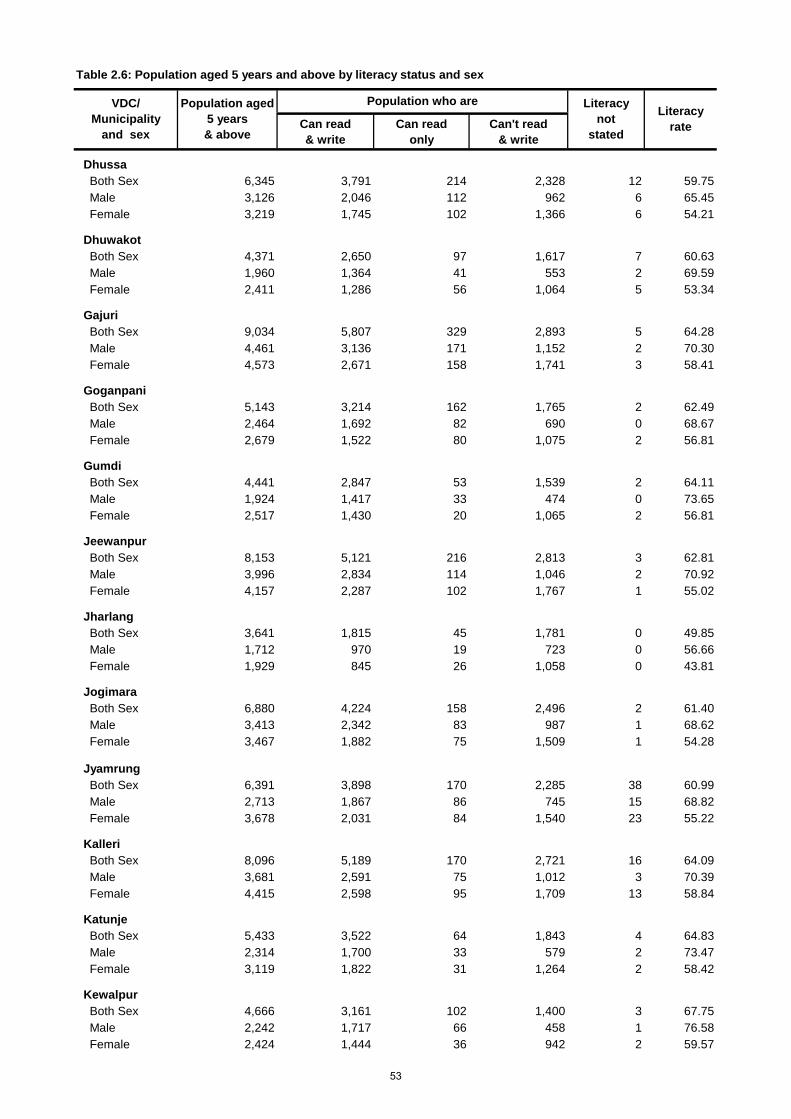
Table 2.6: Population aged 5 years and above by literacy status and sex
Can read & write
Can read only
Can't read & write
Population who arePopulation aged 5 years & above
Literacy not
stated
VDC/ Municipality
and sex
Literacy rate
DhussaBoth Sex 6,345 3,791 214 2,328 12 59.75Male 3,126 2,046 112 962 6 65.45Female 3,219 1,745 102 1,366 6 54.21
DhuwakotBoth Sex 4,371 2,650 97 1,617 7 60.63Male 1,960 1,364 41 553 2 69.59Female 2,411 1,286 56 1,064 5 53.34
GajuriBoth Sex 9,034 5,807 329 2,893 5 64.28Male 4,461 3,136 171 1,152 2 70.30Female 4,573 2,671 158 1,741 3 58.41
GoganpaniBoth Sex 5,143 3,214 162 1,765 2 62.49Male 2,464 1,692 82 690 0 68.67Female 2,679 1,522 80 1,075 2 56.81
GumdiBoth Sex 4,441 2,847 53 1,539 2 64.11Male 1,924 1,417 33 474 0 73.65Female 2,517 1,430 20 1,065 2 56.81
JeewanpurBoth Sex 8,153 5,121 216 2,813 3 62.81Male 3,996 2,834 114 1,046 2 70.92Female 4,157 2,287 102 1,767 1 55.02
JharlangBoth Sex 3,641 1,815 45 1,781 0 49.85Male 1,712 970 19 723 0 56.66Female 1,929 845 26 1,058 0 43.81
JogimaraBoth Sex 6,880 4,224 158 2,496 2 61.40Male 3,413 2,342 83 987 1 68.62Female 3,467 1,882 75 1,509 1 54.28
JyamrungBoth Sex 6,391 3,898 170 2,285 38 60.99Male 2,713 1,867 86 745 15 68.82Female 3,678 2,031 84 1,540 23 55.22
KalleriBoth Sex 8,096 5,189 170 2,721 16 64.09Male 3,681 2,591 75 1,012 3 70.39Female 4,415 2,598 95 1,709 13 58.84
KatunjeBoth Sex 5,433 3,522 64 1,843 4 64.83Male 2,314 1,700 33 579 2 73.47Female 3,119 1,822 31 1,264 2 58.42
KewalpurBoth Sex 4,666 3,161 102 1,400 3 67.75Male 2,242 1,717 66 458 1 76.58Female 2,424 1,444 36 942 2 59.57
53

Table 2.6: Population aged 5 years and above by literacy status and sex
Can read & write
Can read only
Can't read & write
Population who arePopulation aged 5 years & above
Literacy not
stated
VDC/ Municipality
and sex
Literacy rate
KhalteBoth Sex 6,473 3,657 256 2,555 5 56.50Male 2,860 1,844 112 903 1 64.48Female 3,613 1,813 144 1,652 4 50.18
KhariBoth Sex 3,975 2,356 139 1,478 2 59.27Male 1,727 1,178 63 485 1 68.21Female 2,248 1,178 76 993 1 52.40
KiranchokBoth Sex 5,330 2,630 268 2,421 11 49.34Male 2,575 1,433 143 996 3 55.65Female 2,755 1,197 125 1,425 8 43.45
KumpurBoth Sex 9,159 5,947 299 2,913 0 64.93Male 4,177 3,004 119 1,054 0 71.92Female 4,982 2,943 180 1,859 0 59.07
LapaBoth Sex 3,453 1,634 164 1,650 5 47.32Male 1,587 911 80 595 1 57.40Female 1,866 723 84 1,055 4 38.75
MahadevsthanBoth Sex 5,954 3,249 337 2,363 5 54.57Male 2,980 1,861 172 945 2 62.45Female 2,974 1,388 165 1,418 3 46.67
MaidiBoth Sex 8,445 4,762 193 3,482 8 56.39Male 3,724 2,381 86 1,253 4 63.94Female 4,721 2,381 107 2,229 4 50.43
MarpakBoth Sex 3,369 2,102 80 1,184 3 62.39Male 1,441 990 37 414 0 68.70Female 1,928 1,112 43 770 3 57.68
MulpaniBoth Sex 2,939 1,861 52 1,026 0 63.32Male 1,238 947 26 265 0 76.49Female 1,701 914 26 761 0 53.73
Murali BhanjyangBoth Sex 6,622 4,204 94 2,320 4 63.49Male 2,935 2,120 48 765 2 72.23Female 3,687 2,084 46 1,555 2 56.52
NalangBoth Sex 7,293 4,550 153 2,584 6 62.39Male 3,288 2,324 70 890 4 70.68Female 4,005 2,226 83 1,694 2 55.58
54

Table 2.6: Population aged 5 years and above by literacy status and sex
Can read & write
Can read only
Can't read & write
Population who arePopulation aged 5 years & above
Literacy not
stated
VDC/ Municipality
and sex
Literacy rate
NaubiseBoth Sex 13,433 8,720 373 4,336 4 64.91Male 6,626 4,929 204 1,493 0 74.39Female 6,807 3,791 169 2,843 4 55.69
NilkanthaBoth Sex 18,379 13,512 302 4,556 9 73.52Male 8,424 6,900 143 1,379 2 81.91Female 9,955 6,612 159 3,177 7 66.42
PhulkharkaBoth Sex 3,768 2,183 68 1,516 1 57.94Male 1,598 1,112 27 458 1 69.59Female 2,170 1,071 41 1,058 0 49.35
PidaBoth Sex 9,916 5,508 239 4,165 4 55.55Male 4,844 2,972 122 1,748 2 61.35Female 5,072 2,536 117 2,417 2 50.00
Ree GaunBoth Sex 4,945 2,336 89 2,520 0 47.24Male 2,231 1,195 37 999 0 53.56Female 2,714 1,141 52 1,521 0 42.04
SalangBoth Sex 5,206 3,452 212 1,539 3 66.31Male 2,422 1,780 86 554 2 73.49Female 2,784 1,672 126 985 1 60.06
SalyankotBoth Sex 4,511 2,745 161 1,603 2 60.85Male 1,896 1,338 73 485 0 70.57Female 2,615 1,407 88 1,118 2 53.80
SalyantarBoth Sex 7,235 4,799 100 2,331 5 66.33Male 3,194 2,412 46 734 2 75.52Female 4,041 2,387 54 1,597 3 59.07
SangkoshBoth Sex 5,103 3,450 170 1,482 1 67.61Male 2,306 1,804 71 431 0 78.23Female 2,797 1,646 99 1,051 1 58.85
SatyadeviBoth Sex 2,988 1,839 58 1,077 14 61.55Male 1,302 947 23 328 4 72.73Female 1,686 892 35 749 10 52.91
SemjongBoth Sex 3,057 1,777 50 1,229 1 58.13Male 1,340 877 20 443 0 65.45Female 1,717 900 30 786 1 52.42
SertungBoth Sex 3,198 1,361 110 1,727 0 42.56Male 1,424 721 62 641 0 50.63Female 1,774 640 48 1,086 0 36.08
55

Table 2.6: Population aged 5 years and above by literacy status and sex
Can read & write
Can read only
Can't read & write
Population who arePopulation aged 5 years & above
Literacy not
stated
VDC/ Municipality
and sex
Literacy rate
Sunaula BazarBoth Sex 6,050 3,705 108 2,237 0 61.24Male 2,666 1,853 52 761 0 69.50Female 3,384 1,852 56 1,476 0 54.73
TasarpuBoth Sex 4,712 2,920 133 1,656 3 61.97Male 2,256 1,583 68 604 1 70.17Female 2,456 1,337 65 1,052 2 54.44
ThakreBoth Sex 9,033 6,262 210 2,554 7 69.32Male 4,369 3,426 96 844 3 78.42Female 4,664 2,836 114 1,710 4 60.81
TiplingBoth Sex 1,807 836 83 888 0 46.26Male 887 477 50 360 0 53.78Female 920 359 33 528 0 39.02
TripuresworBoth Sex 3,124 2,172 42 910 0 69.53Male 1,368 1,078 19 271 0 78.80Female 1,756 1,094 23 639 0 62.30
InstitutionalBoth Sex 1,773 1,728 1 44 0 97.46Male 1,732 1,697 1 34 0 97.98Female 41 31 0 10 0 75.61
56
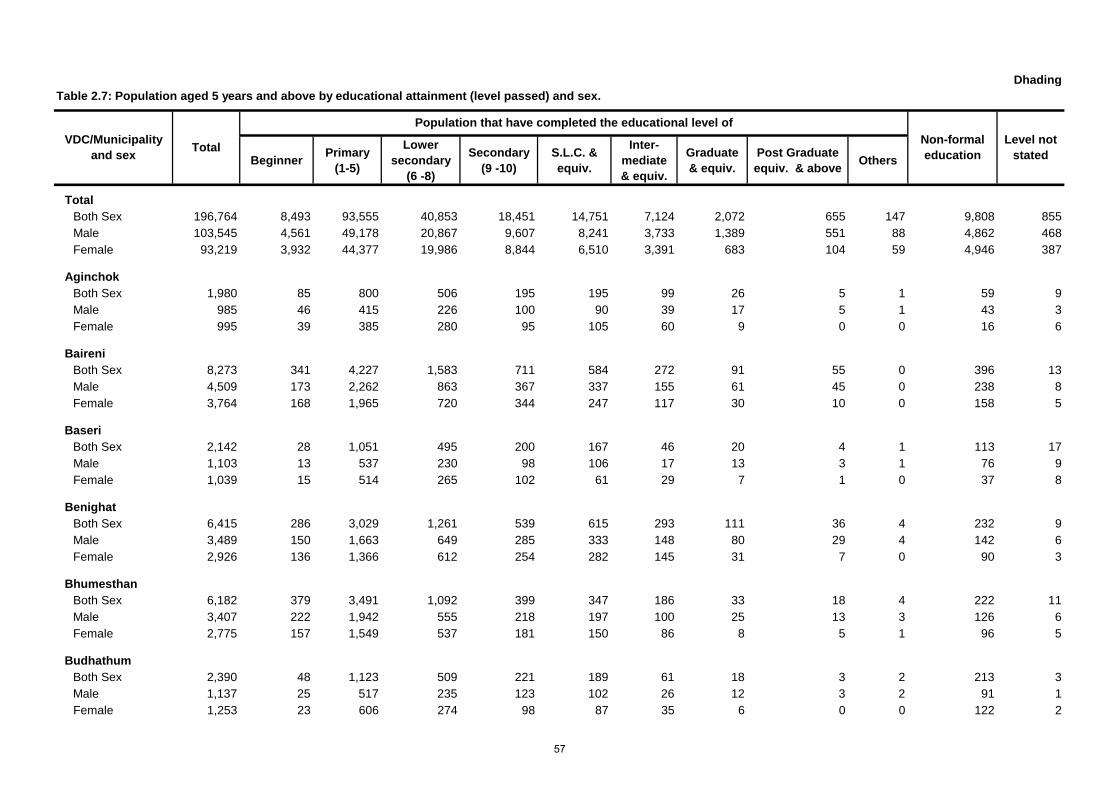
DhadingTable 2.7: Population aged 5 years and above by educational attainment (level passed) and sex.
Beginner Primary (1-5)
Lower secondary
(6 -8)
Secondary (9 -10)
S.L.C. & equiv.
Inter- mediate & equiv.
Graduate & equiv.
Post Graduate equiv. & above Others
TotalBoth Sex 196,764 8,493 93,555 40,853 18,451 14,751 7,124 2,072 655 147 9,808 855Male 103,545 4,561 49,178 20,867 9,607 8,241 3,733 1,389 551 88 4,862 468Female 93,219 3,932 44,377 19,986 8,844 6,510 3,391 683 104 59 4,946 387
AginchokBoth Sex 1,980 85 800 506 195 195 99 26 5 1 59 9Male 985 46 415 226 100 90 39 17 5 1 43 3Female 995 39 385 280 95 105 60 9 0 0 16 6
BaireniBoth Sex 8,273 341 4,227 1,583 711 584 272 91 55 0 396 13Male 4,509 173 2,262 863 367 337 155 61 45 0 238 8Female 3,764 168 1,965 720 344 247 117 30 10 0 158 5
BaseriBoth Sex 2,142 28 1,051 495 200 167 46 20 4 1 113 17Male 1,103 13 537 230 98 106 17 13 3 1 76 9Female 1,039 15 514 265 102 61 29 7 1 0 37 8
BenighatBoth Sex 6,415 286 3,029 1,261 539 615 293 111 36 4 232 9Male 3,489 150 1,663 649 285 333 148 80 29 4 142 6Female 2,926 136 1,366 612 254 282 145 31 7 0 90 3
BhumesthanBoth Sex 6,182 379 3,491 1,092 399 347 186 33 18 4 222 11Male 3,407 222 1,942 555 218 197 100 25 13 3 126 6Female 2,775 157 1,549 537 181 150 86 8 5 1 96 5
BudhathumBoth Sex 2,390 48 1,123 509 221 189 61 18 3 2 213 3Male 1,137 25 517 235 123 102 26 12 3 2 91 1Female 1,253 23 606 274 98 87 35 6 0 0 122 2
VDC/Municipality and sex Total
Population that have completed the educational level ofNon-formal education
Level not stated
57
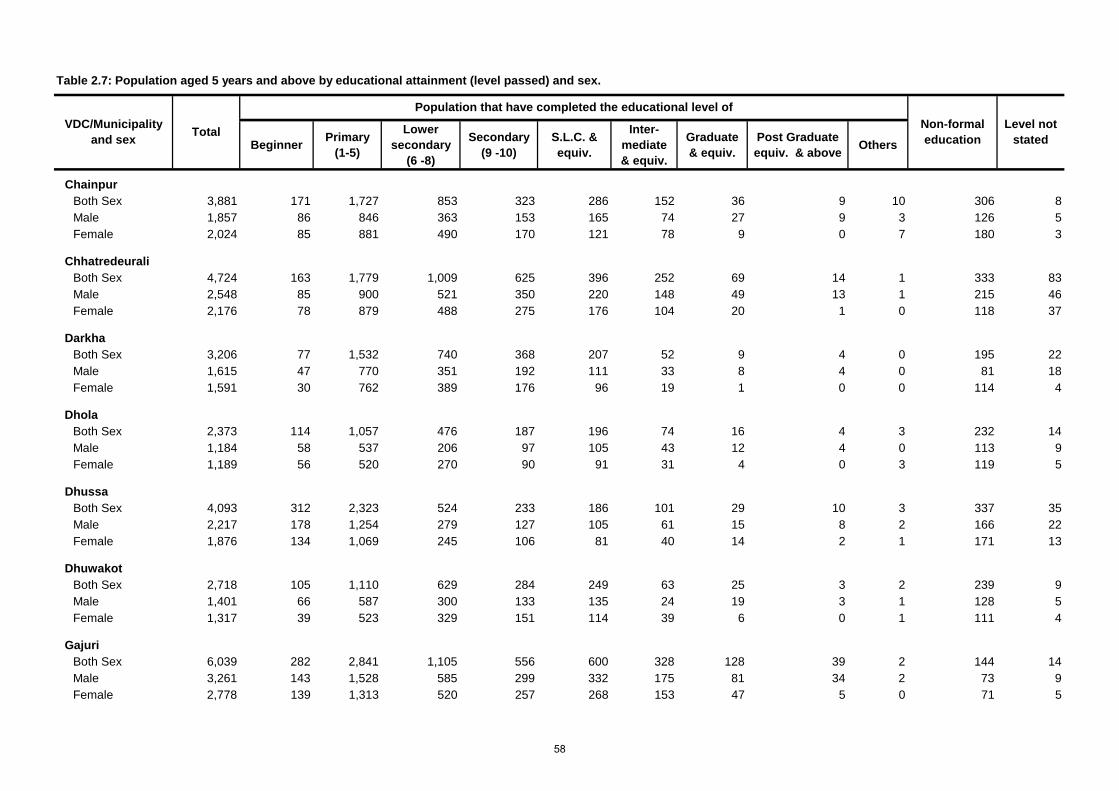
Table 2.7: Population aged 5 years and above by educational attainment (level passed) and sex.
Beginner Primary (1-5)
Lower secondary
(6 -8)
Secondary (9 -10)
S.L.C. & equiv.
Inter- mediate & equiv.
Graduate & equiv.
Post Graduate equiv. & above Others
VDC/Municipality and sex Total
Population that have completed the educational level ofNon-formal education
Level not stated
ChainpurBoth Sex 3,881 171 1,727 853 323 286 152 36 9 10 306 8Male 1,857 86 846 363 153 165 74 27 9 3 126 5Female 2,024 85 881 490 170 121 78 9 0 7 180 3
ChhatredeuraliBoth Sex 4,724 163 1,779 1,009 625 396 252 69 14 1 333 83Male 2,548 85 900 521 350 220 148 49 13 1 215 46Female 2,176 78 879 488 275 176 104 20 1 0 118 37
DarkhaBoth Sex 3,206 77 1,532 740 368 207 52 9 4 0 195 22Male 1,615 47 770 351 192 111 33 8 4 0 81 18Female 1,591 30 762 389 176 96 19 1 0 0 114 4
DholaBoth Sex 2,373 114 1,057 476 187 196 74 16 4 3 232 14Male 1,184 58 537 206 97 105 43 12 4 0 113 9Female 1,189 56 520 270 90 91 31 4 0 3 119 5
DhussaBoth Sex 4,093 312 2,323 524 233 186 101 29 10 3 337 35Male 2,217 178 1,254 279 127 105 61 15 8 2 166 22Female 1,876 134 1,069 245 106 81 40 14 2 1 171 13
DhuwakotBoth Sex 2,718 105 1,110 629 284 249 63 25 3 2 239 9Male 1,401 66 587 300 133 135 24 19 3 1 128 5Female 1,317 39 523 329 151 114 39 6 0 1 111 4
GajuriBoth Sex 6,039 282 2,841 1,105 556 600 328 128 39 2 144 14Male 3,261 143 1,528 585 299 332 175 81 34 2 73 9Female 2,778 139 1,313 520 257 268 153 47 5 0 71 5
58
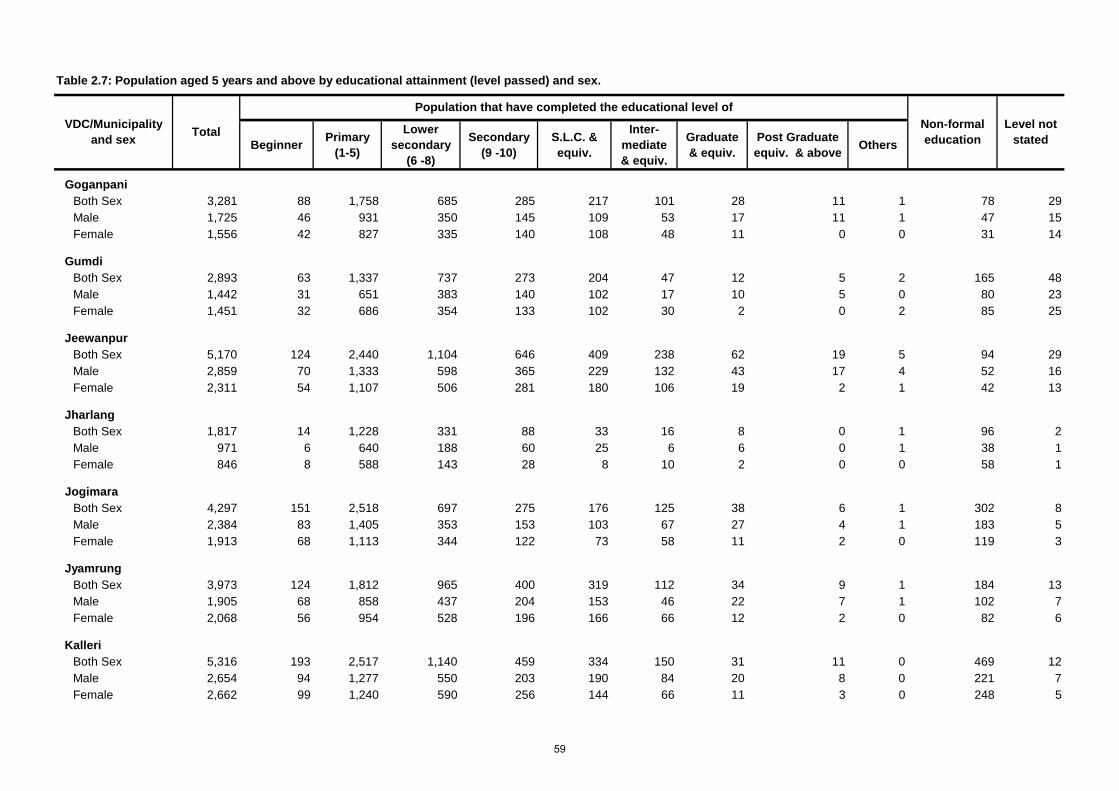
Table 2.7: Population aged 5 years and above by educational attainment (level passed) and sex.
Beginner Primary (1-5)
Lower secondary
(6 -8)
Secondary (9 -10)
S.L.C. & equiv.
Inter- mediate & equiv.
Graduate & equiv.
Post Graduate equiv. & above Others
VDC/Municipality and sex Total
Population that have completed the educational level ofNon-formal education
Level not stated
GoganpaniBoth Sex 3,281 88 1,758 685 285 217 101 28 11 1 78 29Male 1,725 46 931 350 145 109 53 17 11 1 47 15Female 1,556 42 827 335 140 108 48 11 0 0 31 14
GumdiBoth Sex 2,893 63 1,337 737 273 204 47 12 5 2 165 48Male 1,442 31 651 383 140 102 17 10 5 0 80 23Female 1,451 32 686 354 133 102 30 2 0 2 85 25
JeewanpurBoth Sex 5,170 124 2,440 1,104 646 409 238 62 19 5 94 29Male 2,859 70 1,333 598 365 229 132 43 17 4 52 16Female 2,311 54 1,107 506 281 180 106 19 2 1 42 13
JharlangBoth Sex 1,817 14 1,228 331 88 33 16 8 0 1 96 2Male 971 6 640 188 60 25 6 6 0 1 38 1Female 846 8 588 143 28 8 10 2 0 0 58 1
JogimaraBoth Sex 4,297 151 2,518 697 275 176 125 38 6 1 302 8Male 2,384 83 1,405 353 153 103 67 27 4 1 183 5Female 1,913 68 1,113 344 122 73 58 11 2 0 119 3
JyamrungBoth Sex 3,973 124 1,812 965 400 319 112 34 9 1 184 13Male 1,905 68 858 437 204 153 46 22 7 1 102 7Female 2,068 56 954 528 196 166 66 12 2 0 82 6
KalleriBoth Sex 5,316 193 2,517 1,140 459 334 150 31 11 0 469 12Male 2,654 94 1,277 550 203 190 84 20 8 0 221 7Female 2,662 99 1,240 590 256 144 66 11 3 0 248 5
59

Table 2.7: Population aged 5 years and above by educational attainment (level passed) and sex.
Beginner Primary (1-5)
Lower secondary
(6 -8)
Secondary (9 -10)
S.L.C. & equiv.
Inter- mediate & equiv.
Graduate & equiv.
Post Graduate equiv. & above Others
VDC/Municipality and sex Total
Population that have completed the educational level ofNon-formal education
Level not stated
KatunjeBoth Sex 3,537 79 1,466 814 424 214 96 22 5 4 405 8Male 1,709 36 755 381 188 109 46 10 4 2 172 6Female 1,828 43 711 433 236 105 50 12 1 2 233 2
KewalpurBoth Sex 3,218 65 1,449 791 398 222 109 31 16 4 127 6Male 1,751 38 760 460 199 137 67 22 14 4 48 2Female 1,467 27 689 331 199 85 42 9 2 0 79 4
KhalteBoth Sex 3,768 237 1,917 814 312 174 73 25 1 4 208 3Male 1,902 127 984 384 154 99 45 18 1 2 86 2Female 1,866 110 933 430 158 75 28 7 0 2 122 1
KhariBoth Sex 2,456 139 1,188 562 216 171 84 15 3 1 69 8Male 1,232 67 638 267 104 83 28 8 3 1 30 3Female 1,224 72 550 295 112 88 56 7 0 0 39 5
KiranchokBoth Sex 2,902 249 1,714 485 180 129 51 9 5 2 67 11Male 1,568 131 927 259 95 80 21 6 5 1 37 6Female 1,334 118 787 226 85 49 30 3 0 1 30 5
KumpurBoth Sex 6,086 265 2,965 1,266 456 459 171 31 8 1 456 8Male 3,070 137 1,526 633 239 247 87 14 6 1 177 3Female 3,016 128 1,439 633 217 212 84 17 2 0 279 5
LapaBoth Sex 1,728 101 1,162 206 55 49 24 9 2 0 113 7Male 952 52 631 126 37 35 15 8 0 0 45 3Female 776 49 531 80 18 14 9 1 2 0 68 4
60
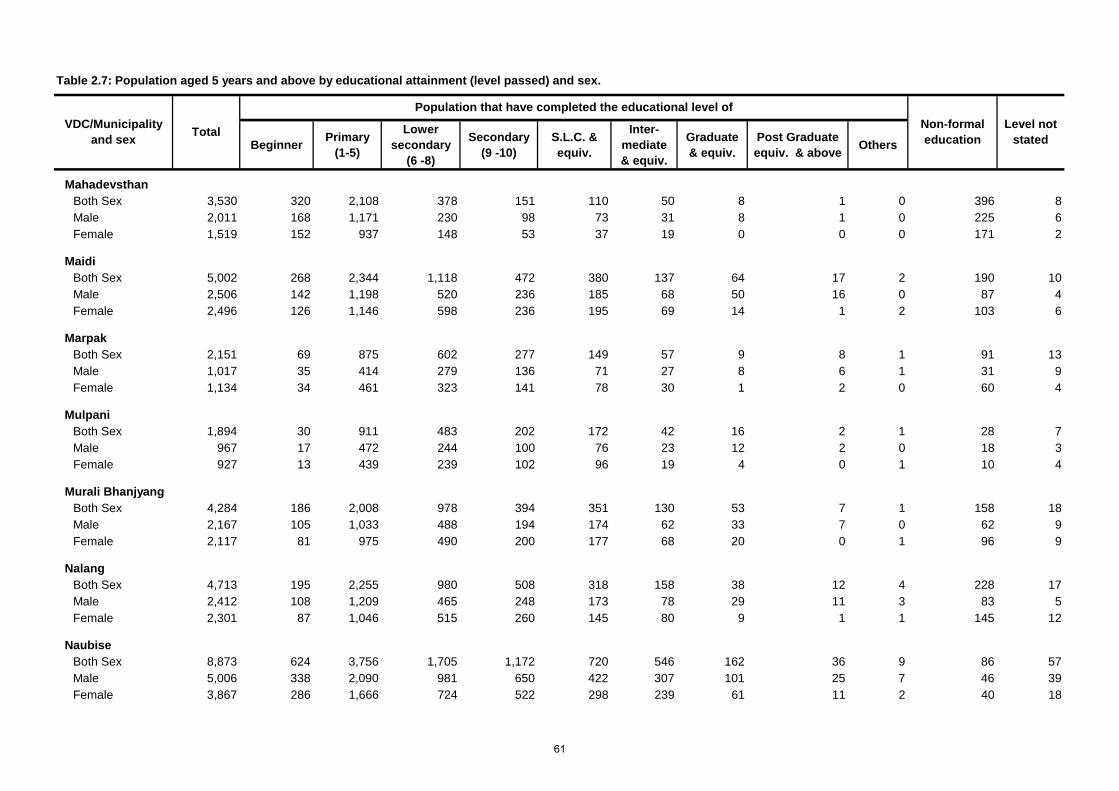
Table 2.7: Population aged 5 years and above by educational attainment (level passed) and sex.
Beginner Primary (1-5)
Lower secondary
(6 -8)
Secondary (9 -10)
S.L.C. & equiv.
Inter- mediate & equiv.
Graduate & equiv.
Post Graduate equiv. & above Others
VDC/Municipality and sex Total
Population that have completed the educational level ofNon-formal education
Level not stated
MahadevsthanBoth Sex 3,530 320 2,108 378 151 110 50 8 1 0 396 8Male 2,011 168 1,171 230 98 73 31 8 1 0 225 6Female 1,519 152 937 148 53 37 19 0 0 0 171 2
MaidiBoth Sex 5,002 268 2,344 1,118 472 380 137 64 17 2 190 10Male 2,506 142 1,198 520 236 185 68 50 16 0 87 4Female 2,496 126 1,146 598 236 195 69 14 1 2 103 6
MarpakBoth Sex 2,151 69 875 602 277 149 57 9 8 1 91 13Male 1,017 35 414 279 136 71 27 8 6 1 31 9Female 1,134 34 461 323 141 78 30 1 2 0 60 4
MulpaniBoth Sex 1,894 30 911 483 202 172 42 16 2 1 28 7Male 967 17 472 244 100 76 23 12 2 0 18 3Female 927 13 439 239 102 96 19 4 0 1 10 4
Murali BhanjyangBoth Sex 4,284 186 2,008 978 394 351 130 53 7 1 158 18Male 2,167 105 1,033 488 194 174 62 33 7 0 62 9Female 2,117 81 975 490 200 177 68 20 0 1 96 9
NalangBoth Sex 4,713 195 2,255 980 508 318 158 38 12 4 228 17Male 2,412 108 1,209 465 248 173 78 29 11 3 83 5Female 2,301 87 1,046 515 260 145 80 9 1 1 145 12
NaubiseBoth Sex 8,873 624 3,756 1,705 1,172 720 546 162 36 9 86 57Male 5,006 338 2,090 981 650 422 307 101 25 7 46 39Female 3,867 286 1,666 724 522 298 239 61 11 2 40 18
61

Table 2.7: Population aged 5 years and above by educational attainment (level passed) and sex.
Beginner Primary (1-5)
Lower secondary
(6 -8)
Secondary (9 -10)
S.L.C. & equiv.
Inter- mediate & equiv.
Graduate & equiv.
Post Graduate equiv. & above Others
VDC/Municipality and sex Total
Population that have completed the educational level ofNon-formal education
Level not stated
NilkanthaBoth Sex 13,664 680 5,254 2,742 1,482 1,497 1,100 380 163 9 329 28Male 6,983 394 2,668 1,356 728 780 530 239 131 3 139 15Female 6,681 286 2,586 1,386 754 717 570 141 32 6 190 13
PhulkharkaBoth Sex 2,203 88 1,003 553 245 163 63 19 8 5 49 7Male 1,119 44 496 272 130 97 23 11 7 4 28 7Female 1,084 44 507 281 115 66 40 8 1 1 21 0
PidaBoth Sex 5,611 292 3,010 1,028 464 356 169 30 11 10 239 2Male 3,021 163 1,611 548 244 198 96 22 10 7 121 1Female 2,590 129 1,399 480 220 158 73 8 1 3 118 1
Ree GaunBoth Sex 2,406 125 1,290 420 137 95 24 12 1 4 293 5Male 1,231 63 647 211 75 71 21 9 1 1 129 3Female 1,175 62 643 209 62 24 3 3 0 3 164 2
SalangBoth Sex 3,491 30 1,589 754 430 243 108 25 5 8 238 61Male 1,799 12 845 379 206 142 74 21 4 4 85 27Female 1,692 18 744 375 224 101 34 4 1 4 153 34
SalyankotBoth Sex 2,762 159 1,271 598 284 223 109 23 4 1 41 49Male 1,347 88 597 276 141 115 51 17 4 1 28 29Female 1,415 71 674 322 143 108 58 6 0 0 13 20
SalyantarBoth Sex 4,872 256 2,178 1,154 409 356 181 52 16 7 236 27Male 2,448 130 1,106 573 206 191 86 25 12 5 107 7Female 2,424 126 1,072 581 203 165 95 27 4 2 129 20
62
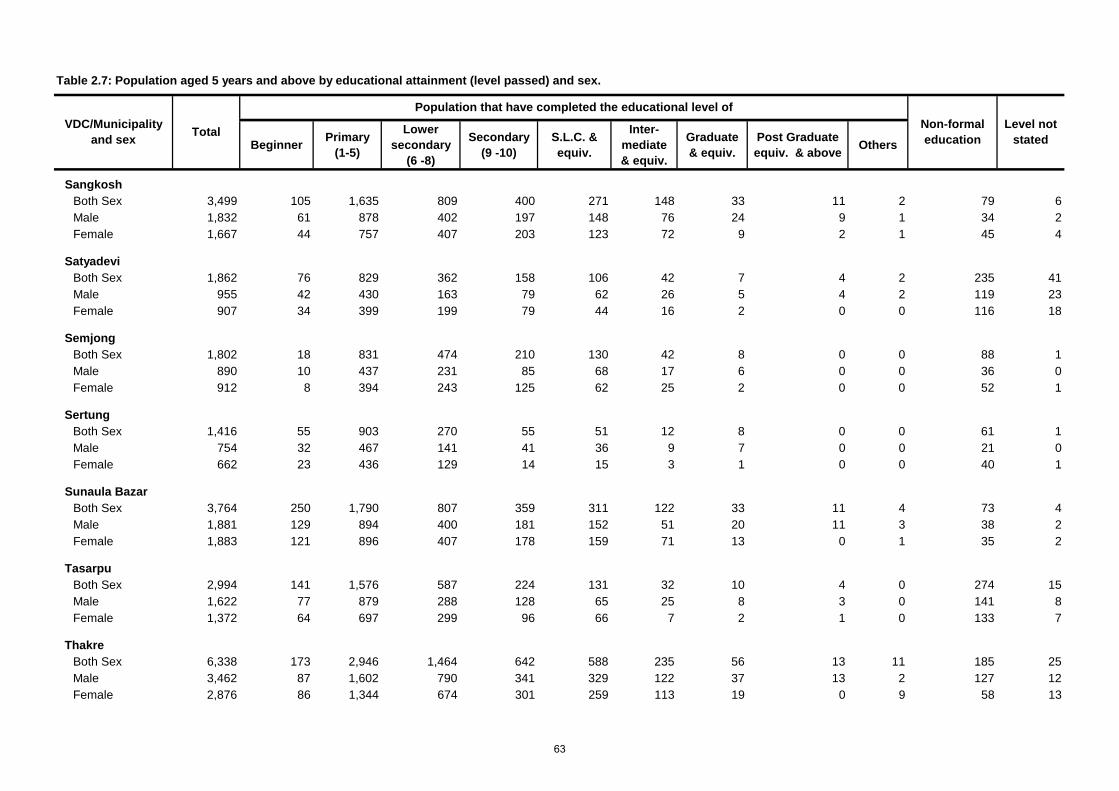
Table 2.7: Population aged 5 years and above by educational attainment (level passed) and sex.
Beginner Primary (1-5)
Lower secondary
(6 -8)
Secondary (9 -10)
S.L.C. & equiv.
Inter- mediate & equiv.
Graduate & equiv.
Post Graduate equiv. & above Others
VDC/Municipality and sex Total
Population that have completed the educational level ofNon-formal education
Level not stated
SangkoshBoth Sex 3,499 105 1,635 809 400 271 148 33 11 2 79 6Male 1,832 61 878 402 197 148 76 24 9 1 34 2Female 1,667 44 757 407 203 123 72 9 2 1 45 4
SatyadeviBoth Sex 1,862 76 829 362 158 106 42 7 4 2 235 41Male 955 42 430 163 79 62 26 5 4 2 119 23Female 907 34 399 199 79 44 16 2 0 0 116 18
SemjongBoth Sex 1,802 18 831 474 210 130 42 8 0 0 88 1Male 890 10 437 231 85 68 17 6 0 0 36 0Female 912 8 394 243 125 62 25 2 0 0 52 1
SertungBoth Sex 1,416 55 903 270 55 51 12 8 0 0 61 1Male 754 32 467 141 41 36 9 7 0 0 21 0Female 662 23 436 129 14 15 3 1 0 0 40 1
Sunaula BazarBoth Sex 3,764 250 1,790 807 359 311 122 33 11 4 73 4Male 1,881 129 894 400 181 152 51 20 11 3 38 2Female 1,883 121 896 407 178 159 71 13 0 1 35 2
TasarpuBoth Sex 2,994 141 1,576 587 224 131 32 10 4 0 274 15Male 1,622 77 879 288 128 65 25 8 3 0 141 8Female 1,372 64 697 299 96 66 7 2 1 0 133 7
ThakreBoth Sex 6,338 173 2,946 1,464 642 588 235 56 13 11 185 25Male 3,462 87 1,602 790 341 329 122 37 13 2 127 12Female 2,876 86 1,344 674 301 259 113 19 0 9 58 13
63

Table 2.7: Population aged 5 years and above by educational attainment (level passed) and sex.
Beginner Primary (1-5)
Lower secondary
(6 -8)
Secondary (9 -10)
S.L.C. & equiv.
Inter- mediate & equiv.
Graduate & equiv.
Post Graduate equiv. & above Others
VDC/Municipality and sex Total
Population that have completed the educational level ofNon-formal education
Level not stated
TiplingBoth Sex 862 42 500 100 39 38 25 3 0 2 99 14Male 494 21 253 58 26 31 20 3 0 1 70 11Female 368 21 247 42 13 7 5 0 0 1 29 3
TripuresworBoth Sex 2,185 28 912 528 212 216 109 28 9 3 140 0Male 1,087 17 495 262 96 108 48 15 9 3 34 0Female 1,098 11 417 266 116 108 61 13 0 0 106 0
InstitutionalBoth Sex 1,728 0 220 580 217 449 107 29 7 1 118 0Male 1,697 0 212 578 213 435 105 29 7 1 117 0Female 31 0 8 2 4 14 2 0 0 0 1 0
64

DhadingTable 2.8: Population aged 5 - 25 years by school attendence and sex .
Male Female Male Female Male Female Male Female
Total 66,296 76,064 49,438 51,973 15,681 22,527 1,177 1,564Aginchok 621 729 526 506 93 219 2 4
Baireni 2,896 3,080 1,863 1,942 1,022 1,122 11 16
Baseri 657 857 552 609 81 213 24 35
Benighat 2,074 2,080 1,405 1,415 655 651 14 14
Bhumesthan 2,398 2,486 1,614 1,625 744 827 40 34
Budhathum 616 888 537 685 73 189 6 14
Chainpur 1,091 1,414 900 1,018 187 388 4 8
Chhatredeurali 1,366 1,659 961 1,070 379 542 26 47
Darkha 1,101 1,266 931 972 155 276 15 18
Dhola 707 906 599 642 102 258 6 6
Dhussa 1,573 1,695 1,027 1,031 510 627 36 37
Dhuwakot 885 1,009 767 738 110 260 8 11
Gajuri 2,087 2,199 1,480 1,507 532 624 75 68
Goganpani 1,181 1,316 834 935 302 334 45 47
Gumdi 885 1,111 689 761 178 319 18 31
Jeewanpur 1,680 1,822 1,133 1,208 510 563 37 51
Jharlang 882 1,008 671 663 210 344 1 1
Jogimara 1,788 1,855 1,097 1,108 666 722 25 25
Jyamrung 1,261 1,643 1,061 1,206 179 412 21 25
Kalleri 1,705 2,164 1,355 1,601 336 548 14 15
Katunje 1,097 1,325 935 973 146 319 16 33
Kewalpur 1,000 1,106 727 801 265 296 8 9
Khalte 1,411 1,794 1,147 1,244 255 532 9 18
Khari 813 970 692 713 112 247 9 10
Kiranchok 1,349 1,469 904 910 395 481 50 78
VDC/Municipality Currently going to school Not currently going to school Attendence not stated
Population who arePopulation aged 5-25 years
65
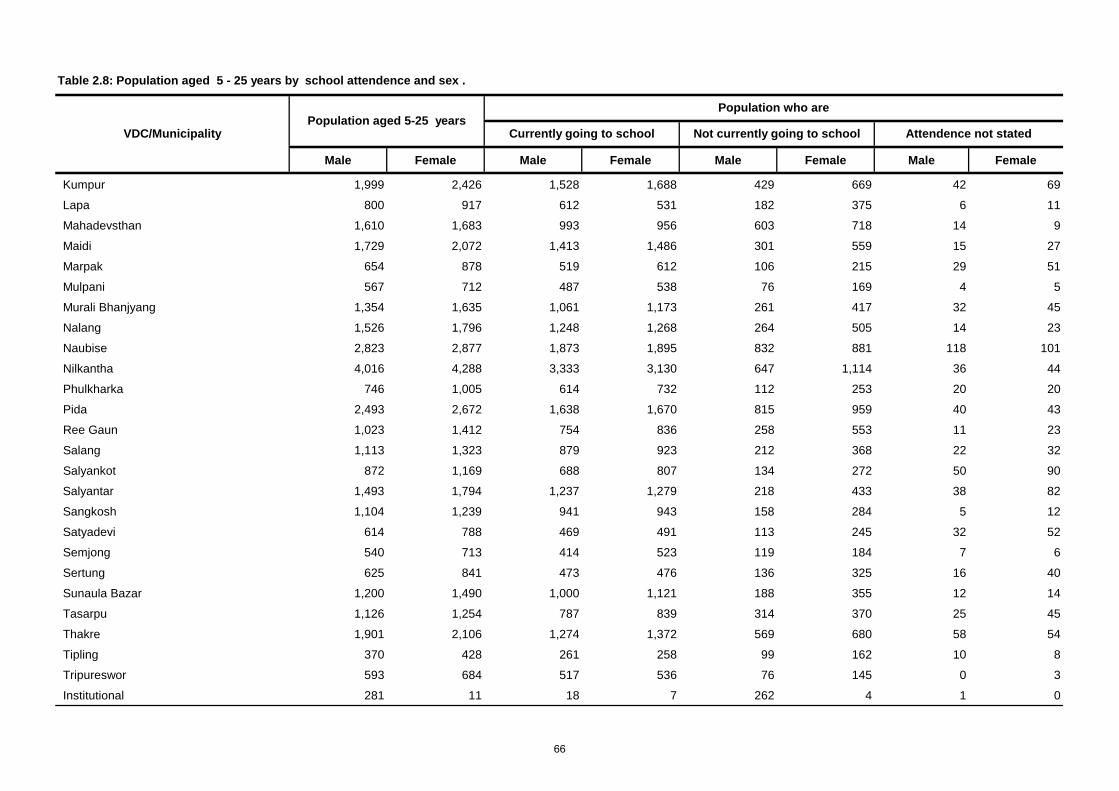
Table 2.8: Population aged 5 - 25 years by school attendence and sex .
Male Female Male Female Male Female Male Female
VDC/Municipality Currently going to school Not currently going to school Attendence not stated
Population who arePopulation aged 5-25 years
Kumpur 1,999 2,426 1,528 1,688 429 669 42 69
Lapa 800 917 612 531 182 375 6 11
Mahadevsthan 1,610 1,683 993 956 603 718 14 9
Maidi 1,729 2,072 1,413 1,486 301 559 15 27
Marpak 654 878 519 612 106 215 29 51
Mulpani 567 712 487 538 76 169 4 5
Murali Bhanjyang 1,354 1,635 1,061 1,173 261 417 32 45
Nalang 1,526 1,796 1,248 1,268 264 505 14 23
Naubise 2,823 2,877 1,873 1,895 832 881 118 101
Nilkantha 4,016 4,288 3,333 3,130 647 1,114 36 44
Phulkharka 746 1,005 614 732 112 253 20 20
Pida 2,493 2,672 1,638 1,670 815 959 40 43
Ree Gaun 1,023 1,412 754 836 258 553 11 23
Salang 1,113 1,323 879 923 212 368 22 32
Salyankot 872 1,169 688 807 134 272 50 90
Salyantar 1,493 1,794 1,237 1,279 218 433 38 82
Sangkosh 1,104 1,239 941 943 158 284 5 12
Satyadevi 614 788 469 491 113 245 32 52
Semjong 540 713 414 523 119 184 7 6
Sertung 625 841 473 476 136 325 16 40
Sunaula Bazar 1,200 1,490 1,000 1,121 188 355 12 14
Tasarpu 1,126 1,254 787 839 314 370 25 45
Thakre 1,901 2,106 1,274 1,372 569 680 58 54
Tipling 370 428 261 258 99 162 10 8
Tripureswor 593 684 517 536 76 145 0 3
Institutional 281 11 18 7 262 4 1 0
66