dfs analysis tool dynamic frequency selection in the 5 ghz ... · dfs analysis tool dynamic...
TRANSCRIPT

Subject to change – Dr. F. Ramian 11.2006 – 1EF59_1E
Product: R&S® FSL, R&S® FSP, R&S® FSU, R&S® FSQ
DFS Analysis Tool Dynamic Frequency Selection
in the 5 GHz Band
This application note describes DFS measurements, e.g. for 5 GHz-WLAN devices,
with an R&S spectrum analyzer.
An external program, the DFS Analysis Tool, is used to improve measurement speed.

Dynamic Frequency Selection Analysis
1EF59_1E 2 Rohde & Schwarz
Content Content ......................................................................................................... 2 1 Overview ................................................................................................. 2 2 DFS Conformance Test Procedures....................................................... 2 3 Software Features................................................................................... 4 4 Hardware and Software Requirements ................................................... 7
Hardware requirements ..................................................................... 7 Software requirements....................................................................... 7
5 Measurement Setup................................................................................ 7 Setup.................................................................................................. 7
6 Installing the Software ............................................................................. 8 7 Starting the Software............................................................................... 8 8 Literature ............................................................................................... 11 9 Additional Information ........................................................................... 11 10 Ordering Information ............................................................................. 11
1 Overview In the United States the frequency bands from 5.25 to 5.35 GHz and from 5.47 to 5.725 GHz are reserved for the Department of Defense for radar applications. The demand for additional bandwidth grows constantly. To increase the available bandwidth for the unlicensed national information infrastructure (U-NII), the FCC ruled that these bands may also be used for other wireless applications, if they comply to standard FCC-06-96A1. The usage of these frequency bands is of special interest for WLAN, as those bands are already used in many other countries.
The mechanism required to comply to standard FCC-06-96A1 is called Dynamic Frequency Selection (DFS). The idea behind DFS is simply to switch to a different channel every time a radar device is detected on the channel currently in use. Any device which uses one of the above frequency bands must incorporate this mechanism in the future.
R&S FSQ and R&S SMU equipped with pulse sequencer and DFS Analysis Tool allow a complete testing of DFS conformance.
2 DFS Conformance Test Procedures A general test setup for the conformance test is shown in Figure 1. Depending on whether the client or master is tested for conformance, the connections between generator, master, client, and analyzer must be adapted. The standard allows either a conducted, or a radiated measurement setup.
Section 7.8 of the standard specifies four separate parts of the “DFS Performance Test Procedures”:
• U-NII Detection Bandwidth
• Performance Requirements Check
• In-Service Monitoring

Dynamic Frequency Selection Analysis
1EF59_1E 3 Rohde & Schwarz
• Statistical Performance Check
Figure 1 General measurement setup
The “U-NII Detection Bandwidth” test determines the detection bandwidth on the selected channel. The detection bandwidth equals the frequency range which is monitored for radar signals. In detail, the center frequency of the injected radar signal is increased from the channel center frequency in steps of 1 MHz until the UUT fails to detect the signal. The last radar signal center frequency that satisfies the detection rate according to the standard is denoted as the upper frequency limit or fH. The lower frequency limit fL is determined the same way, with decreasing frequency instead of increasing. The difference fH - fL yields the detection bandwidth.
The “Performance Requirements Check” consists of three “Channel Availability Checks” initiated by different events. Each “Channel Availability Check” monitors the selected channel for a given time and is completed successfully, if no transmissions from the UUT occurred during the specified time. The analyzer settings used to monitor the respective channel are defined in the standard and are given in chapter 5. The different trigger events are: - the completion of the power-up cycle for the “Initial Channel Availability
Check”, - the completion of an injected radar burst at the beginning of a “Channel
Availability Check”, - the completion of an injected radar burst at the end of a “Channel
Availability Check”. The lower limits for these tests are 1 minute transmission-free time for the “Initial Channel Availability Check Time”, and 2.5 minutes of transmission-free time for both “Channel Availability Checks”.
The “In-Service Monitoring” part determines three parameters which specify the UUT’s behavior after the detection of a radar signal during data transmission.

Dynamic Frequency Selection Analysis
1EF59_1E 4 Rohde & Schwarz
- “Channel Move Time” comprises the entire time between the trigger event (end of the injected radar burst) and the last transmission of the UUT on the selected channel.
- The “Channel Closing Transmission Time” comprises only those fragments of the “Channel Move Time” during which the UUT transmits. As a spectrum analyzer in zero span mode can record a trace with a certain number of sweep points taken over the sweep time, the “Channel Closing Transmission Time” can be calculated by counting all sweep points that show a power level above the threshold. This number is then multiplied by the time interval that corresponds to one sweep point. The first 200 ms are included in the “Channel Closing Transmission Time”, regardless of the power level. Example: Assuming a sweep time of 10 seconds with 1000 sweep points. The first 20 points correspond to the initial 200 ms. All sweep points from 21 to 1000 are checked for their power level. If 72 additional samples were above the threshold, this yields a total of 91 sweep points, which corresponds to 910 ms channel closing transmission time.
- After changing the channel due to a detected radar signal, the UUT needs to obey a “Non-Occupancy Period”. During this period, no transmissions are allowed on the original channel. A 30 minute transmission-free time is required by the standard.
The “Statistical Performance Check” determines the detection probability of all radar types during a data stream between a U-NII master and a U-NII client device. A radar detection is declared as successful, if the UUT passed the “Channel Move Time” test.
All the above mentioned tests are repeated for 6 different radar waveform types. They are defined in section 6 of the standard. For example, radar waveform type is defined with a pulse width of 1 µs, a pulse repetition interval of 1428 µs, and 18 pulses in a waveform.
3 Software Features The R&S DFS Analysis Tool was developed to verify the compliance of a UUT with FCC-06-96A1. Analysis windows for three “Channel Availability Checks” are grouped under a “Channel Startup Checks” tab. The “In Service Monitoring” tab covers “Channel Move Time”, “Channel Closing Transmission Time”, and “Non-Occupancy Period”. “Detection Bandwidth” measurement, and the “Statistical Performance Check” can be covered using the above mentioned windows.
Figure 2 shows the DFS Analysis Tool with the “Channel Startup Check” tab activated.
All analysis windows consist of a trace display and a text box with the calculated value for the corresponding measurement. Two parameters can be specified for each measurement separately; the trigger source, and the measurement time. The trigger source can either be set to “Immediate” or “External”. An “Immediate” trigger” starts the measurement immediately after the “Start” button was pressed. In case the “External” trigger is used, a “Timing Alignment” must be performed for each radar signal, before measurements are taken. The details of this alignment can be found in section 7.
Dynamic Frequency Selection Analysis
1EF59_1E 5 Rohde & Schwarz
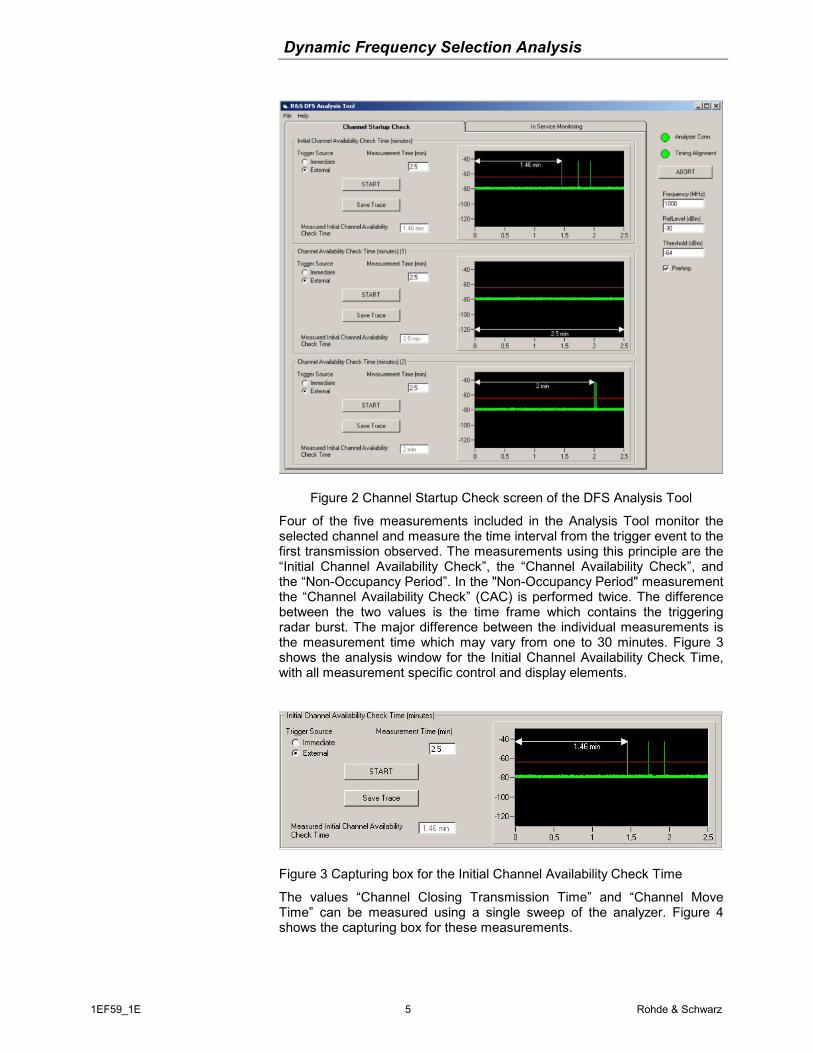
Figure 2 Channel Startup Check screen of the DFS Analysis Tool
Four of the five measurements included in the Analysis Tool monitor the selected channel and measure the time interval from the trigger event to the first transmission observed. The measurements using this principle are the “Initial Channel Availability Check”, the “Channel Availability Check”, and the “Non-Occupancy Period”. In the "Non-Occupancy Period" measurement the “Channel Availability Check” (CAC) is performed twice. The difference between the two values is the time frame which contains the triggering radar burst. The major difference between the individual measurements is the measurement time which may vary from one to 30 minutes. Figure 3 shows the analysis window for the Initial Channel Availability Check Time, with all measurement specific control and display elements.
Figure 3 Capturing box for the Initial Channel Availability Check Time
The values “Channel Closing Transmission Time” and “Channel Move Time” can be measured using a single sweep of the analyzer. Figure 4 shows the capturing box for these measurements.

Dynamic Frequency Selection Analysis
1EF59_1E 6 Rohde & Schwarz
Figure 4 Capturing box for Channel Move Time and Channel Closing Transmission Time
As the time resolution depends on the number of sweep points, the analyzer is always configured to use the maximum number available. For the FSL, with a maximum number of sweep points of 32001, the time resolution for a 12-second sweep is therefore 375 µs.
Model Max. sweep points maxN Time resolution (12 s) t∆
FSL 32001 375 µs
FSP 8001 1.5 ms
FSU 30001 400 µs
FSQ 30001 400 µs
After a successful analyzer sweep, the trace is shown in the corresponding diagram window. The threshold level is indicated by a red horizontal line, and the value are displayed in the diagram as well as marked graphically.
Once a measurement is started by pressing “START”, all start buttons are disabled (grayed out), until the measurement is finished or the “ABORT” button is clicked.
To document a measurement, the graphic data can be saved into a Windows meta file (wmf). The file is saved using a file name that contains the date and time and a distinct number for each of the measurements. Specify the directory to save the file in “File” – “Settings” – “Save path”. The data comprises everything displayed in the black window, i.e. the trace itself, the threshold line, and the measured value.
Example: An “Initial Channel Availability Check” trace, Oct. 26 2006, 1:45:23 PM will be saved under “20061026_134523_0.wmf”. “Channel Availability Check”, “Channel Availability Check”, “Non-Occupancy Period”, and “Channel Move Time” will be marked using the suffixes "_1", "_2", "_3", and "_4", respectively.
According to the FCC standard, the following settings are applied to the analyzer in use before each measurement.
RBW: 3 MHz, VBW: 3 MHz, Span: 0 Hz, RF Attenuation: 0 dB, Detector: Peak, Sweep Points: Max
Dynamic Frequency Selection Analysis
1EF59_1E 7 Rohde & Schwarz
4 Hardware and Software Requirements
Hardware requirements The DFS Analysis Tool requires an R&S Spectrum Analyzer that covers the 5 GHz frequency band. A connection between the control PC and the analyzer is required, via either GPIB or LAN.
To generate the necessary radar bursts, an R&S signal generator of the SMU family is required, equipped with the “Pulse Sequencer” option SMU-K6.
Please check section 10 for detailed ordering information.
Software requirements To perform the measurements described in this application note the following software packages are required:
- R&S DFS Analysis Tool for performing the spectrum analyzer measurements.
- R&S Pulse Sequencer in order to set up the signal generator.
- A VISA interface for remote control of the instruments.
See section 10 for ordering information.
5 Measurement Setup
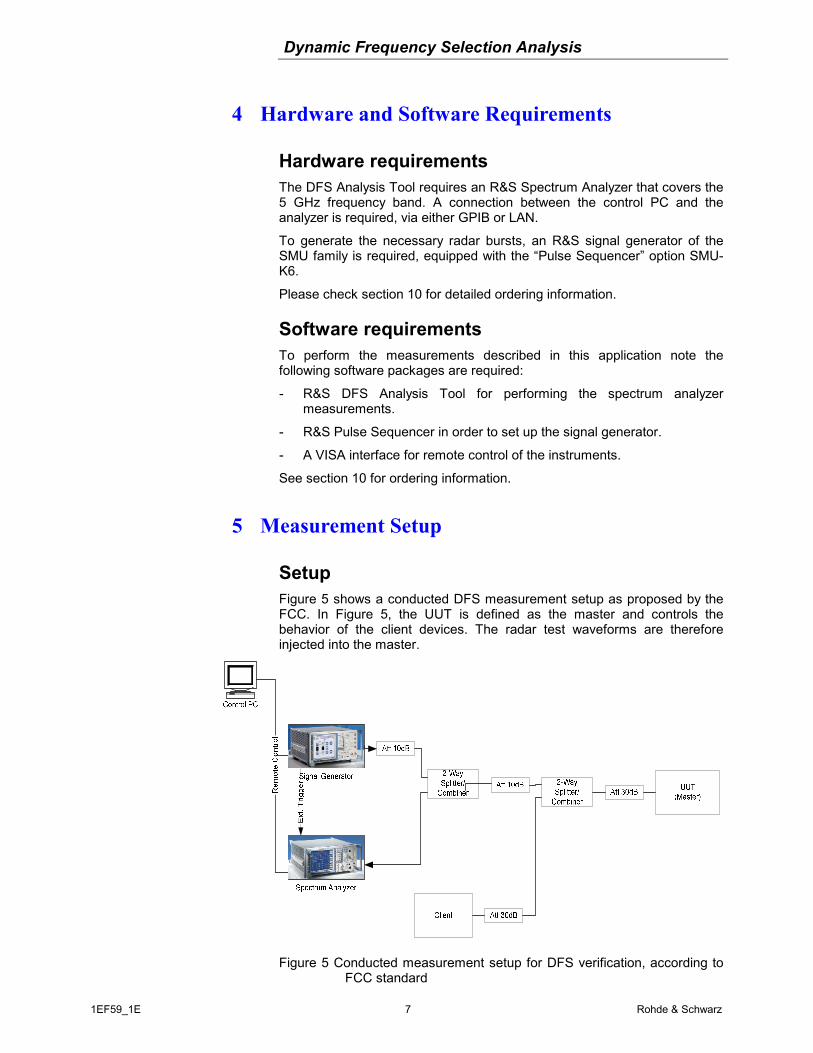
Setup Figure 5 shows a conducted DFS measurement setup as proposed by the FCC. In Figure 5, the UUT is defined as the master and controls the behavior of the client devices. The radar test waveforms are therefore injected into the master.
Figure 5 Conducted measurement setup for DFS verification, according to FCC standard

Dynamic Frequency Selection Analysis
1EF59_1E 8 Rohde & Schwarz
Prior to performing a measurement using the spectrum analyzer, the required radar test waveforms must be uploaded into the signal generator using the R&S Pulse Sequencer software option.
The Control PC configures the signal generator as well as the analyzer using the DFS Analysis Tool. The generator transmits a pulsed radar signal and triggers the analyzer according to the FCC-defined start of the analyzer measurement. The analyzer makes a sweep on the selected channel. The trace is then transferred to the PC and the required measurement results are calculated from the trace data.
6 Installing the Software The setup process is started by double-clicking on the “setup.exe” file.
The automated setup program guides you through the installation process. The setup program will install all required components on your PC. A shortcut to the DFS Analysis Tool will be added to the Programs menu.
7 Starting the Software
Configuring the DFS Analysis Tool Prior to the first measurement, configure the tool for the test setup in use. Settings that usually do not change during a measurement session are grouped in a separate settings dialog that can be accessed via the “File” Menu. Figure 6 shows the configuration dialog, for the VISA resource string and the storage device for traces.
The connection to the analyzer in use (R&S FSL, FSP, FSU or FSQ) is established using a VISA interface; a VISA library must be installed on your PC. The VISA resource string allows you to specify the address of your instrument regardless of the hardware interface, as long as your VISA version supports the interface. The VISA string consists of one part specifying the interface and a second part specifying the instrument address.

Dynamic Frequency Selection Analysis
1EF59_1E 9 Rohde & Schwarz
Figure 6 Settings dialog of the analysis tool at start up
Example: An analyzer connected to the GPIB bus “0” with address 20 can be addressed as “GPIB0::20”, an analyzer connected to your LAN, with TCPIP address 192.168.1.1, can be addressed as “TCPIP::192.168.1.1”.
After specifying the instrument in use by its VISA string, press the button “Connect”. Once a connection to the instrument is successfully established, the LED in the settings dialog as well as the LED in the main window will show green. The “Connect” button turns into a “Disconnect” button. Another click on this button disconnects the analyzer and resets the LEDs to red and the button label to “Connect”.
The button “Align Timing” starts the self alignment of the measurement setup. This step is necessary if an external trigger is used. It compensates the delay time differences between the trigger and the RF path. To align the timing, make sure all U-NII devices in the setup are switched off so that transmissions are only generated by the signal generator. Press the “Align Timing” button and initiate a radar sequence with a trigger event as it will be used for the measurements. The program will now determine the delay difference and program the trigger offset so that the measurement does not capture the last radar pulse as an U-NII transmission. Use the alignment step every time the radar type, i.e. the radar signal, is changed. A timeout error will occur, if no trigger event is generated within 6 s.
The “Save trace to” parameter specifies whether a click on a “Save” button saves a trace to the clipboard or the directory specified by the drive and directory box below.
Measurement The main control window has 5 more control elements in the upper right corner (see figure 6).
Dynamic Frequency Selection Analysis
1EF59_1E 10 Rohde & Schwarz
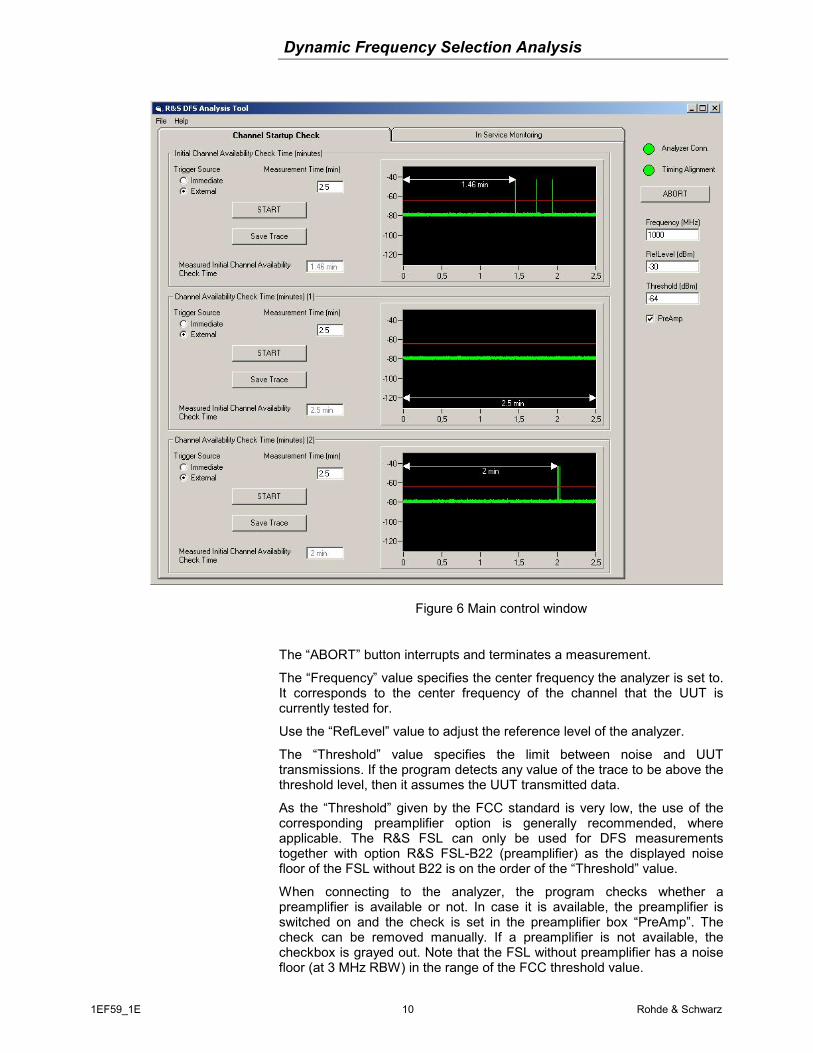
Figure 6 Main control window
The “ABORT” button interrupts and terminates a measurement.
The “Frequency” value specifies the center frequency the analyzer is set to. It corresponds to the center frequency of the channel that the UUT is currently tested for.
Use the “RefLevel” value to adjust the reference level of the analyzer.
The “Threshold” value specifies the limit between noise and UUT transmissions. If the program detects any value of the trace to be above the threshold level, then it assumes the UUT transmitted data.
As the “Threshold” given by the FCC standard is very low, the use of the corresponding preamplifier option is generally recommended, where applicable. The R&S FSL can only be used for DFS measurements together with option R&S FSL-B22 (preamplifier) as the displayed noise floor of the FSL without B22 is on the order of the “Threshold” value.
When connecting to the analyzer, the program checks whether a preamplifier is available or not. In case it is available, the preamplifier is switched on and the check is set in the preamplifier box “PreAmp”. The check can be removed manually. If a preamplifier is not available, the checkbox is grayed out. Note that the FSL without preamplifier has a noise floor (at 3 MHz RBW) in the range of the FCC threshold value.
Dynamic Frequency Selection Analysis
1EF59_1E 11 Rohde & Schwarz
With a successful connection to the analyzer, each measurement can be performed independently by hitting the corresponding “START” button.
The FCC regulations define the beginning of each measurement as the end of an injected radar burst. Therefore the default setting for the trigger source is “External”, meaning that the connected analyzer will wait for a trigger event at its external trigger input port, after the “Start” button was pressed. The trigger event needs to be generated by the signal generator that transmits the radar bursts.
8 Literature Federal Communications Commission, FCC 06-96, June 29th , 2006
DFS Signal Generation Manual shipped with R&S SMU-K6 Pulse Sequencer.
9 Additional Information Please contact [email protected] for comments and further suggestions.
10 Ordering Information Spectrum / Signal Analyzer R&S FSL6 9 kHz – 6 GHz 1300.2502.06 R&S FSL-B22 RF Preamplifier 1300.5953.02 R&S FSP7 9 kHz – 7 GHz 1164.4391.07 R&S FSU8 20 Hz – 8 GHz 1166.1660.08 R&S FSQ8 20 Hz – 8 GHz 1155.5001.08 R&S SMU200A Signal generator 1141.2005.02 R&S SMU-B106 RF path 100 kHz – 6 GHz 1141.8803.02 2xR&S SMU-B10 Baseband generator 1141.7007.02 R&S SMU-B13 Baseband main module 1141.8003.04 R&S SMU-K6 Pulse Sequencer 1408.7662.02 VISA I/O library Instrument control 1161.8473.02
ROHDE & SCHWARZ GmbH & Co. KG . Mühldorfstraße 15 . D-81671 München . P.O. B 80 14 69 . D-81614 München .
Telephone +49 89 4129-0 . Fax +49 89 4129-13777 . Internet: http://www.rohde-schwarz.com
This application note and the supplied programs may only be used subject to the conditions of use set forth in the download area of the Rohde & Schwarz website.