df 09/21/06
DESCRIPTION
TRANSCRIPT

Dean Foods Company
Prudential Equity Group’s15th Annual
Back-To-SchoolConsumer Conference
September 7, 2006

Forward Looking Statements
The following statements made in this presentation are “forward looking” and are made pursuant to the safe harbor provision of the Securities Litigation Reform Act of 1995: statements relating to (1) projected sales (including for individual segments, for specific product lines and for the company as a whole), profit margins, net income and earnings per share, (2) our growth strategy, (3) our branding initiatives (4) our integration plans, and (5) our cost-savings initiatives. These statements involve risks and uncertainties that may cause results to differ materially from those set forth in this presentation. Financial projections are based on a number of assumptions. Actual results could be materially different than projected if those assumptions are erroneous. Sales, profit margins, net income and earnings per share can vary based on a variety of economic, governmental and competitive factors, all of which are identified in our filings with the Securities and Exchange Commission, including our Annual Report on Form 10K (which can be accessed on our website at www.deanfoods.com or the website of the Securities and Exchange Commission at www.sec.gov). The success of our branding initiatives will depend on a number of factors, including customer and consumer acceptance of both the products themselves and the prices that we intend to charge for those products. We have many competitors with greater resources than ours, and significant additional spending or innovations by our competitors could render our products less successful than we currently expect. All forward looking statements in this presentation speak only as of the date of this presentation. We expressly disclaim any obligation or undertaking to release publicly any updates or revisions to any such statements to reflect any change in our expectations with regard thereto or any changes in the events, conditions or circumstances on which any such statement is based.

Agenda
Unique Beverage Platform
Dean Dairy Group
WhiteWave Foods
Well Positioned for Sustained Growth
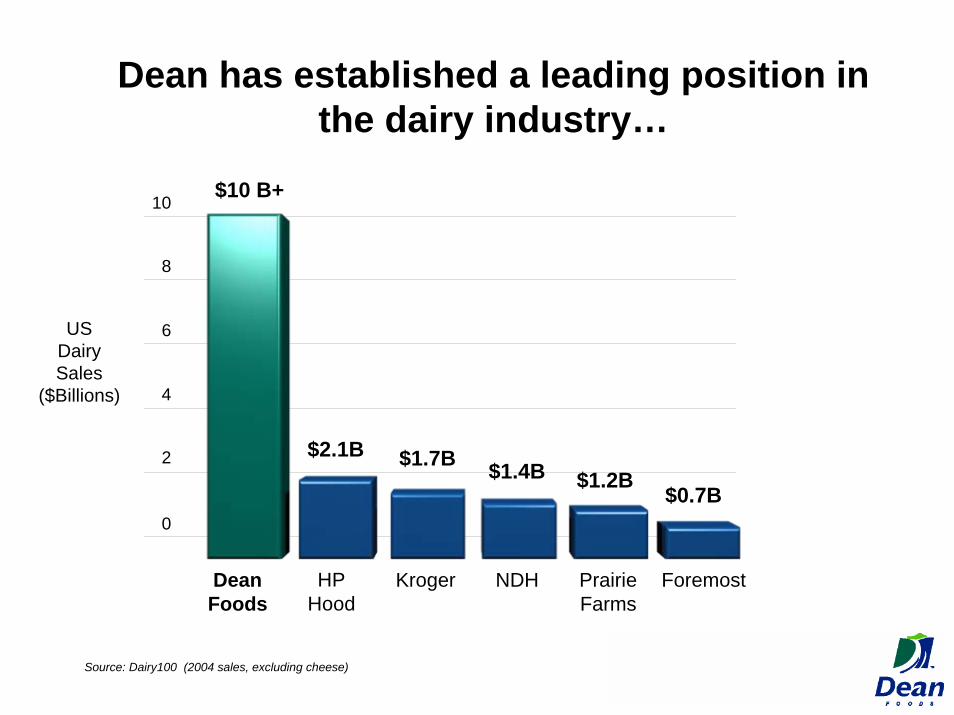
Dean has established a leading position in the dairy industry…
10
8
6
4
2
0
DeanFoods
HPHood
Kroger NDH PrairieFarms
Foremost
$10 B+
$2.1B $1.7B $1.4B $1.2B$0.7B
USDairySales
($Billions)
Source: Dairy100 (2004 sales, excluding cheese)

…and is the only national dairybeverage company
Leading portfolio of national and regional dairy brands in health and wellness beverage categories
National manufacturing system with fullest set of capabilities and with market proximity as a strategic advantage
Unparalleled refrigerated distribution network
Deep customer relationships at local, regional and national levels across all channels
Potential to innovate across the entire dairy category
Experienced management team with deep company, dairy and beverage industry expertise

Strong RegionalBrands
Strong branded position,complemented by private label…
National BrandsPrivateLabel
37% BrandedSales
63%
Dean Foods 2005Sales Mix

… supported by the country’s only national manufacturing system…

… with flexible production capabilities…
Short Shelf Life16-18 days
Extended Shelf Life45-60 days
Aseptic6-9 months
Any consumer,any occasion

Ice Creamand Novelties
…in more than just milk…
Cottage Cheese
Yogurts

…in more than just milk…
Sour Creams
Juices Teas
Waters
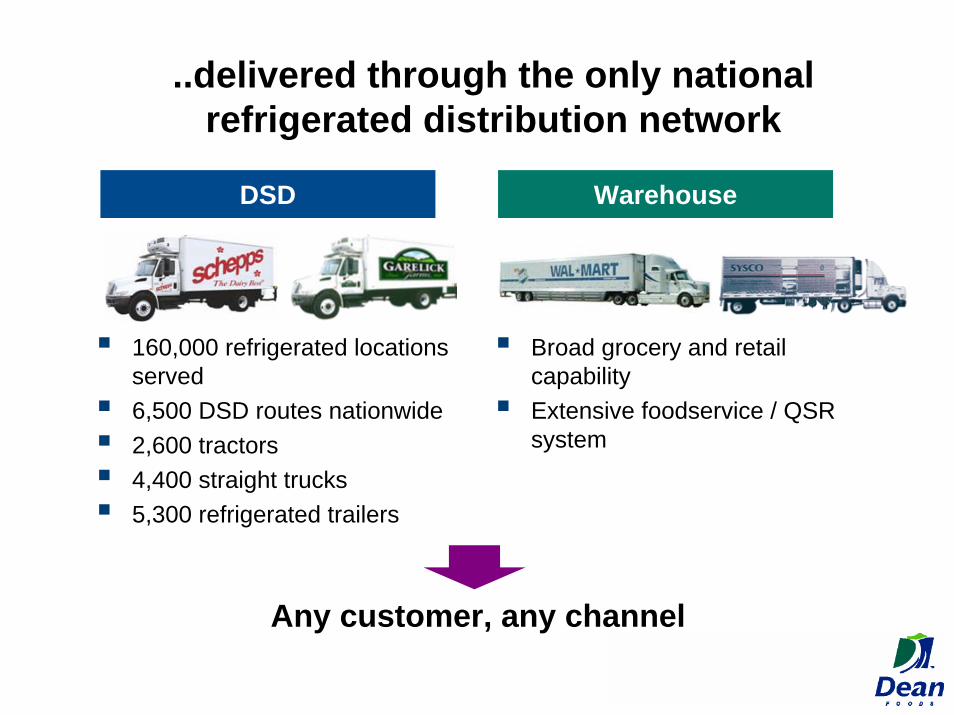
..delivered through the only national refrigerated distribution network
160,000 refrigerated locations served6,500 DSD routes nationwide2,600 tractors4,400 straight trucks5,300 refrigerated trailers
Broad grocery and retail capabilityExtensive foodservice / QSR system
Any customer, any channel
WarehouseDSD
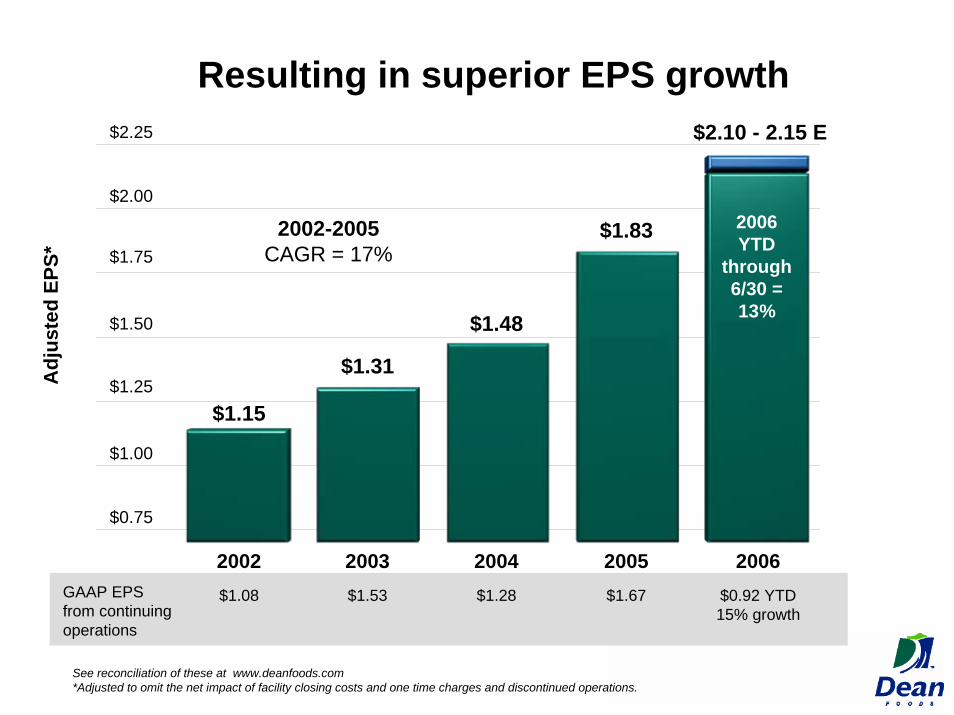
Resulting in superior EPS growth
2002-2005CAGR = 17%
$1.15
$1.31
$1.48
$1.83
$2.10 - 2.15 E
$0.75
$1.00
$1.25
$1.50
$1.75
$2.00
$2.25
2002 2003 2004 2005 2006GAAP EPSfrom continuing operations
$1.08 $1.53 $1.28 $1.67 $0.92 YTD15% growth
2006 YTD
through 6/30 = 13%
Adj
uste
d EP
S*
See reconciliation of these at www.deanfoods.com*Adjusted to omit the net impact of facility closing costs and one time charges and discontinued operations.

…and strong cash flow generation
$385M $414M
$542M
$265M
Cash Flow from Continuing Operations
2003 2004 2005 2006
$260M$301M $287M
$114M
Capital Expenditures for Continuing Operations
2003 2004 2005 2006
~$250M
YTD6/30
YTD6/30
$0
$5
$10
$15
$20
$25
$30
$35
$40
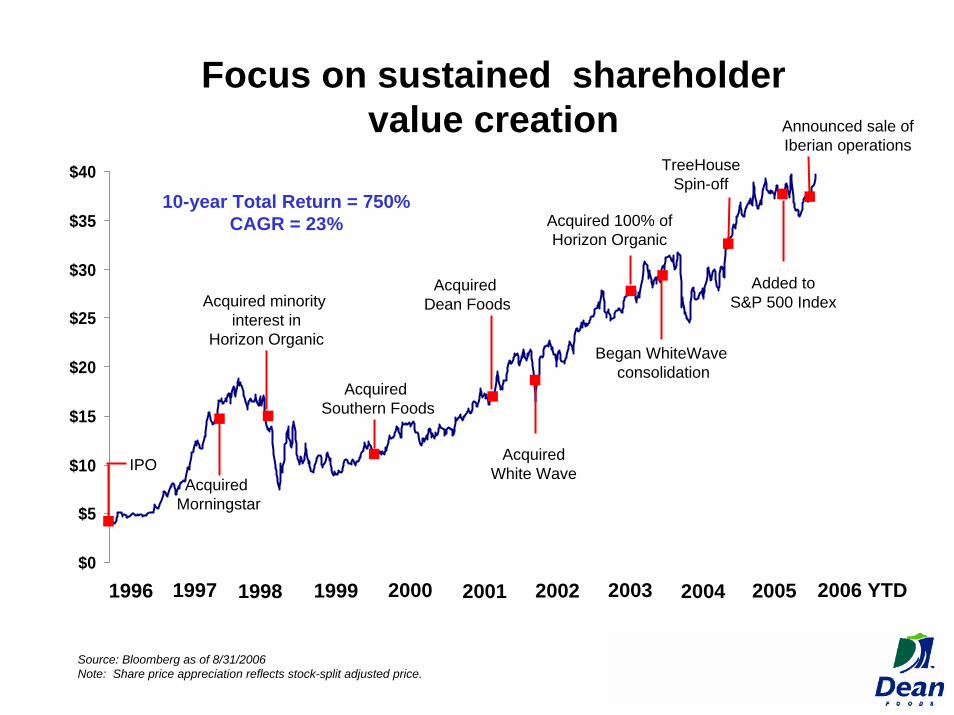
Focus on sustained shareholdervalue creation
Acquired Morningstar
Acquired Dean Foods
AcquiredWhite Wave
Acquired 100% ofHorizon Organic
Began WhiteWaveconsolidation
TreeHouseSpin-off
Source: Bloomberg as of 8/31/2006Note: Share price appreciation reflects stock-split adjusted price.
Added toS&P 500 Index
Acquired Southern Foods
IPO
Acquired minority interest in
Horizon Organic
10-year Total Return = 750%CAGR = 23%
Announced sale of Iberian operations
1996 1997 1998 1999 2000 2001 2002 2003 2004 2005 2006 YTD
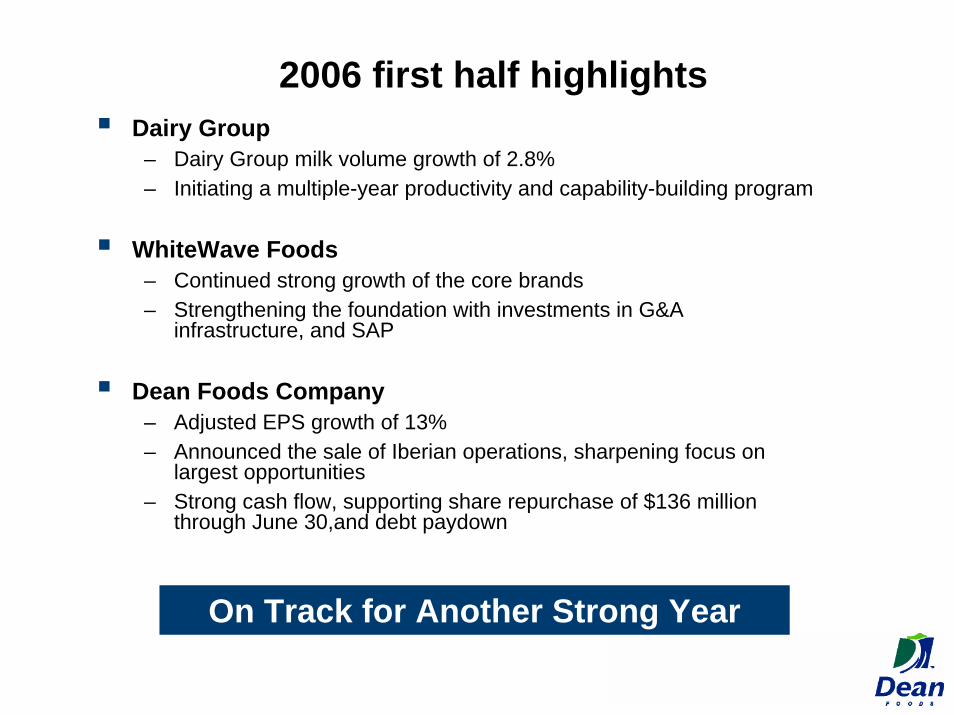
2006 first half highlightsDairy Group
– Dairy Group milk volume growth of 2.8%– Initiating a multiple-year productivity and capability-building program
WhiteWave Foods– Continued strong growth of the core brands – Strengthening the foundation with investments in G&A
infrastructure, and SAP
Dean Foods Company– Adjusted EPS growth of 13%– Announced the sale of Iberian operations, sharpening focus on
largest opportunities– Strong cash flow, supporting share repurchase of $136 million
through June 30,and debt paydown
On Track for Another Strong Year

Agenda
Unique Beverage Platform
Dean Dairy Group
WhiteWave Foods
Well Positioned for Sustained Growth
-4%
-3%
-2%
-1%
0%
1%
2%
3%
4%
5%
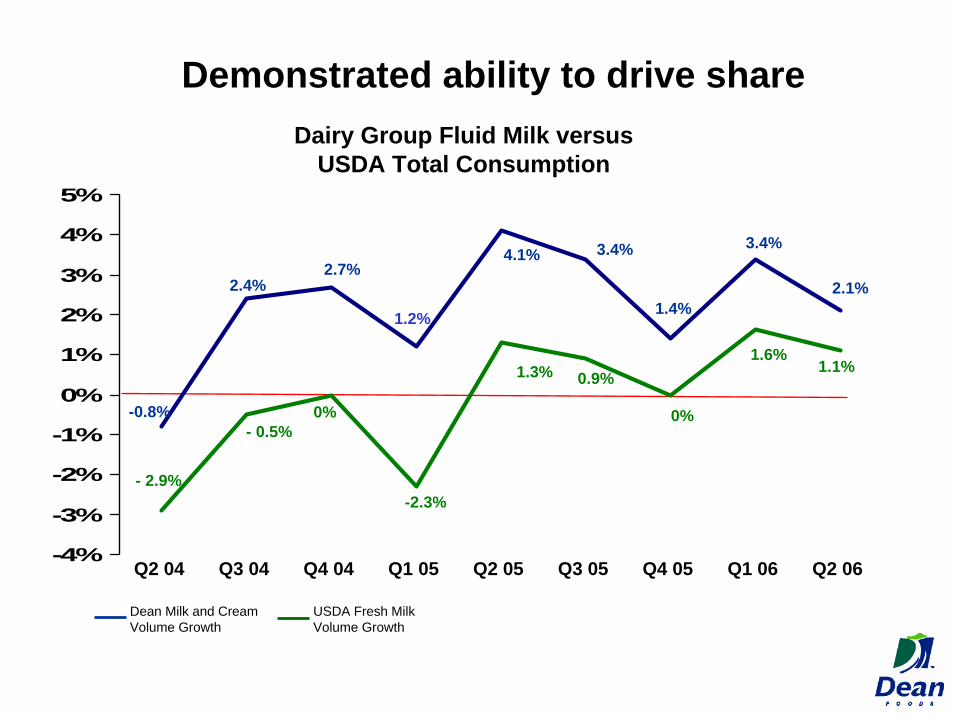
Dairy Group Fluid Milk versusUSDA Total Consumption
USDA Fresh MilkVolume Growth
Dean Milk and CreamVolume Growth
-0.8%
- 2.9%
- 0.5%
-2.3%
0%
1.3% 0.9%
2.4%2.7%
1.2%
4.1% 3.4%
Q2 04 Q3 04 Q4 04 Q1 05 Q2 05 Q3 05 Q4 05
0%
1.4%
3.4%
1.6%
Q1 06
1.1%
2.1%
Q2 06
Demonstrated ability to drive share

Dairy Group Overview
$6B+ in annual freshmilk sales plus:($ Millions)
0
200
400
600
800
2005 Sales Mix
IceCream
Yogurt &Cultured
ESL &Creamers
Juice,Water
and Tea
Ice Cream Mix
Other

Entering the next phase ofDairy Group evolution
Shifting volume to more efficient facilities, elimination of excess capacity to reduce costs
Demonstrated ability to drive market share
Significant management focus on portfolio rationalization and WhiteWave consolidation
Early steps towards developing the future Dairy Group operating model
75 fold US dairy revenue growth from 1994 to 2002
– $100 million to$7.6 billion
Expanded from 2 facilities to over 100
Developed only nationwide footprint in the industry
Four times larger than nearest competitor
Primary focus on rollup, limited change to local dairy operating model
Consolidation
1994 - 2001
Transition
2002 - 2006
Evolve the Dairy Group operating model to maximize the benefits of its scale advantage
Strengthen functional expertise to reduce costs and sustain year on year productivity
Enhance selling capability
Ensure pace of change does not inhibit business performance
Opportunity to sustain strong operating profit growth
Transformation
2007 - 2010
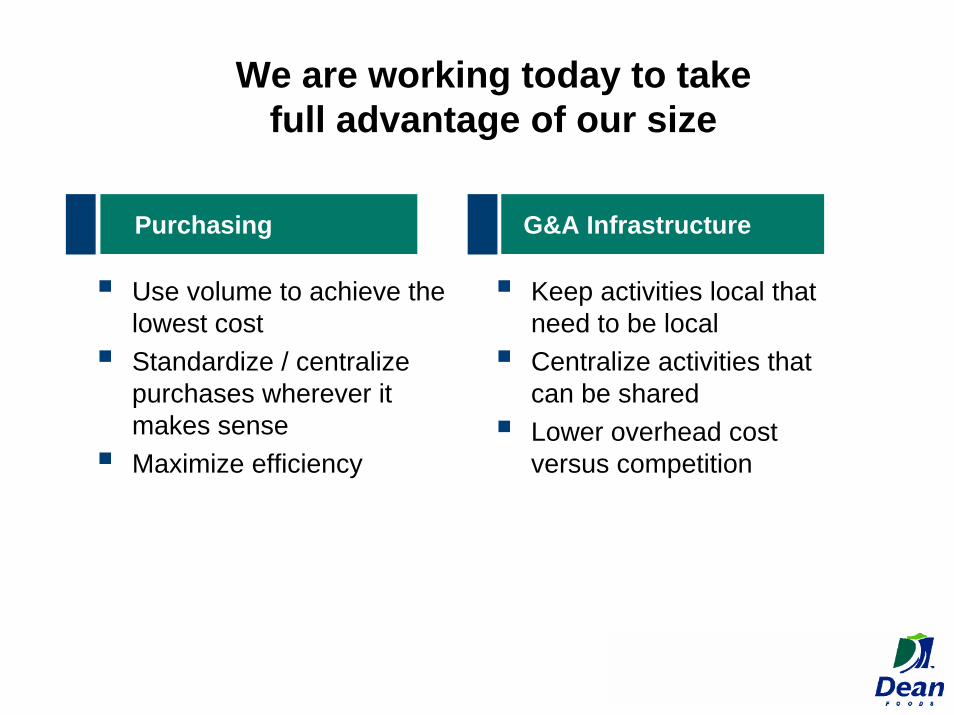
Purchasing G&A Infrastructure
We are working today to takefull advantage of our size
Use volume to achieve the lowest costStandardize / centralize purchases wherever it makes senseMaximize efficiency
Keep activities local that need to be localCentralize activities that can be sharedLower overhead cost versus competition
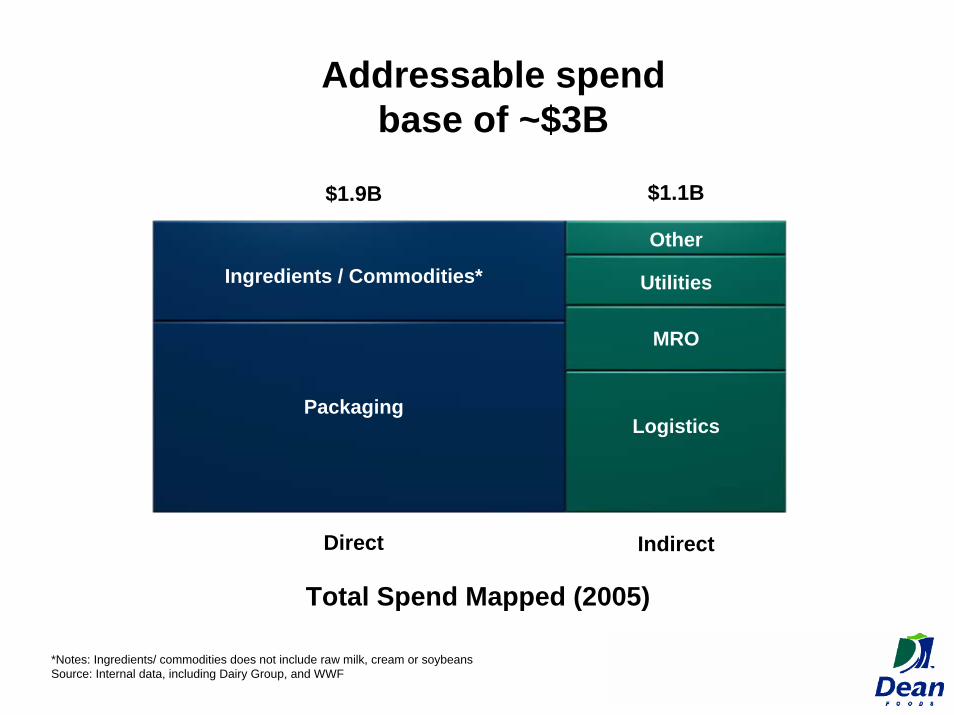
Addressable spendbase of ~$3B
Ingredients / Commodities*
Packaging
Other
Utilities
MRO
Logistics
Direct Indirect
$1.1B$1.9B
Total Spend Mapped (2005)
*Notes: Ingredients/ commodities does not include raw milk, cream or soybeans Source: Internal data, including Dairy Group, and WWF
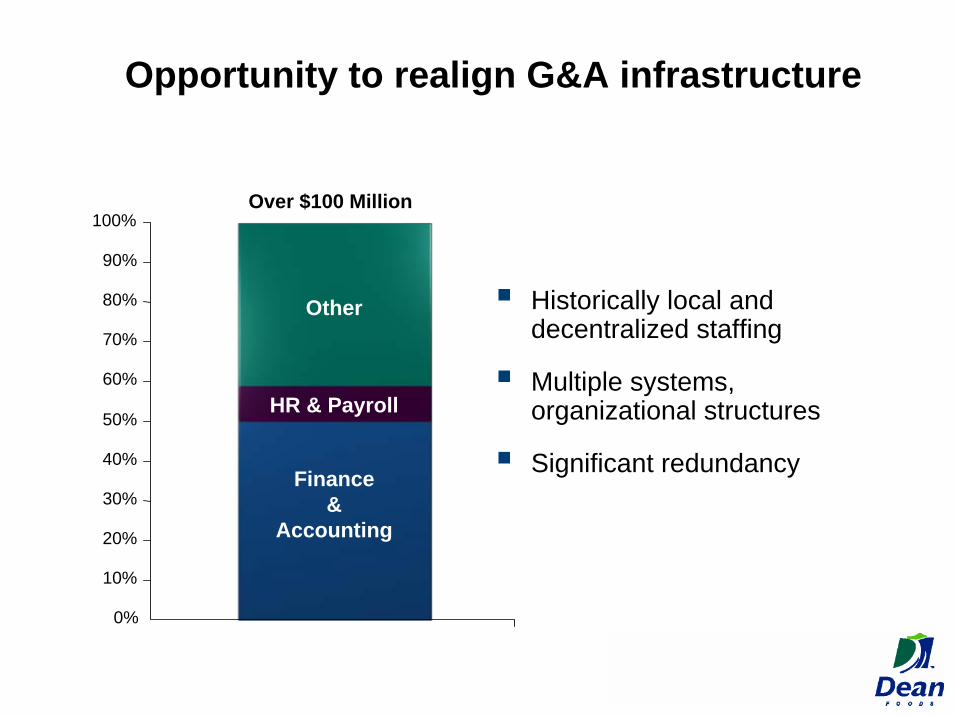
Opportunity to realign G&A infrastructure
Historically local and decentralized staffing
Multiple systems, organizational structures
Significant redundancyFinance &
Accounting
HR & Payroll
Other
Over $100 Million
0%
10%
20%
30%
40%
50%
60%
70%
80%
90%
100%
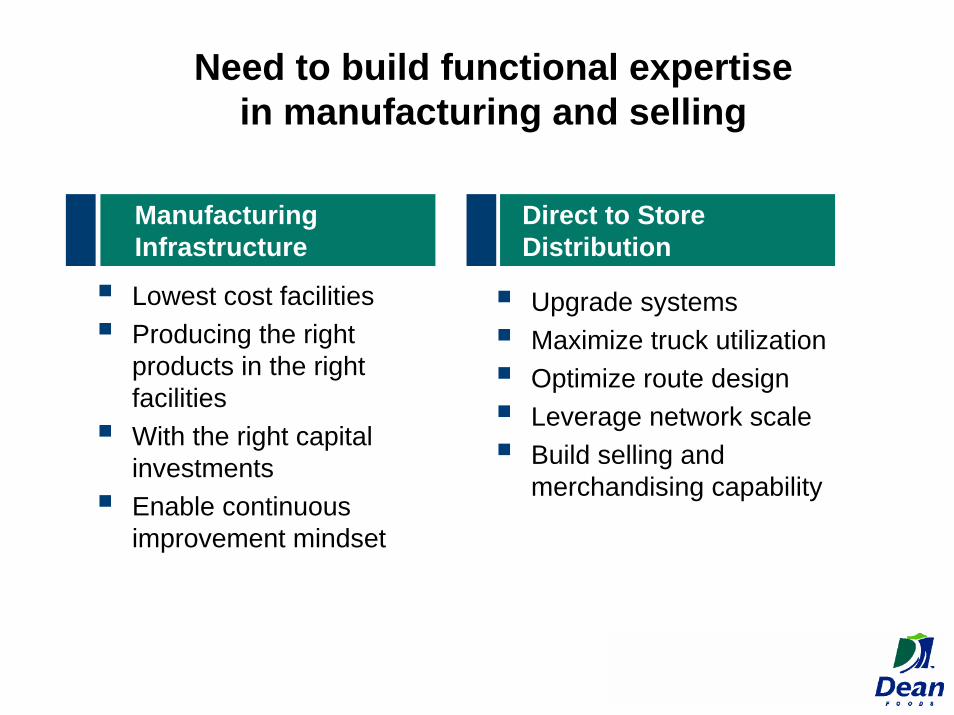
Need to build functional expertisein manufacturing and selling
Lowest cost facilitiesProducing the right products in the right facilitiesWith the right capital investmentsEnable continuous improvement mindset
Upgrade systemsMaximize truck utilizationOptimize route designLeverage network scaleBuild selling and merchandising capability
ManufacturingInfrastructure
Direct to StoreDistribution
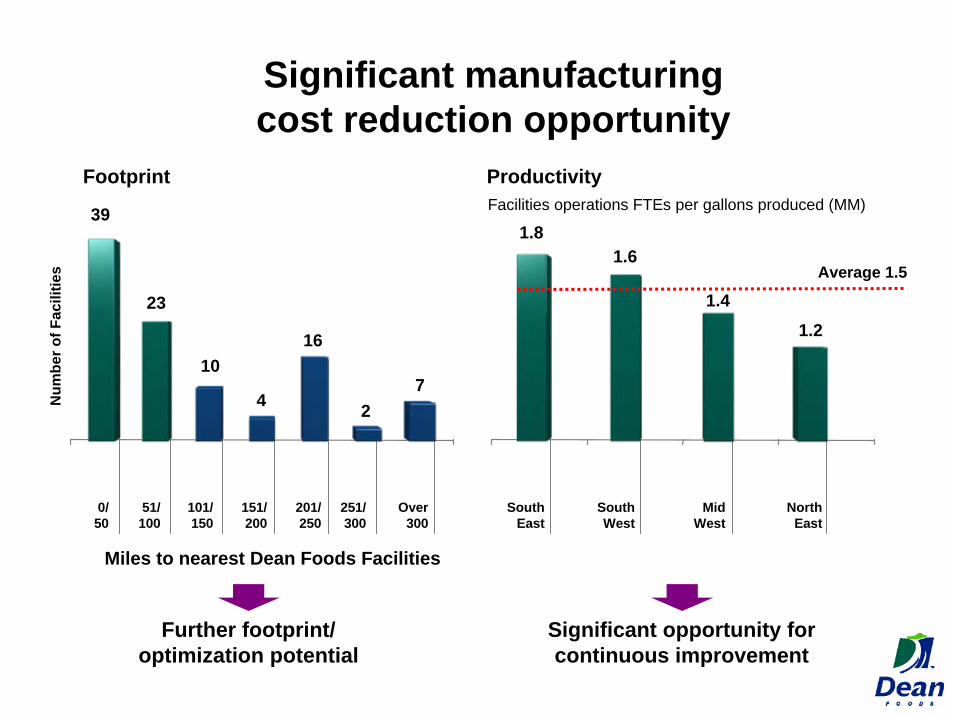
Significant manufacturingcost reduction opportunity
39
23
10
4
16
27
0/50
51/100
101/150
151/200
201/250
251/300
Over300
1.81.6
1.41.2
SouthEast
SouthWest
MidWest
NorthEast
Average 1.5
Facilities operations FTEs per gallons produced (MM)
Miles to nearest Dean Foods Facilities
Num
ber o
f Fac
ilitie
s
Further footprint/ optimization potential
Footprint Productivity
Significant opportunity for continuous improvement
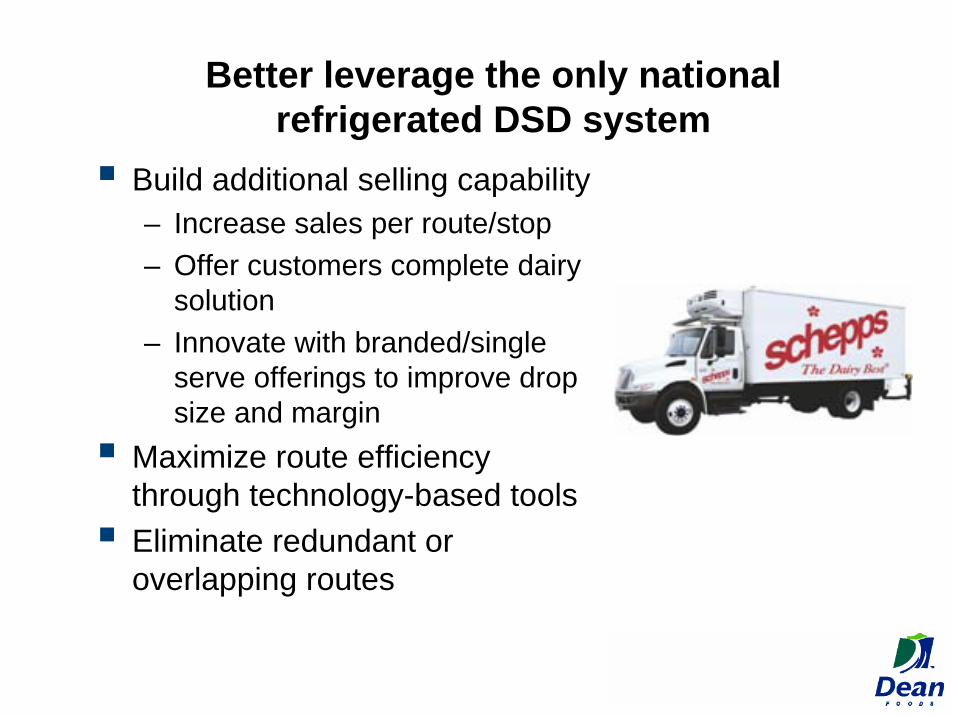
Better leverage the only nationalrefrigerated DSD system
Build additional selling capability– Increase sales per route/stop– Offer customers complete dairy
solution– Innovate with branded/single
serve offerings to improve drop size and margin
Maximize route efficiency through technology-based toolsEliminate redundant or overlapping routes
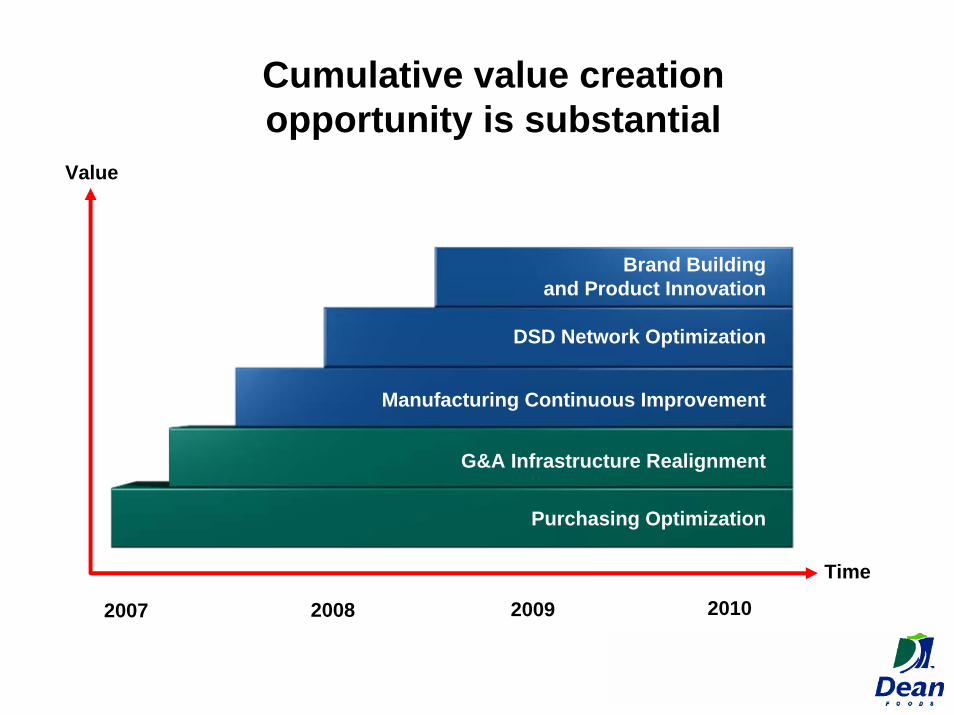
Cumulative value creationopportunity is substantial
Purchasing Optimization
Manufacturing Continuous Improvement
G&A Infrastructure Realignment
DSD Network Optimization
Brand Buildingand Product Innovation
Time
2007 20102008 2009
Value

Dairy industry evolution
Consolidated industrySingle national player – Dean FoodsGrowing profitability; resources to investInvestment in innovation and marketingEmergence of national brandsPortfolio of strong regional brandsGreater consumer focus on nutrition
Fragmented industry
Local companies/little scale
Locally managed, lack of functional expertise
Limited profitability and financial resources
Infrequent innovation
Limited marketing
High private label penetration
TraditionalDairy
NewDairy
Agenda
Unique Beverage Platform
Dean Dairy Group
WhiteWave Foods
Well Positioned for Sustained Growth

WhiteWave Foods: Strong brandswith a history of robust growth
2000 2001 2002 2003 2004 2005
5-Yr CAGR ofKey Brands = 28%
Note: Assuming full ownership in all comparable periods.
% of 2005 WhiteWave
Sales
6%
28%
23%
20%
15%
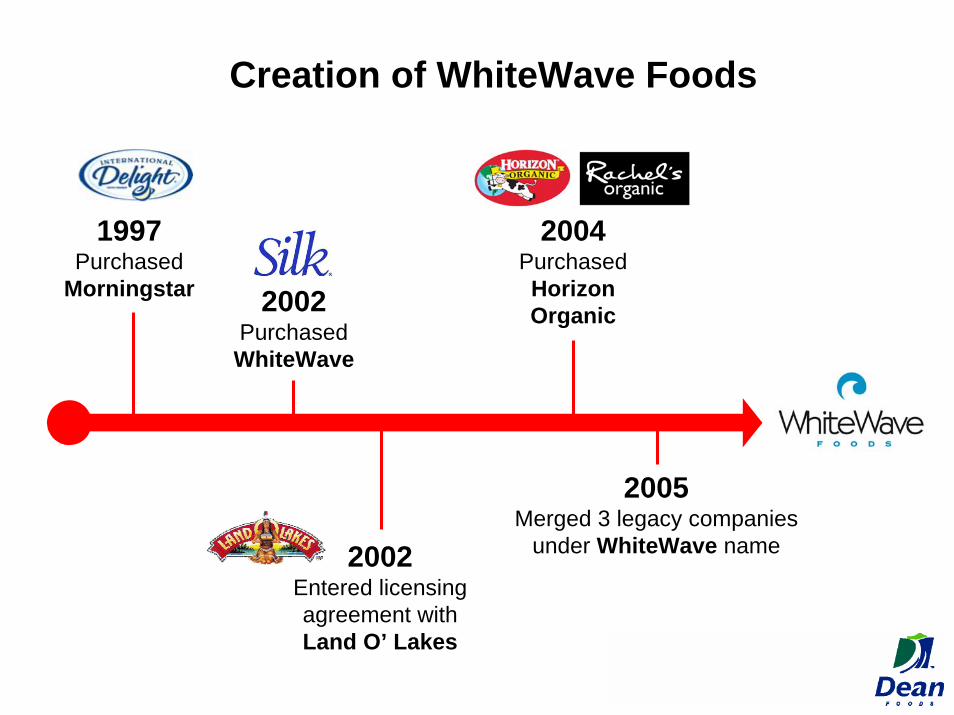
Creation of WhiteWave Foods
1997Purchased
Morningstar
2002Entered licensing agreement with Land O’ Lakes
2004Purchased HorizonOrganic
2005Merged 3 legacy companies
under WhiteWave name
2002Purchased WhiteWave

Integration of 3 legacy companies
Time2004 2005-2006 2007-2008
Sustainable growthand superior returns
3 separate,legacy companies
– 3 faces to the customer
– 3 separate,under-leveragedsupply chains
– Internal redundancy– Limited process
and systems infrastructure
One company
– 1 organization– 1 leadership team– 1 “sales” face to
the customer– Supply chain
integration in progress
– Process and systems build-out in progress
One, unified company;
best-in-class brands, talent and
infrastructure
– Focused portfolio of premium brands
– 1 face to the customer
– Fully integrated supply chain
– Top-talent organization
– Best-in-class processes and systems
Platform for further premiumbranded beverage growth
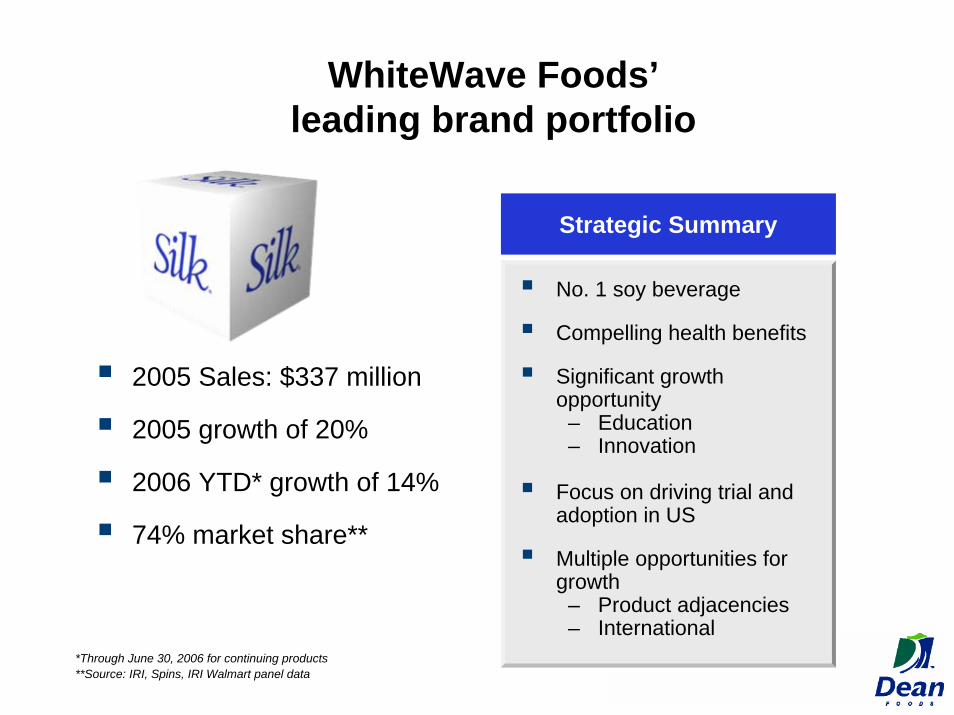
WhiteWave Foods’leading brand portfolio
2005 Sales: $337 million
2005 growth of 20%
2006 YTD* growth of 14%
74% market share**
Strategic Summary
No. 1 soy beverage
Compelling health benefits
Significant growth opportunity
– Education– Innovation
Focus on driving trial and adoption in US
Multiple opportunities for growth
– Product adjacencies– International
*Through June 30, 2006 for continuing products**Source: IRI, Spins, IRI Walmart panel data

Market studies indicate a$1B+ soymilk category by 2008
$1.1B$1.2B
$1.4B
Soyatech Cambridge Mintel
2008 Soymilk Sales Estimates ($Billions)

Rapid growth of the soymilkcategory should continue
Penetration should increase– Virtually all sales are to 11%
of households– These buyers represent 80%
of category volume– Another 30% of US households
are interested in soymilkFrequency should increase– Core soymilk households still
consume 3X as much conventional milk as soymilk
Represents significant opportunity to grow the category

WhiteWave Foods’leading brand portfolio
2005 Sales: $273 Million
2005 milk sales increaseof 44%
2006 YTD* growth of 28%
46% market share**
Strategic Summary
Invest to increase supply
localize the supply chainand drive margin
Realign pricing as supply increases for profitability and sustainable category growth
Drive growth on core fluid milk by targeting interested organically inclined consumers
*Through June 30, 2006 for continuing products**Source: IRI, Spins, IRI Walmart panel data
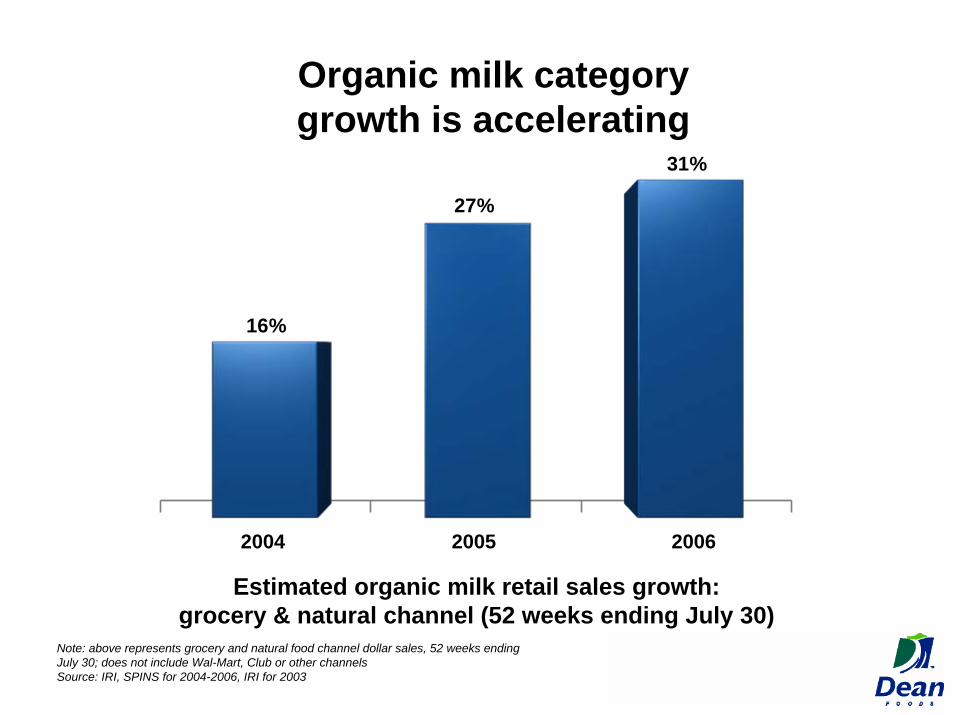
Organic milk categorygrowth is accelerating
Estimated organic milk retail sales growth:grocery & natural channel (52 weeks ending July 30)
Note: above represents grocery and natural food channel dollar sales, 52 weeks endingJuly 30; does not include Wal-Mart, Club or other channelsSource: IRI, SPINS for 2004-2006, IRI for 2003
16%
27%
31%
2004 2005 2006

Rapid growth of the organicmilk category should continue
Penetration should increase– Virtually all sales are to 3.3% of
households, up 1.2 pts (150 index) versus 20031.
– Another 29% of US households are interested in organic milk2.
Frequency should increase– 22% of consumers view organic as
“extremely” or “very important” to healthy lifestyle3.
1. IRI Household Panel.2. Cambridge Group – Demand Landscape March 2006.3. Natural Marketing Institute: Health and Wellness Trends Report 2006.
Represents significant opportunity to grow the category

Supply regionality for Horizon Organic
We have a locally aligned supply chainDesigned to provide shortest time from farmto tableThis will increasingly become a strategic advantage
9%
22%10%
11%
18%
13% 17%

We are investing to grow supply
Adding new family farms to producer network is our first priority – 342 currently, 240 in
transition– Horizon Organic Producer
Education Program –Assists farmers in transition to organic
– Transition takes time 12 months for cows, 36 months for land
Pursuing strategic partnerships with innovative producersSelectively leveraging supply at company-owned farms – 20% of current supply
Expecting supply growthin excess of 20% for 2007
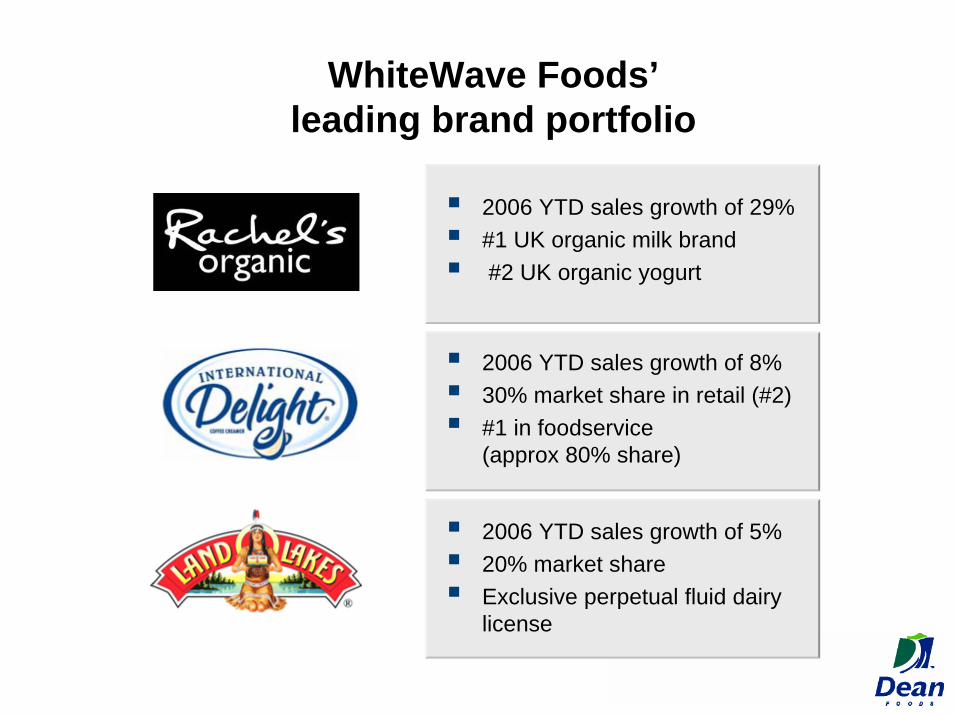
WhiteWave Foods’leading brand portfolio
2006 YTD sales growth of 29%#1 UK organic milk brand#2 UK organic yogurt
2006 YTD sales growth of 8%30% market share in retail (#2)#1 in foodservice(approx 80% share)
2006 YTD sales growth of 5%20% market shareExclusive perpetual fluid dairy license

Agenda
Unique Beverage Platform
Dean Dairy Group
WhiteWave Foods
Well Positioned for Sustained Growth

Well positioned for long term growth
Dairy Group entering next phase of long-term strategy– Consistently growing market share
– Multi-year productivity and capability-building program to extend advantage and improve margins
WhiteWave Foods executing for growth– Driving strong growth of well-positioned brands in attractive
categories
– Pushing efficiency through integration of businesses
– Focus on building an innovation center of excellence
Intense focus on cash flow generation andsustained shareholder value creation
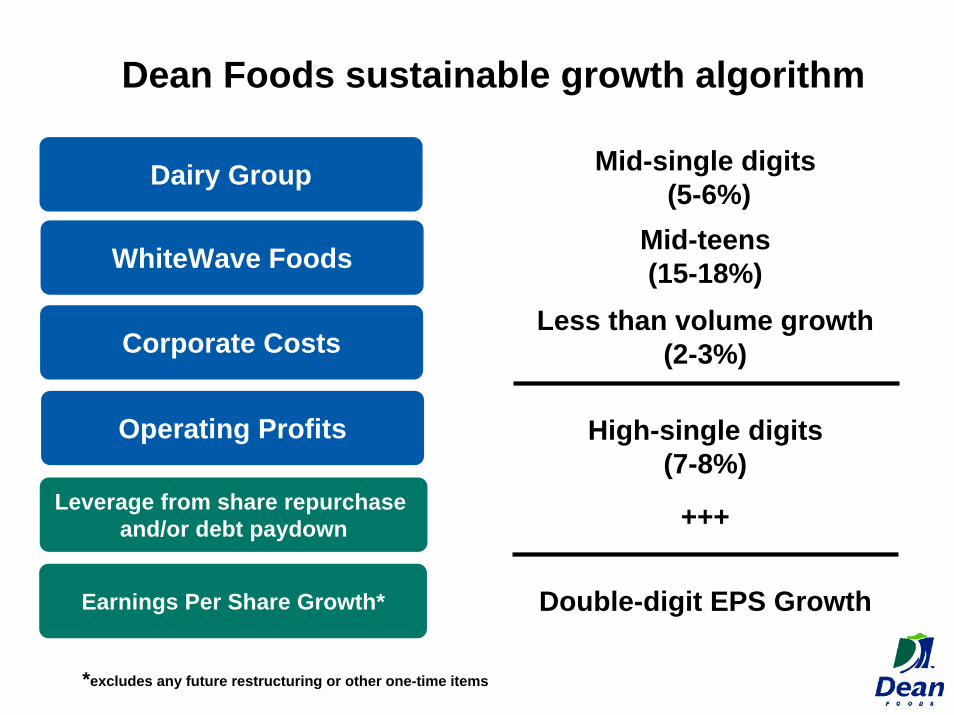
WhiteWave Foods
Dean Foods sustainable growth algorithm
Dairy Group
Leverage from share repurchase and/or debt paydown
Corporate Costs
Operating Profits
Earnings Per Share Growth*
Mid-single digits(5-6%)
Mid-teens (15-18%)
Less than volume growth (2-3%)
High-single digits(7-8%)
+++
Double-digit EPS Growth
*excludes any future restructuring or other one-time items
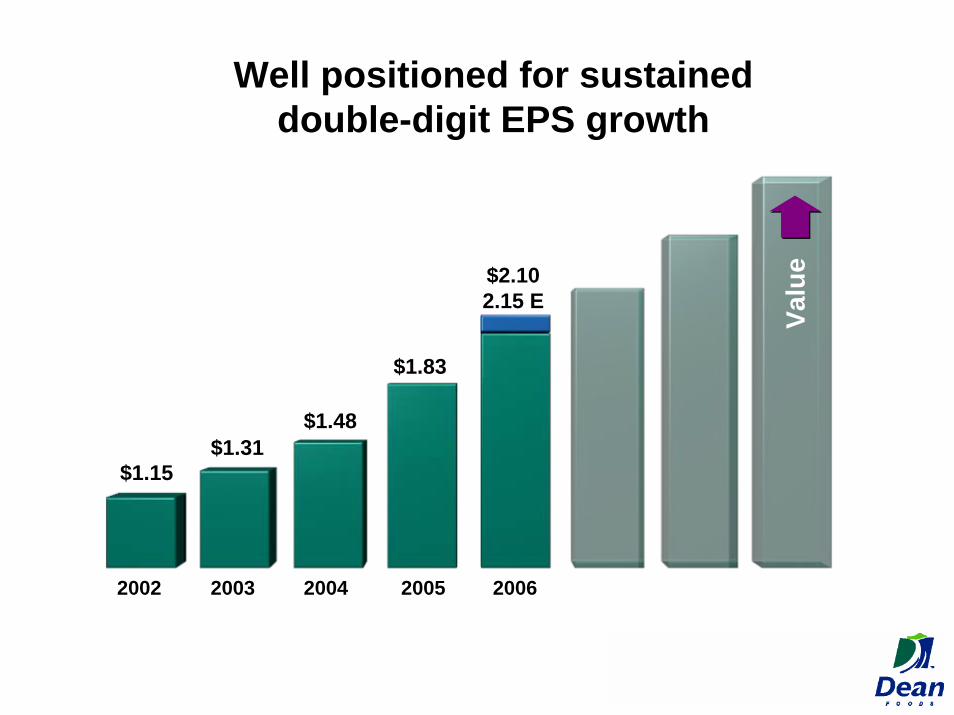
Well positioned for sustaineddouble-digit EPS growth
$1.15$1.31
$1.48
$1.83
$2.102.15 E
2002 2003 2004 2005 2006
Valu
e
Dean Foods Company
Prudential Equity Group’s15th Annual
Back-To-SchoolConsumer Conference
September 7, 2006

Reconciliation of Diluted to Adjusted EPS
March 31, June 30, Sept. 30, Dec. 31, March 31, June 30,2002 2003 2004 2005 2005 2005 2005 2005 2006 2006
Diluted EPS from continuing operations (GAAP): 1.08$ 1.53$ 1.28$ 1.67$ 0.32$ 0.47$ 0.40$ 0.48$ 0.38$ 0.53$
Facility closing and reorganization costs 0.07 0.04 0.09 0.15 0.03 0.01 0.07 0.04 0.02 0.02
Settlement of tax matter (0.04) - - - - - - - - -
Losses on investment in affiliate 0.04 - - - - - - - - -
Gain on sale of frozen pre-whip topping business - (0.25) - - - - - - - -
Gain on litigation settlement - - (0.02) - - - - - - -
Write-off of deferred financing costs - - 0.13 - - - - - - -
Other non-recurring charges - (0.01) - 0.01 0.01 - - - - -
Diluted EPS from continuing operations (Adjusted) 1.15$ 1.31$ 1.48$ 1.83$ 0.36$ 0.48$ 0.47$ 0.52$ 0.40$ 0.55$
Three Months EndedFiscal Year Ended December 31,