devoxx pl: is your profiler speaking the same language as you?
TRANSCRIPT

Is your profiler speaking the same language as you?
Simon Maple @sjmaple

@sjmapleSimon Maple -

Agenda
• Performance Tools • Performance by numbers • Sampling vs Tracing • XRebel
3


Performance Tools
• Java Monitoring Tools
• Java Profilers
• Java Testing Tools
5

Performance report
6

RebelLabs reports
7

Who are you?
8

Your Application
9

When do you test?
10

Tools
11

Finding bugs Exist
12

Symptoms
13

Root Causes
14
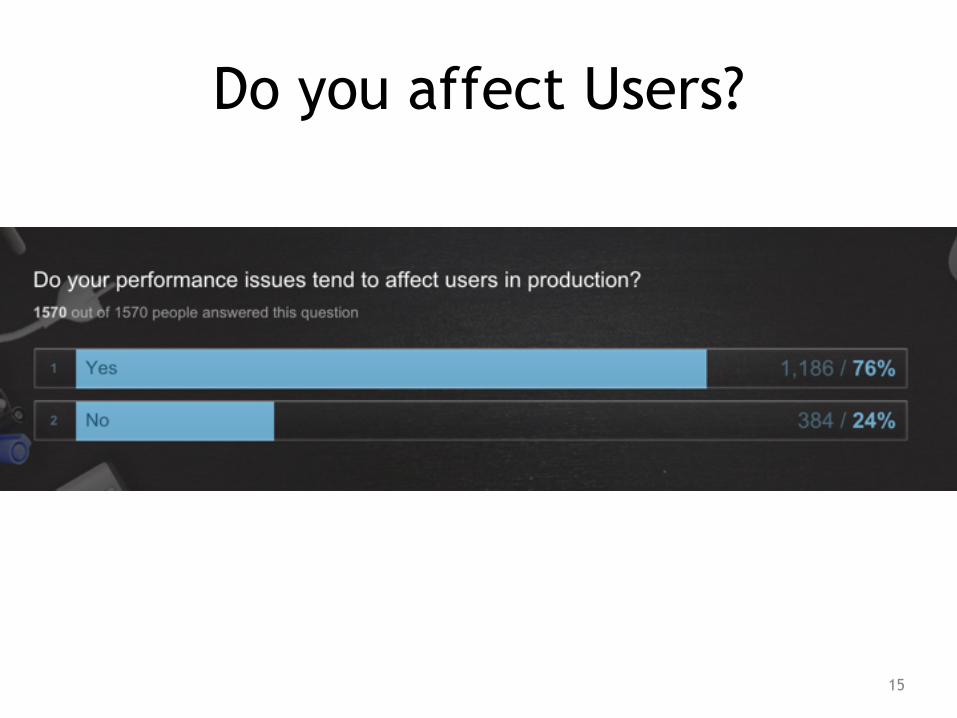
Do you affect Users?
15

Who are the heroes?
16

Profiling Frequency
17

How long is your app release cycle?
18

How much time do you spend testing?
19

Did it work?
20

The Journey of Performance
21

https://twitter.com/shipilev/status/578193813946134529

A
BC
D E
Performance
Code complexity

Improving
OptimizingLast 5% Last 1%
A
BC
D E

Profiling
CPU
Tracing Sampling
Memory
Usage Allocation
We are only talking about this part today

JVM has ability to produce thread dump:Press Ctrl+Break on Windows
kill -3 PID on *nix
"http-nio-8080-exec-1" #40 daemon prio=5 os_prio=31 tid=0x00007fd7057ed800 nid=0x7313 runnable java.lang.Thread.State: RUNNABLE at o.s.s.p.w.OwnerController.processFindForm(OwnerController.java:89) at s.r.NativeMethodAccessorImpl.invoke0(Native Method) at s.r.NativeMethodAccessorImpl.invoke(NativeMethodAccessorImpl.java:62) at s.r.DelegatingMethodAccessorImpl.invoke(DelegatingMethodAccessorImpl.java:43) at j.l.r.Method.invoke(Method.java:497)
What is a sample?

Sampling interval : 20 ms
Sample count: 4

Sampling interval : 1 ms
Sample count: 100+

Sampling
main()foo()bar()baz()
never captured :(

Safepoint bias
Safepoints
main()foo()bar()baz()

Safepoint bias
Safepoints
main()foo()bar()baz()

Taming safepoint bias
Java Mission ControlProprietary protocolJava 7u40
Honest Profiler
https://github.com/RichardWarburton/honest-profiler
AsyncGetCallTraceJVMTI
NB! not documented

java.util is hot? :)

java.util is hot? :)

public void businessMethod() { long start = System.currentTimeMillis(); work(); Profiler.log(System.currentTimeMillis()-‐start); }
Tracing (Instrumentation)

Tracing
public void businessMethod() { long start = System.nanoTime(); work(); Profiler.log(System.nanoTime()-‐start);}

Tracing
public void businessMethod() { Profiler.start(“businessMethod"); try { work(); } finally { Profiler.log("businessMethod"); }}

System.nanoTimeSystem.currentTimeMillisParallel thread updating easily accessible memory location
sleep-wakeup-update
yield-wakeup-update
busy-loop-update

class Profiler { Loop loop; public static void start(String method) { long now = loop.getTime(); … }

public class Loop implements Runnable { private volatile long time; public void run() { while (running) { time = System.nanoTime(); sleep(); } }
public final long getTime() { return time; }
Busy Loop

Nano seconds put into perspective
Reading memory is not free. It takes cycles = nanoseconds
Each (software) layer is not free. JVM, JNI, OS, HW
http://shipilev.net/blog/2014/nanotrusting-nanotime/
Nanotrusting the NanoTime

Nano seconds put into perspective
http://shipilev.net/blog/2014/nanotrusting-nanotime/
Nanotrusting the NanoTime
granularity_nanotime: 26.300 +- 0.205 ns latency_nanotime: 25.542 +- 0.024 ns
granularity_nanotime: 29.322 +- 1.293 ns latency_nanotime: 29.910 +- 1.626 ns
granularity_nanotime: 371,419 +- 1,541 ns latency_nanotime: 14,415 +- 0,389 ns
Linux
Solaris
Windows

Sleep timer: time-slicing & schedulingMinimum sleep times:
Win8: 1.7 ms (1.0 ms using JNI + socket poll)Linux: 0.1 msOS X: 0.05 msVirtualBox + Linux: don’t ask :)Still uses 25-50% of CPU core
Yield?Windows scheduler skips yielded threads in case of CPU starvation

public class Loop implements Runnable { private volatile long time; public void run() { while (running) { time = System.nanoTime(); sleep(); } } private void sleep() { if (!MiscUtil.isWindows()) { Thread.yield(); } }
Busy Loop

public class Loop implements Runnable { private volatile long time; public void run() { while (running) { time = System.nanoTime(); sleep(); } } private void sleep() { if (!MiscUtil.isWindows()) { Thread.yield(); } }
Busy Loop

Busy Looppublic class Loop implements Runnable { private volatile long time; public void run() { while (running) { time = System.nanoTime(); sleep(); } } private void sleep() { if (!MiscUtil.isWindows()) { Thread.yield(); } }

public class Loop implements Runnable { private volatile long time; public void run() { while (running) { time = System.nanoTime(); sleep(); } } private void sleep() { if (!MiscUtil.isWindows()) { Thread.yield(); } }
Busy Loop

main()foo()bar()baz()
Tracing
relatively higher overhead for fast methods :(

Tracing
main()foo()
bar()baz()
234

Tracing
main()foo()
bar()baz()
235
boo()
Balance shift due to tracing overhead


Database accessWeb ServicesRMI
Various application layers3rd-party components
HTTP sessionExceptions
CachesFile system access
View renderingSerializationGC
What other performance considerations should we have?

Questions you should be asking……..……..……..……..

Questions you should be askingWhere was most of the time spent?How many SQL queries were executed?How much time did the external calls take?
What’s my HTTP session state?Is caching working properly?
Is there any excessive work done by the app?

Most improvement gained here!This is where we should focus first!
A
BC
D E
