devops by the numbers - how to approach the measurement and metrics of your continuous delivery...
TRANSCRIPT

DevOps by the Numbers
July 14th, 2016
How to Approach the Measurement & Metrics of Your Continuous Delivery Transformation
2
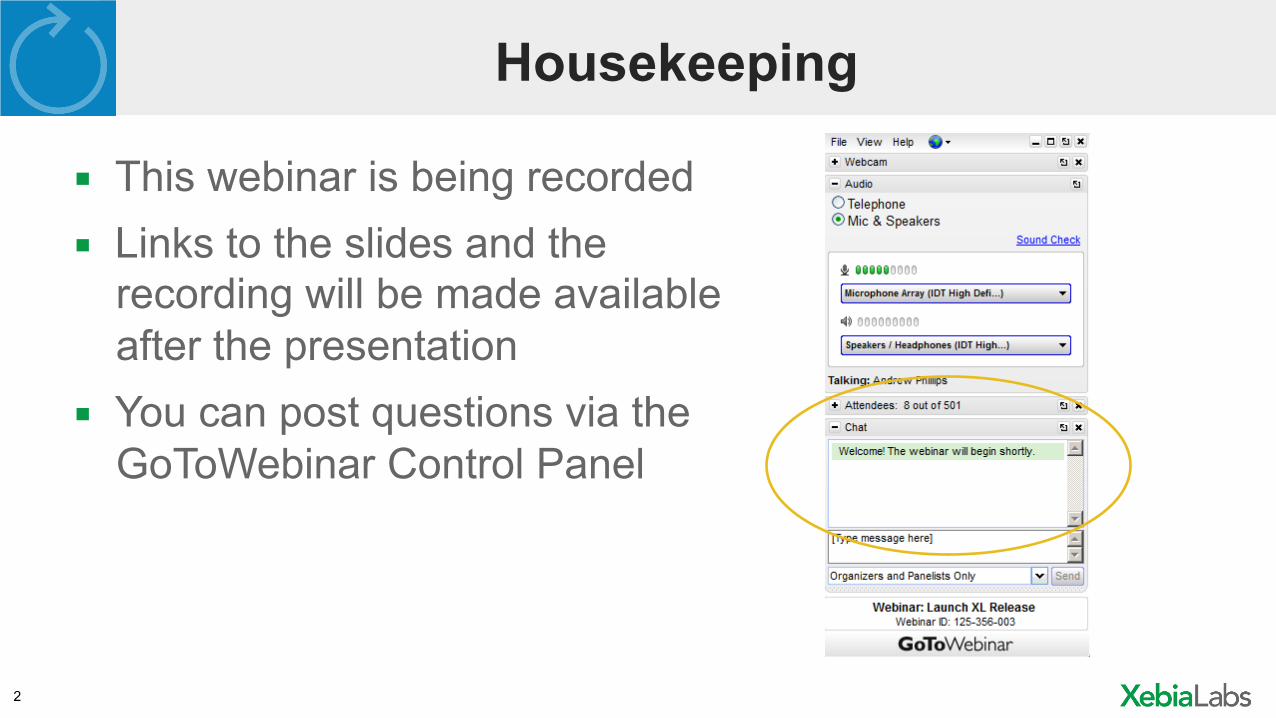
Housekeeping
▪ This webinar is being recorded ▪ Links to the slides and the
recording will be made available after the presentation
▪ You can post questions via the GoToWebinar Control Panel
3
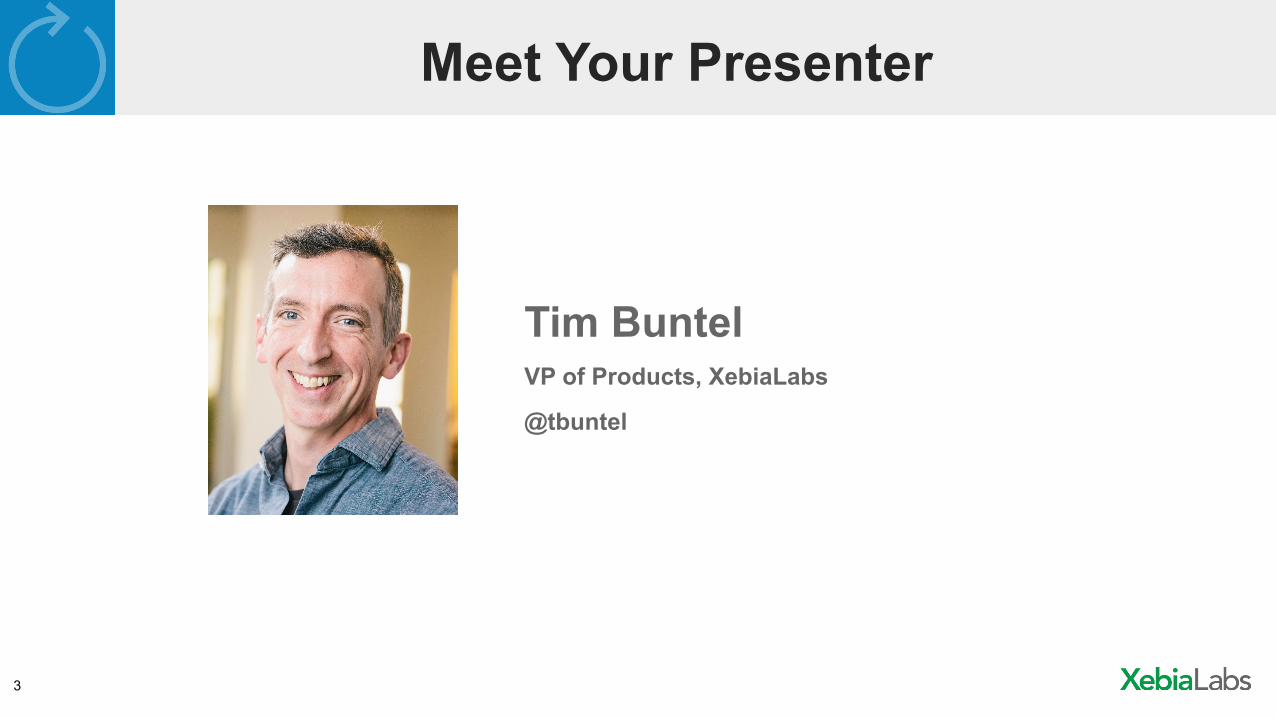
Meet Your Presenter
Tim Buntel VP of Products, XebiaLabs
@tbuntel
4
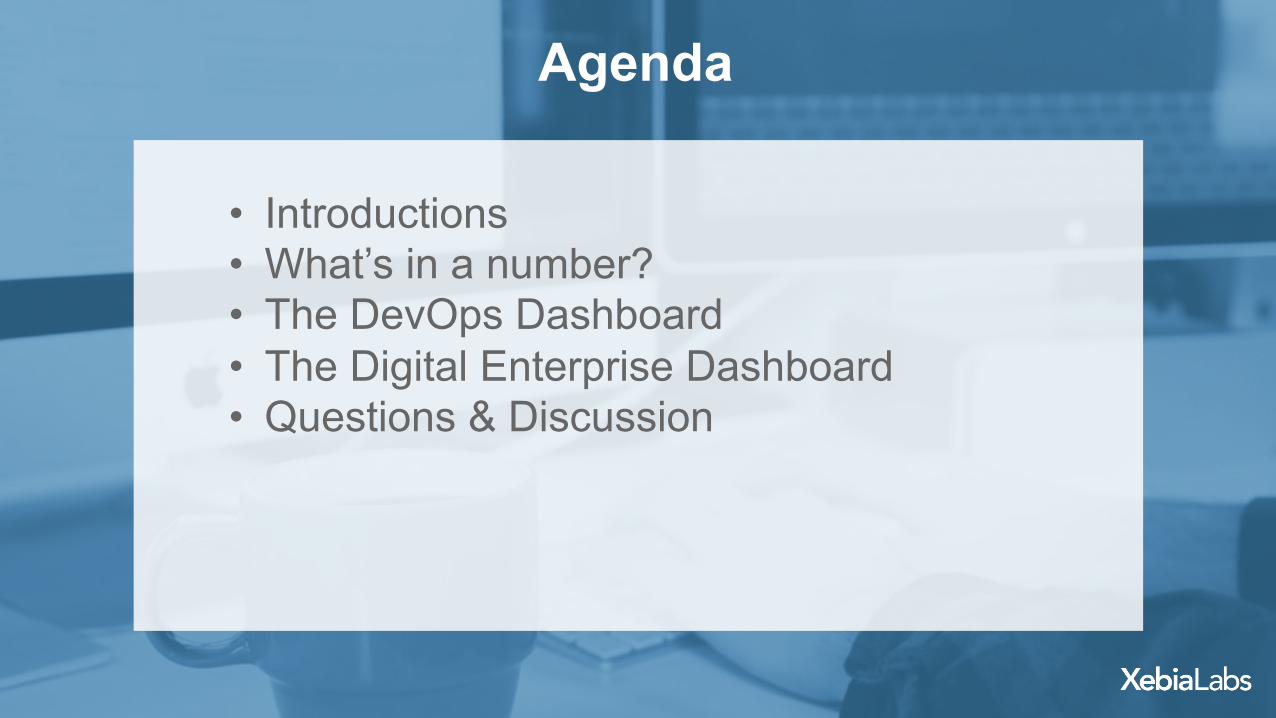
Agenda
4
• Introductions • What’s in a number? • The DevOps Dashboard • The Digital Enterprise Dashboard • Questions & Discussion
5
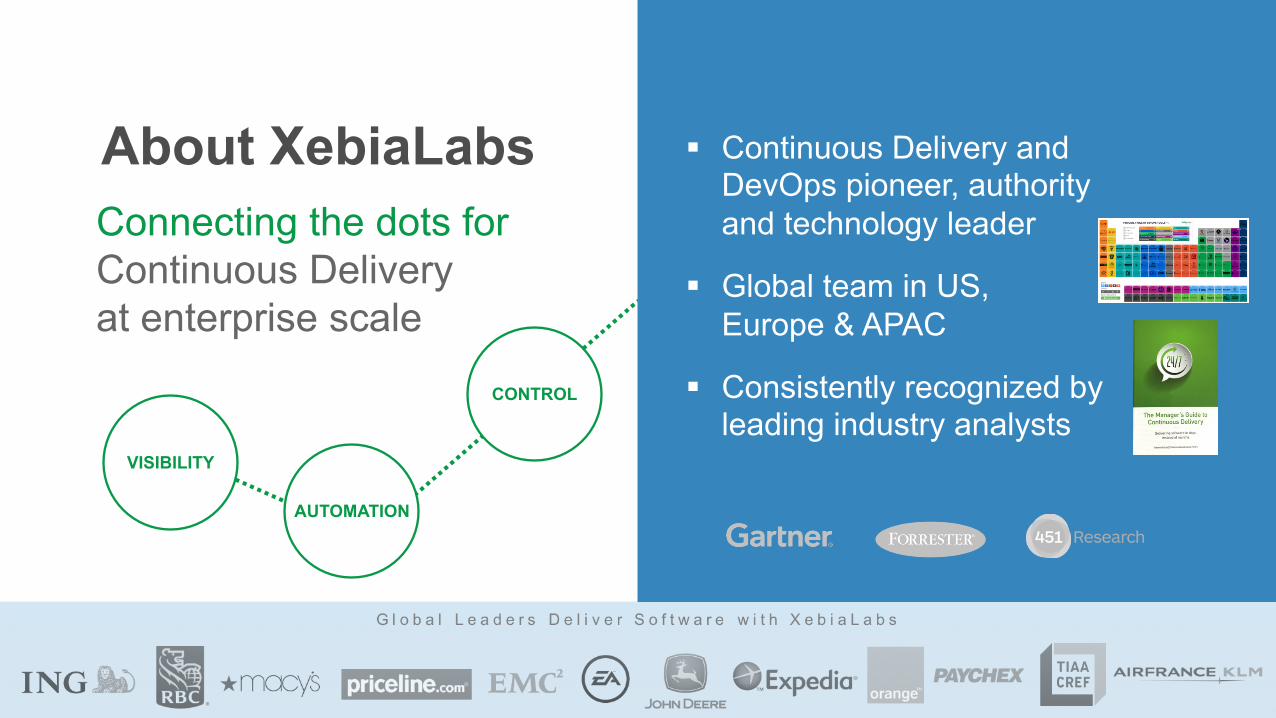
§ Continuous Delivery and DevOps pioneer, authority and technology leader
§ Global team in US, Europe & APAC
§ Consistently recognized by leading industry analysts
Connecting the dots for Continuous Delivery at enterprise scale
About XebiaLabs
VISIBILITY
AUTOMATION
CONTROL

Quick Poll #1 How would you describe your organization’s DevOps program today?
The Big Picture
What’s there to measure?
DevOps = Culture
9
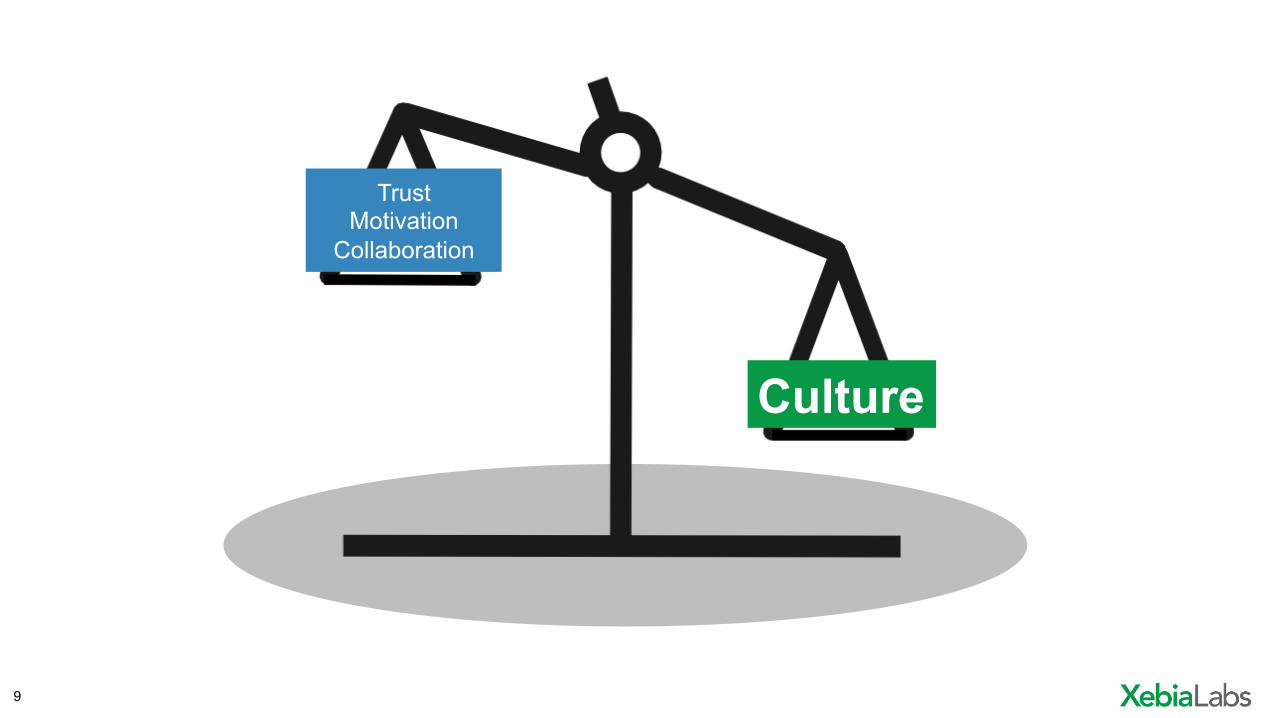
Culture
Trust Motivation
Collaboration

10
CD leads to Business Results • 1,000 developers • 100 Agile Coaches = $2M/year • New tools = $1M/year • New workspaces = $1M • Reorganization = $$$
$4-$5M!
11
25% better!

12
Focus on bringing down cycle time; the rest will naturally follow of its
own accord.

13
14
He uses statistics the way a drunk uses a lamp-post… for support, not illumination.
QuickPoll#2Do you currently publish metrics about your DevOps process?
16
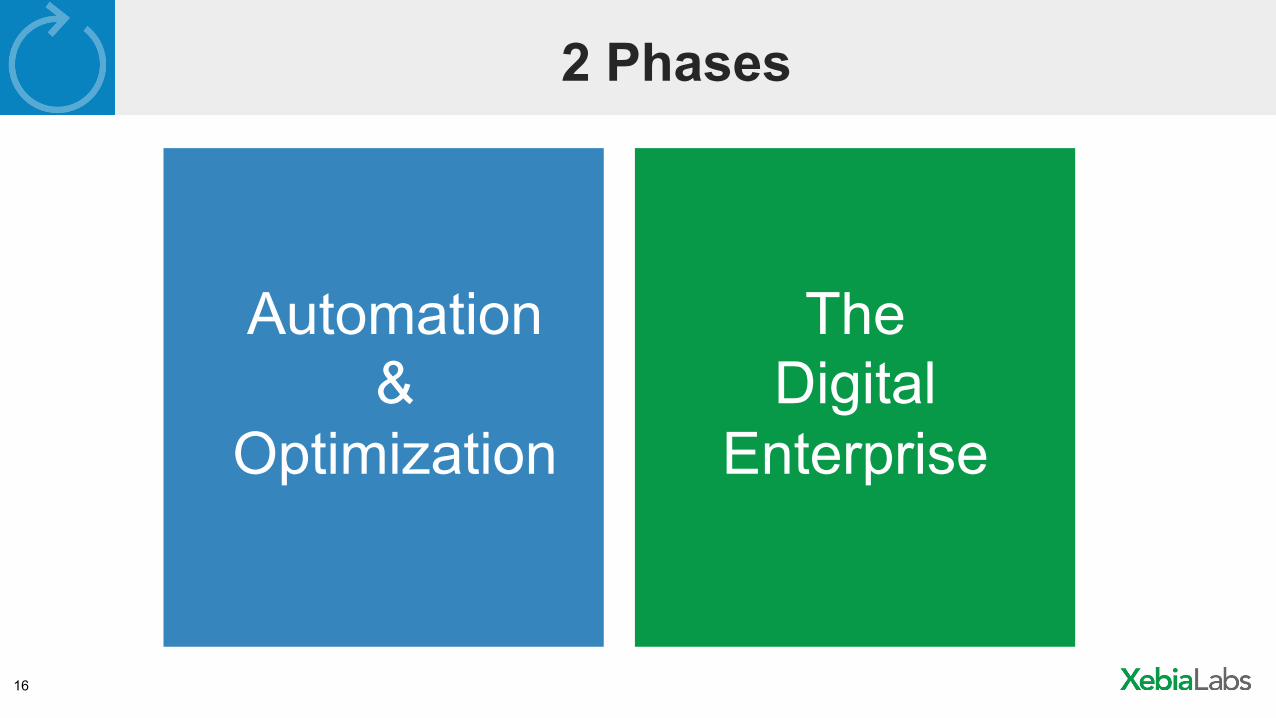
2 Phases
Automation &
Optimization
The Digital
Enterprise
17
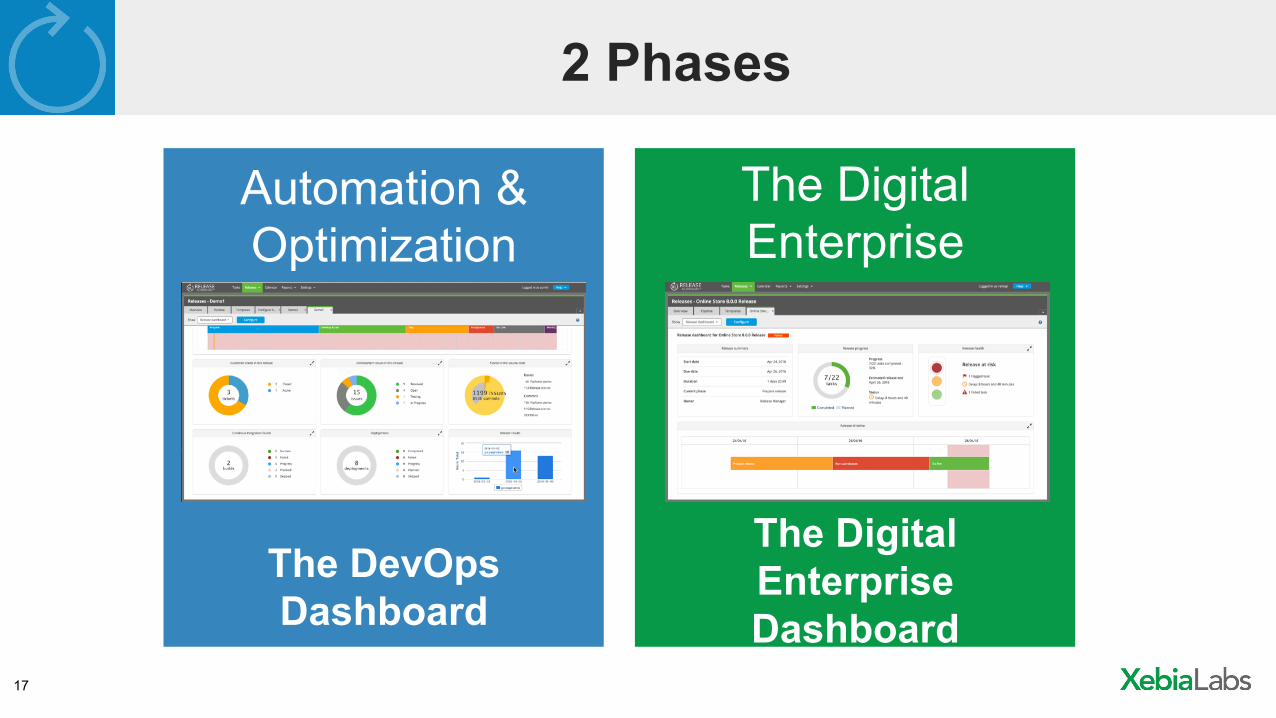
2 Phases
Automation & Optimization
The Digital Enterprise
The DevOps Dashboard
TheDevOpsDashboard
The Digital Enterprise Dashboard
The DevOps Dashboard • Time • Frequency • Change volume • Success Rate • MTTR
19
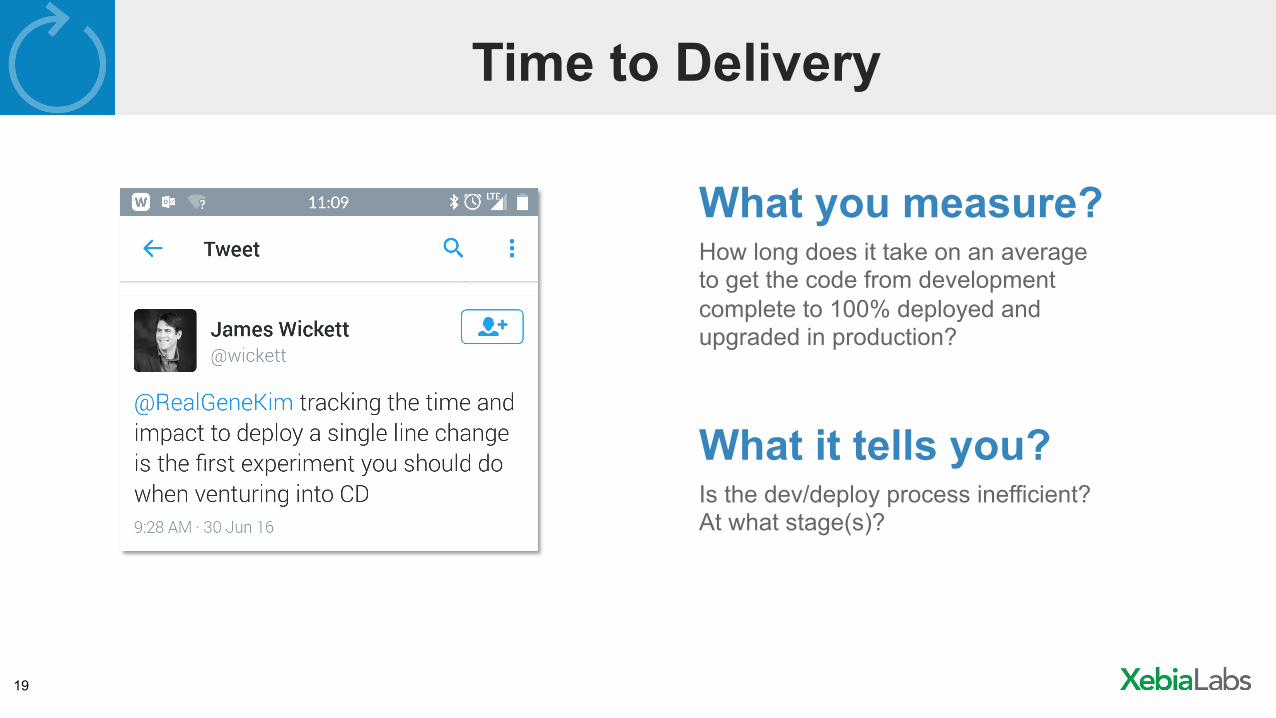
Time to Delivery
How long does it take on an average to get the code from development complete to 100% deployed and upgraded in production?
What you measure?
Is the dev/deploy process inefficient? At what stage(s)?
What it tells you?
20
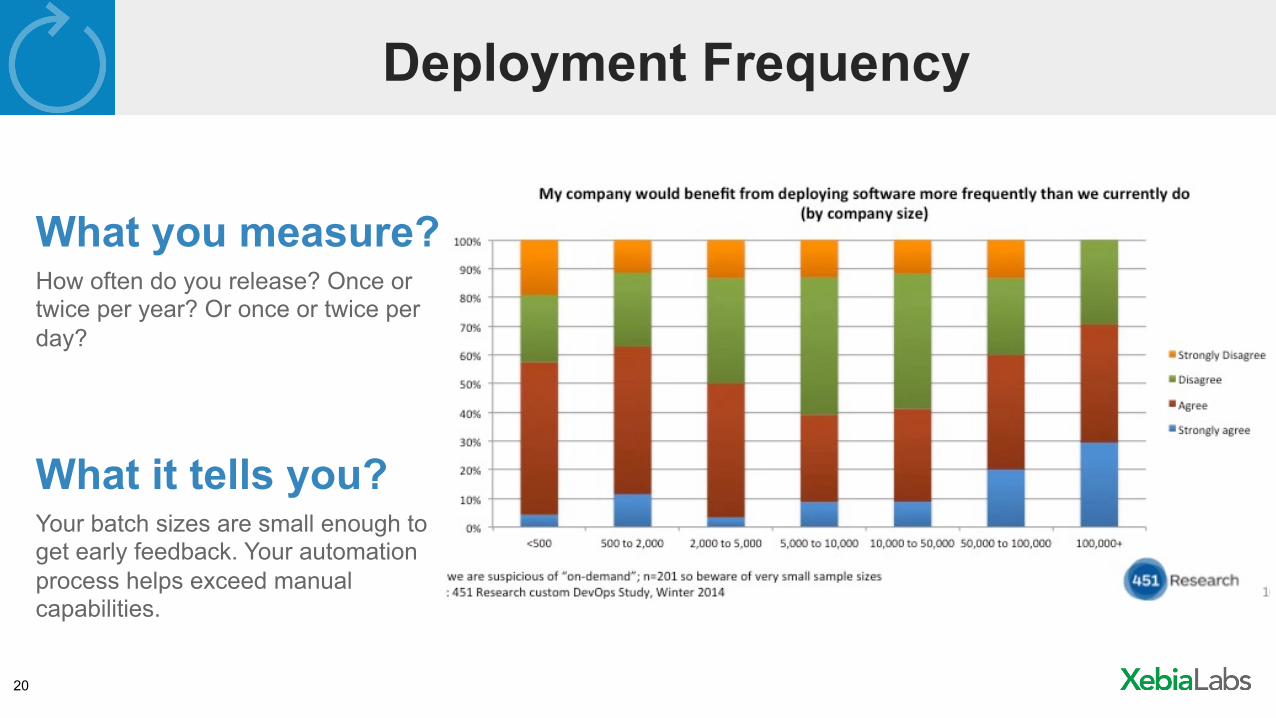
Deployment Frequency
How often do you release? Once or twice per year? Or once or twice per day?
What you measure?
Your batch sizes are small enough to get early feedback. Your automation process helps exceed manual capabilities.
What it tells you?
21
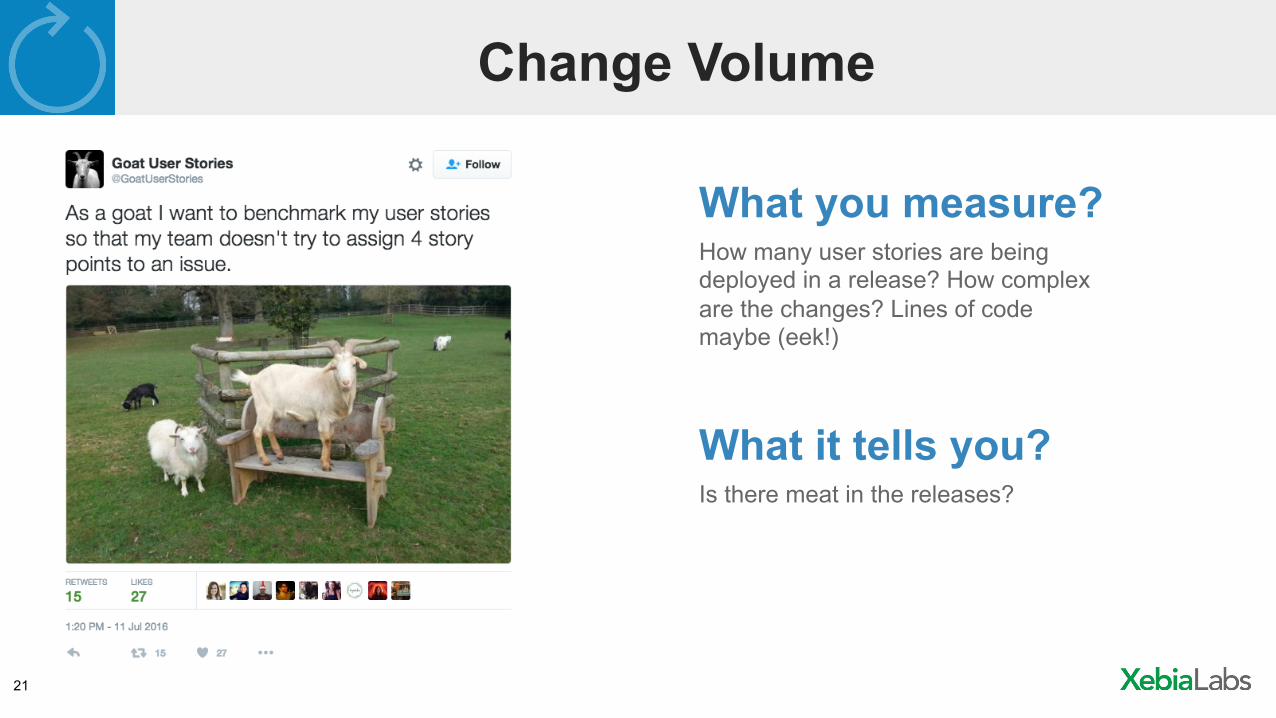
Change Volume
How many user stories are being deployed in a release? How complex are the changes? Lines of code maybe (eek!)
What you measure?
Is there meat in the releases?
What it tells you?
22
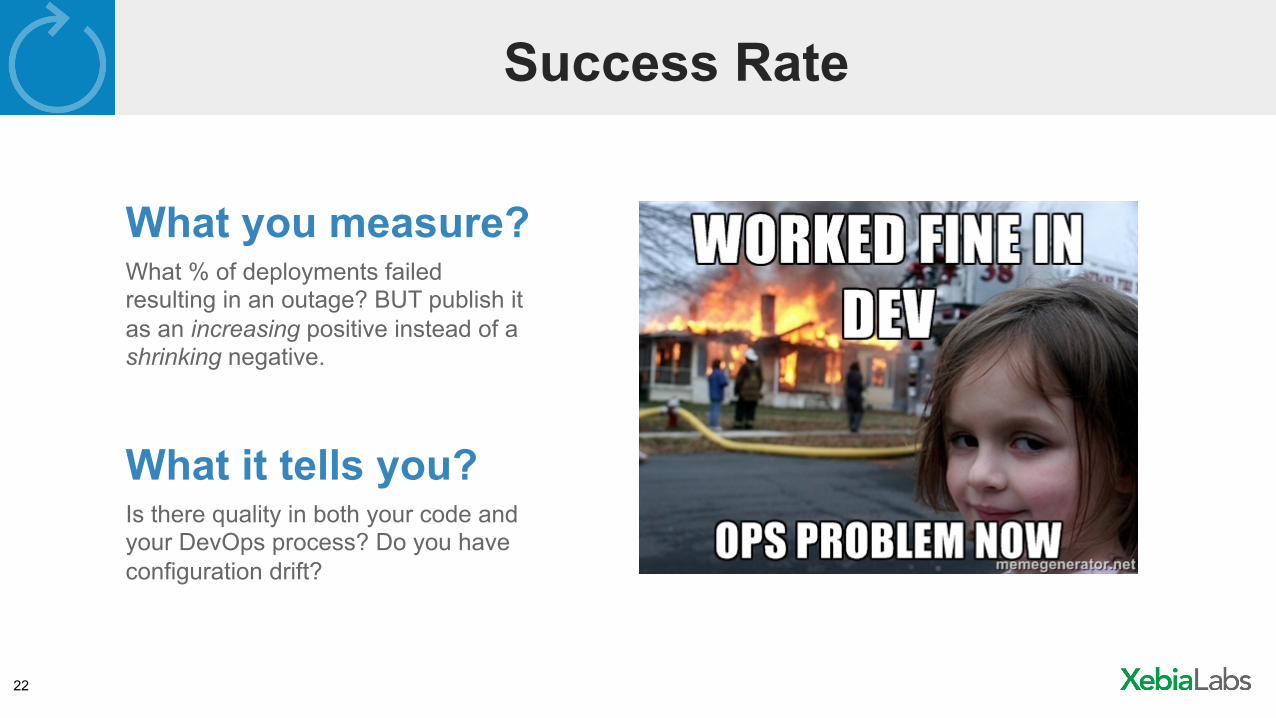
Success Rate
What % of deployments failed resulting in an outage? BUT publish it as an increasing positive instead of a shrinking negative.
What you measure?
Is there quality in both your code and your DevOps process? Do you have configuration drift?
What it tells you?
23
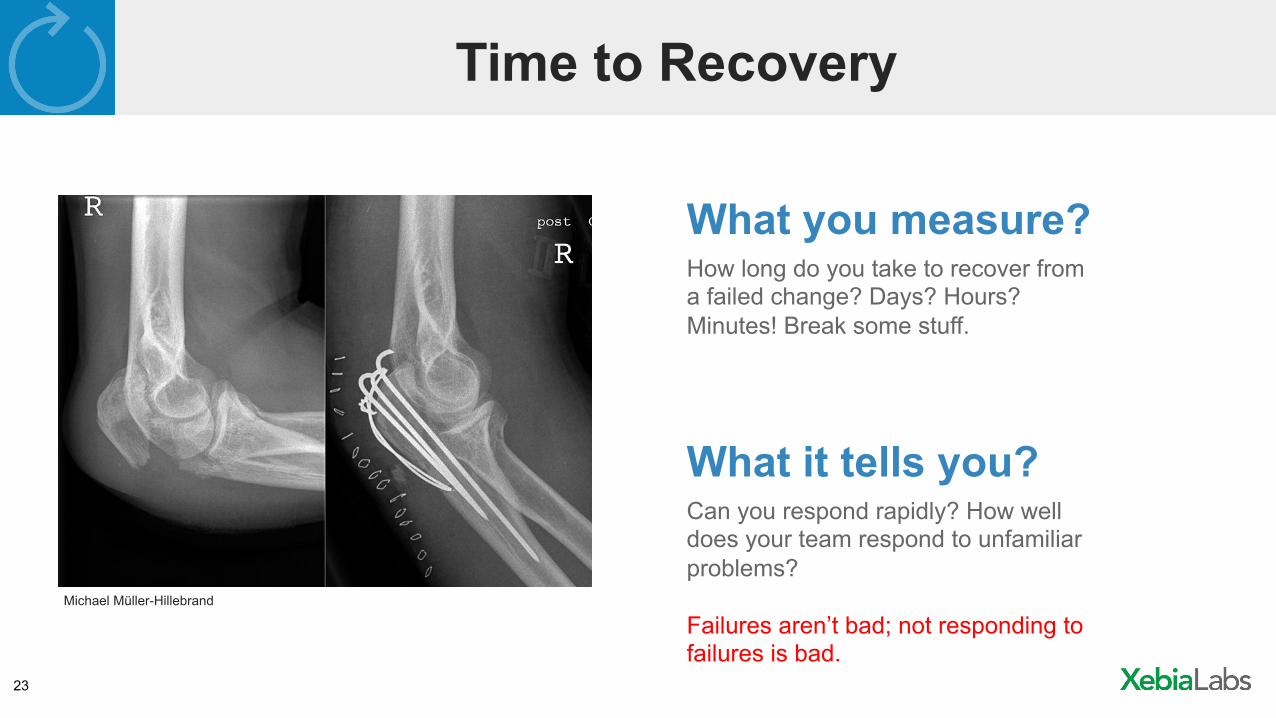
Time to Recovery
Michael Müller-Hillebrand
How long do you take to recover from a failed change? Days? Hours? Minutes! Break some stuff.
What you measure?
Can you respond rapidly? How well does your team respond to unfamiliar problems? Failures aren’t bad; not responding to failures is bad.
What it tells you?
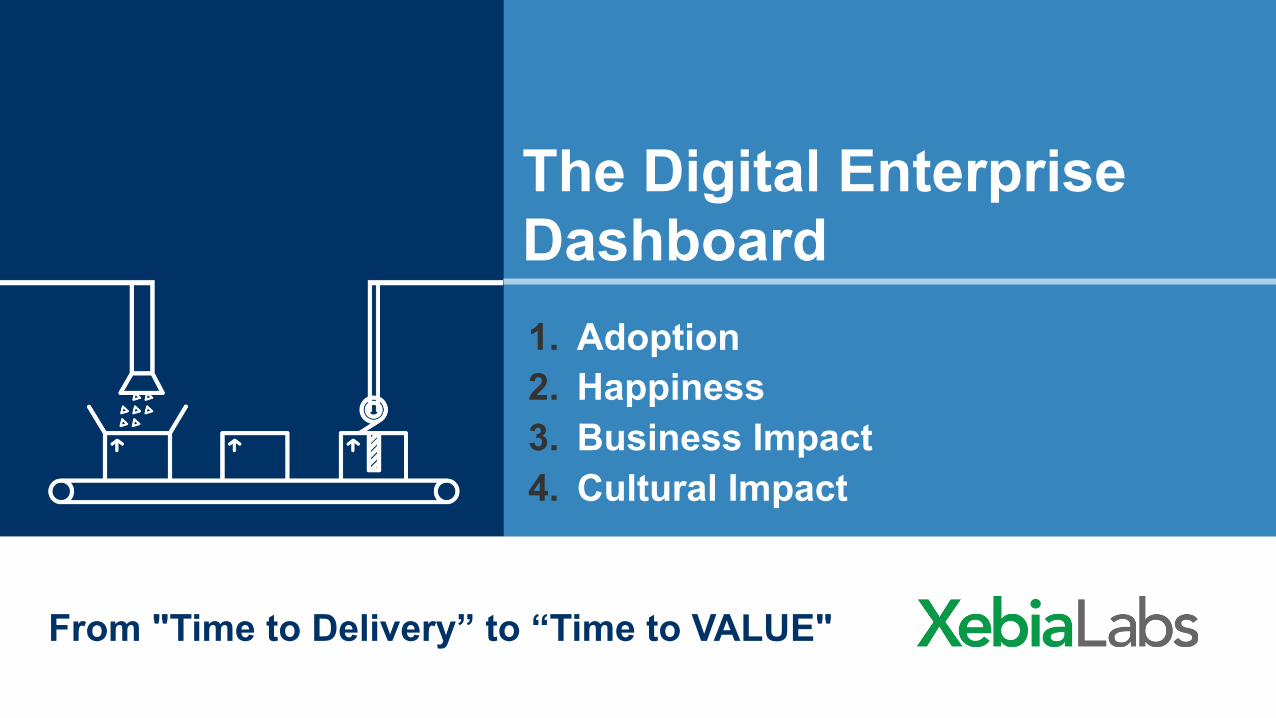
The Digital Enterprise Dashboard 1. Adoption 2. Happiness 3. Business Impact 4. Cultural Impact
From "Time to Delivery” to “Time to VALUE"

25
Sobering Statistics
Of all ideas…
No impact on desired outcomes
Actually make outcomes worse
Improve outcomes!
Two-thirds of what gets built is waste!
1/3 1/3
1/3
26
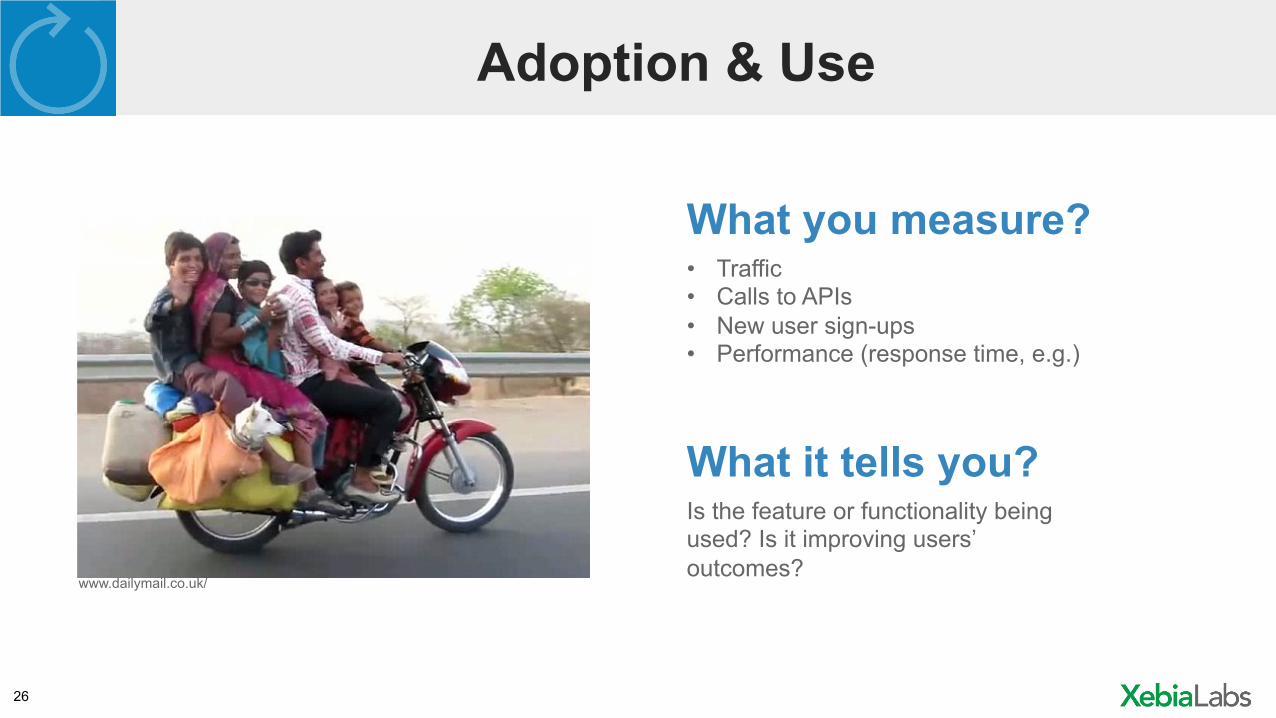
Adoption & Use
• Traffic • Calls to APIs • New user sign-ups • Performance (response time, e.g.)
What you measure?
Is the feature or functionality being used? Is it improving users’ outcomes?
What it tells you?
www.dailymail.co.uk/
27
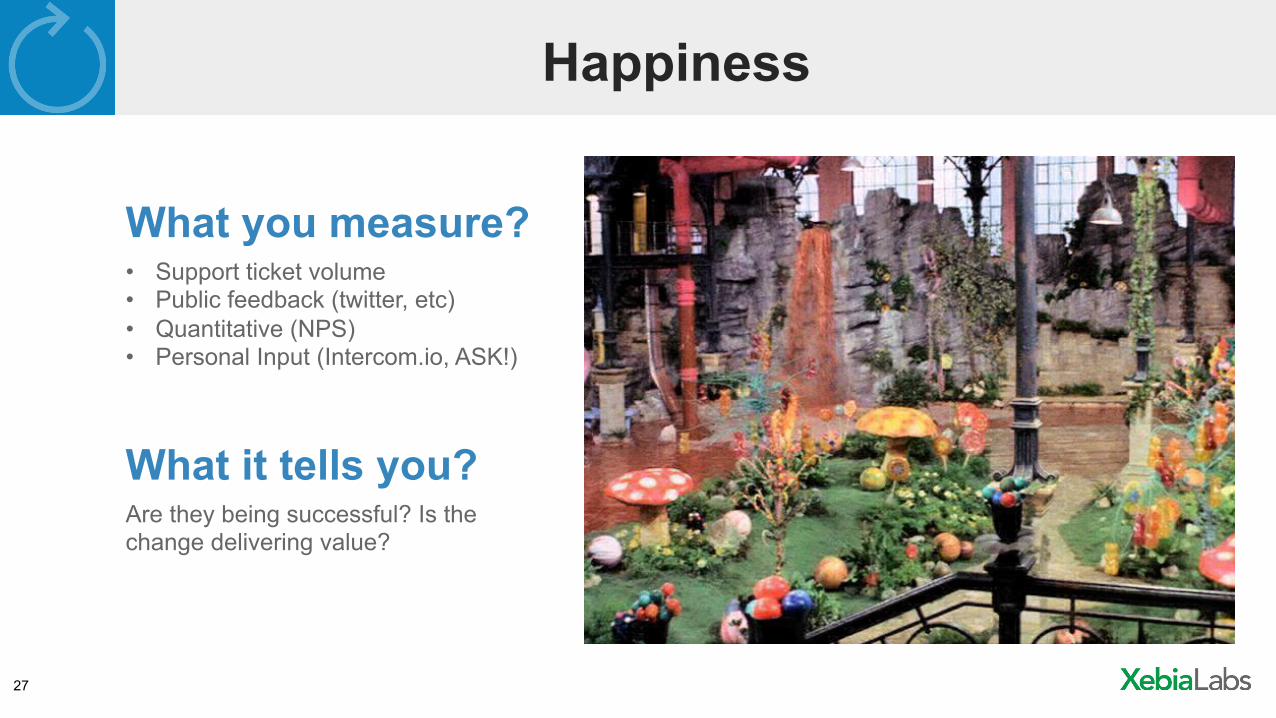
Happiness
• Support ticket volume • Public feedback (twitter, etc) • Quantitative (NPS) • Personal Input (Intercom.io, ASK!)
What you measure?
Are they being successful? Is the change delivering value?
What it tells you?
28
Business Impact
• Trial conversions • Churn • Press/Analysts response • KPIs
What you measure?
Software is your business (even when your business isn’t software)
What it tells you?
29
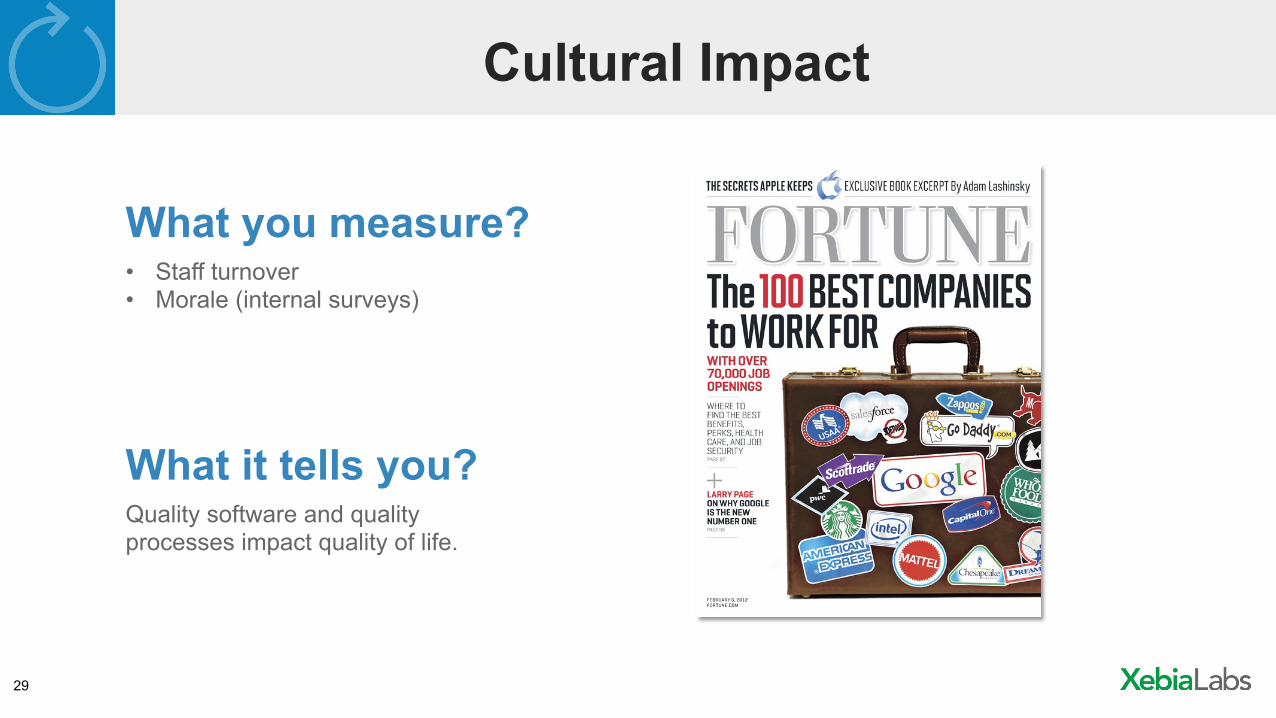
Cultural Impact
• Staff turnover • Morale (internal surveys)
What you measure?
Quality software and quality processes impact quality of life.
What it tells you?
How XebiaLabs Can Help

31
Visibility and control across the Software Delivery Process
Integrates the tools you already have without customization
Fortune 100 proven, enterprise-grade technology
Scalable and fast to adopt
XebiaLabs: Proven Software Solutions for Continuous Delivery at Enterprise Scale
“IT organizations that have
tried to custom adjust current
tools to meet DevOps practices
have a failure rate of 80%”
V I S I B I L I T Y
AUTOMATION
CONTROL
1
2
3
4
32
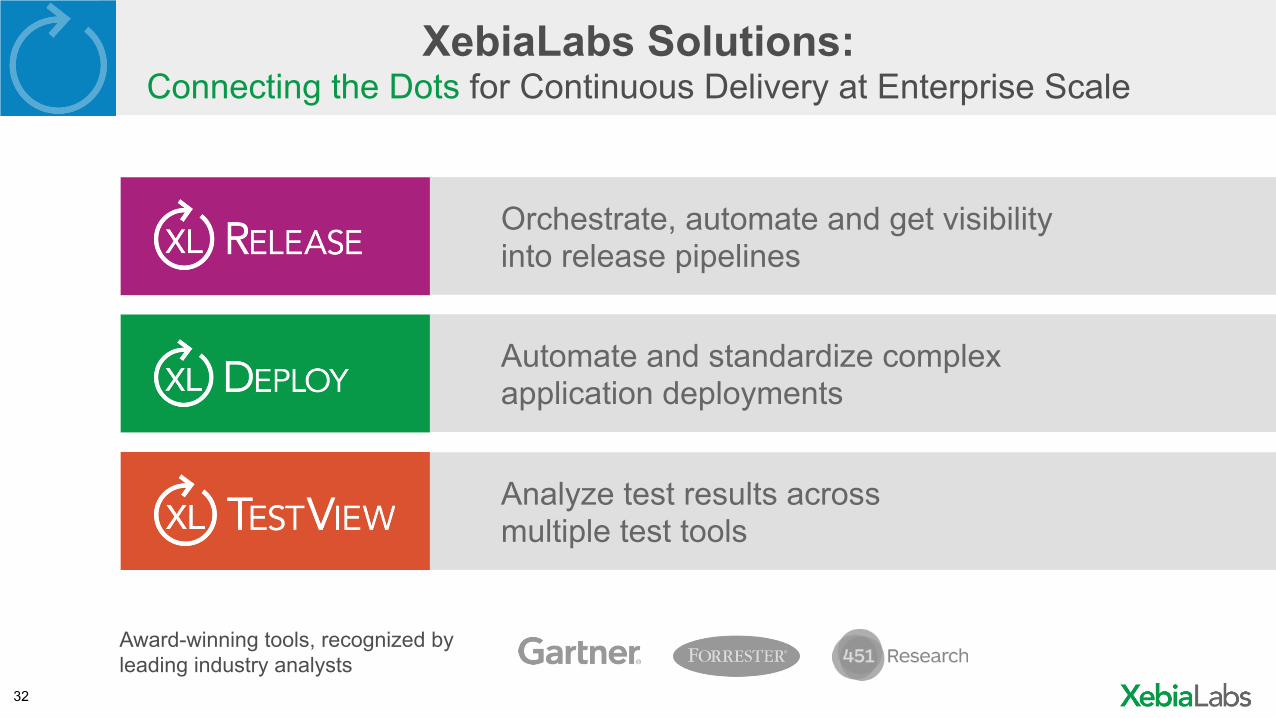
Award-winning tools, recognized by leading industry analysts
Orchestrate, automate and get visibility into release pipelines
Automate and standardize complex application deployments
Analyze test results across multiple test tools
XebiaLabs Solutions: Connecting the Dots for Continuous Delivery at Enterprise Scale
33
Other Great Resources
▪ Get Started with XebiaLabs for Free Today! www.xebialabs.com/products
▪ Download The IT Manager’s Guide to Continuous Delivery xebialabs.com/resources/whitepapers/the-it-managers-guide-to-continuous-delivery/
blog.xebialabs.com
@xebialabs
youtube.com/xebialabs
34
Questions? Opinions?
VISIBILITY
AUTOMATION
CONTROL
Thank you!