developme~nt>,,ofki'imehd to mnitr oldaivfan maillard
TRANSCRIPT

* DEVELOPME~NT>,,OFki'IMEHD
TO MNITR OLDAIVFAN MAILLARD('SUGA R AMIN'E)" POYMERIAINI
ENEGY*ENS,:ENCAPSUAE MODELrNRAIQ SSTEMS LTE
N IO BY '7'
WItHAM L.. PORTERlA ARY) . ID3LACJK%o -OUNQ-G4KYUNOF"IM
- - LAND4 OKE
SEPTEMBS'PR 196.tRINAL 9tORT -
OCTW1E1 1984{)CTOBtiR 1985 ~ LCETLP
2 ~ ~ ~ ~ ~ ~ P 2MPfl~O t'L3 198TD ?
~X,. M~SSAAl
_ ~ sYYCX2 ~F'QIi4~sM95
BestAvai~lable
copy

e'~ fi~dings , Co nta na d his -reot
a ;,e to t -to be .o n st r u ed a$ an o~f fito La-
D'epar tmenTt &f 't he Armfy. po-s~it'of t.n1,,es's,
i o' ddgi &nated' by ot1h0-'r''authorize~d
documents.. -
Citation o~f trade names in tnis rceport
does not constitute an o'ficial endorse-
II
meit or appr oval of th~e -Ue -of such itemso
DESTRUCTION NOTICE
For classified documents, followr the procedures in DoD
5200.1-R, Chapter X or DoD 5220.22-U, "Indutrial Security
Manual," paragraph 19. For unclassified documents, destroy
by any method which precludes reconstruction of the document.

UNCLASSIFIEDSECURITY CLASSIFICATION OF THIS PAGE , ,
Form ApprovedREPORT DOCUMENTATION PAGE OMB No 0704-0188
__Exp Date Jun30, 1986la REPORT SECURITY CLASSIFICATION lb RESTRICTIVE MARKINGS
UNCLASSIFIED
2a SECURITY CLASSIFICATION AUTHORITY 3. DISTRIBUTION/AVAILABILITY OF REPORTApproved for public release:
2b DECLASSIFICATION/DOWNGRADING SCHEDULE Di stri but ion Unlimited
4 PERFORMING ORGANIZATION REPORT NUMBER(S) S. MONITORING ORGANIZATION REPORT NUMBER(S)NATICK/TR-86/063
6a NAME OF PERFORMING ORGANIZATION r6b. OFFICE SYMBOL 7a. NAME OF MONITORING ORGANIZATIONSATD (if applicable)
U.S. Army Natick RD&E Center STRNC-YMB
6c. ADDRESS (City, State, and ZIP Code) 7b. ADDRESS (City, State, and ZIP Code)Kansas StreetNatick, MA 01760-5020
ga. NAME OF FUNDING/SPONSORING Bb. OFFICE SYMBOL 9. PROCUREMENT INSTRUMENT IDENTIFICATION NUMBERORGANIZATION (If applicable)
8c. ADDRESS (City, State, and ZIP CoJe) 10. SOURCE OF FUNDING NUMBERSPROGRAM PROJECT TASK WORK UNITELEMENT NO. NO. NO. ACCESSION NO
6.1 IL161102 AH52 03020
11. TITLE (Include Security Classification) Development of Rapid Methods to Monitor Oxidative and Maillard(S igar-Amine) Polymerization in Energy-Dense, Encapsulated Model Ration Systems
12 PERSONAL AUTHOR(S) I
PORTER, W. L., E. D. Black, Y.-K. Kim, L. Hoke
13a. TYPE OF REPORT 13b. TIME COVERED 114. DATE OF REPORT (Year, Month, Day) S PAGE COUNTFinal FROM Oct 84 TO Oct 851 September 1986 49
16, SUPPLEMENTARY NOTATION
17 COSATI CODES 18. SUBJECT TERMS (Continue on reverse if necessary and identify by block number)FIELD GROUP SUB-GROUP POLYMERIZATION OXIDATION SPECTROPHOTOMETRY
LIPID OXIDATION MAILLARD BROWNING FLUORESCENCE
LIPIDS " TBSORPTION SPECTRA k ENCAPSULATION19. ABSTRACT (Continue on reverse if necessary and identify by block numbervEnergy-denEe model systems cont ai ni nglactose as carbohydrate, casein as protein, and soy-lecithin encapsulated corn oil as lipidhave been monitored during storage at high temperatures for polymerization by means ofchemical and spectrophotometric methods, including both absorption and fluorescence. Theobjective was to develop rapid, labor-saving methods applicable to both soluble and heavilycross-linked, insoluble components of the model systems. Systems developed to monitorMaillard browning include front-face fluorescence of acid-precipitated casein slurries,fluorescence and 410 nm absorption of the aqueous phase after pronase digestion and lowintensity fluorescence of the chloroform-methanol extract of browned material. Lipid oxida-tion methods developed include vapor phase detection by means of polyamide plate fluorescencein presence of oxidizing lipid, front-face fluorescence, and high iptensity fluorescence ofthe chloroform-methanol extract. The chloroform-methanol and front-face fluorescence methodsin both lipid oxidation and Maillard browning and the polyamide me 'hod in lipid oxidation arcrelatively free from interference arising from common food compone ts. They are potentiallywidely apn licable and susceDtible to stmiautomation. Y 1Tha'.e4'i o.....
20 DISTRIBUTION/AVAILABILITY OF ABSTRACT 21 kBSTRACT SECURITY CLASSIFICATIONI UNCLASSIFIEDIUNLIMITED 0 SAME AS RPT 0 D:IC USERS UNCLASSIFIED
22a. NAME OF RESPONSIBLE INDIVIDUAL 22b TELEPH'NE (Include Area Code) 22c OFFICE SYMBOLPORTER, William L. (617)651-4310 STRNC-YMB
DD FORM 1473,84 MAR 83 APR edition may be .,ed until exhausted SECURITY CLASSIFICATION OF THIS PAGEAll other editions ire obsolete UNCLASSIFIEDUNLSSFE

PREFACE
The work reported here was performed under Project No.
ILl61102AH5203020, Degradative Mechanisms in Dry, Moist and Fluid High
Density Ration Components, Shelf Life Prediction and Extension. William
L. Porter was the Project Officer and Principal Investigator. John
Kapsalis had administrative supervision.
The editorial assistance of Dr. K. A. Narayan, SATD, and Mr. Norman
Harris, FED, is gratefully acknowledged, as is the able assistance of Ms.
Patricia Crawford in preparing and organizing the manuscript for
publication.
The citation of trade names (R)* in this report does not constitute
official cndorsentent or the approval of the use of such items.
Accession ForNTIS GRA&IDTIC TAB 0Unannounced 0Justifieation . .
Vistribution/
Availability Codes QUMJTY
Avail and/orDist Special
' iii
Table of Contents
SECTION PAGE
PREFACE iii
LIST OF ILLUSTRATIONS vi
LIST OF TABLES viii
INTRODUCTION 1
METHODS DEVELOPMNT 4
A. Past Methods 4B. Our Methods 7
1. The Energy-dense, Encapsulated Model Systeat 72. Sugar-Amine Browning 9
a. Enzymatic digest--absorption and 9fluorescence spectrophotometry
b. Chloroforna-ethartol extract 10c. Front-face fluorescence of acid-precipitated 11
casein slurry3. Lipid Oxidation 12
a. Chloroforn-methanol extract 12b. Front-face fluorescence of acid-precipitated 13
casein slurryc. Oxidative polyanide fluorescence (OPF) 13
4. Reflectance Colorimetry 14
RESULTS AND DISCUSSION 15
A. Sugar-Amine Browning 151. Enzymatic digest--absorption and fluorescence 15
spectr ophotonetry2. Chloroform-methanol extract 213. Front-face fluorescence of acid-precipitated 29
casein slurryB. Lipid Oxidation 29
1. Chloroform,-nethanol extract 292. Oxidative polyamide fluorescence 333. Front-face fluorescence of acid-precipitated 35
casein slurry
CONCLUSIONS 35
REFERENCES 41
V

List of Illustrations
PageFigure 1. Sonicated phospholipid vesicles. 3
Figure 2. Quality loss reactions - foods. 5
Figure 3. Maillard browning and cross-linking neasured by_ 16aqueous fluorescence and 420 Nm absorbance. 89-C,Aw 0.5. E.B.-
Figure 4. Maillard browning and cross-linking neasured by_ 17aqueous fluorescence and 420 1Nn, absorbance. 89-C,A 0.5. E.B. Repeat
Figure 5. Maillard browning and cross-linking neasured by 18agueous fluorescence and 420 Nm absorbance. 89 C,
0.5. Y.K.
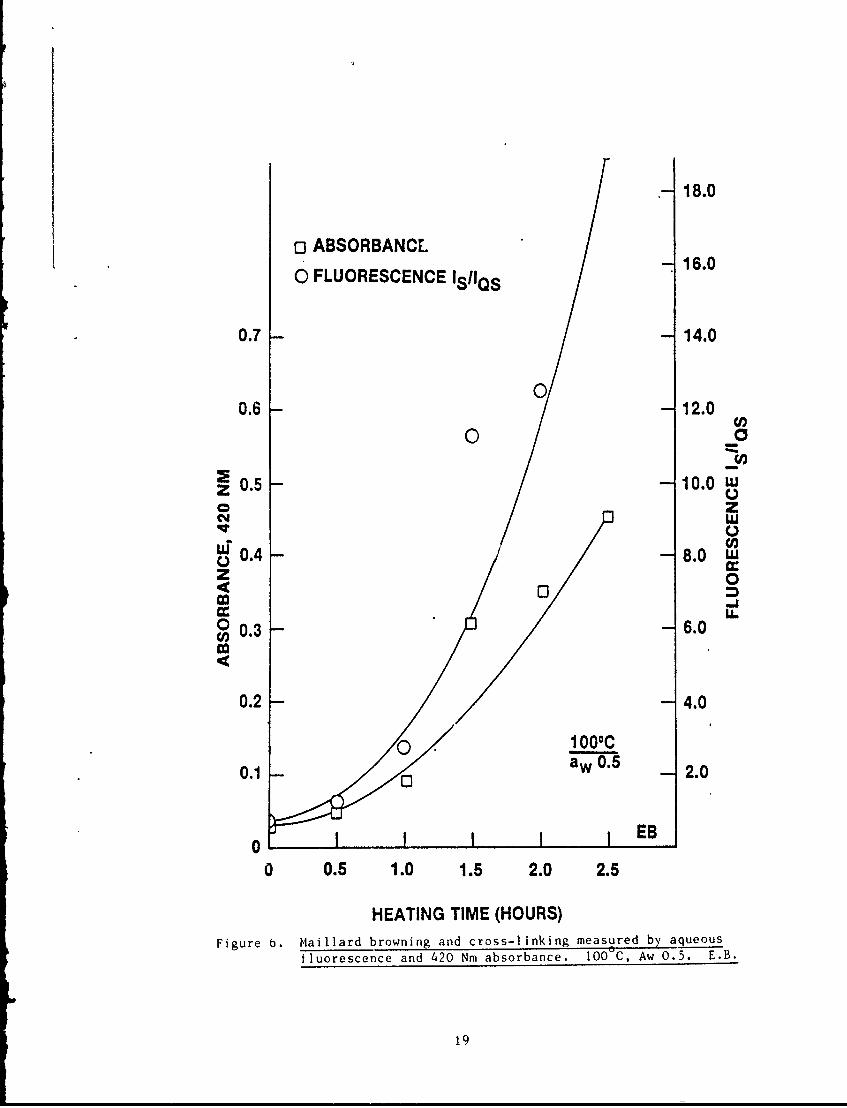
Figure 6. Maillard browning and cross-linking neasured by 19aqueous fluorescence and 420 Nm absorbance. 100C__A.- 0.5. E.B.
Figure 7. Maillard browning and cross-linking neasured by 20aqueous fluorescence and 420 Nm absorbance. 102°C
0.5. Y.K.
Figure 8. Maillard browning and cross-linking by fluorescence of 22chloroform-/iethanol extract. 89-C, A 0.5. E.B.
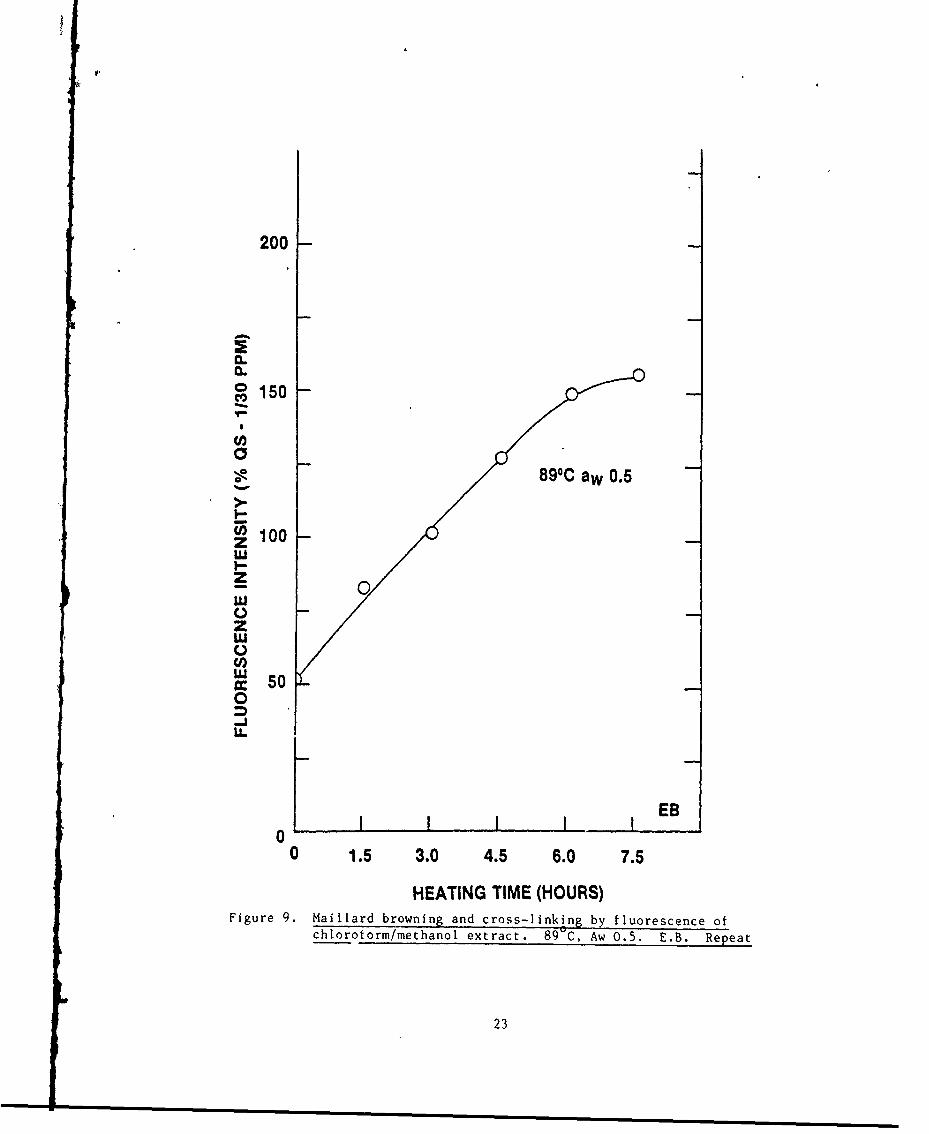
Figure 9. Maillard browning and cross-linklng by fluorescence of 23Chlorofor/rrethanol extract. 89C, A 0.5. E.B.Repeat I
Figure 10. Maillard browning and cross-linking by fluorescence of 24chloroforr/ethanol extract. 89-C, A. 0.5. Y.K.
Figure 11. Maillard browning and cross-linki b fluorescence of 22chloroforni/nethanol extract. 100"C, A, 0.5. E.B.
Figure 12. Maillard browning and cross-linking by fluorescence of 22chlorofornVi/ethanol extract. 003C, A., 0.23. Y.K.
Figure 13. Maillard browning and cross-linking by fluorescence of 22Chloroform/,ethanol extract. 102-C, At, 0.23. Y.K.Repeat
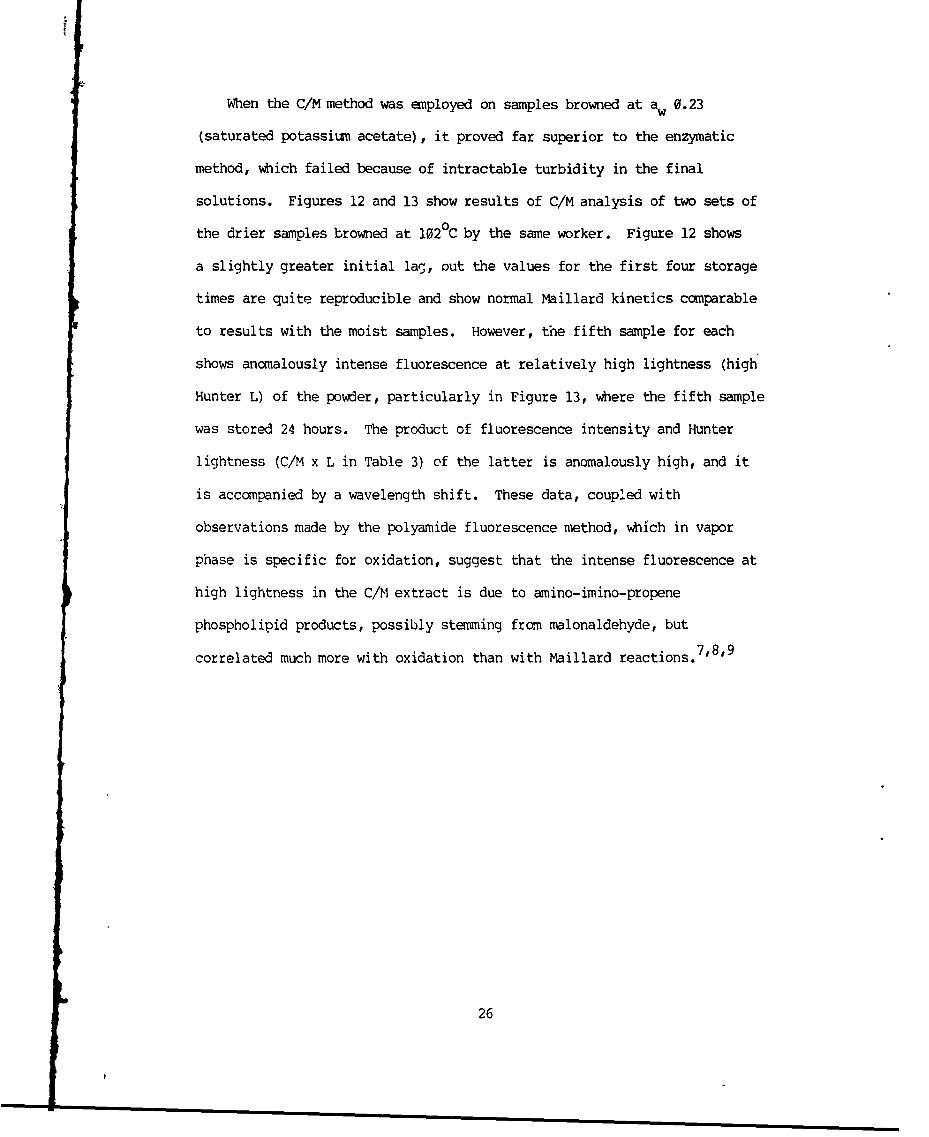
Figure 14. Maillard browning and cross-linking by fluorescence of 22chloroform/nethanol extract. 80-C, A 0.23. Y.K.
linitials of worker, cited to show comparability of results.
vi

List of Illustrations (Continued)Page
Figure 15. Maillard browning and cross-linkig by fluorescence of 31chloroform/methanol extract. 100'C, Awapproximately 1.0 Fluid. L.H.
Figure 16. Development of front-face fluorescence of 32aid-precipitated casein slurry from heated nonfatdry milk aqueous dispersion. NFDM/H20(1/1 weight basis). 100 C.
Figure 17. Polyamide fluorescence over oxidizing encapsulatev. 34energy-dense model system. 100C, Aapproximately 0.0. L.H.
Figure 18. Polyamide fluorescence over oxidizing encapsulated 36energy-dense model system. 100°C, A, 0.23. L.H.
Figure 19. Polyamide fluorescence over oxigizing encapsulated 37energy-dense model system. 100vc, A 0.5. L.H.
Figure 20. Polyamide fluorescence over oxidizing encapsulated 38energy-dense model system. 100'c, A, 0.23 and0.5. L.H.
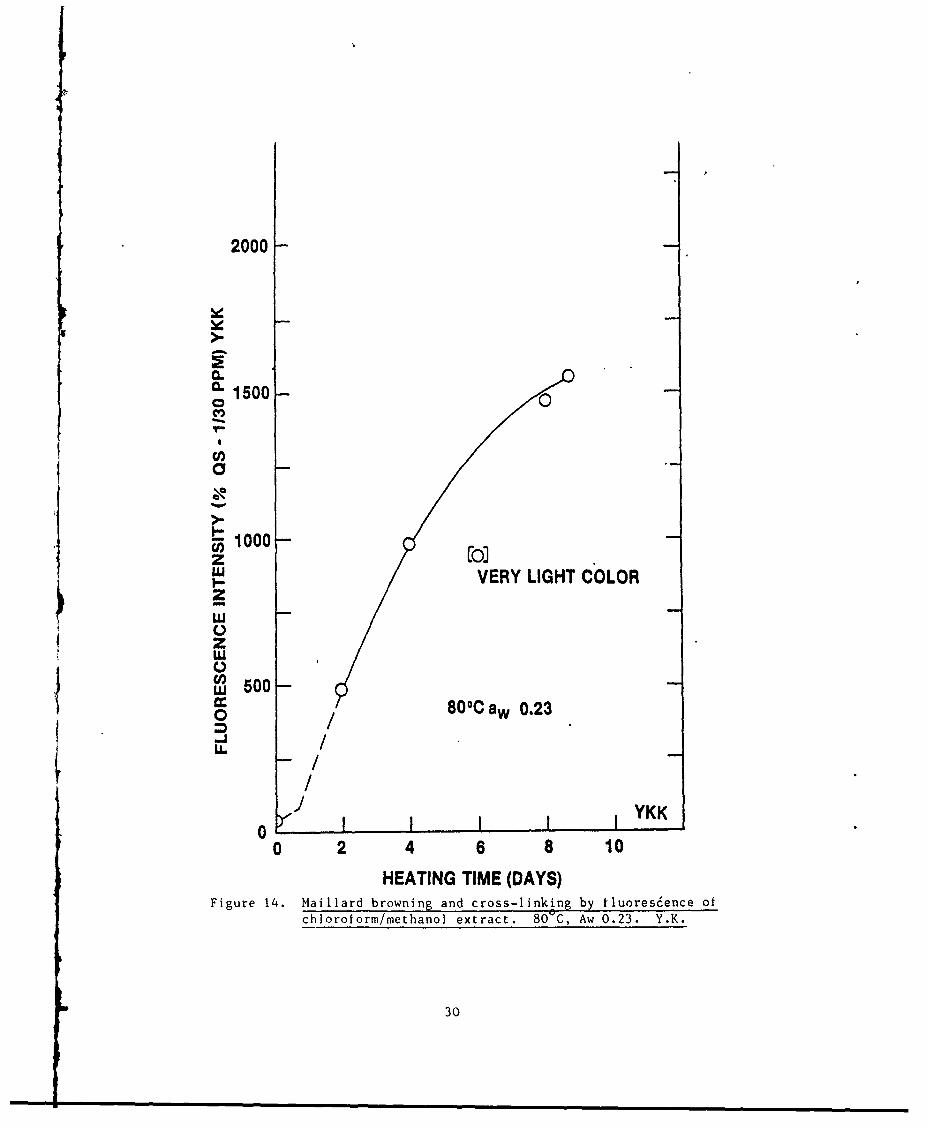
Figure 21. Polfamide luorescence over oxidizing encapsulated 39energy-dense model system. 100°C, Aapproximately 1.0 Fluid. E.B.
vii

List of Tables
Page
Table 1. Encapsulated, energy-dense model ration system. 7
Table 2. Slurry fluorescence of acid-precipitated casein from 12heat-browned fluid nonfat dry milk.
Table 3. Fluorescence of chloroform-methanol extract and 29reflectance color values. Encapsulated, energy-densemodel system stored at 100 C under Maillard versusoxidative conditions.
viii

DEVELOPMENT Or RAPID METHODS TO MONITOR OXIDATIVE AND MAILLARD
(SUGAR-AMtNE) POLYMERIZATION IN ENERGY-DENSE,
ENCAPSULATED MODEL RATION SYSTEMS
INTRODUCTION
The work reported here is methods development to study degradative
mechanisms in encapsulated, energy-dense, military combat ration systems.
The ultimate objective is the prediction and extension of storage life
under extreme climatic and processing conditions.
The approach used was to develop encapsulated, energy-dense model
systems representative of dry, moist and fluid rations and to study their
quality loss due to Maillard (sugar-amine) and oxidative polymerization.
It was important to develop rapid measurement methods that could monitor
the two concurrent processes and could differentiate them, since they are
mutually competitive and interactive.
Quality loss for this work was defined as loss of functionality and
acceptance due to toughness, and loss of solubility and dispersibility.
The work is not concerned with loss of nutritional quality, flavor, odor
or color, although these may or may not be concomitants. The attributes
studied here are largely a function of cross-linking and resultant
polymerization, which it was found, are closely correlated with color and
fluorescence development. The latter two characteristics are the basis of
most methods derived in this report. In particular, fluorescence, when
judiciously applied, can be extremely sensitive and selective, permittinq
differentiation between oxidation and Maillard reactions, and separation
of these from test responses due to nondegraded food components.
In food storage life prediction, it is necessary to determine four
things: 1) the attribute (nutrients, toughness, odor) whose loss or
appearance will end storage lif,, giving an end point; 2) the rate of loss
of that attribute as a function of temperature (and for some applications,
humidity); 3) climatic or 'process distributions of ambient temperature in
time and space, and 4) the induced temperature in the food as a result of
cyclical ambient temperatures. For the purpose of this work,
pol~perization was chosen as the storage life limiter, and the rate of its
increase as a function of changing temperature was the desired kinetic
datum. Although three levels of water activity were used, quality loss as
a function of water activity was not a prime target. Data on extreme
induced temperatures in stored foods and the ambient climatic and
processing temperatures producing these induced levels are available to
this laboratory.1
The ration models developed for this work were energy-dense paradigms
for the so-called "Nutritional Sustainment Modules" currently under design
for use by forward infantry elements under extreme mobility and stress
conditions anticipated in the year 2000. Energy density, whether per unit
mass or volume, implies dried, and, for volume density, cor,.prt=ssed items.
Beyond that for further densification, the substitution of lipid for
portions of protein or carbohydrate is mandatory. Under current
preventive nwkical protocols, a substantial fraction of polyunsaturated
lipid is recommended, which, in turn, means relatively fluid and
oxidizable material. Such lipid often requires encapsulation, to permit
water miscibility and prevent "oiling out". In addition, phospholipid
encapsulation (Fig 1) in conjunction with competent primary antioxidants,
2

LUzL
zjU)Q0 L
% ii Z 0
or. >
4 V
v 4 !Pop- (
3

may reduce oxidative degradation, a primary cause of cross-linking.
Typical naturally occurring encapsulated energy-dense foods are soybeans,
egg yolk, and cream. Mayonnaise and salad dressing typify fabricated
foods using egg phospholipid encapsulants. The latter together with soy
and milk phospholipids share certain important advantages: 1) they are
GRAS, or generally regarded as safe as food components or adjuvants by the
Food and Drug Administration (FDA), 2) they are excellent encapsulants and
emulsifiers, and 3) as stated above, they are strong synergists with
antioxidants. These components have been used exclusively in the work
described in this report and became the basis of two important measurement
methods.
METHODS DEVELOPMENT
For food storage life prediction, there was a need for methods to
detect cross-linking and polymerization due either to sugar-amine
(Maillard)browning or to lipid oxidation (Fig. 2). It was desired that
the methods be rapid and labor-saving, so that real time measurement of
the level of quality loss could be made. It was also desirable that the
methods differentiate the two modes of loss, especially when both are
occurring concurrently.
A. Past Methods
Previous workers have developed general measurement methods for
sugar-amine browning and oxidative degradation. The early work was
targetted largely toward nutritional availability. Many of the standard
methods measure the first stable products formed, i.e., the Amadori
compound, a l-amino-l-deoxy-2-ketose compound, or lipid hydroperoxide.
Both are colorless, relatively bland in taste, odorless and do not involve
4

Cl,
ZO WmW C 2-> 0 Clo
0 =- Z 0
Im 0. C)-
zo 000- C
LL -oz<Lw
0 z..~wl T LoL* Cc w 0
1 0 ccZ 00
0 0 I- 0 L l
0 , m
C114 0n -J) 0 om >- 4cW j
5 O LjL

polymerization. However, both render the ingredients, sugar and amino
acid or lipid, unavailable biologically. Hence, the early work was
nutrition centered. Such methods include the reducing power of the
Amadori compound assayed by acid-ferricyanide,2 the formation of the
artifact furosine from Amadori compounds after hot acid hydrolysis of a
protein as assayed on an amino acid analyzer and the iodometric
determination of peroxide value.4 The thiobarbituric acid test (TBA)
has been considered to measure the dicarbonyl, malondialdehyde, from lipid
oxidation, a secondary product which is a colorless, relatively odorless,
and unstable monomer.5
The above methods are adequate for nutritional purposes and at initial
stages when products are monomeric and often water-soluble. They are,
however, in general, labor intensive and relatively slow. There is also
interference by common food ingredients. In addition, at the stage of
most interest to us, polymerization and cross-linking, those processes
most closely connected to chewiness and lubriciousness, the above
mentioned methods begin to fail because of the insolubility of the very
products that have to be to measured. A search was made, therefore, !or
rapid, reproducible, labor-saving assay methods for sugar-amine browning
and lipid oxidation targetted at polymeric products or products known to
be correlated with polymerization.
The method developed by Kim and Taub6 of colorimerric assay after
enzymatic digestion was modified for fluorescence assay. The
chloroform-methanol extraction method of Bouzas, Kamerei and Karel,'8'9
which was developed for study of fluorescent chromophores resulting from
lipid oxidation in the presence of protein, was modified to study Maillard
reaction fluorescent chromophores.
6
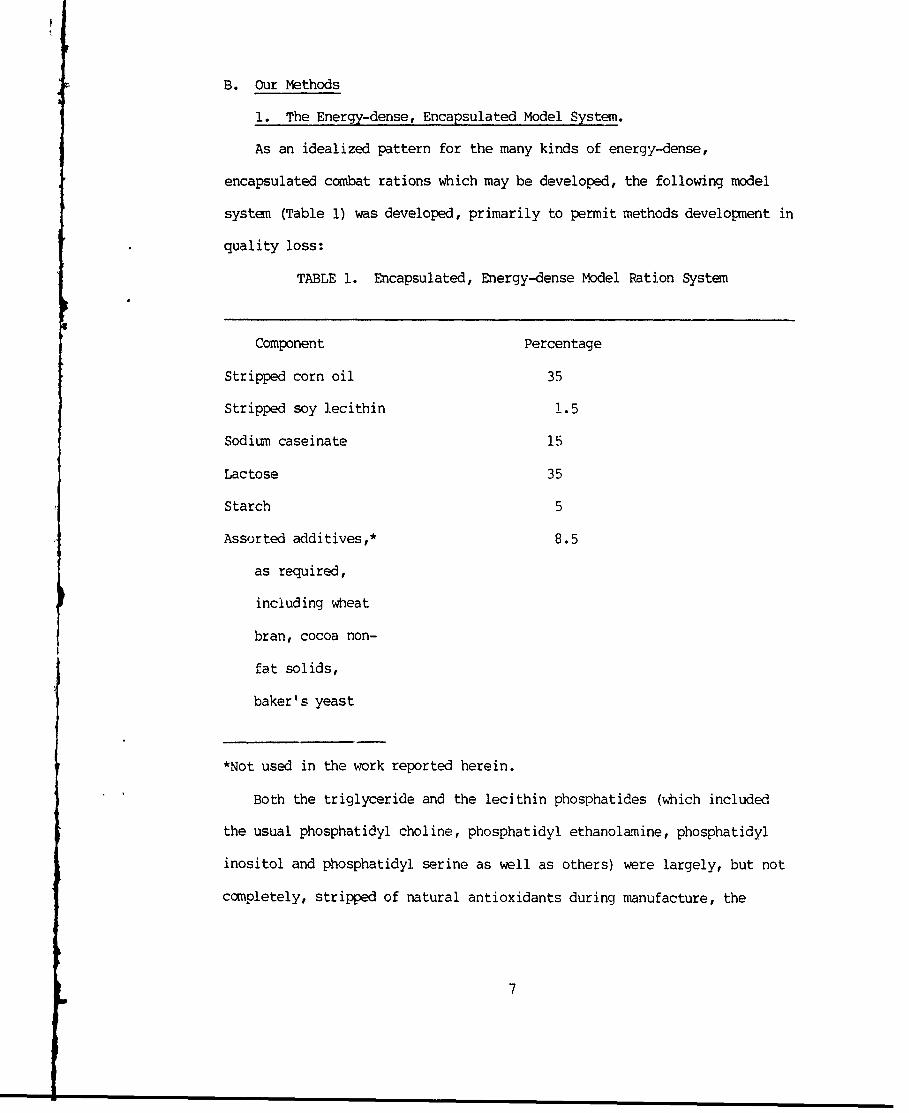
B. Our Methods
1. The Energy-dense, Encapsulated Model System.
As an idealized pattern for the many kinds of energy-dense,
encapsulated combat rations which may be developed, the following model
system (Table 1) was developed, primarily to permit methods development in
quality loss:
TABLE 1. Encapsulated, Energy-dense Model Ration System
Component Percentage
Stripped corn oil 35
Stripped soy lecithin 1.5
Sodiun caseinate 15
Lactose 35
Starch 5
Assorted additives,* 8.5
as required,
including wheat
bran, cocoa non-
fat solids,
baker's yeast
*Not used in the work reported herein.
Both the triglyceride and the lecithin phosphatides (which included
the usual phosphatidyl choline, phosphatidyl ethanolamine, phosphatidyl
inositol and phosphatidyl serine as well as others) were largely, but not
completely, stripped of natural antioxidants during manufacture, the
7

triglycerides by vacuum distillation, the phosphatides by acetone
extraction. As constituted and without additives, the system has 40
weight percent lipid and about 60 percent of calories derived from lipid.
It is purposely nearly depleted of natural antioxidants in order to
compare concurrent browning and oxidation. The usual ration would have
much more delayed oxidation, and if sucrose were substitutedZ for lactose,
much more delayed Maillard browning.
For methods development in Maillard browning, this system was stored
in three moisture modes, aw 0.23, 0.5, 1.0 (fluid) and at controlled
temperatures close to 80, 90 and 1000 C. The storage for lipid oxidation
methods development was done at the three moisture levels and at 100 0C.
Stripped corn oil was procured from Eastman Kodak Co., Rochester,
N.Y. Most but not all, of the tocopherols have been removed by molecular
distillation (10 ppm maximum). Sodium caseinate was Savortone (R)* Low
Flavor, obtained from Express Foods Company, Louisville, KY. Soy lecithin
was Arlec (R )* (acetone-stripped granules, which we have shown to contain
very little natural antioxidant) obtained from Archer Daniels Midland Co.
Lactose was Baker's C. P. Analyzed, J. T. Baker Chemical Co. All were
used as received without further purification. The lactose (49 g) and
starch (7 g) were boiled for one minute in 937 mL deionized water, cooled,
and the casinate (21 g) added and blended with a Waring blender, after
which the lecithin (2.1 g) was blended. Next 49 g stripped corn oil was
added drop by drop, mixing with a magnetic stirrer. The dispersion was
freeze-dried for 24 hours and stored as a white powder in the freezer.
8
2. Sugar-amine Browning.
a. Enzymatic digest--absorption and fluorescence spectrophotometry.{6using a modification of the method of Kim and Taub, 6 100 mg of a
relatively dry s.rnple of the model system which has been heated at a
suitable water activity to accomplish Maillard browning is comminuted in a
mortar and added to 4 mL (0.1M) ammonium bicarbonate solution, pH 7.8,
containing 2 mg Pronase (R)* (Calbiochem, Inc.) contained in a centrifuge
tube. The tube is stoppered and kept in a 37°C water bath (+3°C) for
24 hours. Two mL of chloroform are added, the tube is mixed 1 min on a
Vortex mixer*, and centrifuged for 1 h on a clinical centrifuge. The
aqueous supernatant is used for absorption spectrophotometry at 420 rm
without dilution and is appropriately diluted for fluorescence
spectrophotometry using excitation at 392 nm. If turbidity develops,
samples are filtered through a 0.22 pm Millex-GV* or 0.45 pm Millex-HV*
filter unit (Millipore Corp.) to produce a clear solution.
With suitable dilution to avoid fluorescence quenching, this metho I
gives good sensitivity and signal--to--noise ratio for both fluorescence
and absorption spectrophotometry, the latter being at least 10 times less
sensitive. The method failed when applied to samples heated at lower
water activities (aw 0.23, saturated potassium acetate solution) because
of unfilterable turbidity, the precipitate being fluorescent and colored.
The method is slow and labor-intensive.
Fluorescence is measured on a Baird-Atomic Fluorescence
Spectrophotometer, Model SF-1*. Absorption is measured on a Cary Model
15* Spectrophotometer.
9

Typical settings for the Baird Fluorescence Spectrophotometer are:
Coarse gain 10, fine gain 6, entrance slit fine, exit slit medium,
excitation wavelength 392 nm. All readings are expressed as the ratio
100 x Fluorescence Intensity of Sample/Fluorescence Intensity of Quinine
Sulphate (1 ppm in 0.1 N H2so4 ).
b. Chloroform-methanol extract (C/M). Using a modification of the
method of Bouzas, Kamerei and Karel7'8,9 a measured 100 mg of a
relatively dry sample which has been heated at a suitable water activity
to accomplish Maillard browning is comminuted in an agate mortar and added
to a separatory funnel containing 4 mL of deionized water and
20 mL of a chloroform-methanol solution (2/1, v/v, spectral grade, Burdick
and Jackson, Inc.) the water and organic solvent being left initially in
two layers. The separatory funnel is stoppered and shaken a timed 5
minutes. The contents are decanted into a centrifuge tube without washing
and centrifuged on a clinical centrifuge for a timed 5 minutes. Circa
4 mL of the clear lower layer (92% CHCl3/8% MEOH) are carefully
transferred by a 9" Pasteur disposable pipette into a 5 mL test tube,
stoppered with aluminum !oil. A measured 100 mg of anhydrous sodium
sulfate is added and stirred by careful plunger action of a glass rod. An
initial colloidal opalescence usually clears immediately and the
fluorescence of the solution is measured or, a Baird-Atomic Fluorescence
Spectrophotometer at excitation wavelength of 380 rm. F~nission is in the
450-460 nm range. Compartment slits are at medium and coarse gain is 100,
fine gain 9. This method is about ten times as fast as the enzymatic
method, is reproducible and much less labor intensive, especially when
turbidity is a problem, as mentioned above. It is applicable in all
10

cases, even those for which turbidity renders the enzymatic method
tnsuitable. The only interfering compound of importance in biological
systems is retinol, vitamin A, which can be destroyed by brief irradiation
at 360 n. The method has recently been successfully automated using the
Soxtec System HT*, an accelerated Soxhlet extraction method permitting
analysis of six samples in two hours.
c. Front-face fluorescence of acid-precipitated casein slurry. To
five mL of a suitably browned fluid sample (100 C, 2.5 hours),
containing 2.43 g dry weight, is added 20 mL deionized water. The
dispersion is acidified to pH 4.6 with 1N HCi, with stirring. The
precipitate is centrifuged and washed with 10 mL deionized water three
times. By pressing a 9 mm thick quartz wedge into the 10 mm silica cell
containing 0.5 mL of a 15 percent slurry of the precipitate in water, a
I nn thick slab of slurry is forced up into the void space. The slurry
shows little to no settling and on the Baird-Atomic Fluorescence
Spectrophotometer, using excitation at 360 rrn and front-face viewing at an
inclination of 520C from normal to the cell face, produces reproducible
fluorescence emission at 445 rfn. It was demonstrated that any riboflavin
interference is removed by the water washings of the acid-precipitated
protein. Table 2 gives values of the fluorescence index at selected
heating times for a heat-browned fluid nonfat dry milk. The index is a
normalizing procedure to create an internal reference by dividing
fluorescence intensity at the emission maximun by intensity at the minimu,
between the scattered 360 nm peak and the fluorescence emission peak. In
scattering samples like these, the fluorescence index so derived
b1
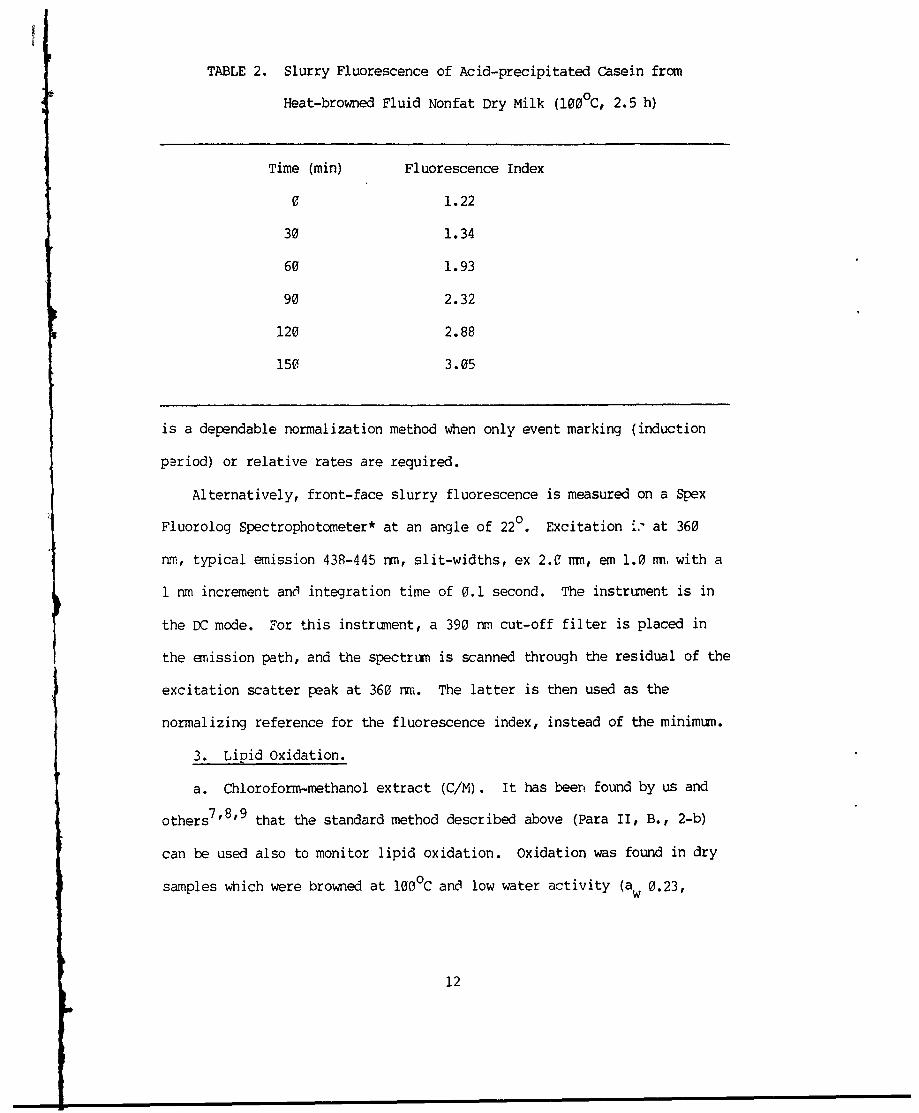
TABLE 2. Slurry Fluorescence of Acid-precipitated Casein from
Heat-browned Fluid Nonfat Dry Milk (1000C, 2.5 h)
Time (min) Fluorescence Index
0 1.22
30 1.34
60 1.93
90 2.32
120 2.88
150, 3.05
is a dependable normalization method when only event marking (induction
period) or relative rates are required.
Alternatively, front-face slurry fluorescence is measured on a Spex
Fluorolog Spectrophotometer* at an angle of 220. Excitation i. at 360
am, typical emission 438-445 rin, slit-widths, ex 2.0 rm, em 1.0 rm. with a
1 nm increment and integration time of 0.1 second. The instrument is in
the DC mode. For this instrument, a 390 nm cut-off filter is placed in
the arission path, and the spectrum is scanned through the residual of the
excitation scatter peak at 360 nm. The latter is then used as the
normalizing reference for the fluorescence index, instead of the minimum.
3. Lipid Oxidation.
a. Chloroform-methanol extract (C/M). It has been found by us and
others7'8'9 that the standard method described above (Para II, B., 2-b)
can be used also to monitor lipid oxidation. Oxidation was found in dry
samples which were browned at 1000C and low water activity (aw 0.23,
12

saturated potassium acetate solution), for periods of 24 hours or longer,
at which time oxidation is known to comence, as is revealed by vapor
phase methods (see below, Para II, B., 3-b). Fluorescence measurements
(Baird-Atomic instrument) on the C/M extract using an excitation
wavelength of 380 rn, as is used for Maillard browning measurements, in
the presence of lipid oxidation begin to show a greatly enhanced
fluorescence to color intensity ratio. This intense emission at low color
levels (highlightness--Hunter L) is highly atypical for Maillard browning
and can be used to measure lipid oxidation, since its magnitude dwarfs the
Maillard contribution. Work is currently underway to differentiate more
sharply the Maillard from the oxidative contribution to the C/M extracts.
b. Front-face fluorescence of acid-precipitated casein slurry. It
was found that, as in the chloroform-methanol method, front-face
fluorescence is a very sensitive method to measure extent of oxidative
polymerization as well as Maillard reaction by means of fluorescence of
the amino-imino-propene product from lipid carbonyl reactions with protein
lysine. Enission can be distinguished from Maillard fluorescence emission
by the high values at high lightness (Hunter L) and by the independent
confirmation provided by oxidative polyamide fluorescence or 232 nm
absorption of a hexane extract.
c. Oxidative polyamide fluorescence (OPF). Porter et al.1 0 showed
that the vapors from oxidizing lipids (whether triglyceride, polar lipid,
or simple esters or acids) when in contact with polyamide powders, produce
characteristic fluorescence, similar to that shown for amino-im:,o-propene
compounds by Chio and Tappel.11 Solid sample methods for measuring this
13
fluorescence and many examples of its use, have been reported by10
Porter.
The method was applied Lo the present energy-dense, encapsulated model
systems in three modes, dry, moist and fluid. In all cases, terephthalate
plates measuring 2 x 3 an and coated with a 250p polyamide layer were
suspended powder face down on aluminum mesh screen over open 5 an petri
dish bottons containing a caretully weighed 300 mg of dry model system
comminuted powder. The petri dish, in turn, was supported on an
overturned 25 mL beaker standing in a half-pint Ball Corp. mason jar
containing approximately 20 mL of either saturated potassium acetate,
(aw 0.23) or saturated sodium bromide (aw 0.5). The screw-top lid of
the Ball Corp. mason jar was carefully lined with aluminum foil, since it
has been found that the rubber seal ring contributes oxidative
fluorescence. The jars were equilibrated overnight in the dark at room
temperature after sealing, and were placed in a 1000C draft oven for
various storage times. Polyamide plates were read on a solid sample
holder in a Baird-Atomic Fluorescence Spectrometer, using excitation
wavelength
360 nm. Coarse gain is 10, fine gain 0, with entrance slit fine, exit
slit medium. Emission begins at 425 r-n and undergoes a steady red shift
as oxidation proceeds, which is a characteristic of oxidative but not
Maillard fluorescence. A jar containing all elements except the model
system is heated as a blank control and no increase in emission over that
of blank occurs during Maillard browning alone.
4. Reflectance Colorimetry.
Color values, expressed as Hunter L, a, b, were measured and computed
on a Hunter lab D54P-5 Reflectance Spectrophotometer*. The instrument was
14

suitably standardized with a light trap, white standard and gray standard,
with specular component included.
RESULTS AND DISCUSSION
The detailed use of the methods developed here awaits longer and more
extensive kinetic studies of quality loss. However, the results obtained
while developing the methods are reported below.
A. Sugar-Amine Browning
1. Enz-rmatic Digest--hbsorption and Fluorescence Spectrophotonetry.
Figures 3, 4, and 5 show the progress of Maillard browning during storage
of the model system at 89CC and water activity 0.5 (saturated sodium
bromide). Compared with 420 nm absorption, fluorescence shows a higher
ratio of browned Pcitple value to control value, is more sensitive and
gives an earlier indication of the onset of l ymerization. Previous work
with gel filtration showed that both fluorescence and 420 mi absorption
correlate with each other and with the appearance of high molecular weight
matprial, travelling near the void volumne in certain gels. The
reproducibility of the enzymatic method can be assessed by comparing
Figures 3 and 4, which depict two separate browning experiments by the
same worker. Figure 5 shows browning measurements under the same
conditions by another worker, the double sets of points reptesenting
repeats of the enzymatic digest and measurements.
Figures 6 and 7 show res lts using the same method, but for browning
conducted at 100aC and aw 0.5, by two different workers. Conspicuous
at the higher temperature is the greater lacj until onset of rapid phase
15

18.0
o ABSORBANCE.
o FLUORESCENCE -S'1QS 16.0
0.7 14.0
0.6 12.0
,0.5 0 10.0
zC)a Z
0.4 - 8.0La0 wz 0
0m 6.0 3.U'5.0 .
lx0.3 -
HETNGTME(OUS
0.2 -- 4.0
0.1 8900 2.0a~ 0.5
I ES00 1.5 3.0 4.5 6.0 7.5
HEATING TIME (H1OURS)Figure 3. Maillard browning and cr,)ss-linking measured by aqueous
fluorescence and 420 N ,-absorbance. 89-C, Aw 0.5. E.B.
16

-18.0
oABSORBANCE -16.0o FLUORESCENCE S II a
0.7 0 14.0
0.6 -- 12.0
z 000.5 -10.0=
Ui z0. 8.0 Ul
0 00 - 6.0ca 0.3 -JLL
0.2 - 4.0
0.1 - w0 -2.0
0 3.0 EB
0 1.5 . 4.5 6.0 7.5
HEATING TIME (HOURS)Figure 4. Maillard browning and cross-linking measured by aqueous
fluorescence and 420 Nm absorbance. 89-C, Aw 0.5 E.B.
Repeat
17

18.0
0, 0ABSORBANCE 1.
07-C,0 FLUORESCENCE I'S11oas 14.0
0.6 -12.0
0 ~C.
N zU w0
LIQ 0.4 -8.0z L
0m 0
)0.3 -6.0 I-
0.2 -4.0
0 890C
0.1 awO0.5 2.0
1YK
0 1.5 3.0 4.5 6.0 7.5
HEATING TIME (HOURS)Figure 5. Maiflard browning and cross-linking measure4 by aqueous
fluorescence and 420 Nm absorbance. 89-C, Aw 0.5. Y.K.
18
18.0
O FLUORESCENCE ISQS16.0
0.7 - 14.0
0.6 12.0
0 .08.-U,
z 0.5 10.0o z
0.4 8.0 Wz 0
0M
0 0.3 6.0
0.2 -4.0
1 000c
0.1 aw03 - 2.0
0 II !!1 EB
0 0.5 1.0 1.5 2.0 2.5
HEATING TIME (HOURS)Figure b. Maillard browning and cross-linking measured by aqueous
fluorescence and 420 Nm absorbance. 100"C, Aw 0.5. E.B.
19

0 .- 18.0.
0,5 ASORBANCE / 18.00 FLUORESCENCE Is/16s
0.7 - 14.0
0
0.6 - 12.0
S0.5 10.0UrC.)w
0.4- 8.0 0
o 06.0
< 0.3 - LL
0.2 - 102C 4.0aw 0.5
0.1 - 2.0
o ! .. .. !I I!I Y K
0 0.5 1.0 1.5 2.0 2.5
HEATING TIME (HOURS)Figure 7. Maillard browning and cross-linking measured by aqueous
fluorescence and 420 Nm absorbance. 102"C, Aw 0.5. Y.K.
20

browning, whether assayed by fluorescence or color, found by both
workers.** Again, fluorescence is an earlier and more sensitive
indicator.
2. Chloroform/Methanol Extract.
Figures 8, 9, and 10 show C/M measurements of the same browned samples
which had been assayed enzymatically above, which were stored at 890 Cand a 0.5. Results from. the two samples heated by the same worker
w
agree well with those of the second worker and show roughly typical
Maillard kinetics (first order asymptotic) with little initial lag. The
ratio of browned sample value to control value is much less than for the
enzymatic digest fluorescence, but is very reproducible.
Results for the C/M extract method on the sample browned at 100 C
and aw 0.5 (Figure 11) show the same lag as those from the enzymatic
digest method (Figure 6). The C/M method also duplicates the high anomaly
of the 1.5 hour sample, giving evidence that this is a browning anomaly
and not a measurement error.
**A careful check of internal temperatures in the reaction vessels
indicates a 30-40 min lag in reaching 1000C, from initial room
temperature. Subsequent readings are not affected by this lag, since jars
and contents are hot.
21

200
CLCLo 150
Co,0
891C aw 0.5
100
olo
LUI..
LU
zLUC.,
CC500
LL
0 _EB
0 1.5 3.0 4.5 6.0 7.5
HEATING TIME (HOURS)Figure 8. Maillard browning and cross-linking by fluorescence oi
chloroform/methanol extract. 89-C, Aw 0.5. E.B.
22
ii200
0.
S150-
C
V89°C aw 0.5
100z-z
LU
.,I
zLU
0
U.
0
EB
0 1.5 3.0 4.5 6.0 7.5
HEATING TIME (HOURS)Figure 9. Maillard browning and cross-linking by fluorescence of
chloroform/methanol extract. 89-C, Aw 0.5. E.B. Repeat
23

200
CL0
C~ 150
CO,
Z 100 890C aw 0.5I-z
zCl)LU
cc500-.
YKK
0 1.5 3.0 4.5 6.0 7.5
HEATING TIME (HOURS)Figure 10. Maillard browning and cross-linking by fluorescence of
chloroform/methanol extract. 89 0 C, Aw 0.5. Y.K.-
24

200
a. 01ISO
100 100CIC a8w 0.5
LU
0zLUC.)
0
0
IL
00 1.5 3.0 4.5 6.0 EB5
HEATING TIME (HOURS)Figure 11. Maillard browning and cross-linking by fluorescence of
chloroform/methanol extract . 100 C, Aw 0.5. E.B.
25
When the C/M method was employed on samples browned at aw 0.23
(saturated potassium acetate), it proved far superior to the enzymatic
method, which failed because of intractable turbidity in the final
solutions. Figures 12 and 13 show results of C/M analysis of two sets of
the drier samples browned at 1020C by the same worker. Figure 12 shows
a slightly greater initial lag, out the values for the first four storage
times are quite reproducible and show normal Maillard kinetics comparable
to results with the moist samples. However, the fifth sample for each
shows anomalously intense fluorescence at relatively high lightness (high
Hunter L) of the powder, particularly in Figure 13, where the fifth sample
was stored 24 hours. The product of fluorescence intensity and Hunter
lightness (C/M x L in Table 3) of the latter is anomalously high, and it
is accompanied by a wavelength shift. These data, coupled with
observations made by the polyamide fluorescence method, which in vapor
phase is specific for oxidation, suggest that the intense fluorescence at
high lightness in the C/M extract is due to amino-imino-propene
phospholipid products, possibly stemming from malonaldehyde, but
correlated much more with oxidation than with Maillard reactions.7'8'9
26

300
250
C.
C
a
C,,
200
z 1 020C aw 0.23150
zLU
LU
0
- 100
50 I I I !YKK
0 2.5 5.0 7.5 10.0 12.5
HEATING TIME (HOURS)Figure 12. Maillard browning and cross-linking by fluorescence of
chloroform/methanol extract. 102-C, Aw 0.23. Y.K.
27
-j

TRUE VALUE[]
250
CL aW > 0.23S200[o
0
U) 1 0211C aw 0.23z 150zwzw
LU=100
0
0 2.5 5.0 7.5 10.0 12.5
HEATING TIME (HOURS)Figure 13. Maillard browning and cross-linking by fluorecneo
chloroform/methanol extract. 102"C, Aw 0.23. Y.K. Repeat
28

TABLE 3. Fluorescence of Chlorofor-Methanol Extract and ReflectanceColor Values. Encapsulated Energy-Dense Model SyustentStored at 100 C Under Maillard Versus OxidativeConditions.
SAMPLE CONDITIONS TIME HUNTER1 C/M1 C/M(L)(H) L a b FLUORESCENCE 100
Heavily No CoCl 2,NaBr 12 46.2 10.4 15.9 630 291Browned TBHQ 1% + + + +
f.21 0.03 1710 -0
Heavily CoCl , Drierite 30 69.8 5.7 24.6 978 683Oxidized No THQ + + + +
1.53 0.30 0:25 186
'Values are neans + nean deviation (N=2)
Figure 14 shows results front browning of a dry sample (aw 0.23) for
periods of up to 10 days at 800C. The intense fluorescence is probably
largely oxidative in origin and will be discussed below. Figure 15
records increase in fluorescence of a fluid sample browned at 100 0C.
The typical lag at 100 0C and the relatively low level, even after 12
hours, indicates probably little oxidative contribution to the
fluorescence.
3. Front-face Fluorescence ot Acid-precipitated Casein Slurry.
Figure 16 shows the develop, ent of Maillard front-face fluorescence in
acid-precipitated casein front a 1/1 dispersion of nonfat dry milk in water
at 1000C. The sinilarity to Figure 15 is striking.
B. Lipid Oxidation
1. Chloroforr/Methanol Extract.
As we indicated in paragraph A. 2. above, if heating is prolonged,
particularly under dry conditions where Maillard browning is much reduced,
29
2000
a. 1500 -0
1000:o
VERY LIGHT COLOR
, zzww 500-c/ 80C aw 0.23
00 !YKK0 2 4 6 8 10
HEATING TIME (DAYS)Figure 14. Maillard browning and cross-linking by fluores6ence of
chloroform/methanol extract. 80-C, Aw 0.23. Y.K.
30

Lu~I-.
U 0
0-..
U)a
LU
-r.J1
LL
250
200
150
100I100CC aw' 1 (FLUID)
0 2 4 6 8 10 12 14 16TIME (HOURS)
Figure 15. Maillard browning and cross-linking by fluorescence of
chloroform/methanol extract. 100-C, Aw approximately
1.0 Fluid. L.H.
31

LU 0) 010 z uoz
LU - U)(0- W L.
u -LLC.) U-)
0 m0W
Z W 0 o'-"M
o CC 0 o
w 0 2 z ua>!I I;cC:(_j Q)
a 0. 00 0 2
~0)'
4-m'0
a0 X~
0' w-
on
X30NI 3N33suoflU
32

an intense fluorescence supervenes at high lightness (L) as illustrated in
Table 3. This is not paralleled by increase in brown color of the
powder. The model systen powders become rancid in odor and the vapor
phase polyamide fluorescence test indicates the onset of oxidation.
Figure 14 shows the increase in C/M fluorescence resulting from browning
of a dry (aw 0.23) sample at 80°C for periods of up to ten days. In
the very early stages (less than one day) Maillard browning predominates,
but the figure shows the onset of the intense, presumably oxidative,
fluorescence, reaching very high levels at high lightness in 10 days of
storage.7,8,9 Work in this laboratory is underway to differentiate the
oxidative frot the Maillard fluorescence by excitation and emission
wavelengths, synchronous scanning and 3-D depiction of "fingerprints" of
wavelength families, since the spectra are complex.
2. Oxidative Polyamide Fluorescence (OPF).
Using the vapor phase detection of oxidation by means of polyamide
fluorescence and plotting fluorescence index as defined above, the curves
of Figure 16 were obtained for the freeze-dried model system alone and
with cobaltous chloride added as pro-oxidant, both at 1000C and room
temperature. The effect of the cobalt accelerator is clear, as is the
accelerating effect of temperature. The room temperature sample, with
cobalt, began moderate oxidation at about one day. Under these very dry
conditions, the highest levels of fluorescence index are achieved. If one
heats the sample at the samte temaperature, but at aw 0.23 over saturated
potassim, acetate (Figure 17) the rate is sonewhat reduced, but again,
high levels of OPF adducts are produced. When, however, as in Figure 18,
water activity is at the moist level of 0.5 (sodim, bromride), the maximnum
33

3.2 -0
3.0
2.8
UJ2.6 -
w 2.4 C 0OCoz
S2.2 £RT Co++
0 0 1001C PLATE ONLY-jLL
1.8
1. 60
1 .4 ..........
1.2 1O' wZ DY
1.010 2 4 6 23 28 37 95 118
TIME (HOURS)Figure 17. Polyamide fluorescence over oxidizing encapsulated energy-
dense model system. 100 0G, Aw approximately 0.0. L.H.
34

level of oxidized products is much reduced, although the time of
initiation of fluorescence is little delayed. The data of Figures 17 and
18 were obtained without pre-equilibration of the samples against the
specified water activity. When 24 hour pre-equilibration was done in a
concurrent experiment with both levels of water activity (Figure 19)
essentially the same curves were obtained. Figure 20 shows results with a
fluid system, both with and without antioxidant. The oxidation rate is
the lowest found and the maximum intensity of fluorescence is also low.
The reproducibility of the method is shown by the two samples containing
antioxidant, and the effect of antioxidant is clear, although propyl
gallate is not the most suitable antioxidant for this application
(Figure 21).
3. Front-face Fluorescence of Acid-precipitated Casein Slurry.
Results using this method to detect oxidation where Maillard browning
is suppressed have shown it to be very sensitive. As in the
chloroformr-rethanol extract, high fluorescence intensity at high color
lightness is diagnostic of oxidation.
CONCLUS IONS
The purpose of this work was to develop methods suitable for rapid,
reproducible assessment of polymerization due either to sugar-arine
browning or lipid oxidation in energy-dense, encapsulated model ration
systems, so that shelf life pred.ction and preventive measures could be
developed. It is concluded that both fluorescence and near ultraviolet
absorption due to compounds formed between primary amine groups and
products of the degradation processes are available for the purpose.
35

3.2 O 100*C KOAc
A RT KOAc3.0 -0
2.8 -0
x 2.6-
K 2.4
2.2U0
~2.0 00
LL. 1.8
1.6 100'C aw 0.23
1.4
1.2
1.0 , LH
0 2 4 6 70 72 74 76 78
TIME (HOURS)Figure 18. Polyamide fluorescence over oxidizing encapsulated
energy-dense model system. 1O00C, Aw 0.23. L.H.
36

3.2 0 1000C NaBr
3.0 ZS RT NaBr
2.8
LU 2.6
0
w2.Co 2.2-
o 2.0
-L 1.8 -0
1.6
1.4 -100*C aw 0.5
1.2F-
1.0 I I I0 2 4 6 8 10 21 23 25
TIME (HOURS)Figure 19. Polyamide fluorescence over oxidi zing enapsulated
energy-dense model system. 100-C, Aw 0.5. L.H.
37

o RT NaBr3.2 -A I ooCc NaBr
3.0 - RT KOAc* 1 00C KOAc
2.8
x 2.6
w
_ 2.4
0
U. 1.8-
1.6.-
I100°C aw 0.23 or 0.51.4
1.2
0 2 4 6 8 10 12 14 16
TIME (HOURS)Figure 20. Polyamide fluorescence over oxidizing encapsulated energy-dense model system. 00-C, Aw 0.23 and 0.5. L.H.
38
1.4 mi
3.I OY ALT
3.2 03 PROPYL GALLATE 0 %
A RT2.8
X2.6LU
~2.4LU0 100COC aw =1wZ 2.2 (FLUID)C)
S2.00
ui. 1.8
1.6
1.4
1.2
1.01E j
TIME (HOURS)
Figure 21. Polyamide fluorescence over oxidizing encapsulated energy-
dense model system. 100-C, Aw approximately 1.0 Fluid. E.B.
39

The amine groups may arise from proteins, amino acids or amine-con-
taining phospholipids and the complexing carbonyl groups from reducing
sugars or aldehydes resulting as secondary products from oxidation, like
malondialdehyde, enals or dienals.
For sugar-amine (Maillard) browning, enzymatic digest methods give
high signal-to-noise results, but are time- and labor- consuming. Cold
acid-precipitated casein slurries give a rapid, but less intense and
slightly less reproducible signal. Automated methods based on
chloroform-methanol extracts of polymerized, fluorescing phospholipids and
front-face fluorescence of slurries of the residual protein are the most
prL ising for rapid, reproducible results, and are reconended for use in
most food systems, since interfering compounds are usually few and can be
removed simply, unlike aqueous system contaminants.
For lipid oxidation, a vapor phase method using polyamide fluorescence
due to compounds arising from gas phase products of oxidizing lipids hac
been found most satisfactory, since the method cleanly separates oxidation
from possible concurrent Maillard browning. A back-up method was found in
the chloroform-methanol extract of phospholipids, which, at the onset of
lipid oxidation, produces an enhanced fluorescence-to-color intensity
ratio which differs sharply from the low fluorescence-to-color ratio
characteristic of Maillard browning. Front-face fluorescence of slurries
of the residual protein after extraction is also a sensitive detector of
oxidative cross-linking, characterized by high fluorescence at high
lightness (Hunter L).
40

IREFERENCES
1. Quartermaster Research & Engineering Center, "Southwest Asia:
Environment and Its Relationship to Military Activities", Technical
Report EP-118, Environmental Protection Research Division, July 1959,
Natick, MA.
2. L. K. Crowe, R. Jenness, and S. T. Coulter, J. Dairy Sci. 31, 595
(1948).
3. P. A. Finot, R. Deutsch, and E. Bujard, The Extent of the Maillard
Reaction in the Processing of Milk, in Maillard Reactions in Food, Ed.
C. Eriksson, Progress in Food and Nutrition Science, Vol. 5, 1981,
p. 345.
4. D. H. Wheeler, Oil and Soap 9, 89 (1932).
5. R. 0. Sinnhuber and T. C. Yu, Food Tech. 12, 9 (1958).
6. Kim, H.-J. and I. A. Taub, J. Food Sci. 49, 699 (1984).
7. Kamerei, A. R. and M. Karel, J. Food Sci. 49, 1517 (1984).
8. Bouzas, J., A. R. Kamerei and M. Karel, J. Food Processing and
Preservation 9, 11 (1985).
9. Bouzas, J., A. R. Kamerei and M. Karel, J. Food Sci. 50, 1515 (1985).
10. W. L. Porter, E. D. Black, A. M. Drolet, and J. G. Kapsalis,
Analytical Use of Fluorescence-Producing Reactions of Lipid- and
Carbohydrate-Derived Carbonyl Groups with Amine End Groups of
Polyamide Powder. In, The Maillard Reaction in Foods and Nutrition,
Eds. G. R. Waller and V. S. Feather, ACS Symposium Series No. 215,
American Chemical Society, Washington, D.C., 1983, p. 47.
11. K. S. Chio and A. L. Tappel, Biochem. 8, 2821 (1969).
41