development workshop 21.10.2010 emiko nishi and aleksandra olszewska
TRANSCRIPT

Development Workshop21.10.2010
Emiko Nishi and Aleksandra Olszewska
OutlineGeneral Overview: Why is it hard to assess the inequality-
growth relationship?Evolution of Empirical Studies on Inequality - From 1950’s to presentWhere do the contradictory results come from? Methods.So what exactly are the results? Interpretation of the results: the complex effects of
inequality - Short- & Medium vs. Long-run effectsConcluding Remarks
Overview
Inequality seems to influence growth >> yet, mainly for the following reasons, assessing
the impact of inequality on growth has been challenging:
the lack of sufficient data available (e.g. inequality)
(i.e. Inequality computed by gross income vs. expenditures Income concept applies to individual vs. household )
omitted variables and endogeneity problems
Evolution of Empirical Studies on Inequality
1950’s and 1960’s >> Nicholas Kaldor and Simon Kuztnet showed that there is a trade-off relationship between reducing inequality and promoting economic growth.
In the post world war period >> Countries in Latin America were growing at a fraction of the avg. East Asian rate.
What is the true relationship between inequality and growth?
Evolution of Empirical Studies on Inequality
During the 1990’s >> many empirical studies suggested the negative- and statistically significant impact of inequality on growth.
(e.g. Barro & Sala-i-Martin, 1995; Alesina & Perotti, 1994; Alesina & Rodrik, 1994; Persson & Tabellini, 1994).
The late 1990’s >> some started questioning the robustness of these results by pointing out that the negative relationship is mainly driven by exogenous factors ( i.e. level of development, income, and political institutions)
Evolution of Empirical Studies on Inequality
Forbes (2000) used more sophisticated/complex econometric methodology to overcome the risk of biased estimators resulting from:
- country-specific characters - global shocks which may influence growth
Used more comprehensive dataset for inequality developed by Deininger and Squire (1996).
>> a positive & statistically significant relationship is suggested for the short- and medium-run.
Evolution of Empirical Studies on Inequality
Is inequality really bad/good for growth?Where does the pattern of existing results come from?
“The negative effect of inequality on growth shows up for poor countries, but the relationship for rich countries is positive” (Barro, 1999)
>> the pattern of existing results may be driven by idiosyncratic differences
Evolution of Empirical Studies on Inequality
Research Question Today:
Are the differences in empirical results driven by countries included, time period used, or independent/control variables used in each model? Or are they simply driven by the choice of methods?
Halter, Oechslin and Zweimüller (2010)It’s not that any of the views was wrong but
the results depended on the methods used.
Two main methodologies:Estimations based on time-series variation
only Estimations based also on cross-sectional
variation
Time-series variationRegresses changes in the log output against
changes in the lagged inequality (e.g. first-differences GMM estimator)
Similar to the fixed effects estimator in that it uses only within-country variation
Solves the problem of unobserved heterogeneity
Criticised for ignoring cross-sectional variation
Time-series and cross-sectional variationRegresses the log output (level) against a lagged
Gini coefficient. (e.g. system GMM estimator)
Exploits cross-country variation >> more efficient
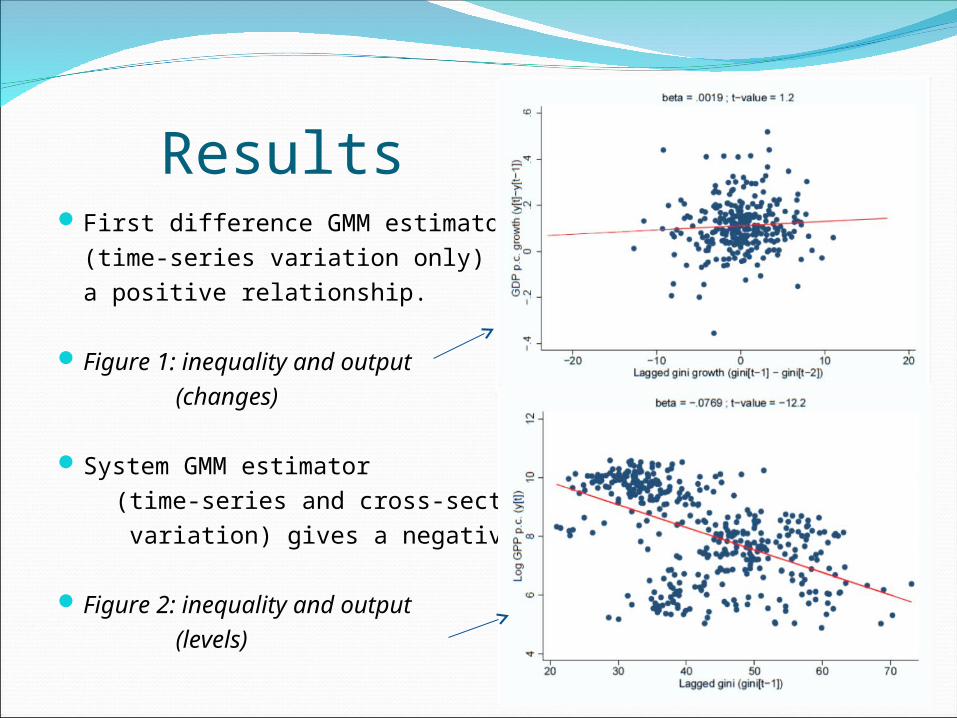
ResultsFirst difference GMM estimator
(time-series variation only) gives a positive relationship.
Figure 1: inequality and output (changes)
System GMM estimator (time-series and cross-sectional variation) gives a negative relation.
Figure 2: inequality and output (levels)
Results - cont.Apply the two estimation methods to a similar dataset
to the one used by Forbes (2000) to check if the results systemaically differ.
First-differences GMM estimator:
Like Forbes, they find a significant, positive relationship of a similar magnitude (coefficient of inequality = 0.0015 against Forbes’s 0.0013)
Robustness check: more countries, more time periods, divide countries by income and change the structure from 5-yr to 10-yr periods >> still get a positive, significant relationship
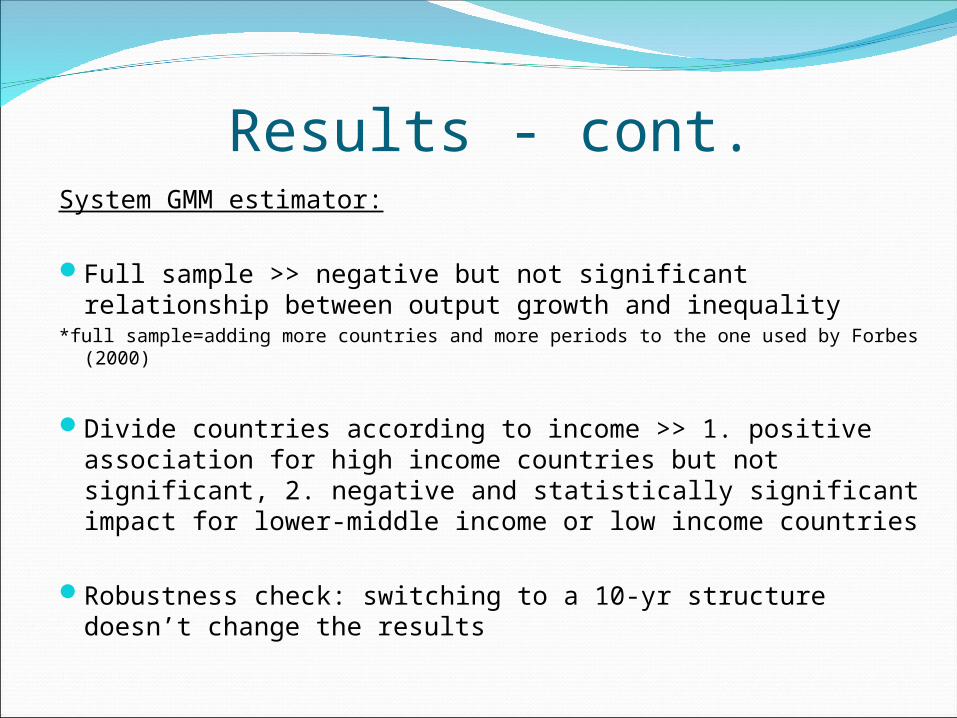
Results - cont.System GMM estimator:
Full sample >> negative but not significant relationship between output growth and inequality
*full sample=adding more countries and more periods to the one used by Forbes (2000)
Divide countries according to income >> 1. positive association for high income countries but not significant, 2. negative and statistically significant impact for lower-middle income or low income countries
Robustness check: switching to a 10-yr structure doesn’t change the results
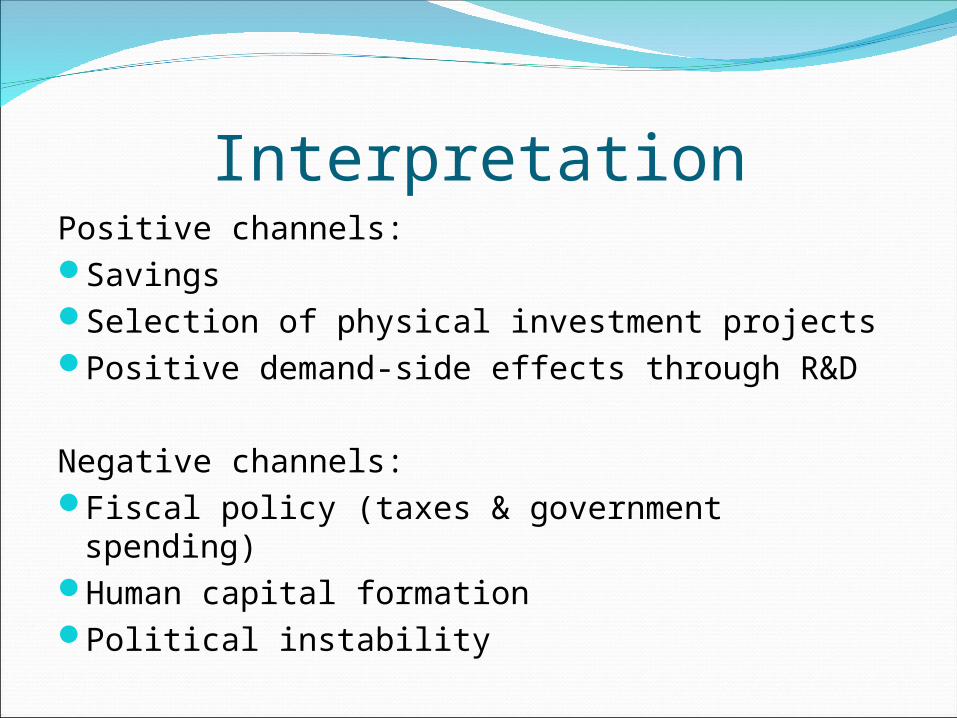
InterpretationPositive channels:SavingsSelection of physical investment projectsPositive demand-side effects through R&D
Negative channels:Fiscal policy (taxes & government spending)Human capital formationPolitical instability
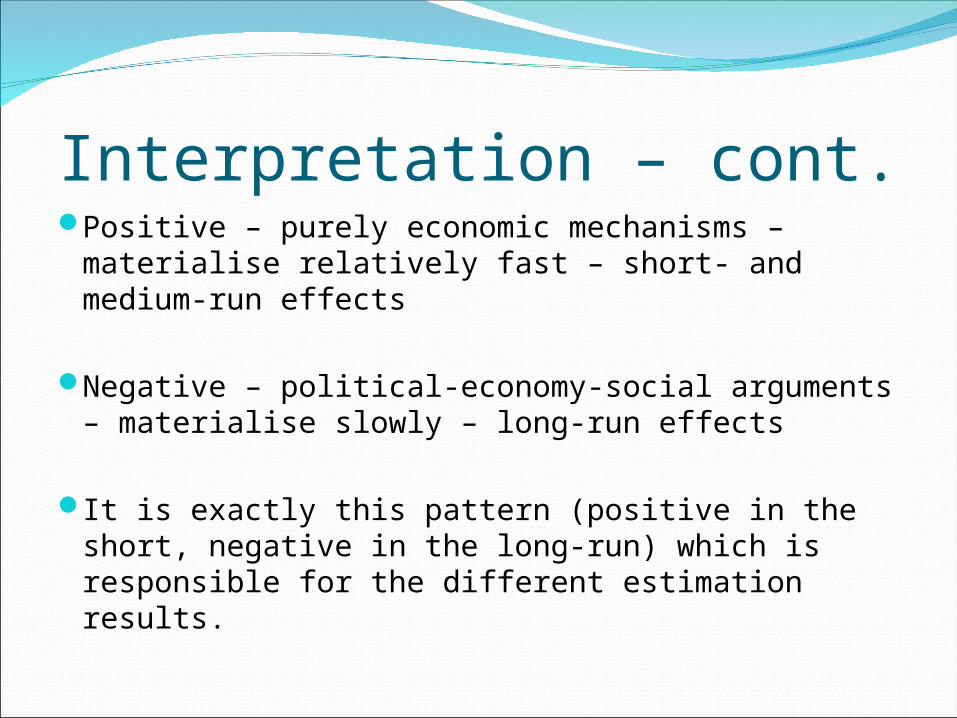
Interpretation – cont.Positive – purely economic mechanisms –
materialise relatively fast – short- and medium-run effects
Negative – political-economy-social arguments – materialise slowly – long-run effects
It is exactly this pattern (positive in the short, negative in the long-run) which is responsible for the different estimation results.
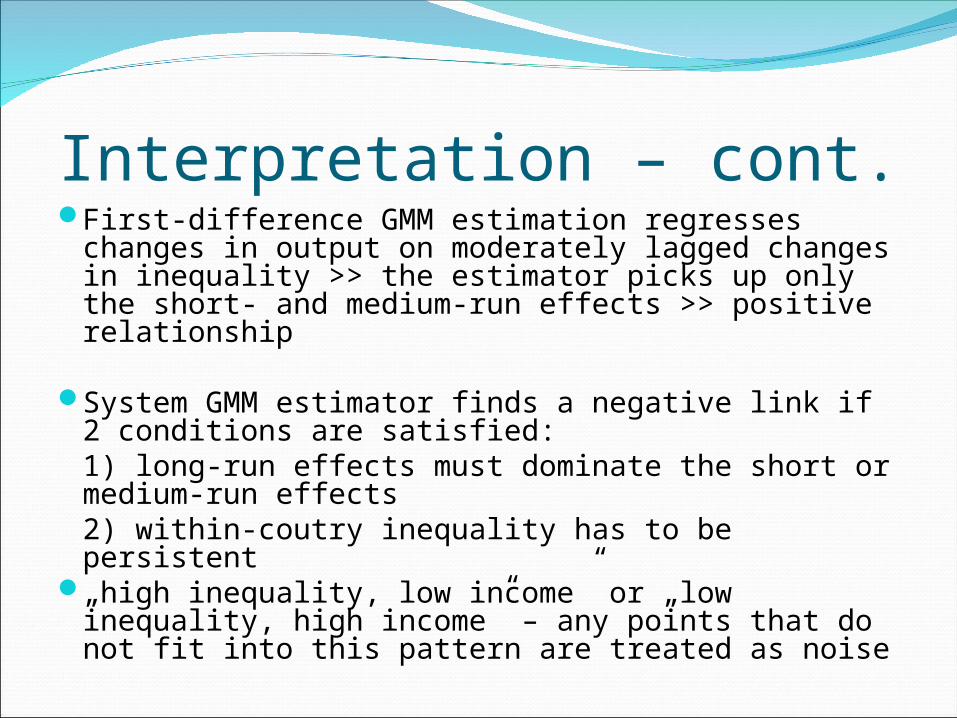
Interpretation – cont.First-difference GMM estimation regresses
changes in output on moderately lagged changes in inequality >> the estimator picks up only the short- and medium-run effects >> positive relationship
System GMM estimator finds a negative link if 2 conditions are satisfied:1) long-run effects must dominate the short or medium-run effects2) within-coutry inequality has to be persistent
„high inequality, low income” or „low inequality, high income” – any points that do not fit into this pattern are treated as noise
Additional argumentsHigh inequality >> the poor prefer direct
transfers over investment in the public good - higher ineqality generates a short-run increase and a long-run decrease in output
The poor are usually less productive than the rich (less educated, unable to use advanced technology) >> lower output & higher, persistent inequality
ConclusionsHow can the two, contradictory results of
decades of scientific research be reconciled? Some are short-run while others are long-run
So, is inequality good or bad? Rational economists answer: look at long-run >> inequality is bad
Thank you